Inhibition of the sodium-dependent HCO3- transporter SLC4A4, produces a cystic fibrosis-like airway disease phenotype
- Biosciences Institute, The Medical School, Newcastle University, United Kingdom
- Centro de Estudios Científicos, Chile
- Universidad Austral de Chile, Chile
- Universidad San Sebastián, Chile
- Subdepartamento de Anatomía Patológica, Hospital Base de Valdivia, Chile
Figures
Figure 1 with 1 supplement
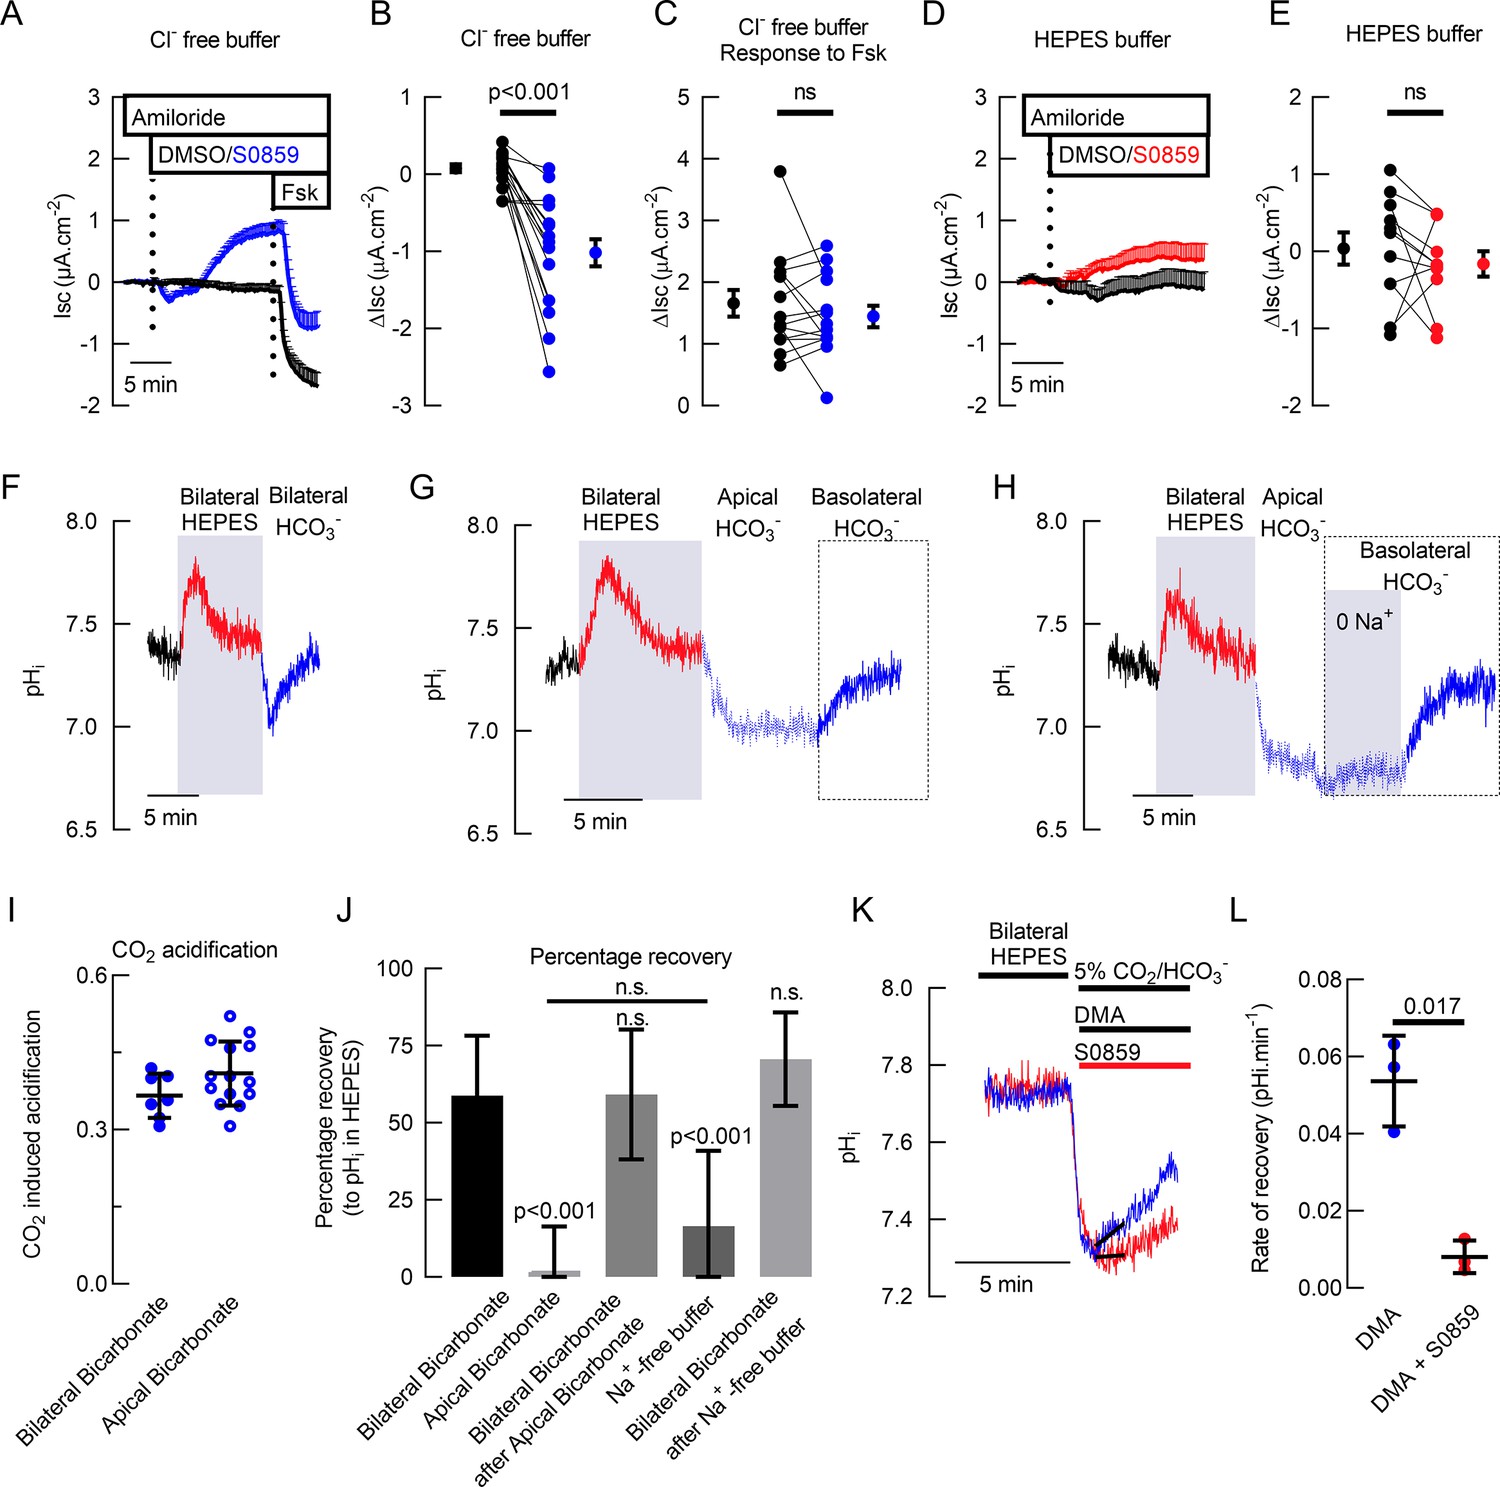
Basal bicarbonate secretion requires SLC4A4 activity in primary hAECs.
Mean traces (+ standard error of the mean) of Isc in (A) Cl- free solution (n=14) and (D) HCO3- free solution (n=10) of primary hAECs cultures (dotted lines represent the time of addition of drugs). Summary of S0859-induced changes in Isc in the presence (B) or absence (E) of HCO3- in primary hAECs cultures and Fsk-induced HCO3- secretion (C) in Cl- free buffer (on panels B, C,, and E, each dot represents an independent experiment; means ± sem are shown next to the individual data; respectively n=17, n=14, and n=11 independent experiments using cells from N=3 donors; two-tailed, paired t-test). (F) Representative pHi trace of primary hAECs bathed first in bilateral HCO3- KRB (gassed with 5% CO2) then bilateral Hepes buffered KRB (no HCO3-, no CO2) and then bilateral HCO3- KRB (gassed with 5% CO2). CO2 removal and re-introduction is marked by a transient increase and decrease in pHi respectively. (G) Representative trace of pHi recovery after CO2-induced acidification in the absence of basolateral HCO3-. (H) Representative trace of pHi recovery after CO2-induced acidification in the absence of basolateral Na+ and HCO3-. (I) Summary of the magnitude of CO2-induced acidification (bilateral bicarbonate, n=7, apical bicarbonate n=14, unpaired t-test, bars represent mean ± standard deviation (S.D.)). (J) Mean percentage of pHi recovery after perfusion of the different solutions (Bilateral Bicarbonate, n=7; Apical Bicarbonate, n=14; Bilateral Bicarbonate after Apical Bicarbonate-, n=5; Na+-free buffer, n=8; Bilateral Bicarbonate after Na+-free buffer, n=8; One-way ANOVA with Holm-Sidak correction for multiple comparison tests, bar graph represents mean ± S.D.). (K) Representative trace of intracellular pH measurements showing recovery from CO2-induced acidification in the presence (red line) or absence (blue line) of NBC inhibitor S0859. (L) Summary of rates of recovery from CO2-induced acidification in the presence of NHE inhibitor (Dimethyl Amiloride, DMA, 100 μM) and in the presence (red bar) or absence (blue bar) of S0859 (30 μM), (n=3, paired t-test; bars represent mean ± S.D.).
Figure 1—figure supplement 1
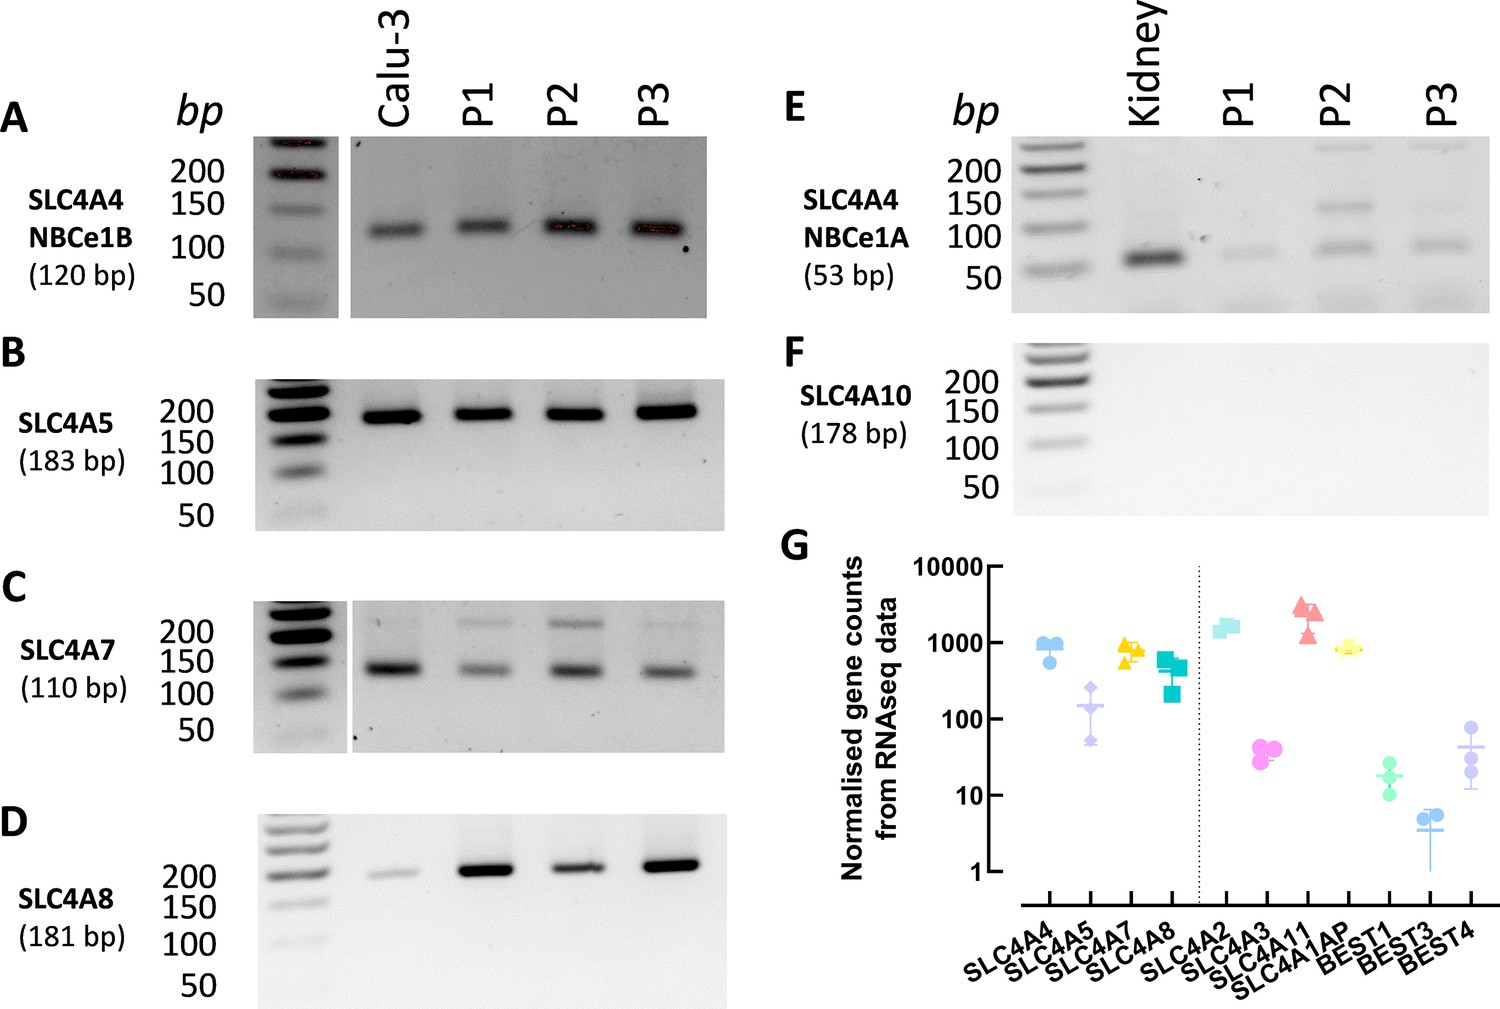
Expression of SLC4A family members of bicarbonate transporters in differentiated primary human airway epithelial cells.
Figure 2

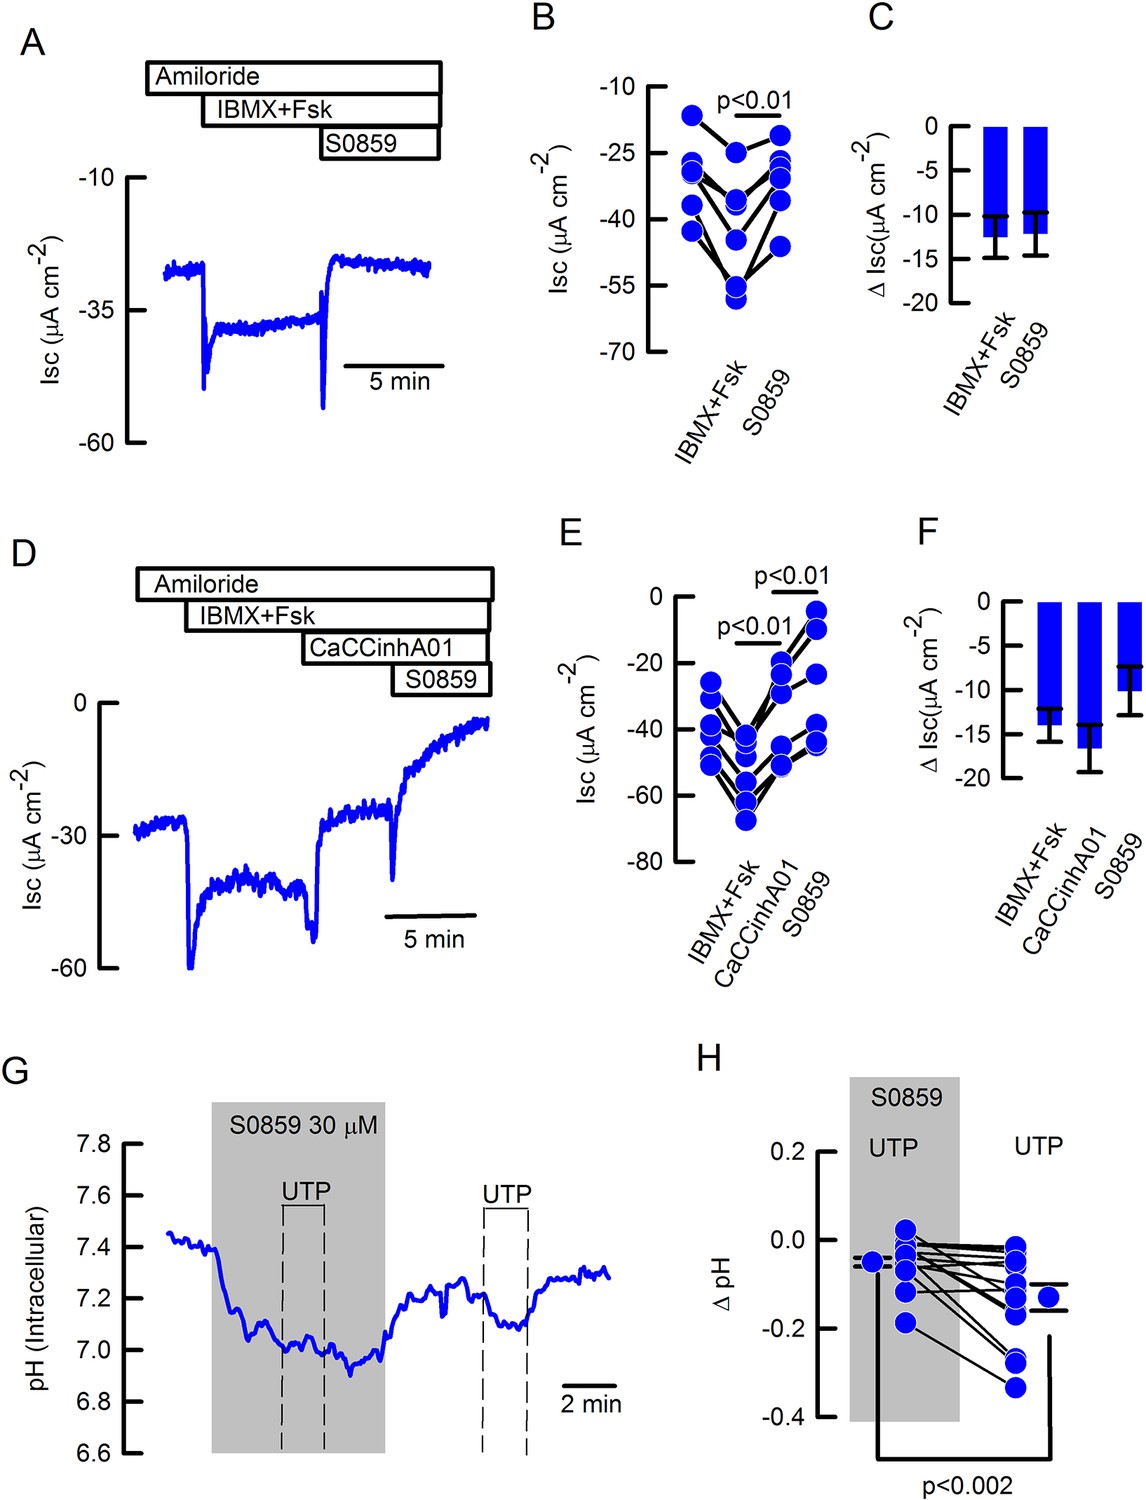
S0859 decreases resting ASL pH in primary human airway epithelial cells (hAECs), by blocking basolateral SLC4A4.
(A) Mean (+ S.E.M.) trace of ASL pH recordings. ASL pH was measured under resting conditions for 1.5 hr before S0859 (30 µM) was added basolaterally. (B) Mean resting ASL pH before (black circles) and after (blue circles) addition of basolateral S0859 (n=9 independent experiments performed on epithelial cells from N=3 donors; paired t-test). (C) Mean (+ SEM) traces of ASL pH from hAECs pre-treated for 3 h with vehicle control (DMSO, black trace) or S0859 (30 µM, basolateral, blue trace). (D) Mean Forskolin (Fsk)-induced changes in ASL pH in hAECs treated with DMSO (black circles) or S0859 (blue circles) (n=9 independent experiments performed on epithelial cells from N=3 donors; paired t-test). (E) Mean (+ SEM) traces of ASL pH from hAECs treated with Fsk for 2.5 hr and then S0859. (F) Mean Fsk-stimulated ASL pH before (black circles) and after (blue circles) addition of basolateral S0859 (n=9 independent experiments performed on epithelial cells from N=3 donors; paired t-test). (G–H) SLC4A4 locates in the basolateral membrane of acetylated tubulin (Ac-tubulin) positive human airway epithelial cells. (I–J) correspond to negative controls for anti-SLC4A4 omitted antibody. Representative images of three different samples. Bar 20 µM.
Figure 3 with 2 supplements
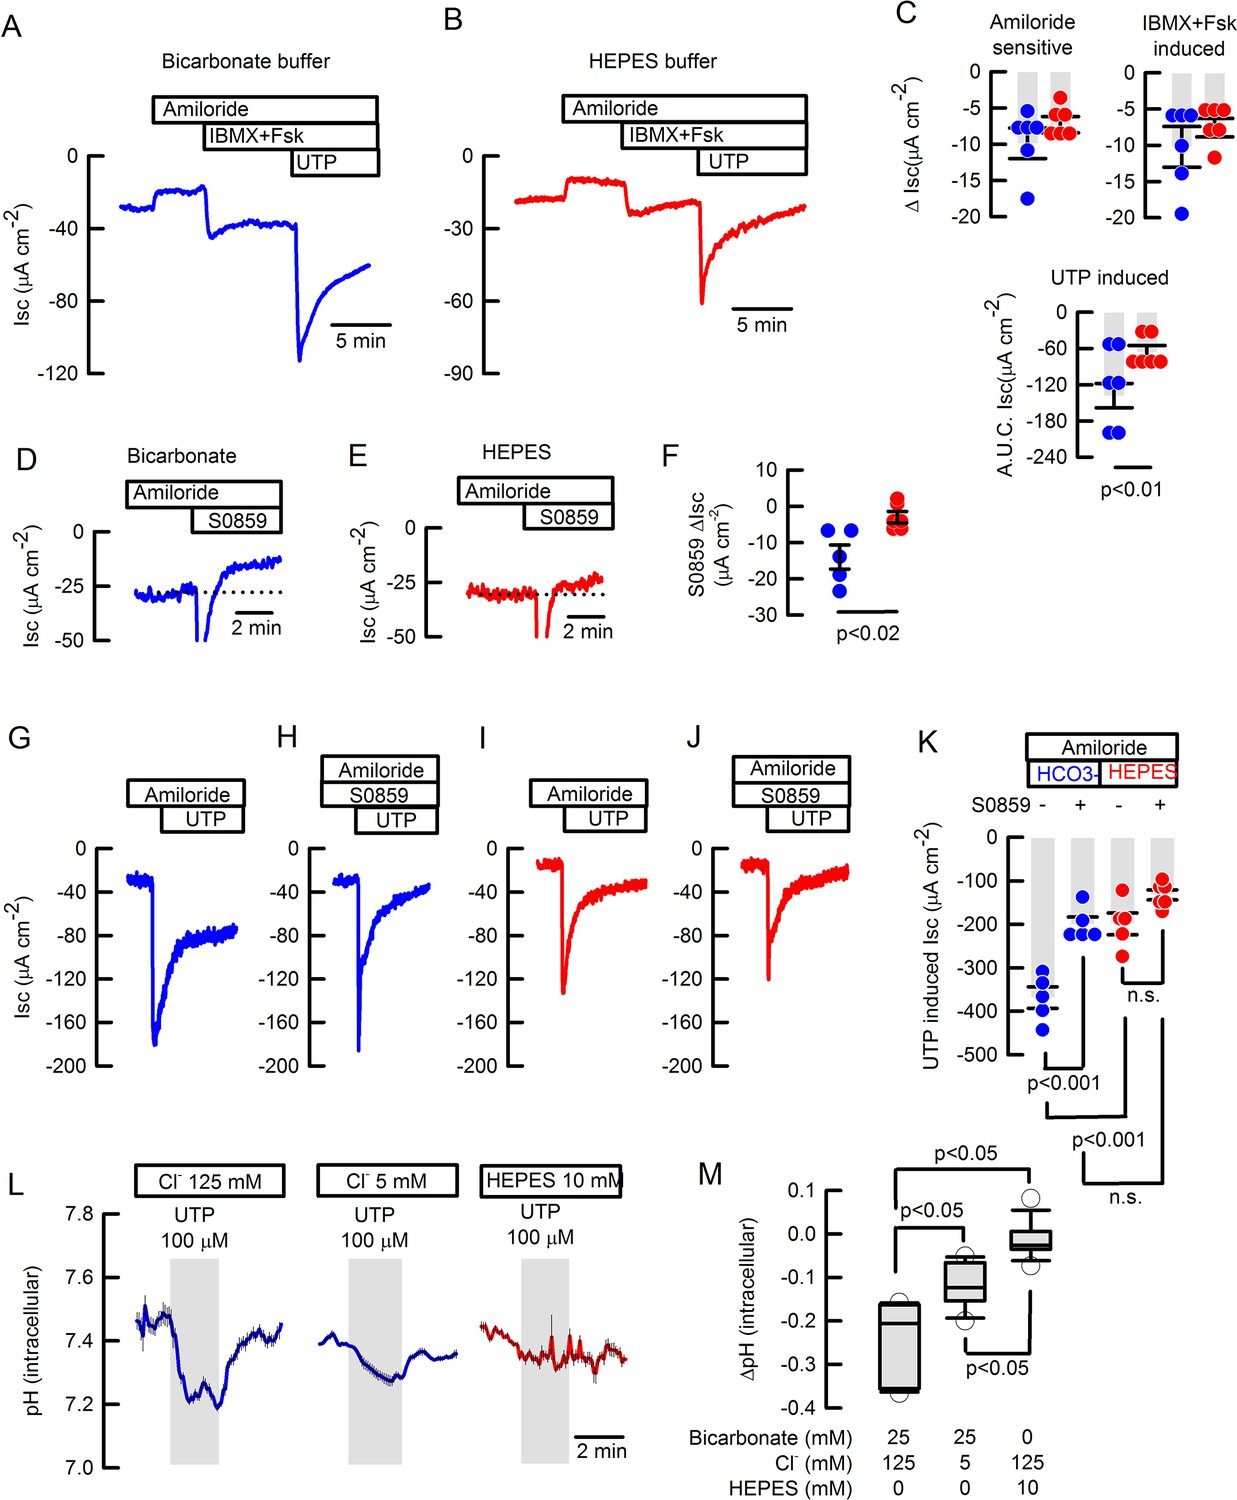
Basal and inducible bicarbonate secretion relies in SLC4A4 activity in mouse tracheal epithelium.
Representative traces of ISC in (A) bicarbonate and (B) HEPES buffer of freshly excised mouse tracheas. (C) Summary of ΔISC values for amiloride-sensitive Na+ absorption, IBMX +Fsk-induced and A.U.C. ISC UTP-induced anion secretion in mouse tracheas; n=6 for each condition; Mann-Whitney Rank Sum Test. Representative ISC traces of S0859 effect on unstimulated tracheas in (D) bicarbonate and (E) HEPES buffer. (F) Summary of ΔISC values for S0859 effect, n=5 for each condition; Mann-Whitney Rank Sum Test. Representative ISC traces for UTP-induced anion secretion in absence (G and I) or presence (H and J) of 30 µM S0859 in buffer bicarbonate (G and H) or HEPES (I and J). All in the presence of 10 µM amiloride. (K) Summary of experiments as presented in G-J; n=5 but HEPES + S0859 n=6; ANOVA on Ranks. Bars are mean ± S.E.M. (L) Average response of determination of pHi in epithelial cells isolated from wild type mouse trachea and loaded with BCECF that were stimulated with 100 µM UTP and switched to 12.5 mM bicarbonate buffered solution. Experiments performed in bicarbonate buffer in blue and HEPES in red. (M) Summary of ΔpHi from experiments as those in (L) including a data set of cells maintained in HEPES buffer; Middle line of the box plot indicates the median; n=15 cells from four different mice, n=11 cells, three different mice and n=13 cells, three different mice respectively; ANOVA on Ranks.
Figure 3—figure supplement 1
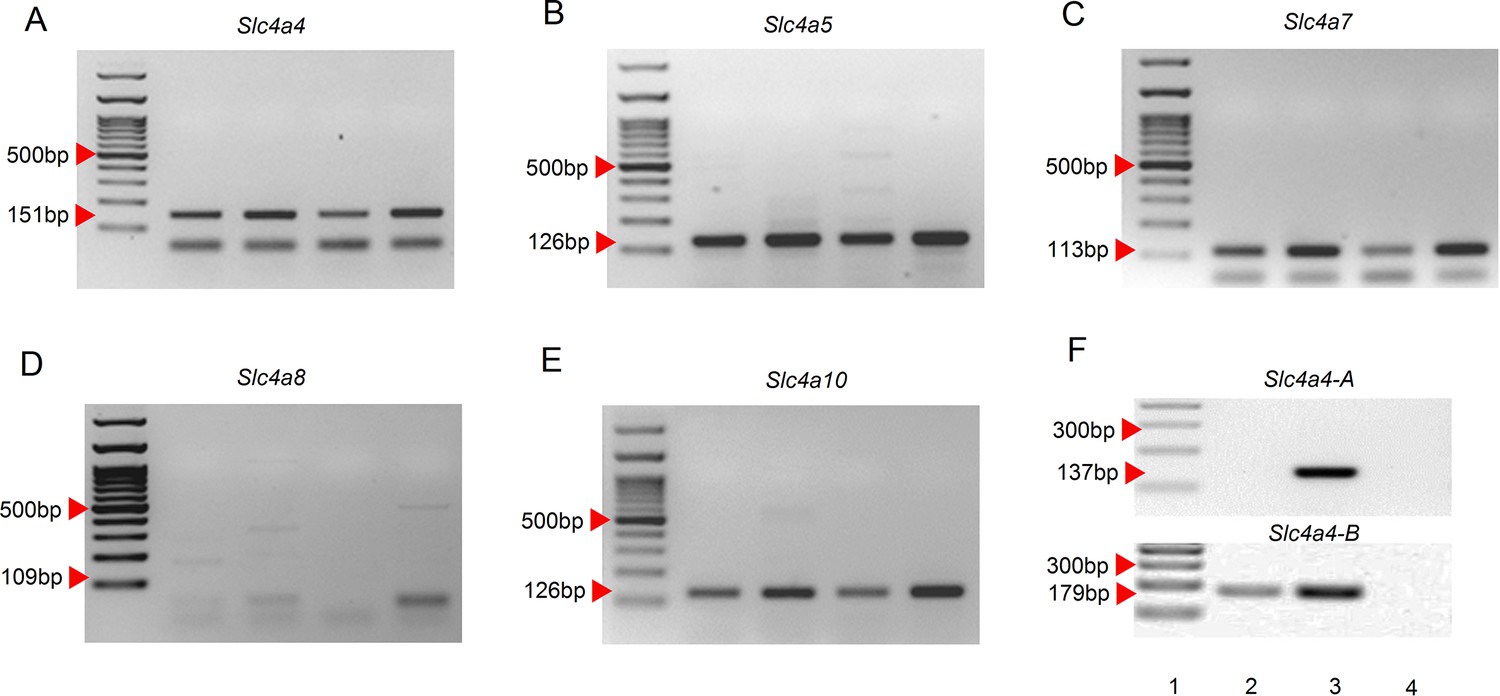
Expression of SLC4 family members of bicarbonate transporters in mouse airway epithelial cells.
Amplicons for (A) Slc4a4, (B) Slc4a5, (C) Slc4a7, (D) Slc4a8, and (E) Slc4a10 were amplified from four samples of airway epithelial cells isolated from four different animals. (F) Isoforms of Slc4a4 were detected in airway epithelial cells (lane 2) and mouse kidney (lane3). Lane 4 corresponds to negative RT-PCR control. Image representative of four samples tested.
Figure 3—figure supplement 2
Inhibition of SLC4A4 by S0859 reduces anion secretion and intracellular pH in mouse tracheal epithelium.
(A) Representative trace of S0859 (30 µM) effect on IBMX +Fsk-induced anion secretion, (B) individual experiments showing Isc changes and (C) summary of ΔISC values for IBMX +Fsk-induced anion secretion and S0859. (D) Representative trace of S0859 (Devor et al., 1999) effect on IBMX +Fsk-induced anions secretion after inhibition of apical chloride secretion by addition of CaCCinhA01 (30 µM), (E) individual experiments showing ISC changes and (F) summary of ΔISC values for experiments in (D). (G) UTP-induced intracellular acidification in the presence of 30 µM S0859 in bicarbonate buffer. (H) Summary of experiments showing ΔpH[i]; n=14 cells from 4 different mice; Mann-Whitney Rank Sum Test.
Figure 4 with 1 supplement

The Slc4a4-/- bear signs of muco-obstructive airway disease.
(A) Ventral view of Alcian blue stained tracheas of 17 days old mice. Red arrow heads show incomplete cartilage rings in the Slc4a4-/- mouse; representative image of 3 animals per genotype. (B) SLC4A4 staining of epithelial cells is absent in the Scl4a4-/- lung tissues; representative images of three different animals per genotype. (C) Epithelial SLC4A4 co-localizes with CCSP; representative images of three different animals. (D) Mucin staining showing mucus adhered to the epithelial surface and epithelial damage (red arrow heads); representative images of five animals per genotype. (E) Summary of Rte values for wild type and Scl4a4-/- tracheas; dashed line indicates 50 Ωcm–2; n=8 for wild types and n=6 for Scl4a4-/- tracheas. (F) Representative traces of pHi in airway cells from wild type (blue) and Slc4a4-/- (red) animals and (G) summary of UTP-inducedΔpHi including mean ± S.E.M. and individual cells; n=8 cells for wild type and n=6 cells for Scl4a4-/-, three different animals per genotype; Mann-Whitney Rank Sum Test. (H) Beads tracking of MCC experiments for wild type and Slc4a4-/- tracheas bathed with basolateral bicarbonate or HEPES buffer. Radius of the polar plots is 50 µm. Summary of MCC experiments for (I) speed, (J) total distance covered by beads. Bars indicate mean ± S.E.M.; n=5 for each genotype in bicarbonate buffer and n=4 for each genotype in HEPES buffer; ANOVA on ranks.
Figure 4—figure supplement 1
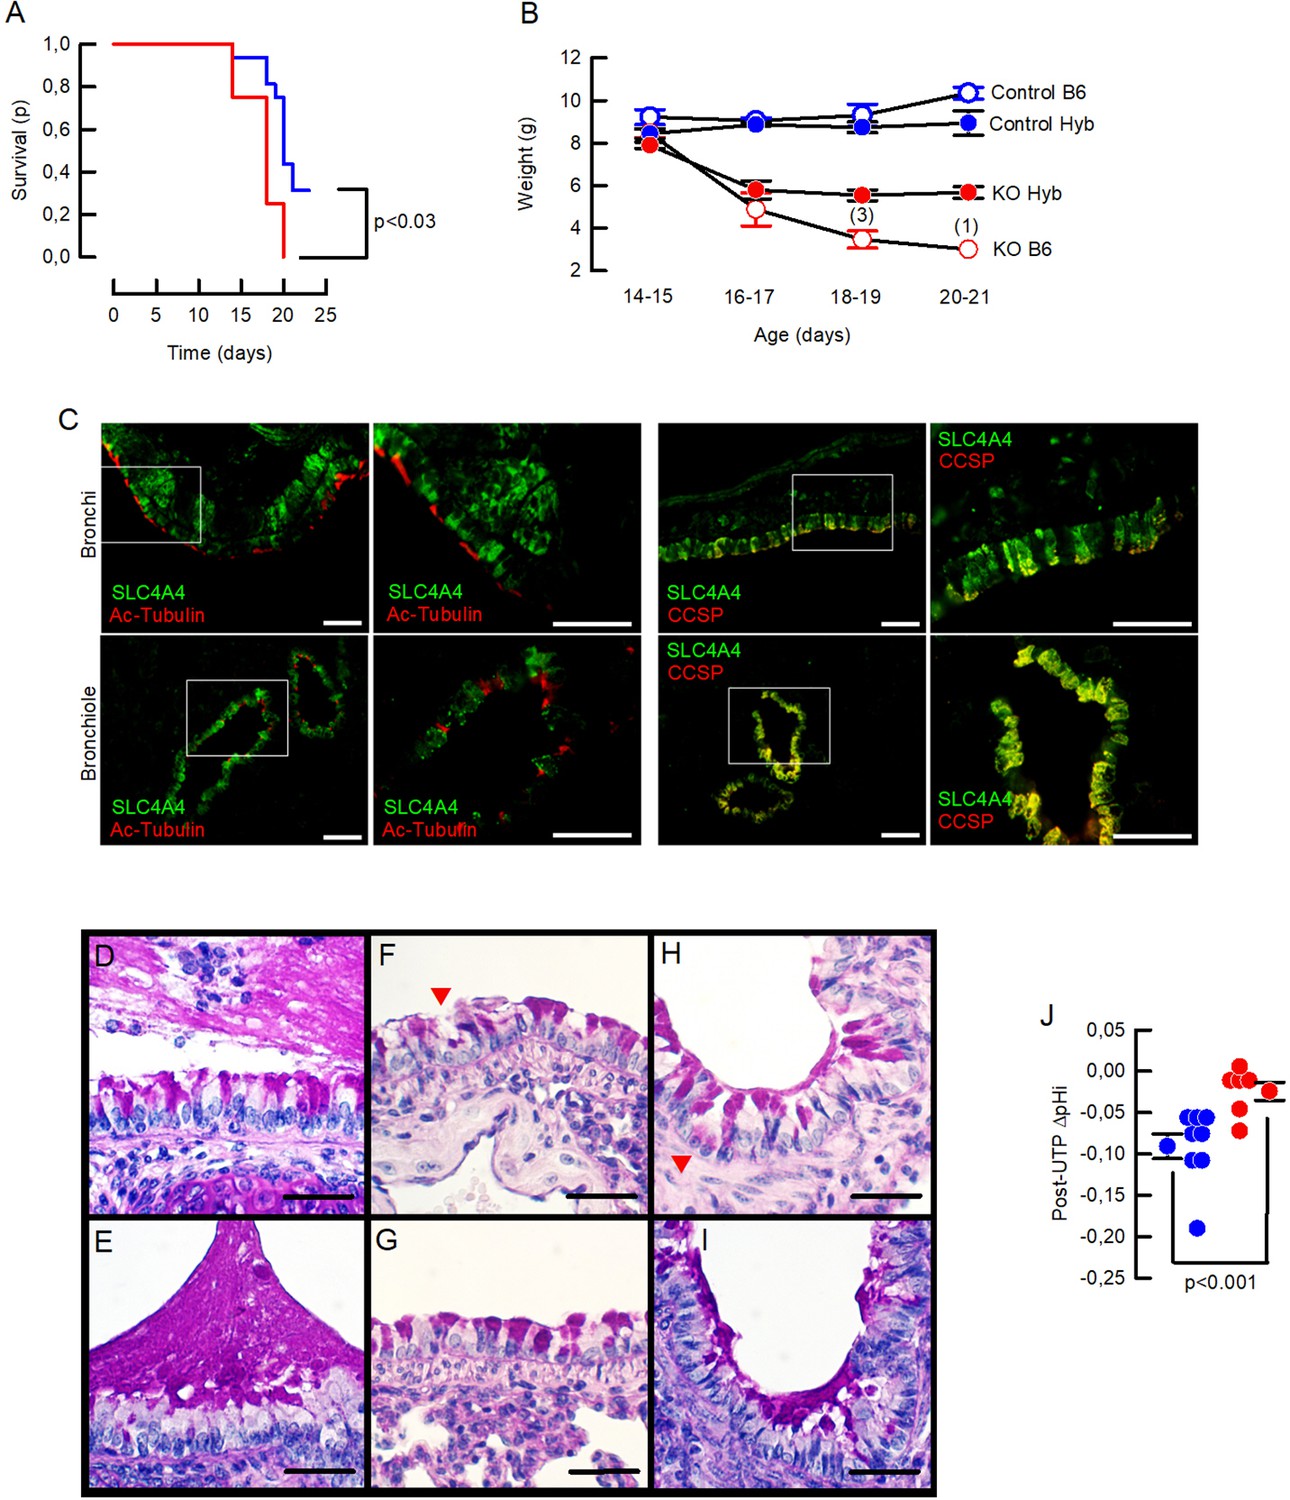
Slc4a4 silencing produces early lethality, weight loss, mucus accumulation and reduced intracellular pH.
(A) Kaplan-Meier curves showing survival for Slc4a4-/- in the C57Bl6/J (B6; red line) or hybrid background (Hyb; blue line). Log-Rank test; n=12 and 16 per gruop. (B) Weight gain curves for control and Slc4a4-/- (KO) mice in B6 and Hyb backgrounds; n=5 for each group but for KO B6 that due to increased lethality group is reduced as indicated in the numbers on top of last two records. (C) Epithelial SLC4A4 co-localizes with CCSP protein in bronchi and bronchioles; representative images of three animals per genotype. (D–I) PAS staining of mucus in trachea (D–E), bronchi (F–H) and bronchiole (I). Red arrows indicate areas of epithelial damage. Images are representative of five different animals per genotype. (J) Summary of ΔpH[i] post-UTP including mean ± S.E.M. and individual cells; n=8 cells for wild type and n=6 cells for Scl4a4-/-, three different animals per genotype; Mann-Whitney Rank Sum Test.
Author response image 1
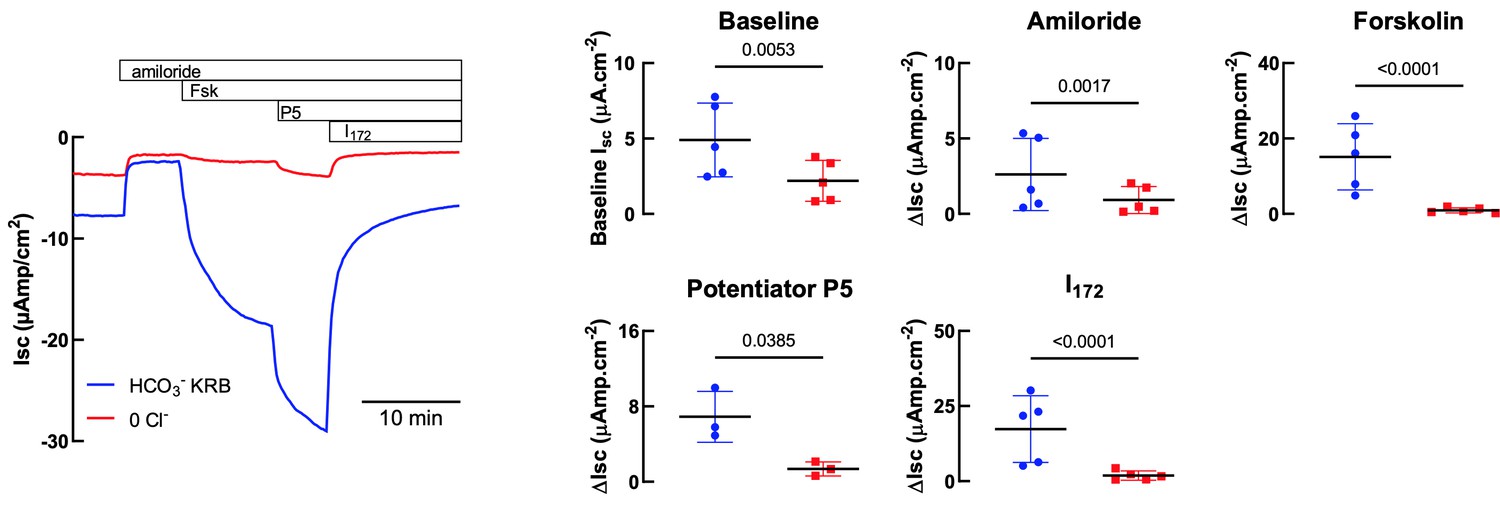
Comparison of HCO3- KRB and Cl- free solutions on Isc responses of primary hAECs to amiloride, forskolin, potentiator P5 and CFTRInh172.
Panel on the left shows a representative trace. Panels on the right show either baseline Isc (top left) or changes in Isc (ΔIsc) after specific inhibitors and agonists. Each symbol represents an independent experiment, using cells from two donors. Bars are means ± SD.
Author response image 2
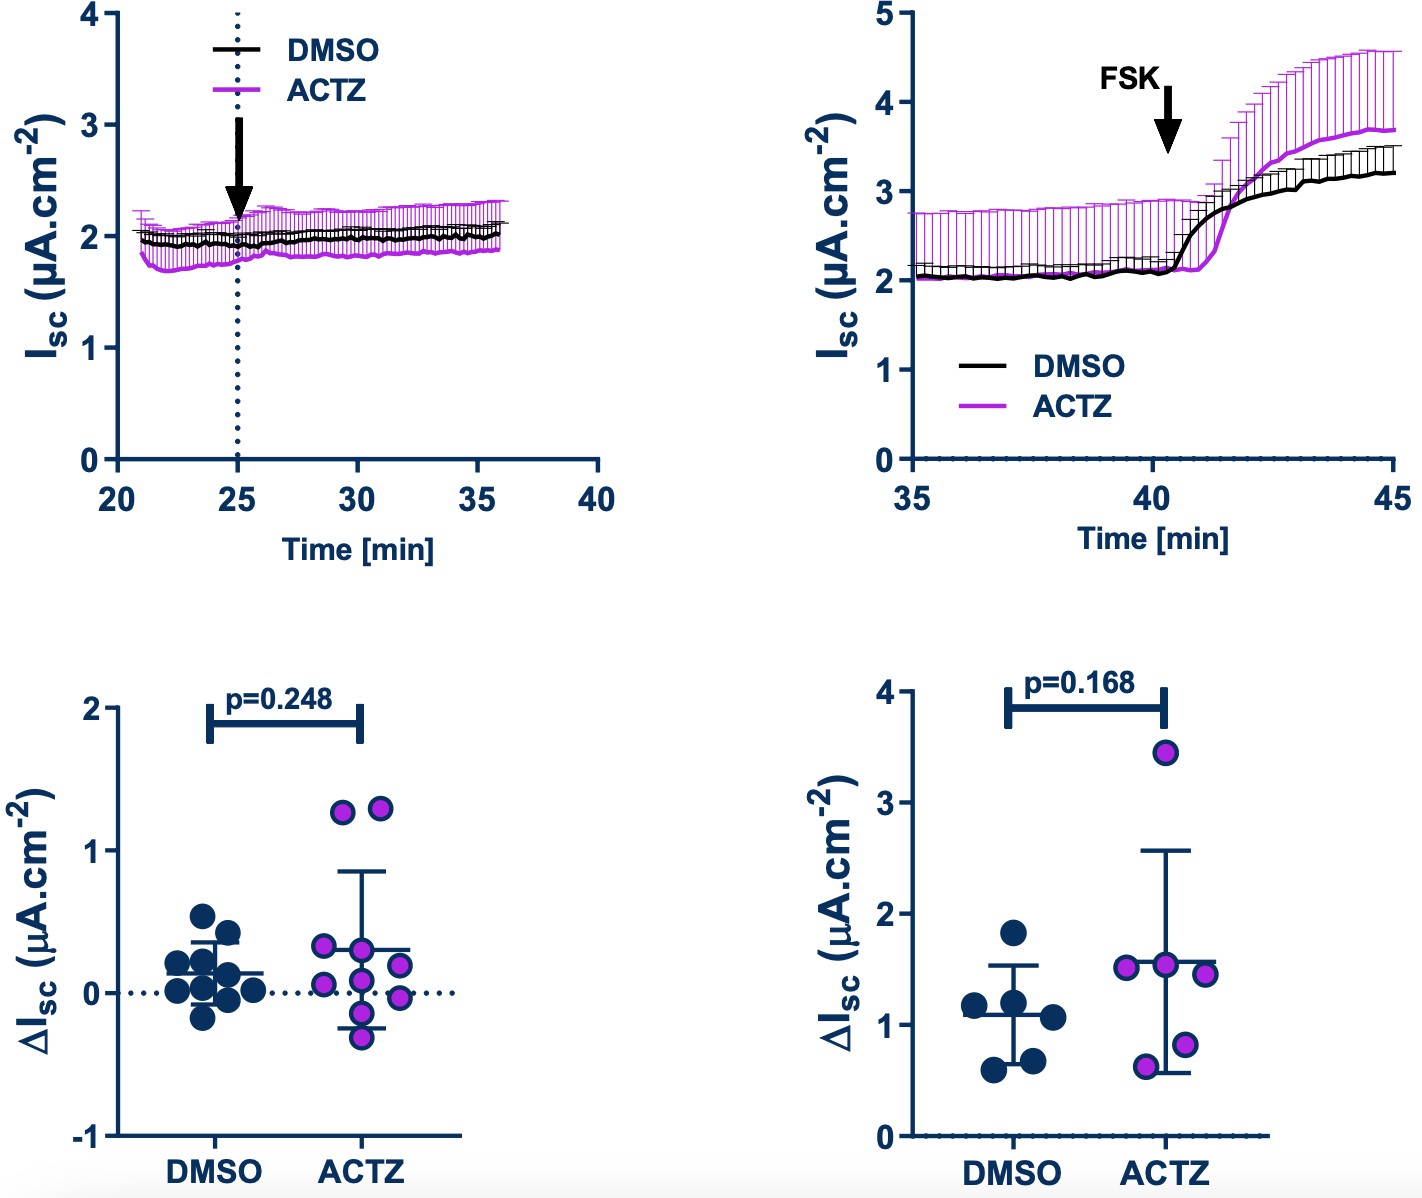
Effect of acetazolamide (ACTZ) on unstimulated and Fsk-stimulated HCO3- secretion in Ussing chamber experiments in Cl- free buffer.
Upper panels show the kinetics of the effect of ACTZ. Bottom panels are the DMSO, ACTZ and Fsk-induced changes.
Author response image 3
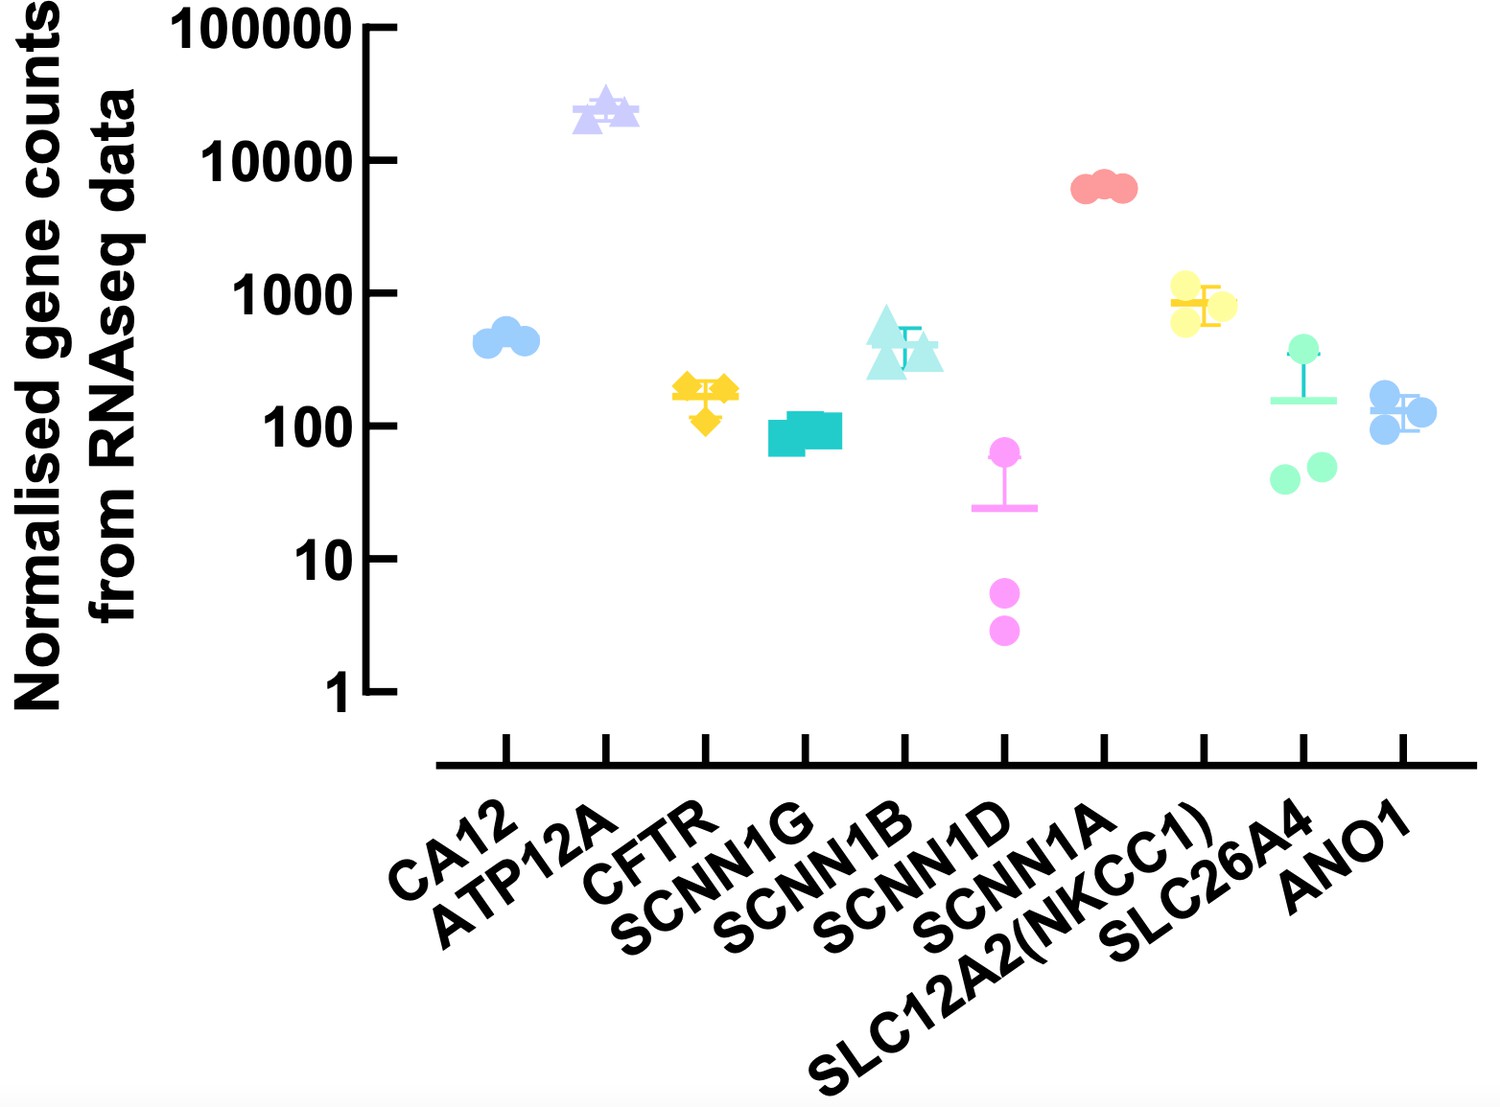
Normalised counts of ion channels and transporters expressed in primary human airway epithelial cells.
Each symbol represents one donor. Bars are means ± SD.
Author response image 4
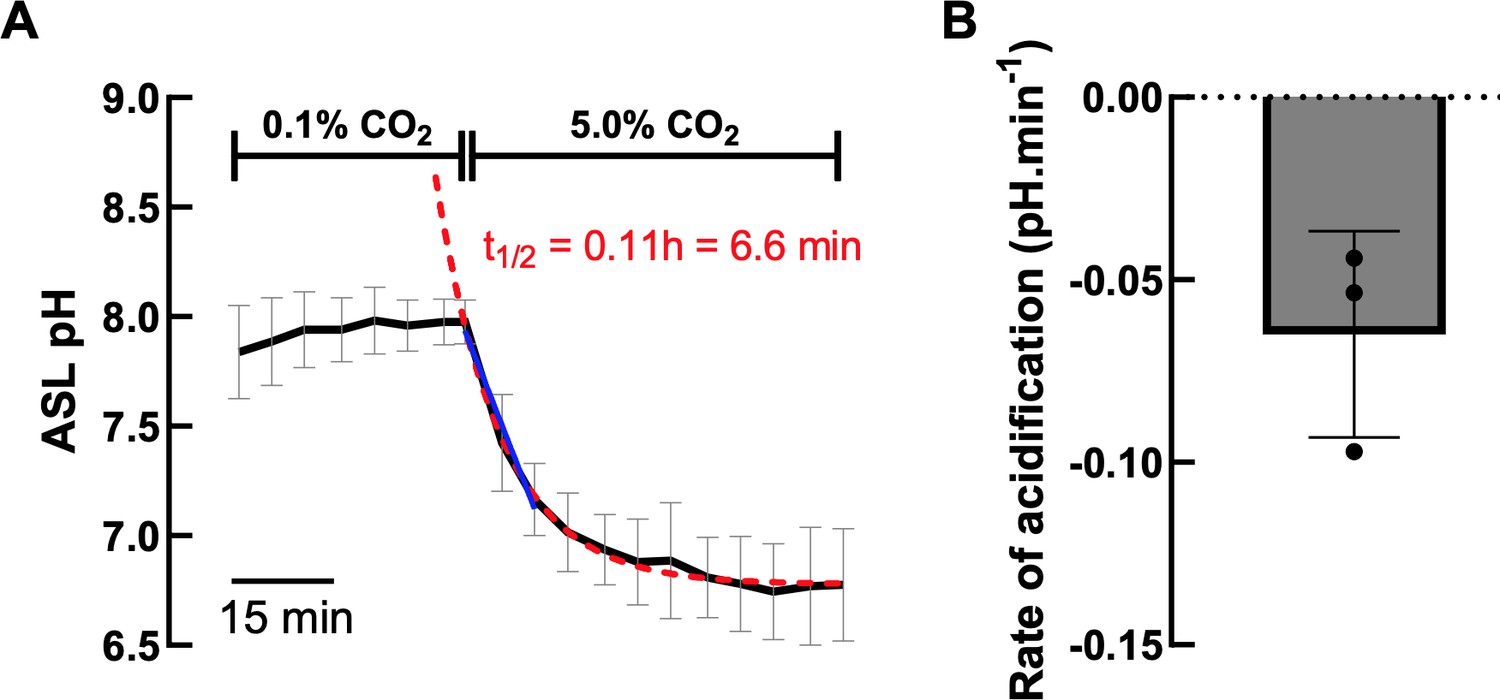
A. Effect of increasing CO2 concentration on ASL pH (black line) of hAECs (n=3, mean ± SD).
Exponential decay nonlinear regression analysis (red dashed line) and simple linear analysis (blue line) were performed on the ASL pH values from the change in CO2 concentration. B. Average rate of CO2induced acidification of 3 independent experiments measured as the slope of the linear regression analysis.
Author response image 5
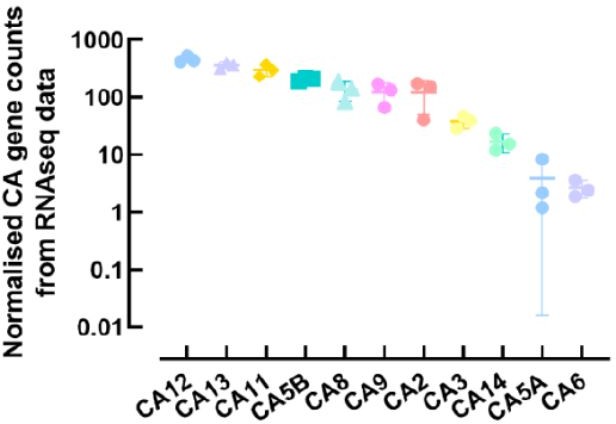
Normalised counts of carbonic anhydrase (CA) family members expressed in primary human airway epithelial cells.
Each symbol represents one donor. Bars are means ± SD.
Author response image 6
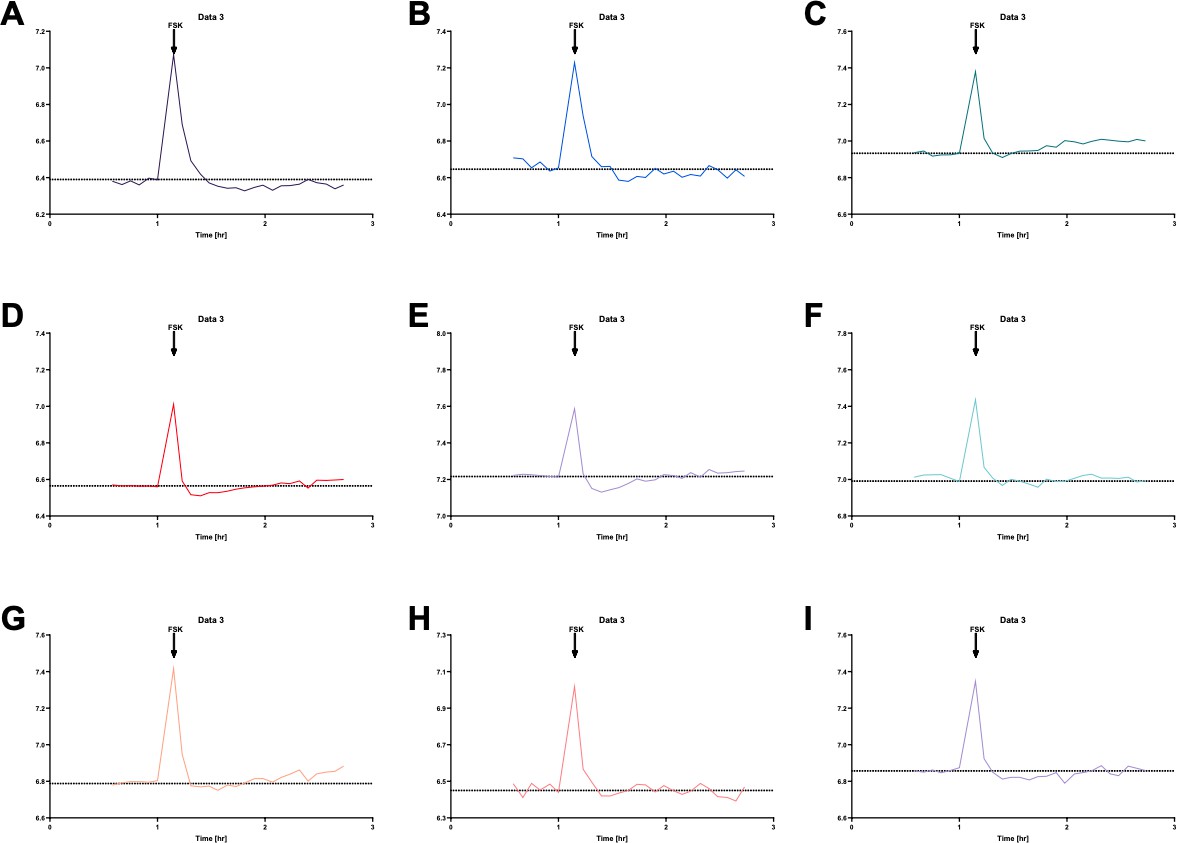
Individual ASL pH measurements in S0859-treated primary hAECs show that forskolin (FSK) only induced a transient acidification, before the subsequent alkalinisation, in 2 out of 9 independent experiments (panels D and E).
Note that the peaks observed at the time of addition of the forskolin are due to the drop in CO2 when the plates were removed from the plate-reader in order to treat the cells.
Tables
Author response table 1
| Figure 2 panel B | Baseline | S0859 | Figure 2 panel D | FSK | S0859 + FSK | Figure 2 panel F | FSK | FSK + S0859 | ||||||
|---|---|---|---|---|---|---|---|---|---|---|---|---|---|---|
| 20170602 Donor1 P2 | 6,52 | 6,52 | 6,46 | 6,46 | 20170602 Donor1 P2 | 0,066 | 0,066 | 0,034 | 0,034 | 20170602 Donor1 P2 | 6,72 | 6,72 | 6,68 | 6,68 |
| 20170607 Donor 1 P4 | 6,84 | 6,84 | 6,78 | 6,78 | 20170607 Donor 1 P4 | 0,092 | 0,092 | 0,100 | 0,100 | 20170607 Donor 1 P4 | 6,86 | 6,86 | 6,84 | 6,84 |
| 20170620 Donor 2 P2 | 7,13 | 7,13 | 7,01 | 7,01 | 20170620 Donor 2 P2 | 0,055 | 0,055 | -0,029 | -0,029 | 20170620 Donor 2 P2 | 7,28 | 7,28 | 7,25 | 7,25 |
| 20170621 Donor 3 P2 | 6,94 | 6,94 | 6,86 | 6,86 | 20170621 Donor 3 P2 | 0,090 | 0,090 | -0,001 | -0,001 | 20170621 Donor 3 P2 | 7,12 | 7,12 | 7,10 | 7,10 |
| 20170627 Donor 2 P3 | 7,22 | 7,22 | 7,22 | 7,22 | 20170627 Donor 2 P3 | 0,125 | 0,125 | 0,033 | 0,033 | 20170627 Donor 2 P3 | 7,35 | 7,35 | 7,24 | 7,24 |
| 20170628 Donor 3P3 | 6,62 | 6,62 | 6,56 | 6,56 | 20170628 Donor 3P3 | 0,125 | 0,125 | 0,044 | 0,044 | 20170628 Donor 3P3 | 6,77 | 6,77 | 6,70 | 6,70 |
| 20190605 | 7,02 | 7,02 | 6,93 | 6,93 | 20190605 | 0,141 | 0,141 | 0,074 | 0,074 | 20190605 | 7,28 | 7,28 | 7,21 | 7,21 |
| 20190618 | 6,87 | 6,87 | 6,67 | 6,67 | 20190618 | 0,077 | 0,077 | -0,030 | -0,030 | 20190618 | 7,09 | 7,09 | 7,03 | 7,03 |
| 20190620 | 6,43 | 6,43 | 6,38 | 6,38 | 20190620 | 0,079 | 0,079 | -0,013 | -0,013 | 20190620 | 6,52 | 6,52 | 6,47 | 6,47 |
| Table Analyzed | means S0859 ASL pH baseline | Table Analyzed | means S0859 ASL pH Fsk | Table Analyzed | means ASL pH Fsk S0859 | |||||||||
| Column C | S0859 | Column C | S0859 + FSK | Column C | FSK + S0859 | |||||||||
| vs. | vs, | vs. | vs, | vs. | vs, | |||||||||
| Column B | Baseline | Column B | FSK | Column B | FSK | |||||||||
| Paired t test | Paired t test | Paired t test | ||||||||||||
| P value | 0,003 | P value | <0,001 | P value | <0,001 | |||||||||
| P value summary | ** | P value summary | *** | P value summary | *** | |||||||||
| Significantly different (P < 0.05)? | Yes | Significantly different (P < 0.05)? | Yes | Significantly different (P < 0.05)? | Yes | |||||||||
| One- or two-tailed P value? | Two-tailed | One- or two-tailed P value? | Two-tailed | One- or two-tailed P value? | Two-tailed | |||||||||
| t, df | t=4,273, df=8 | t, df | t=5,832, df=8 | t, df | t=5,217, df=8 | |||||||||
| Number of pairs | 9 | Number of pairs | 9 | Number of pairs | 9 | |||||||||
| How big is the difference? | How big is the difference? | How big is the difference? | ||||||||||||
| Mean of differences (C – B) | -0,07895 | Mean of differences (C – B) | -0,07089 | Mean of differences (C – B) | -0,05307 | |||||||||
| SD of differences | 0,05543 | SD of differences | 0,03647 | SD of differences | 0,03052 | |||||||||
| SEM of differences | 0,01848 | SEM of differences | 0,01216 | SEM of differences | 0,01017 | |||||||||
| 95% confidence interval | -0,1216 to -0,03634 | 95% confidence interval | -0,09893 to -0,04286 | 95% confidence interval | -0,07653 to -0,02961 | |||||||||
| R squared (partial eta squared) | 0,6954 | R squared (partial eta squared) | 0,8096 | R squared (partial eta squared) | 0,7728 | |||||||||
| How effective was the pairing? | How effective was the pairing? | How effective was the pairing? | ||||||||||||
| Correlation coefficient (r) | 0,9794 | Correlation coefficient (r) | 0,6002 | Correlation coefficient (r) | 0,9949 | |||||||||
| P value (one tailed) | <0,001 | P value (one tailed) | 0,044 | P value (one tailed) | <0,001 | |||||||||
| P value summary | **** | P value summary | * | P value summary | **** | |||||||||
| Was the pairing significantly effective? | Yes | Was the pairing significantly effective? | Yes | Was the pairing significantly effective? | Yes |
Additional files
-
Supplementary file 1
Primers for hBECs.
- https://cdn.elifesciences.org/articles/75871/elife-75871-supp1-v2.docx
-
Supplementary file 2
Primers for mouse.
- https://cdn.elifesciences.org/articles/75871/elife-75871-supp2-v2.docx
-
Transparent reporting form
- https://cdn.elifesciences.org/articles/75871/elife-75871-transrepform1-v2.pdf
Download links
A two-part list of links to download the article, or parts of the article, in various formats.
Downloads (link to download the article as PDF)
Open citations (links to open the citations from this article in various online reference manager services)
Cite this article (links to download the citations from this article in formats compatible with various reference manager tools)
Inhibition of the sodium-dependent HCO3- transporter SLC4A4, produces a cystic fibrosis-like airway disease phenotype
eLife 11:e75871.
https://doi.org/10.7554/eLife.75871


