HLJ1 amplifies endotoxin-induced sepsis severity by promoting IL-12 heterodimerization in macrophages
- Department of Clinical Laboratory Sciences and Medical Biotechnology, College of Medicine, National Taiwan University, Taiwan
- Center of Genomic and Precision Medicine, National Taiwan University, Taiwan
- Department of Laboratory Medicine, National Taiwan University, Taiwan
- Genome and Systems Biology Degree Program, National Taiwan University and Academia Sinica, Taiwan
- Institute of Biomedical Sciences, National Chung Hsing University, Taiwan
- Department of Internal Medicine, National Taiwan University Hospital, Taiwan
- Institute of Biomedical Sciences, Academia Sinica, Taiwan
Figures
Figure 1 with 1 supplement
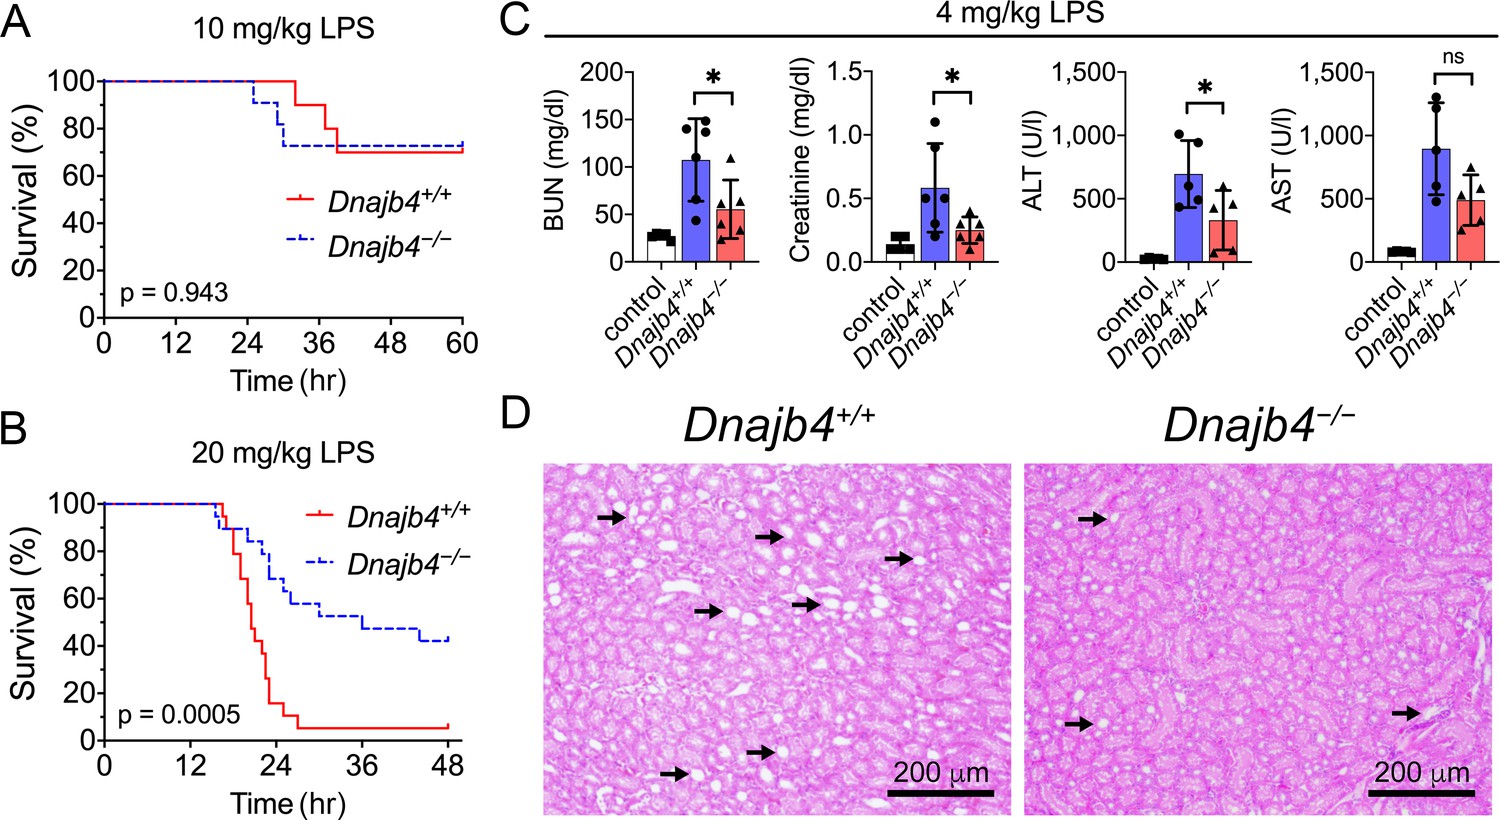
HLJ1 deletion protects against lipopolysaccharide (LPS)-induced organ injury and mortality.
Dnajb4−/− mice survive better than Dnajb4+/+ mice after high-dose LPS injection. Kaplan–Meier analysis of the overall survival of 6- to 8-week-old Dnajb4+/+ mice and Dnajb4−/− mice injected with (A) LD50 (10 mg/kg, n = 10–11 mice/group) or (B) high-dose (20 mg/kg, n = 19 mice/group) LPS. Log-rank Mantel-Cox test was used to compare survival curve. (C) Mice were i.p. injected with low-dose LPS (4 mg/kg) and after 24 hr serum levels of organ dysfunction markers BUN, creatinine, ALT, and AST were analyzed from n = 5–6 mice group. BUN, p = 0.037; creatinine, p = 0.048; ALT, p = 0.049; AST, p = 0.060. Data presented are means ± standard deviation (SD). Statistical analysis was performed by using the two-tailed, unpaired Student’s t-test. *p < 0.05; ns, not significant. (D) Representative images of H&E staining of kidney sections from mice treated with 4 mg/kg LPS. Scale bar: 200 μm. Black arrows indicate kidney injury.
-
Figure 1—source data 1
Data for graphs depicted in Figure 1A–C.
- https://cdn.elifesciences.org/articles/76094/elife-76094-fig1-data1-v2.xlsx
Figure 1—figure supplement 1
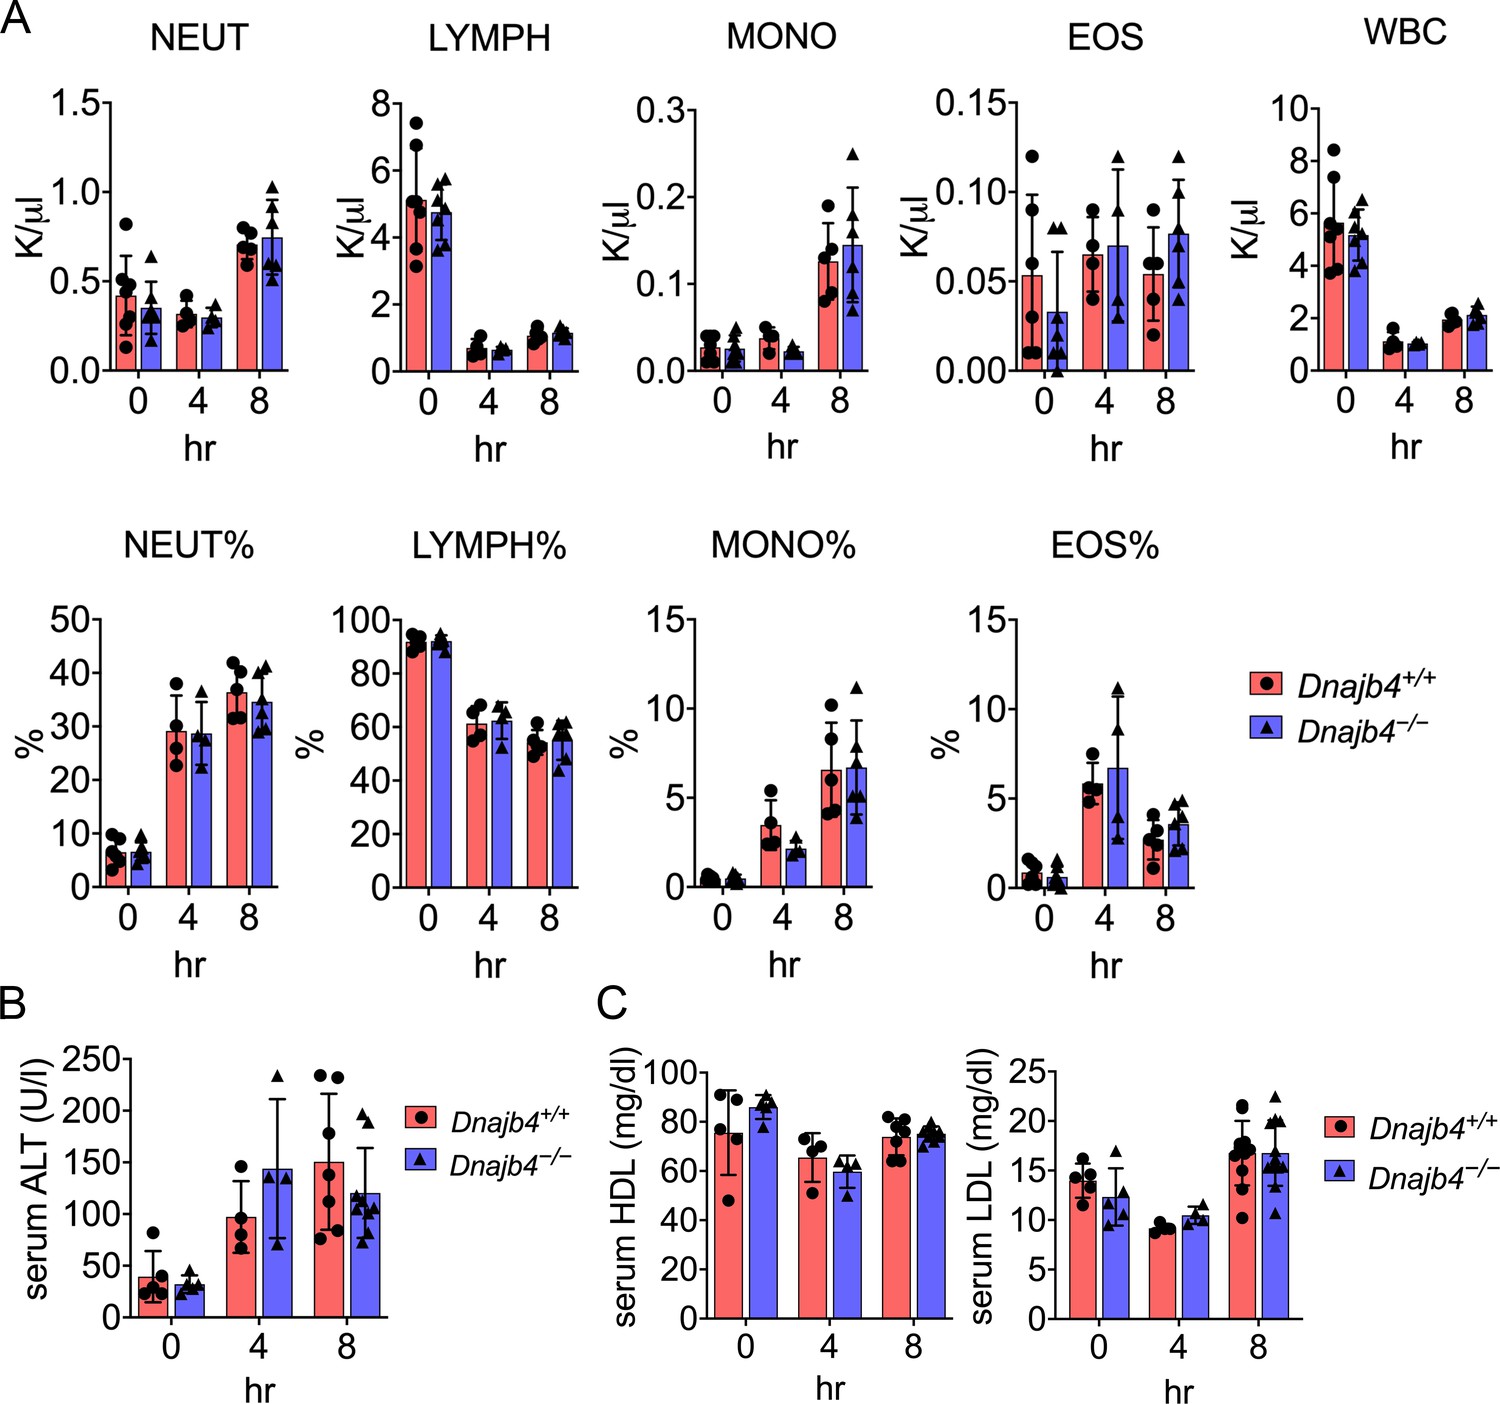
CBC counts, serum ALT, high-density lipoprotein (HDL), and low-density lipoprotein (LDL) levels of Dnajb4+/+ and Dnajb4−/− mice.
(A) Six to eight weeks Dnajb4+/+ and Dnajb4−/− mice were injected with lipopolysaccharide (LPS) of high dose (20 mg/kg). After 4 and 8 hr, blood was collected for analyzing percentage and counts of neutrophils (NEUT), lymphocytes (LYMPH), monocytes (MONO), eosinophils (EOS), and white blood cells (WBC) (n = 5–7 mice). (B) Serum from LPS-injected mice (n = 5–9) were analyzed for ALT levels. (C) Serum from n = 5–10 LPS-injected mice were analyzed for HDL and LDL levels. Data are mean ± standard deviation (SD). Statistical analysis was performed by using the two-tailed, unpaired Student’s t-test.
-
Figure 1—figure supplement 1—source data 1
Data for graphs depicted in Figure 1—figure supplement 1A–C.
- https://cdn.elifesciences.org/articles/76094/elife-76094-fig1-figsupp1-data1-v2.xlsx
Figure 2 with 1 supplement
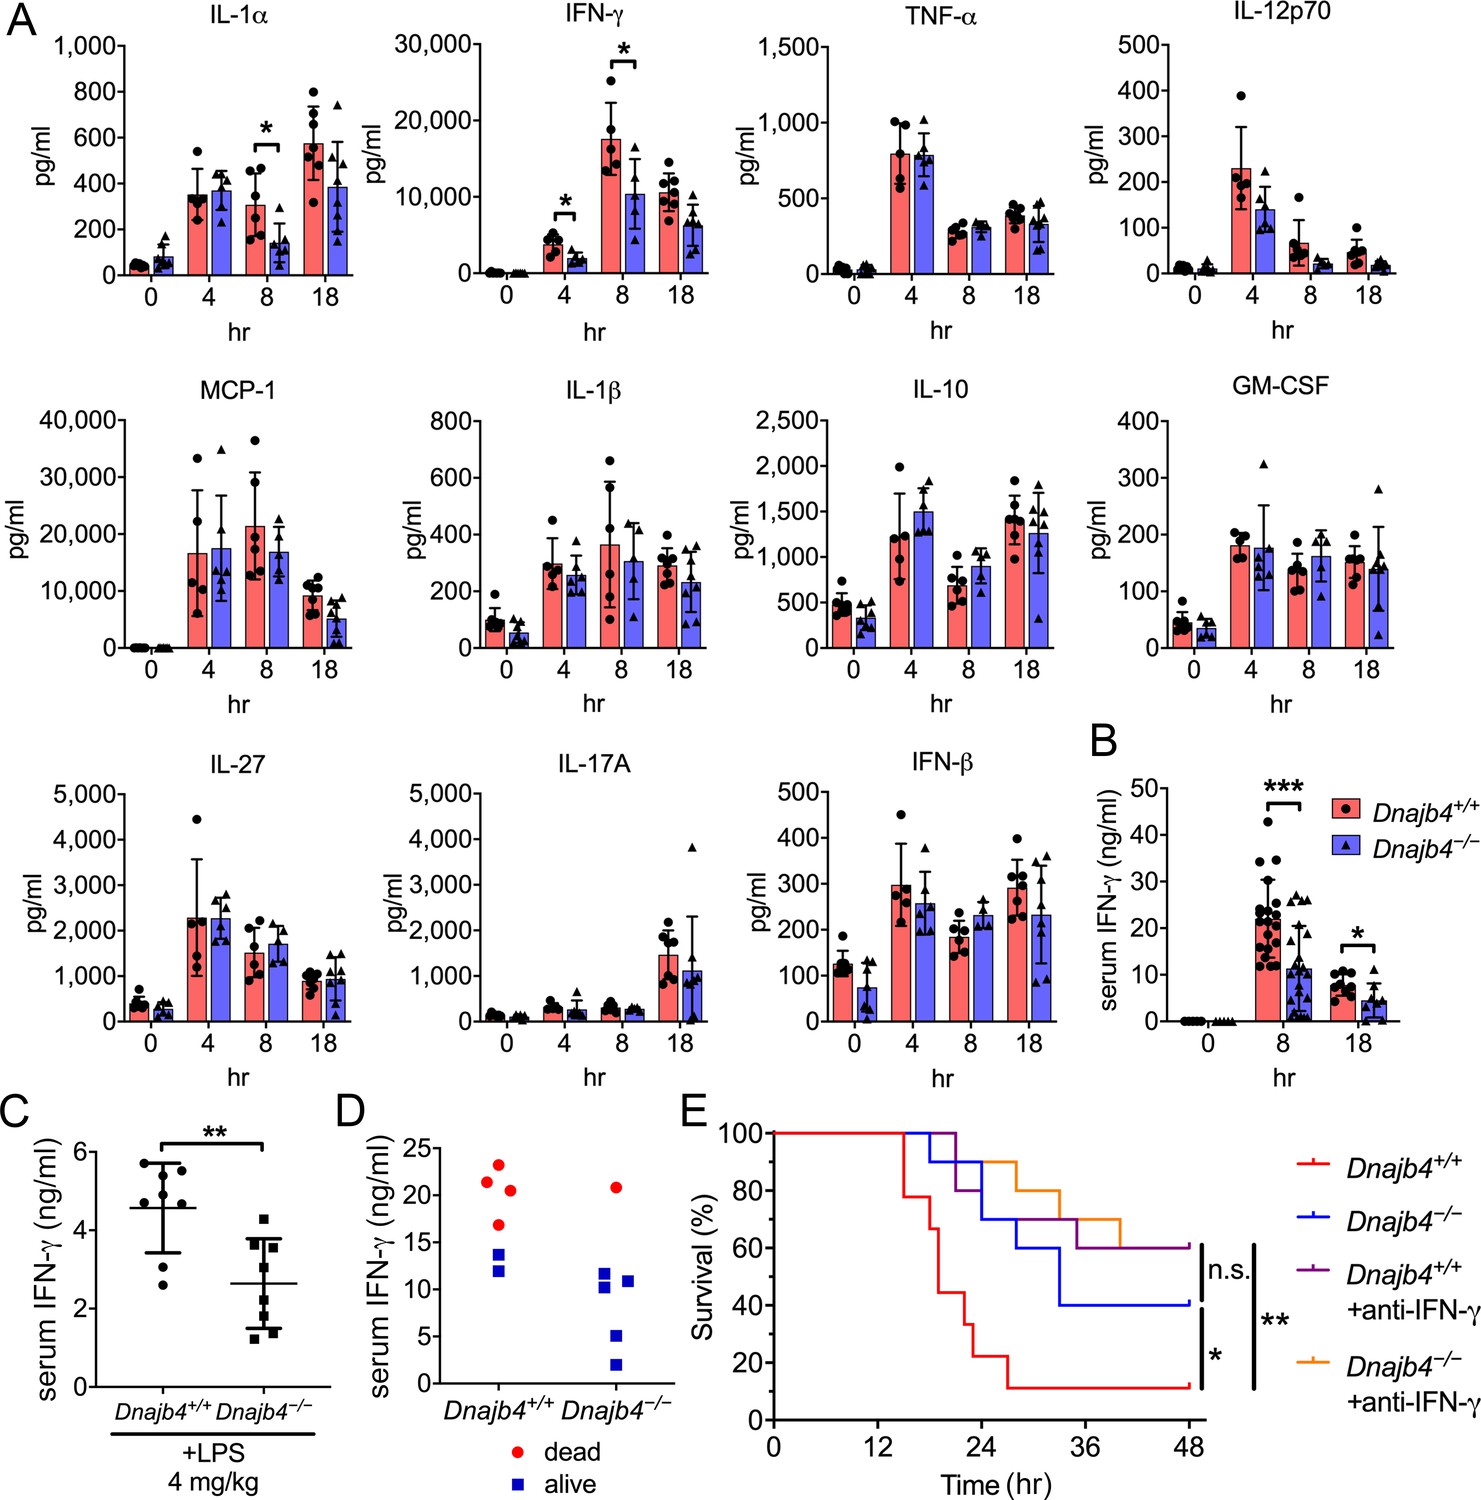
HLJ1 deletion alleviates IFN-γ-dependent sepsis death.
(A) Serum from Dnajb4+/+ and Dnajb4−/− mice administered with lipopolysaccharide (LPS) was analyzed at the indicated time points to quantify 11 cytokines via a cytokine bead array. IL-1α, p = 0.03; 4 hr IFN-γ, p = 0.027; 8 hr IFN-γ, p = 0.04; n = 5–8 per group. (B) Serum IFN-γ levels were quantified using ELISA 8 hr (n = 20–22) and 18 hr (n = 8–9) after LPS injection. 8 hr IFN-γ, p < 0.001; 18 hr IFN-γ, p = 0.039. (C) Mice (n = 8 biological replicates) were injected with lower dose 4 mg/kg LPS and after 8 hr serum was collected for quantification of IFN-γ levels. p = 0.005. (D) Correlation between survival status and serum IFN-γ levels in Dnajb4+/+ and Dnajb4−/− mice injected with 20 mg/kg LPS (n = 6 mice/group). (E) Kaplan–Meier analysis of overall survival of Dnajb4+/+ and Dnajb4−/− mice (n = 9–10) injected with 100 μg anti-IFN-γ neutralizing antibodies 1 hr before LPS (20 mg/kg) challenge. Dnajb4+/+ versus Dnajb4−/− mice, p = 0.015; Dnajb4+/+ versus Dnajb4+/++anti-IFN-γ, p = 0.007. Data presented are means ± standard deviation (SD). Significance was calculated by using two-tailed, unpaired Student’t t-test. Log-rank Mantel-Cox test was used to compare survival curve. *p < 0.05, **p < 0.01, ***p < 0.001.
-
Figure 2—source data 1
Data for graphs depicted in Figure 2A–E.
- https://cdn.elifesciences.org/articles/76094/elife-76094-fig2-data1-v2.xlsx
Figure 2—figure supplement 1
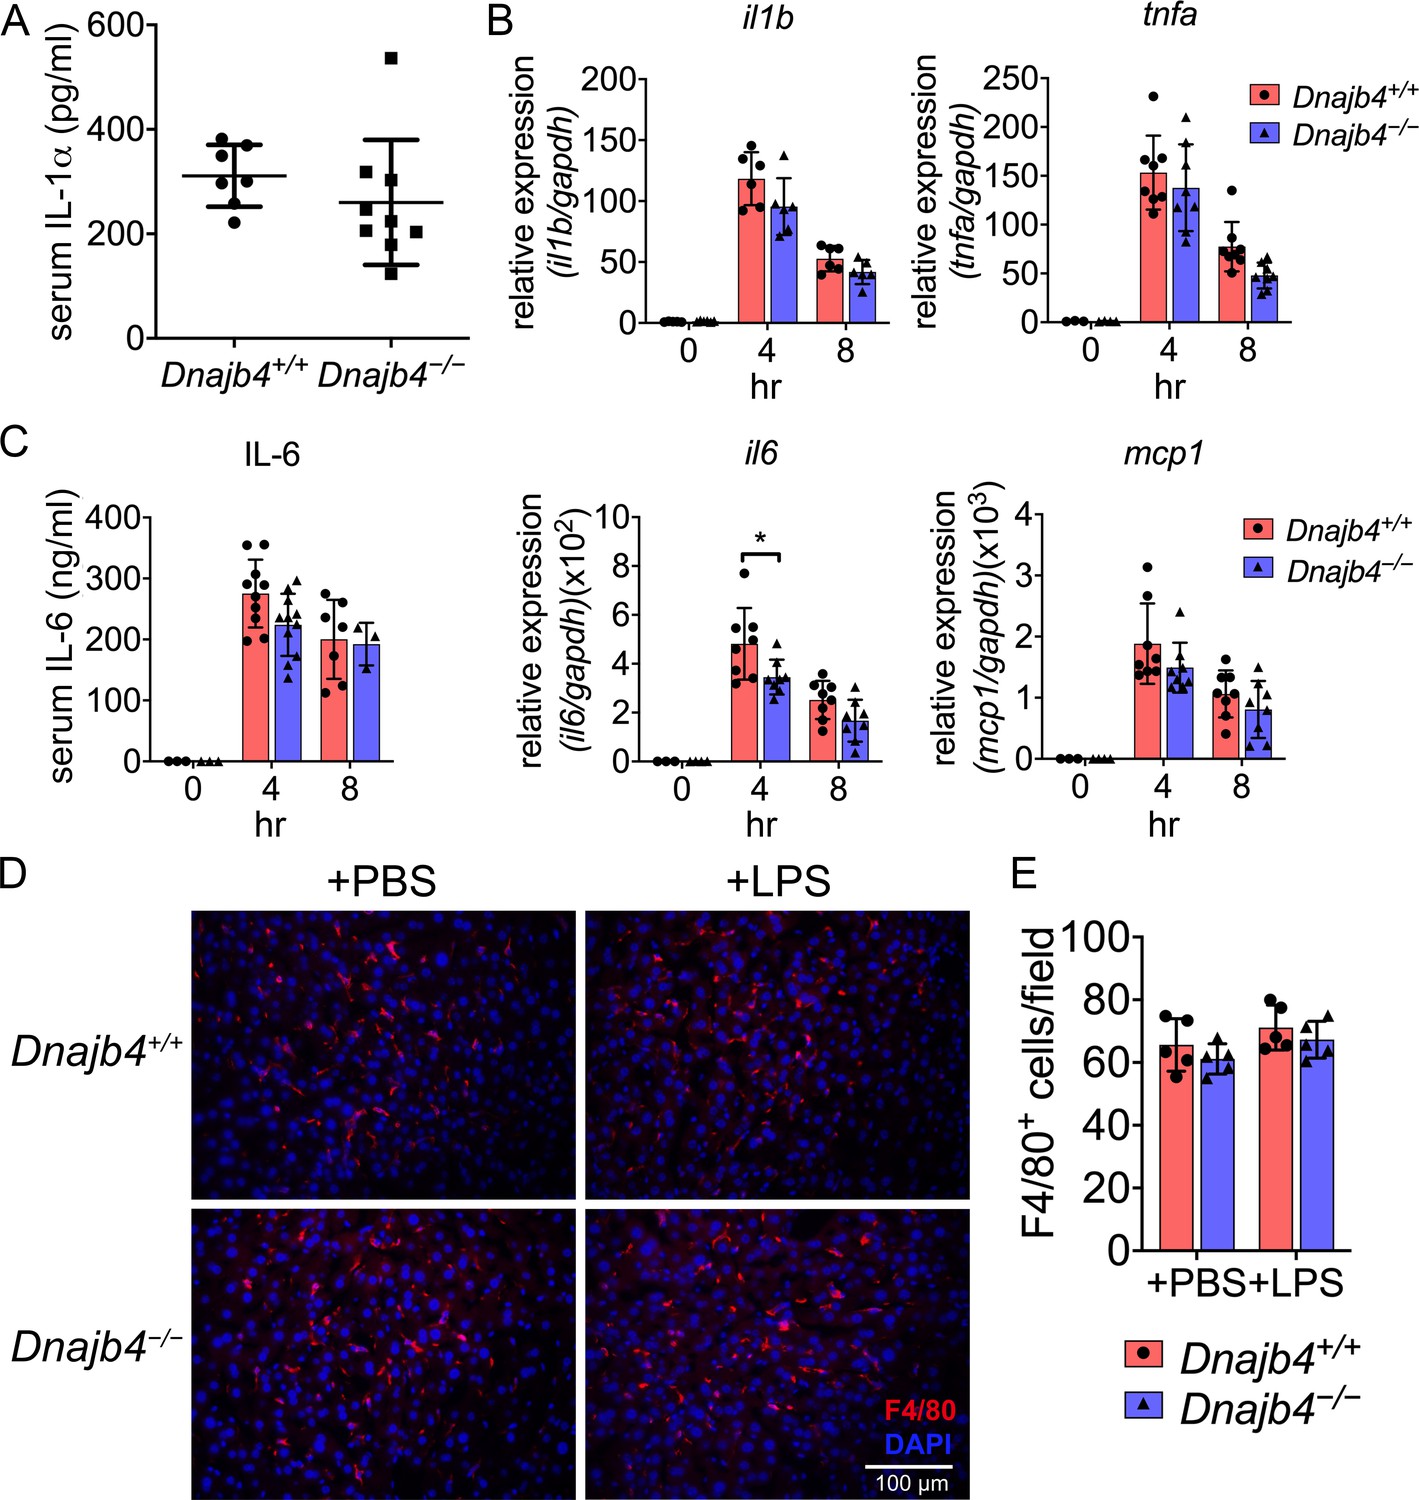
Inflammatory cytokine expression and macrophage numbers were unchanged in the liver of sepsis mice.
(A) Serum IL-1α levels from n = 8–9 mice were quantified 8 hr after 20 mg/kg lipopolysaccharide (LPS) injection. (B) After 4 or 8 hr, the RNA from n = 6–8 total livers were isolated and gene expression levels were quantified via quantitative real-time PCR (qRT-PCR). IL-6, p = 0.033. (C) Serum levels of IL-6 in Dnajb4+/+ and Dnajb4−/− mice were quantified via ELISA 4 hr (n = 11–14) and 8 hr (n = 4–7) after LPS administration. (D) Quantification of liver-resident macrophages in LPS-challenged mice. Representative photographs of F4/80 immunofluorescence staining from liver sections of phosphate-buffered saline (PBS) or LPS-injected Dnajb4+/+ and Dnajb4−/− mice. Eight hours after LPS injection, mice were sacrificed and liver was fixed, dehydrated, embedded, cryosectioned into 8 μm thickness, and incubated with anti-F4/80 antibodies to stain mature macrophages (red). (E) Quantitation of F4/80+ macrophages. Positively stained cells were counted at ×400 magnification in 6 fields from 3 sections/mouse and from 5 mice/group. Data are mean ± standard deviation (SD). Significance was calculated by using two-tailed, unpaired Student’t t-test. *p < 0.05.
-
Figure 2—figure supplement 1—source data 1
Data for graphs depicted in Figure 2—figure supplement 1A–C, E.
- https://cdn.elifesciences.org/articles/76094/elife-76094-fig2-figsupp1-data1-v2.xlsx
Figure 3 with 1 supplement
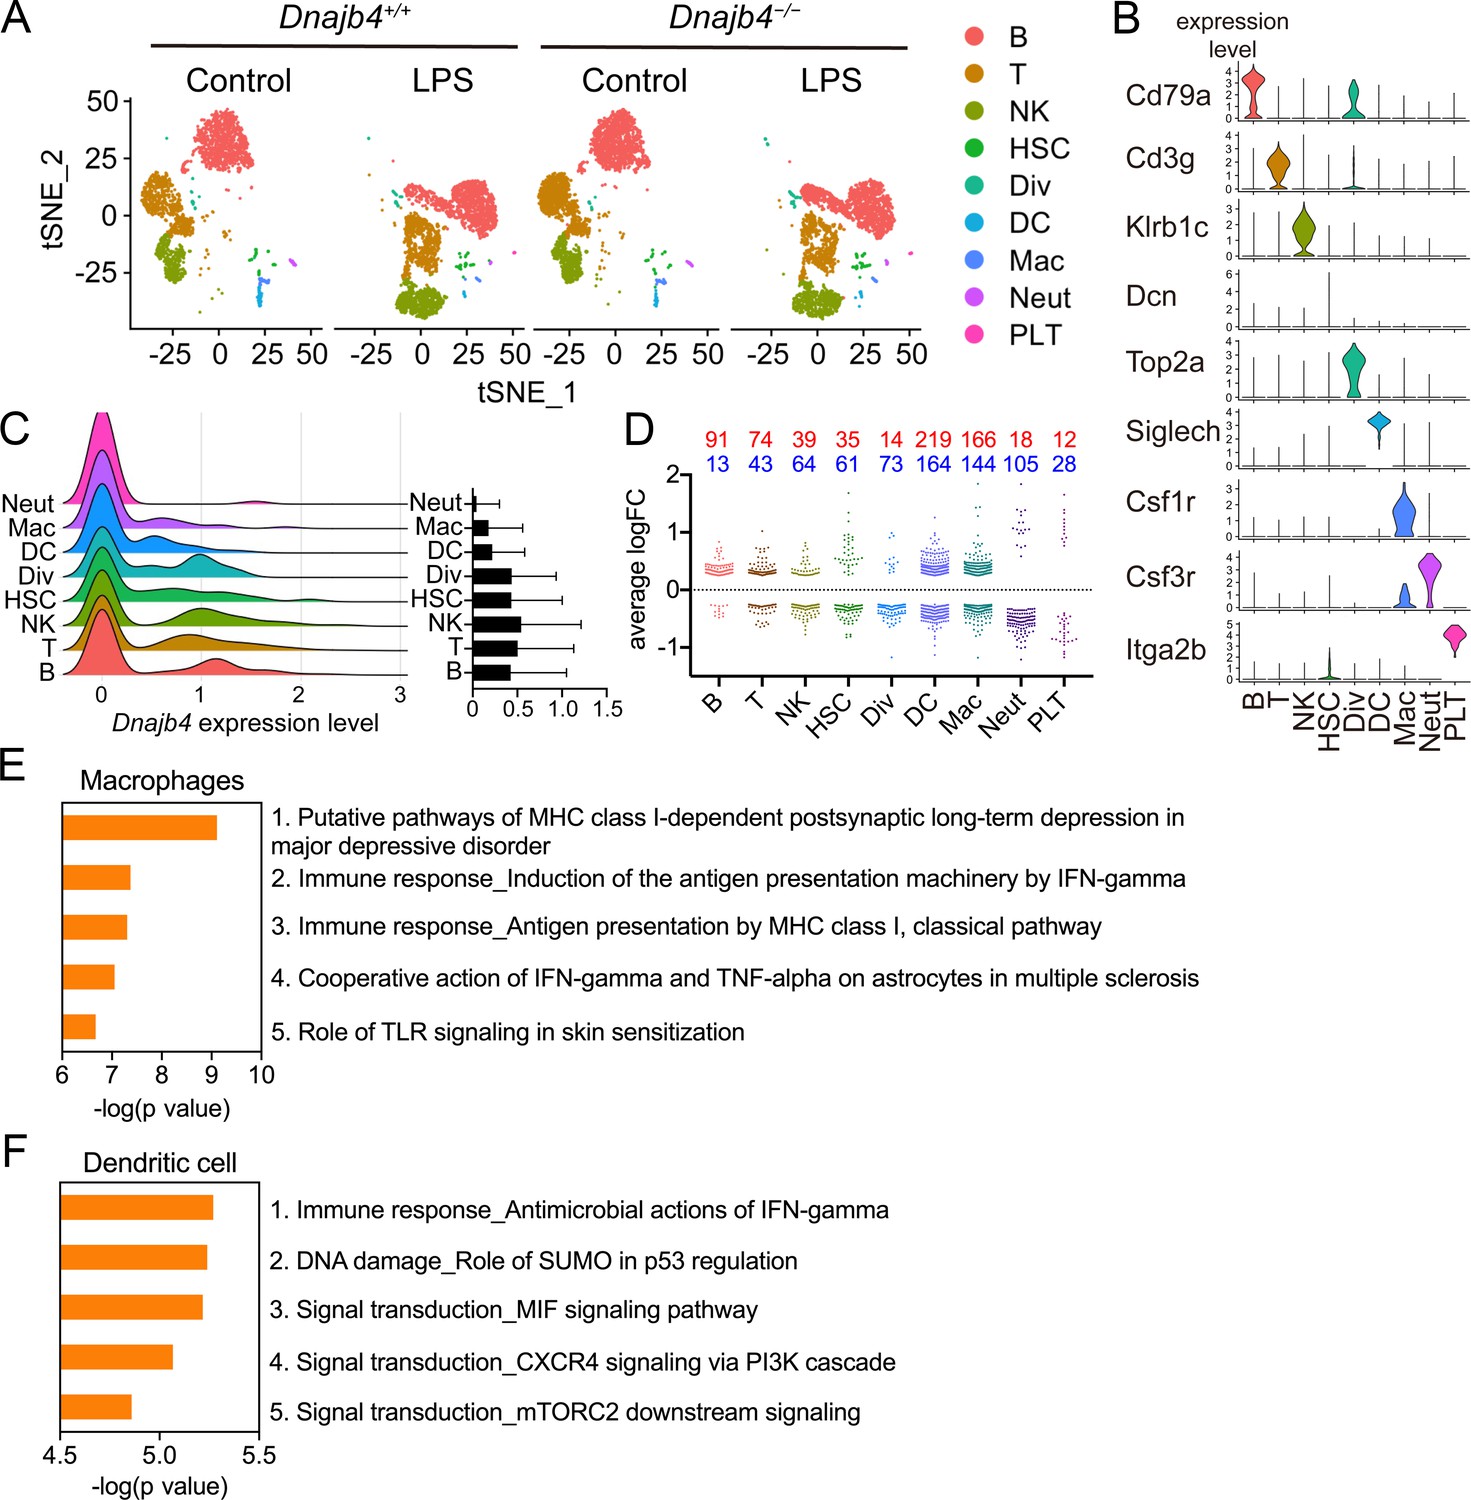
Single-cell RNA sequencing (scRNA-seq) reveals activated IFN-γ-mediated signaling pathways in macrophages and dendritic cells.
(A) Mice were injected with 20 mg/kg lipopolysaccharide (LPS), or phosphate-buffered saline (PBS) as a control, and after 8 hr hepatic nonparenchymal cells were isolated for scRNA-seq analysis. The plot shows the t-distributed stochastic neighbor embedding (t-SNE) visualization of liver nonparenchymal cell clusters based on 11,651 single-cell transcriptomes. B, B cells; T, T cells; NK, NK cells; HSC, hepatic stellate cells; Div, dividing cells; DC, dendritic cells; Mac, macrophages; Neut, neutrophils; PLT, platelets. (B) Expression levels of representative known marker genes for each cluster. (C) Visualization of expression distribution of the Dnajb4 gene in each cluster of cells in PBS-treated Dnajb4+/+ mice. Data presented are means ± standard deviation (SD). (D) Cell-type distribution and log-transformed expression fold change (logFC) for upregulated (red) and downregulated (blue) genes from a comparison of LPS-treated Dnajb4+/+ mice with LPS-treated Dnajb4−/− mice. The Wilcoxon rank-sum test was used to identify differentially expressed genes (p < 0.05, |logFC| > 0.25). Enrichment analysis showing ranked pathway signatures associated with up- and downregulated genes (p < 0.05, |logFC| > 0.25) from a comparison of macrophages (E) and dendritic cells (F) from LPS-injected Dnajb4+/+ mice with those from Dnajb4−/− mice.
-
Figure 3—source data 1
Data for graphs depicted in Figure 3D–F.
- https://cdn.elifesciences.org/articles/76094/elife-76094-fig3-data1-v2.xlsx
Figure 3—figure supplement 1
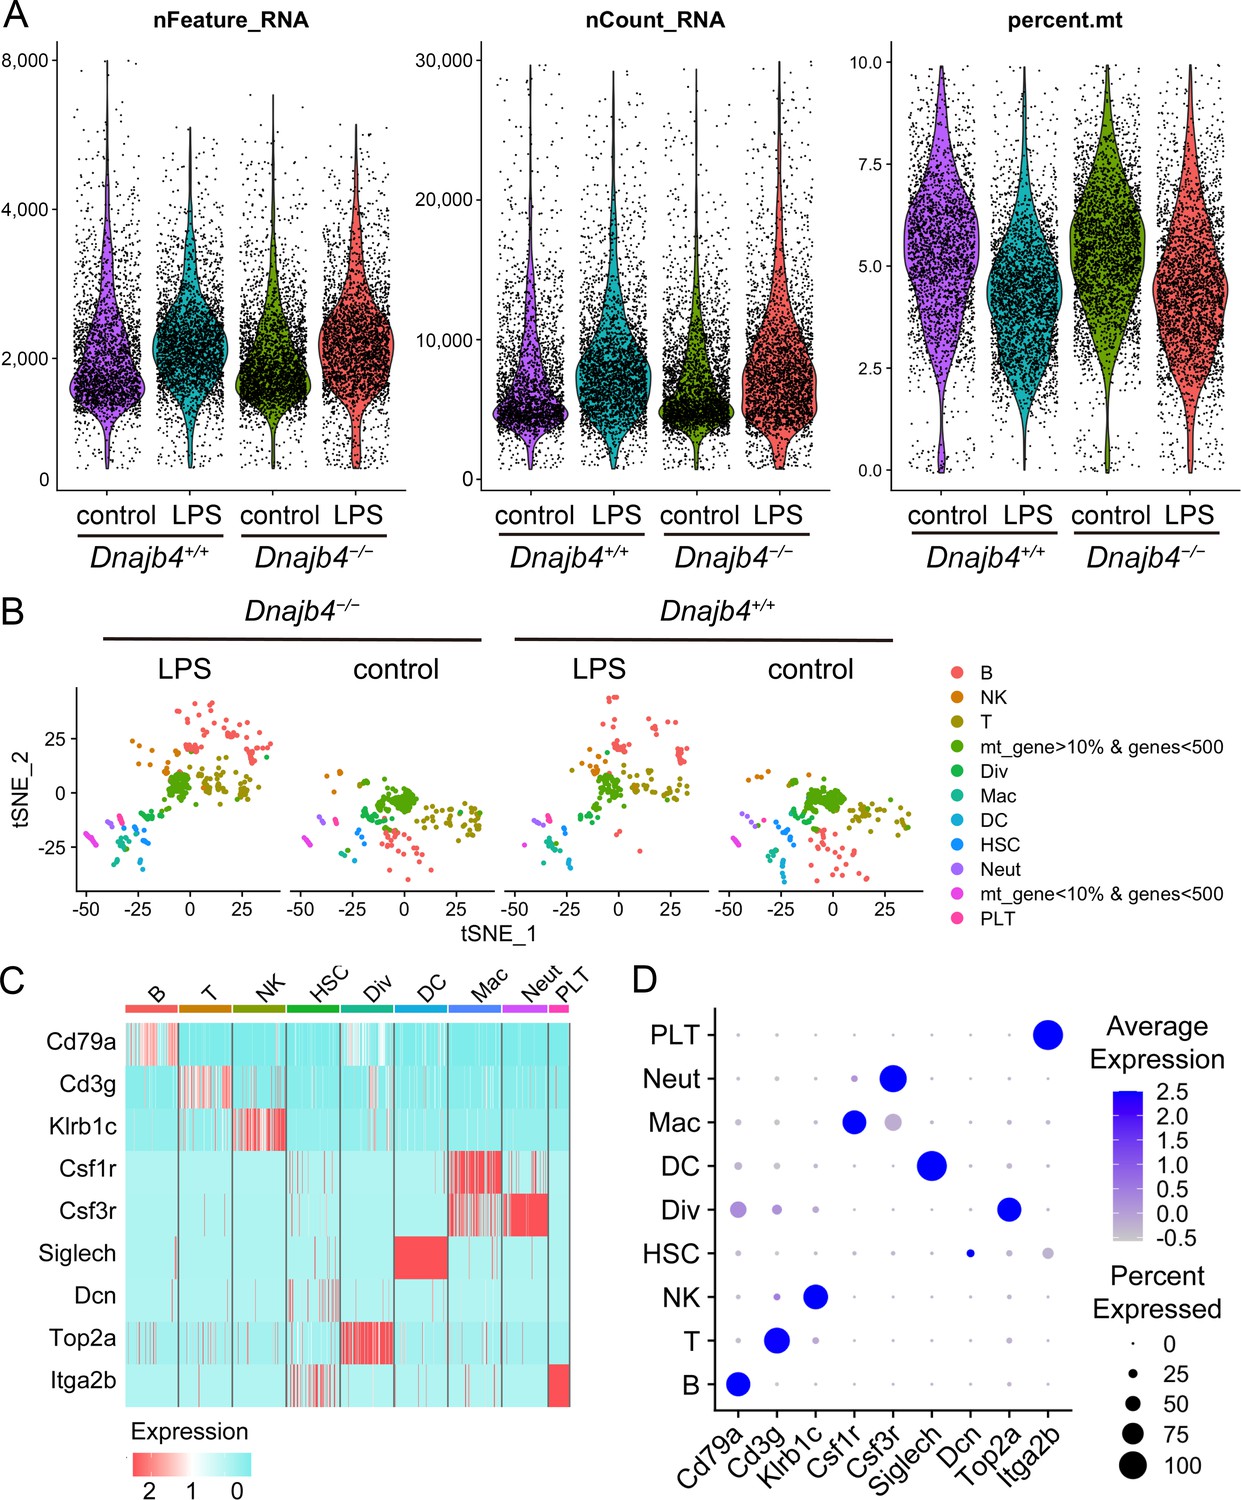
Quality control of single-cell RNA sequencing (scRNA-seq) data.
(A) Cells with unique molecular identifier (UMI) count of greater than 30,000, fewer than 500, or greater than 6000 genes, and >10% of total expression from mitochondrial genes were excluded. (B) t-Distributed stochastic neighbor embedding (t-SNE) visualization of 1917 excluded cells in which UMI count of greater than 30,000, fewer than 500, or greater than 6000 genes, and >10% of total expression from mitochondrial genes. (C) Heat map and (D) dot plot of known marker genes expression in each cell cluster.
Figure 4 with 1 supplement
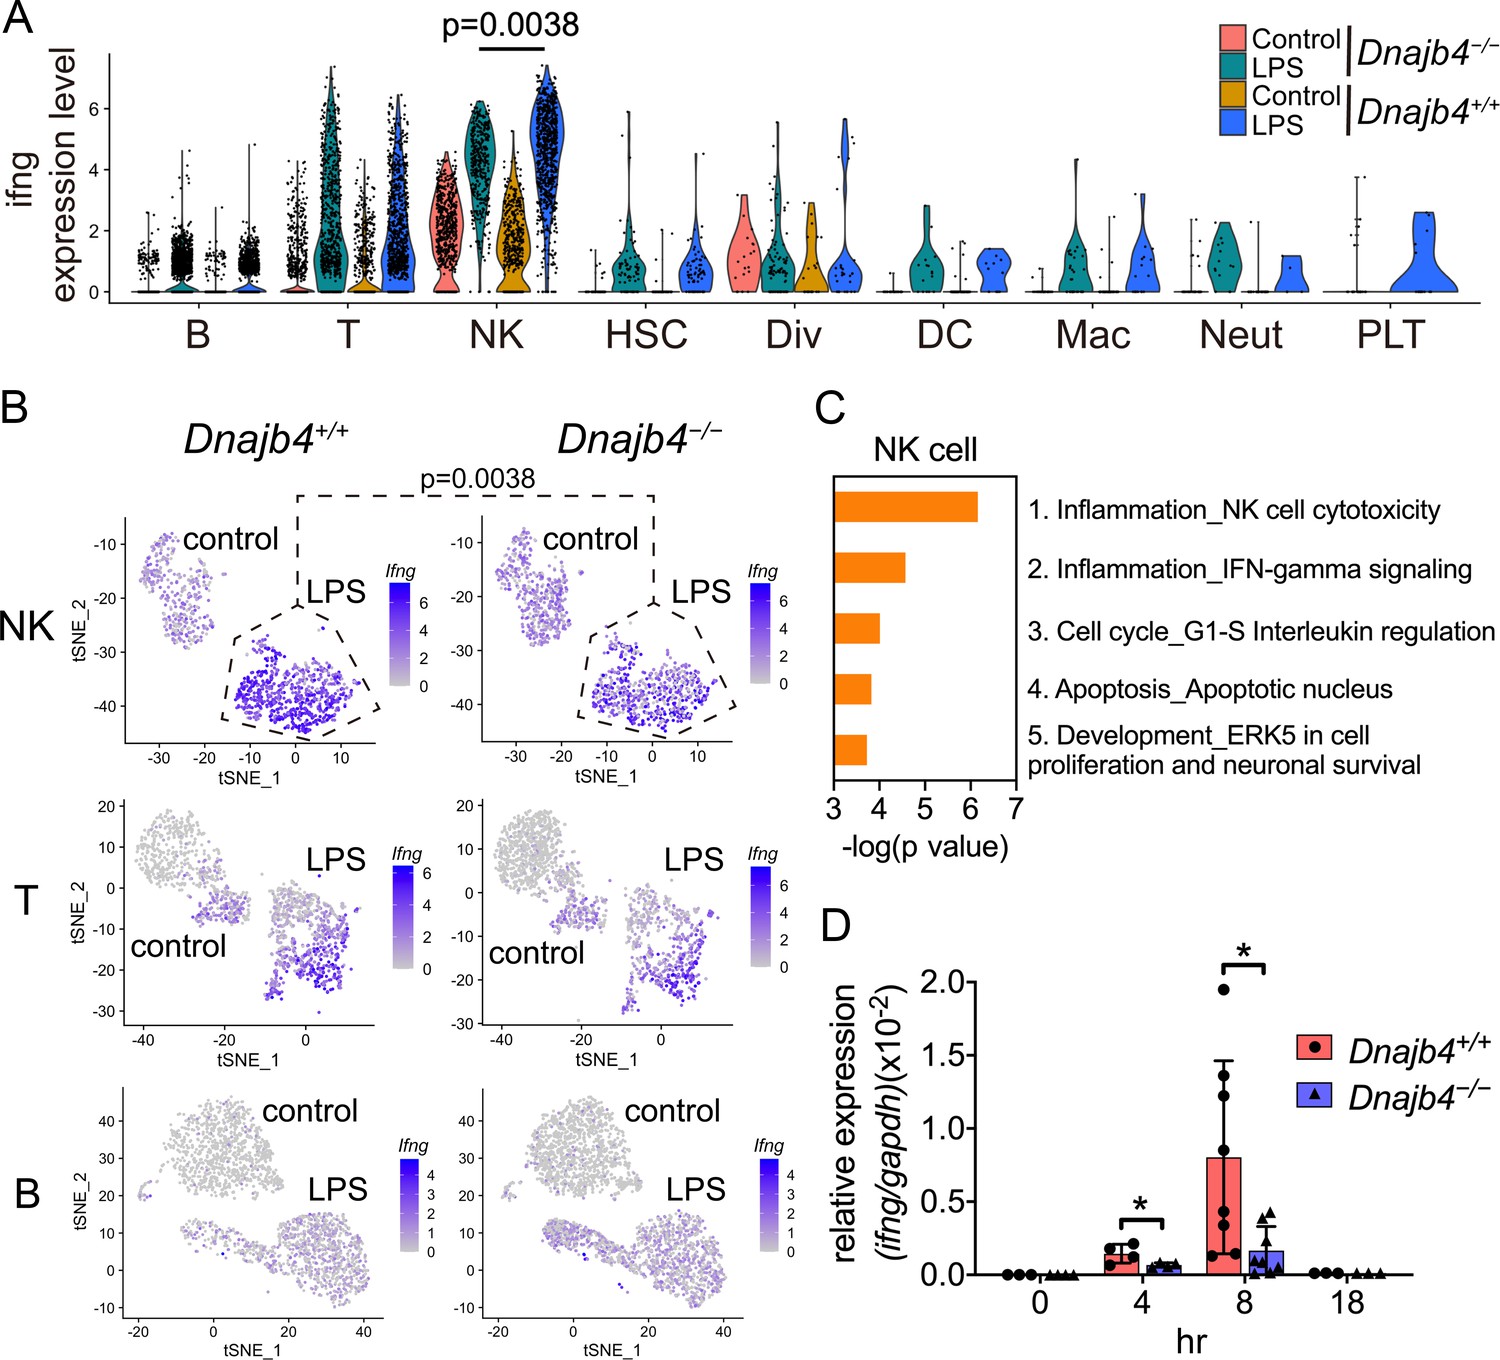
HLJ1 deficiency leads to altered IFN-γ-related signatures in natural killer (NK) cells under lipopolysaccharide (LPS) stress.
(A) Violin plot showing IFN-γ expression levels in each type of cell. Significance was calculated using the Wilcoxon rank-sum test. (B) t-Distributed stochastic neighbor embedding (t-SNE) visualization of IFN-γ expression profiles in NK, T, and B cells isolated from Dnajb4+/+ and Dnajb4−/− mice injected with LPS. Significance was calculated using the Wilcoxon rank-sum test. (C) Enrichment analysis showing ranked network signatures associated with up- and downregulated genes (p < 0.05, |logFC| > 0.25) from a comparison of NK cells from LPS-injected Dnajb4+/+ mice with NK cells from Dnajb4−/− mice. (D) Dnajb4+/+ and Dnajb4−/− mice (n = 4-9 mice/group) were injected with LPS and, at the indicated time points, whole liver mRNA was extracted for the measurement of hepatic IFN-γ expression levels via quantitative real-time PCR (qRT-PCR). p = 0.026 and p = 0.014 for the 4 and 8 hr groups, respectively. Data presented are means ± standard deviation (SD). Statistical analysis was performed by using the two-tailed, unpaired Student’s t-test. *p < 0.05.
-
Figure 4—source data 1
Data for graphs depicted in Figure 4C, D.
- https://cdn.elifesciences.org/articles/76094/elife-76094-fig4-data1-v2.xlsx
Figure 4—figure supplement 1
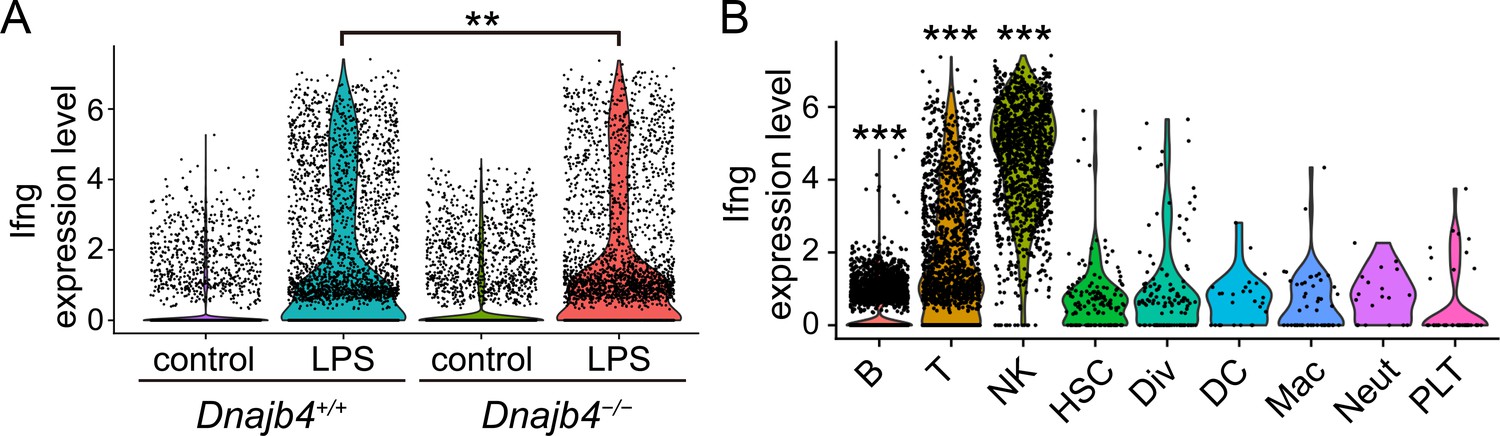
IFN-γ gene expression analysis was split according to treatment, genotype or cell type.
(A) IFN-γ gene expression levels in each cell. Significance was calculated using the Wilcoxon rank-sum test; p = 0.009. (B) IFN-γ expression patterns in B (p < 0.001), T (p < 0.001), and natural killer (NK) (p < 0.001) cells and other clusters in lipopolysaccharide (LPS)-treated mice. Significance was calculated using the Wilcoxon rank-sum test. **p < 0.01, ***p < 0.001.
Figure 5 with 1 supplement
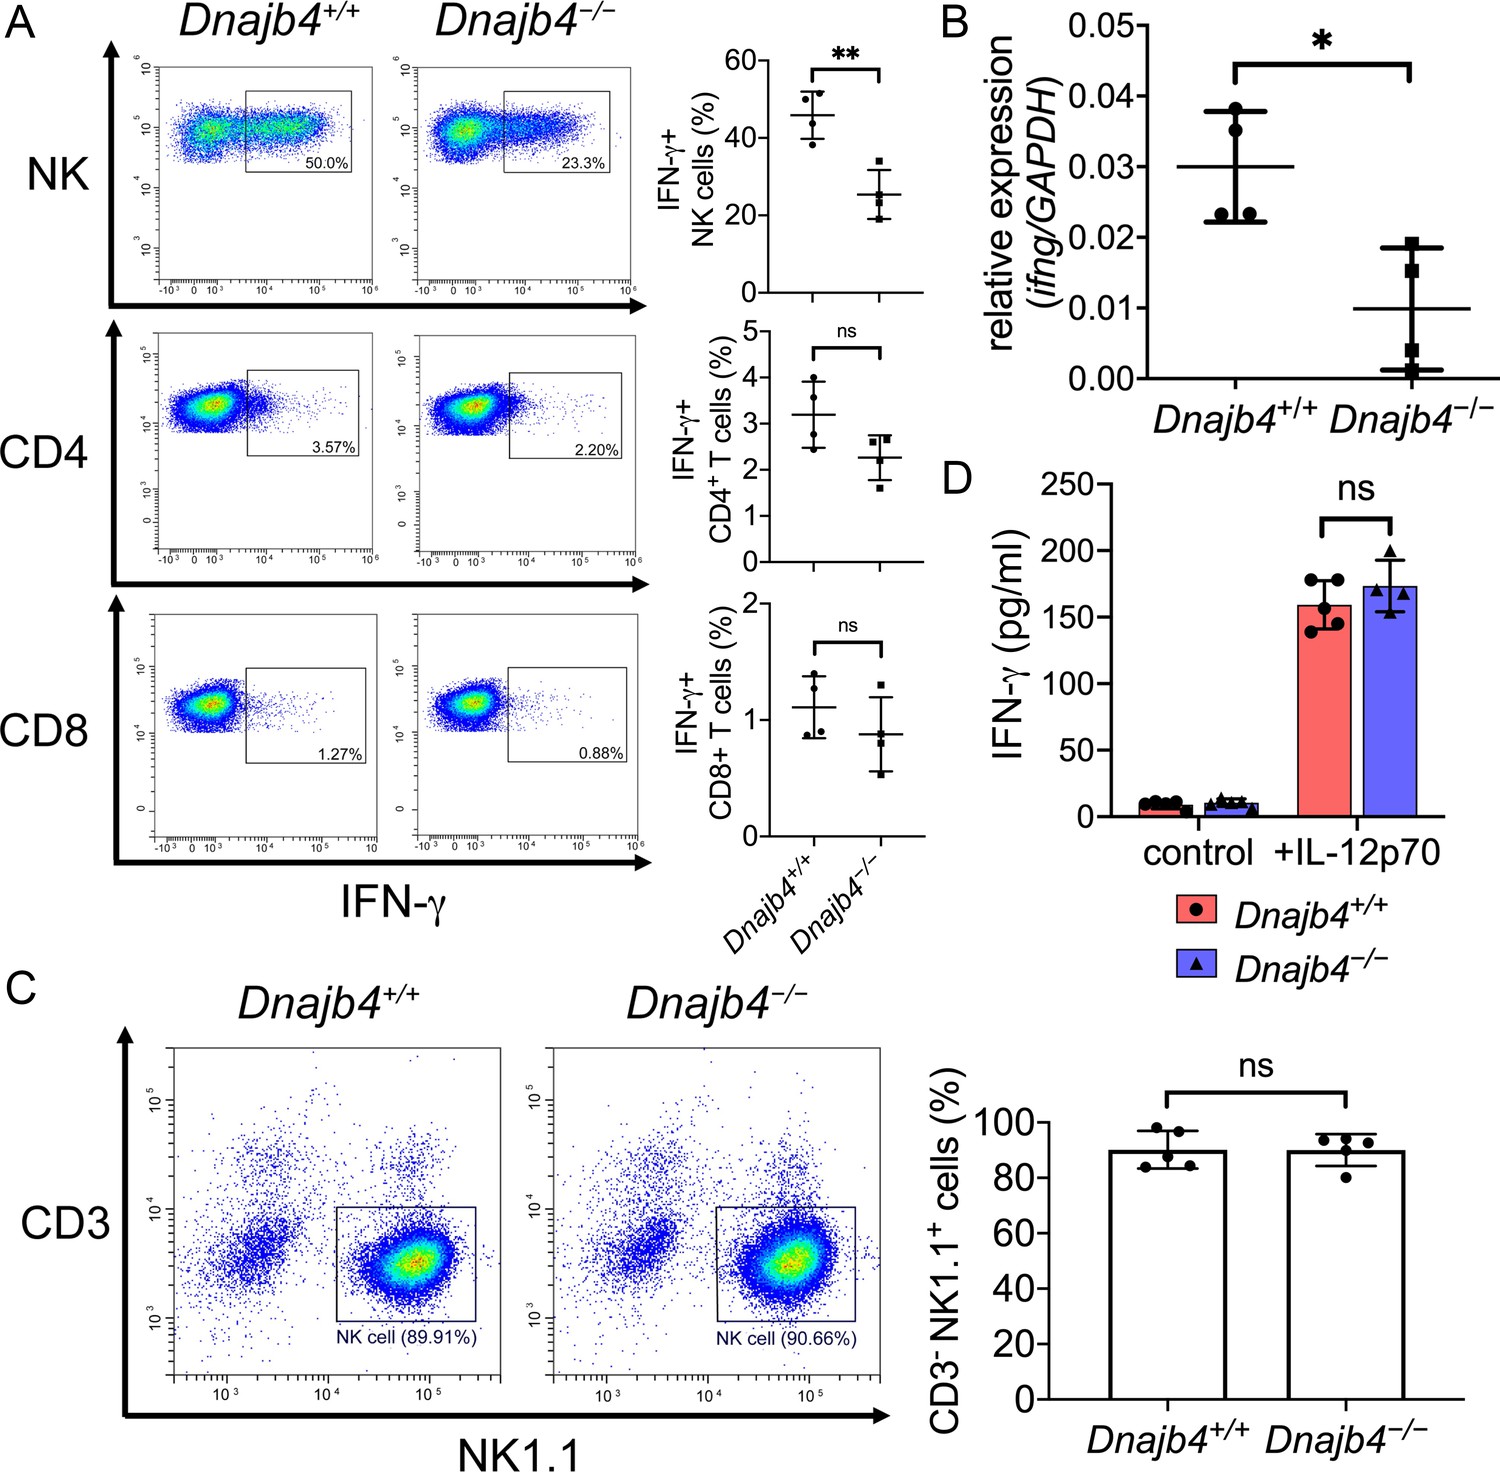
Intracellular IFN-γ levels decreased in splenic natural killer (NK) cells after HLJ1 deletion.
(A) Dnajb4+/+ and Dnajb4−/− mice (n = 4 per group) were injected intraperitoneally with 20 mg/kg lipopolysaccharide (LPS), and splenocytes were isolated after 2.5 hr. Expression of intracellular IFN-γ levels in Dnajb4+/+ and Dnajb4−/− NK, CD4+ T, and CD8+ T cells were detected via flow cytometry analysis. NK cells, p = 0.004. Representative samples are shown. (B) RNA from n = 4 mice spleens were isolated 4 hr after LPS administration, and transcriptional levels of IFN-γ were quantified via quantitative real-time PCR (qRT-PCR); p = 0.014. (C) Expression of NK1.1 in primary NK cells isolated from Dnajb4+/+ and Dnajb4−/− mice (n = 5 per group) was detected via flow cytometry. Representative samples are shown. (D) Primary NK cells purified from Dnajb4+/+ and Dnajb4−/− mice spleens were treated with 10 ng/ml IL-12p70 for 24 hr and supernatant IFN-γ was quantified using ELISA (n = 4–5 biological replicates). Data presented are means ± standard deviation (SD). Statistical analysis was performed by using the two-tailed, unpaired Student’s t-test. *p < 0.05, **p < 0.01, n.s., not significant.
-
Figure 5—source data 1
Data for graphs depicted in Figure 5A–D.
- https://cdn.elifesciences.org/articles/76094/elife-76094-fig5-data1-v2.xlsx
Figure 5—figure supplement 1
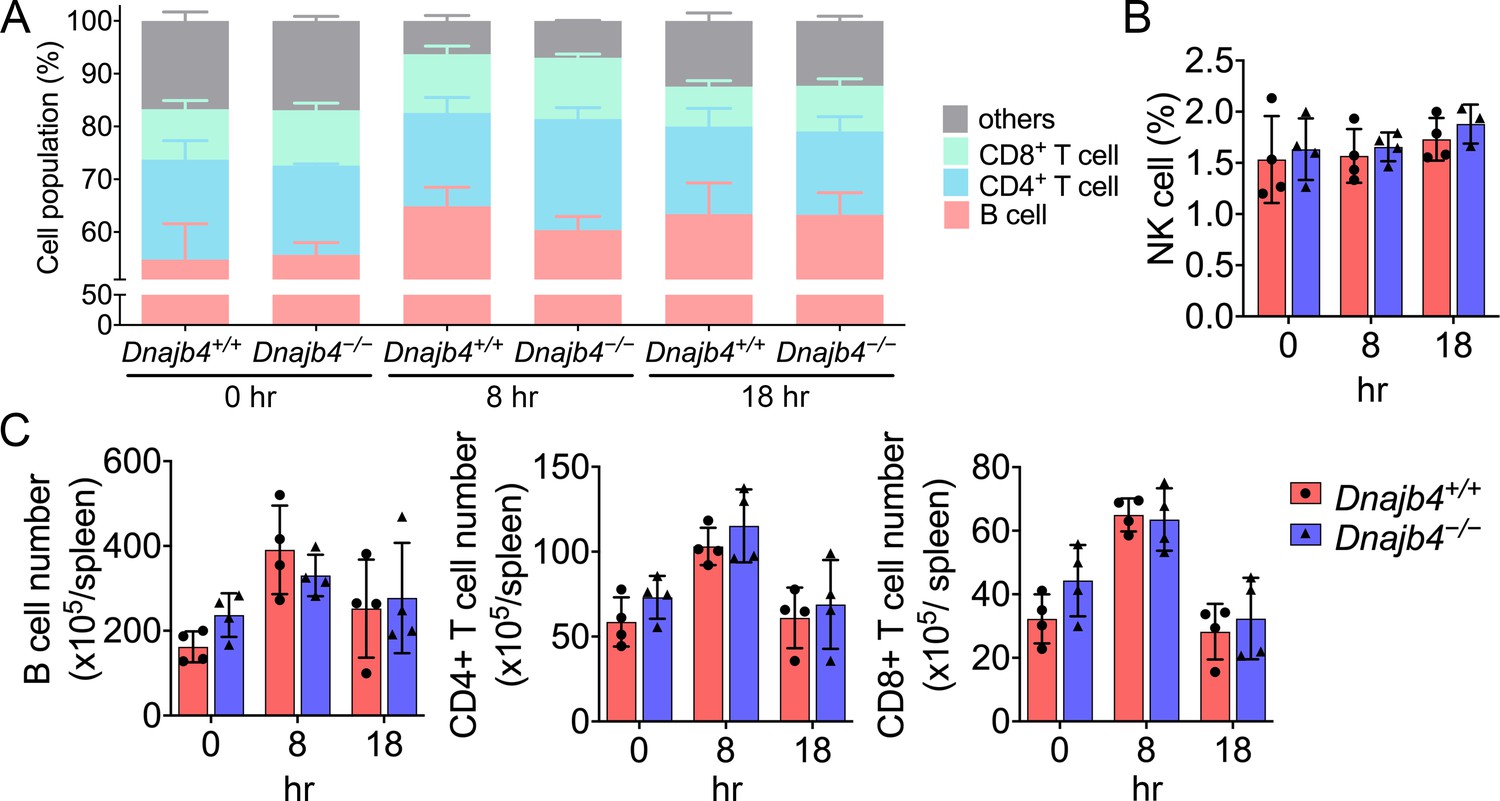
Splenic immune cell population identification of Dnajb4+/+ and Dnajb4−/− mice.
(A) CD4+, CD8+ T cell, and B cell population and (B) natural killer (NK) cell population are presented as percentage. Splenic immune cells were isolated from lipopolysaccharide (LPS)-treated Dnajb4+/+ and Dnajb4−/− mice (n = 4 mice/group) and were identified with surface markers of B, CD4+ T, and CD8+ T cells by flow cytometry. (C) Immune cells population are presented as total number. Data presented are means ± standard deviation (SD). Statistical analysis was performed by using the two-tailed, unpaired Student’s t-test.
-
Figure 5—figure supplement 1—source data 1
Data for graphs depicted in Figure 5—figure supplement 1A–C.
- https://cdn.elifesciences.org/articles/76094/elife-76094-fig5-figsupp1-data1-v2.xlsx
Figure 6
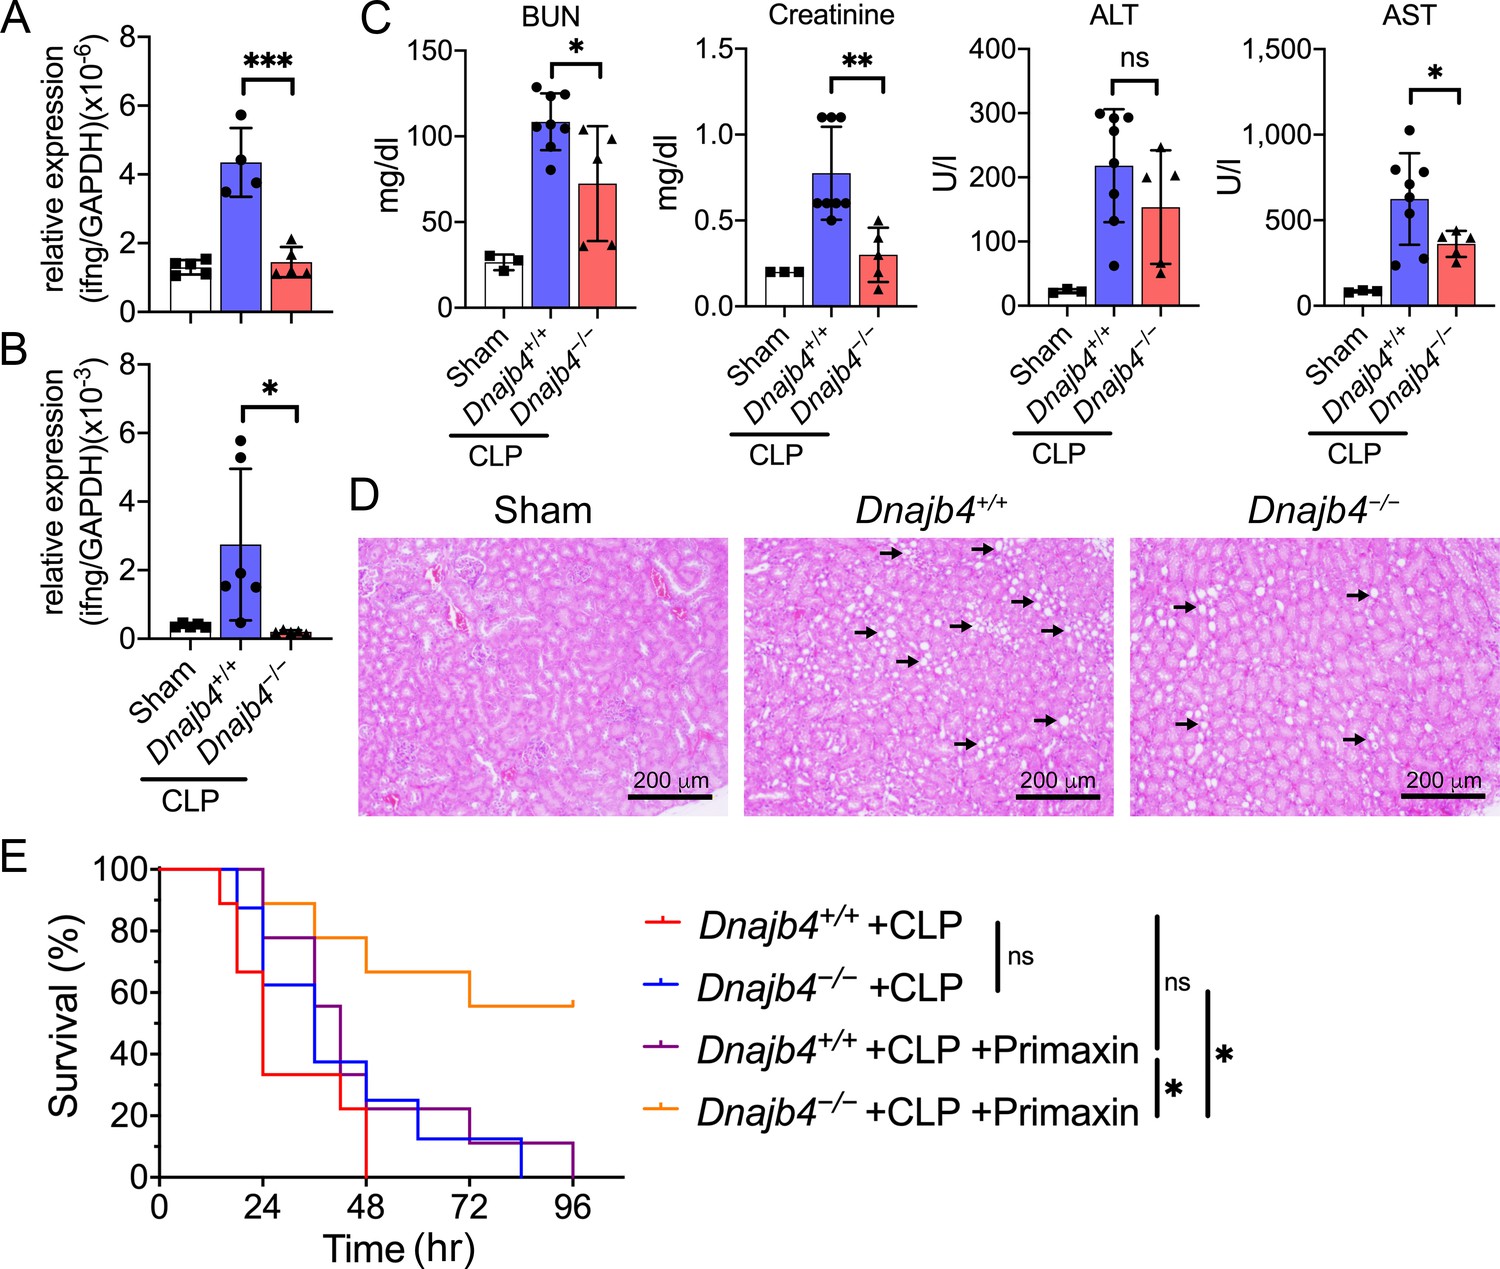
HLJ1 deletion protect mice from CLP-induced organ dysfunction and septic death.
(A) CLP or sham surgery were performed on Dnajb4+/+ and Dnajb4−/− mice, and after 18 hr whole liver mRNA was extracted for the measurement of IFN-γ expression levels via quantitative real-time PCR (qRT-PCR) (n = 5–6). p < 0.001. (B) Spleen mRNA was also extracted for the measurement of IFN-γ expression levels via qRT-PCR (n = 5–6). p = 0.031. (C) Serum levels of BUN, creatinine, ALT, and AST were analyzed 18 hr after sham (n = 3) or CLP surgery (n = 5–8). BUN, p = 0.024; creatinine, p = 0.005; ALT, p = 0.225; AST, p = 0.048. (D) Representative images of H&E staining of sham and CLP mouse kidney sections. Scale bar: 200 μm. Black arrows indicate kidney injury. (E) Kaplan–Meier analysis of overall survival of Dnajb4+/+ and Dnajb4−/− mice. Mice were i.p. injected with 25 mg/kg imipenem/cilastatin (Primaxin) immediately after CLP. Antibiotic treatment was continued twice per day throughout the observation period (n = 8–11 per group). Dnajb4−/− + CLP + Primaxin versus Dnajb4−/− + CLP + Primaxin, p = 0.013; Dnajb4−/− + CLP versus Dnajb4−/− + CLP + Primaxin, p = 0.010. Data presented are means ± standard deviation (SD). Statistical analysis was performed by using the two-tailed, unpaired Student’s t-test. Log-rank Mantel-Cox test was used to compare survival curve. *p < 0.05, **p < 0.01, ***p < 0.001, ns, not significant.
-
Figure 6—source data 1
Data for graphs depicted in Figure 6A–C, E.
- https://cdn.elifesciences.org/articles/76094/elife-76094-fig6-data1-v2.xlsx
Figure 7
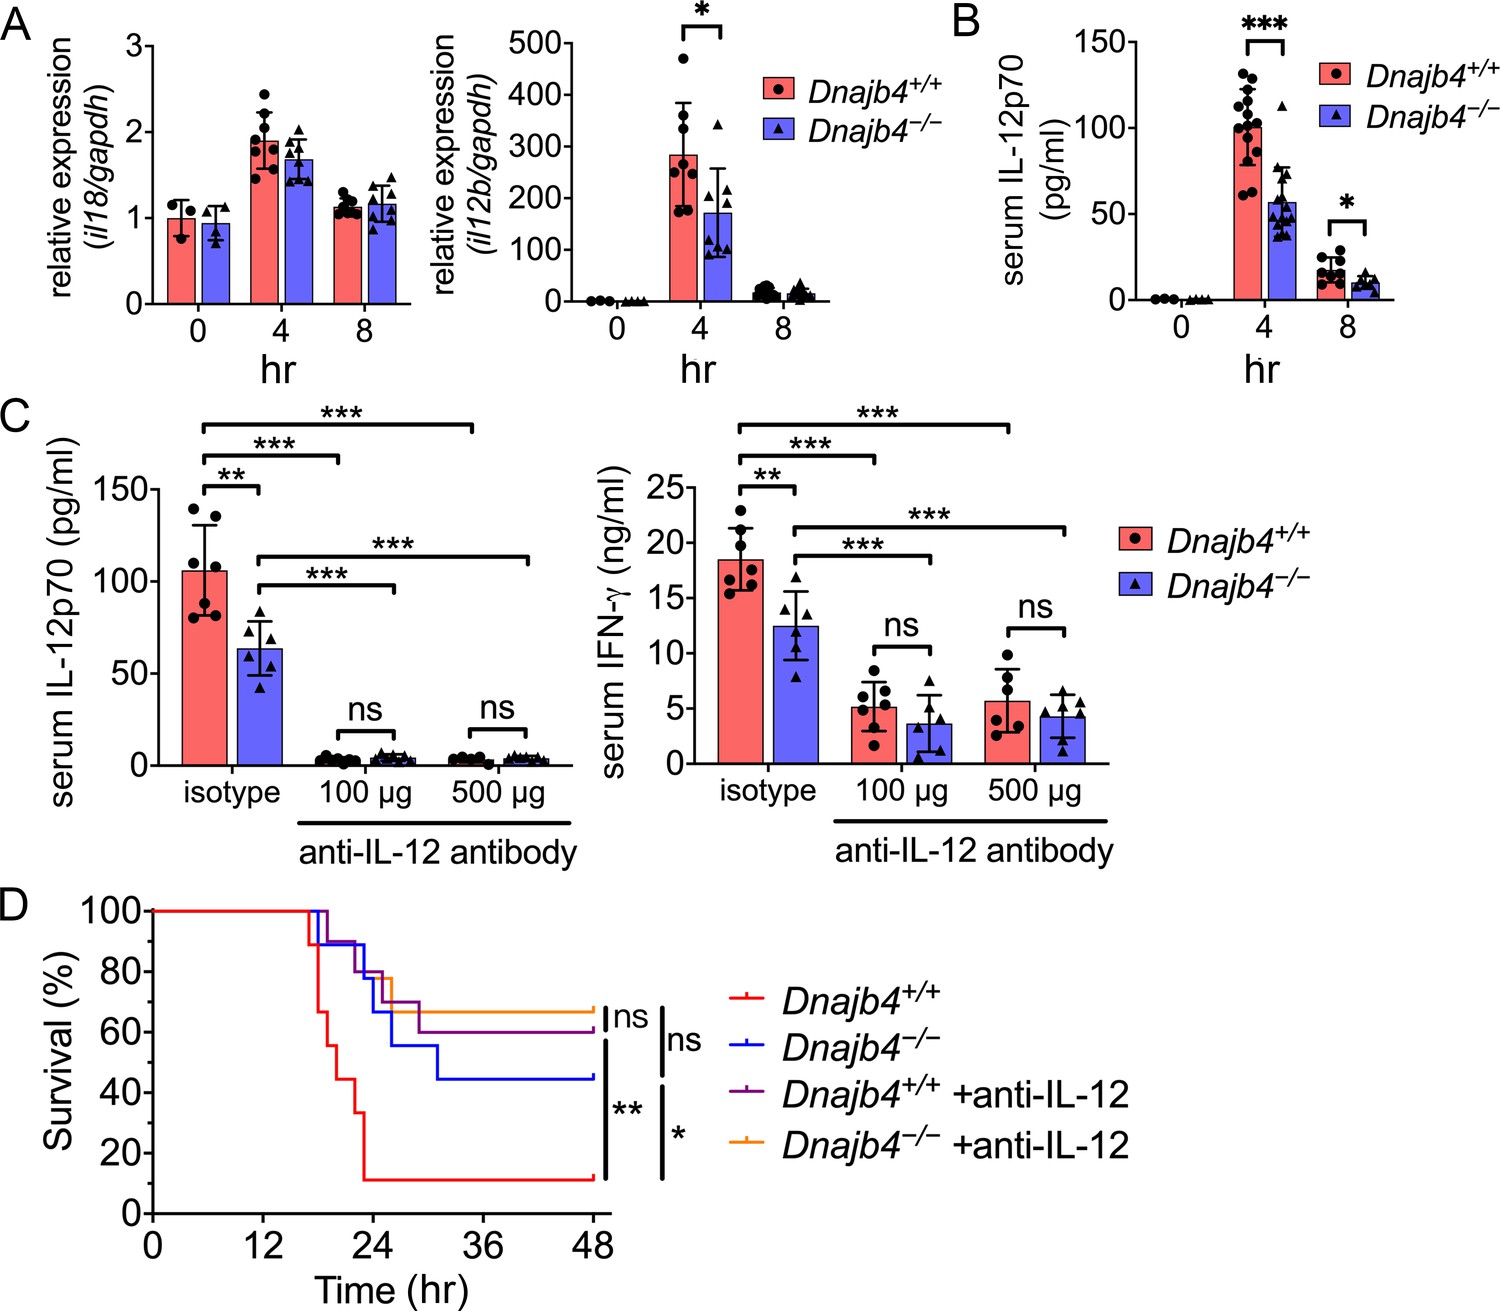
HLJ1 deletion alleviates IL-12-dependent septic death.
Dnajb4+/+ and Dnajb4−/− mice were intraperitoneally injected with 20 mg/kg lipopolysaccharide (LPS). (A) After 4 or 8 hr, the RNA from n = 6–8 total livers were isolated and gene expression levels were quantified via qRT-PCR. IL-12b, p = 0.029. (B) Serum levels of IL-12p70 in LPS-treated Dnajb4+/+ and Dnajb4−/− mice were quantified via ELISA 4 hr (n = 11–14) and 8 hr (n = 4–7) after LPS administration. 4 hr IL-12p70, p < 0.001; 8 hr IL-12p70, p = 0.033. (C) Dnajb4+/+ and Dnajb4−/− mice were intraperitoneally injected with anti-IL-12 neutralizing antibodies 1 hr prior to the injection of 20 mg/kg LPS. After the administration of LPS and anti-IL-12 antibodies, the serum was collected at the indicated time points and analyzed for IL-12 and IFN-γ levels. (D) Kaplan–Meier analysis of overall survival of Dnajb4+/+ and Dnajb4−/− mice injected with 100 μg anti-IL-12 neutralizing antibodies 1 hr before the 20 mg/kg LPS challenge (n = 9–11 per group). Dnajb4+/+ versus Dnajb4−/− mice, p = 0.014; Dnajb4+/+ versus Dnajb4+/+ + anti-IL-12, p = 0.007. Data presented are means ± standard deviation (SD). Statistical analysis was performed by using the two-tailed, unpaired Student’s t-test. Log-rank Mantel-Cox test was used to compare survival curve. *p < 0.05, **p < 0.01, ***p < 0.001, ns, not significant.
-
Figure 7—source data 1
Data for graphs depicted in Figure 7A–D.
- https://cdn.elifesciences.org/articles/76094/elife-76094-fig7-data1-v2.xlsx
Figure 8 with 1 supplement

HLJ1 deletion in macrophages reduced serum levels of IL-12 and IFN-γ and mitigated septic death in vivo.
(A) 200 μl clodronate liposomes (Clo-Lip) were administered intravenously to Dnajb4+/+ and Dnajb4−/− mice to deplete their endogenous macrophages. After 48 hr, the mice were intravenously injected with 1 × 10⁶ bone marrow-derived macrophages (BMDMs) isolated from Dnajb4+/+ or Dnajb4−/− mice. After BMDM transplantation, Dnajb4+/+ and Dnajb4−/− mice were administered with 20 mg/kg lipopolysaccharide (LPS) and serum was collected at 4 or 8 hr for IL-12 or IFN-γ quantification, respectively. (B) Representative photographs of F4/80 immunofluorescence staining of liver sections from phosphate-buffered saline (PBS) liposome or clodronate liposome-injected Dnajb4+/+ and Dnajb4−/− mice. The liver was fixed, dehydrated, embedded, cryosectioned into slices 8 μm thick, and incubated with anti-F4/80 antibodies to stain the mature macrophages (green). The scale bar represents 100 μm. (C) Mice transplanted with Dnajb4+/+ BMDMs (Dnajb4+/+ MΦ) or Dnajb4−/− BMDMs (Dnajb4−/− MΦ) were administered LPS, and serum from n = 4–5 mice was analyzed for IL-12p70 and IFN-γ levels via ELISA. Data presented are means ± standard deviation (SD). Statistical analysis was performed by using the two-tailed, unpaired Student’s t-test. (D) Kaplan–Meier analysis of the overall survival of LPS-injected Dnajb4+/+ and Dnajb4−/− mice transplanted with Dnajb4+/+ and Dnajb4−/− BMDMs (n = 9–10 per group). For Dnajb4+/++Dnajb4+/+ MΦ versus Dnajb4+/++Dnajb4−/− MΦ, p = 0.037. For Dnajb4−/−+Dnajb4−/− MΦ versus Dnajb4−/−+Dnajb4+/+ MΦ, p = 0.036. Log-rank Mantel-Cox test was used to compare survival curve. *p < 0.05, **p < 0.01, ***p < 0.001.
-
Figure 8—source data 1
Data for graphs depicted in Figure 8C, D.
- https://cdn.elifesciences.org/articles/76094/elife-76094-fig8-data1-v2.xlsx
Figure 8—figure supplement 1
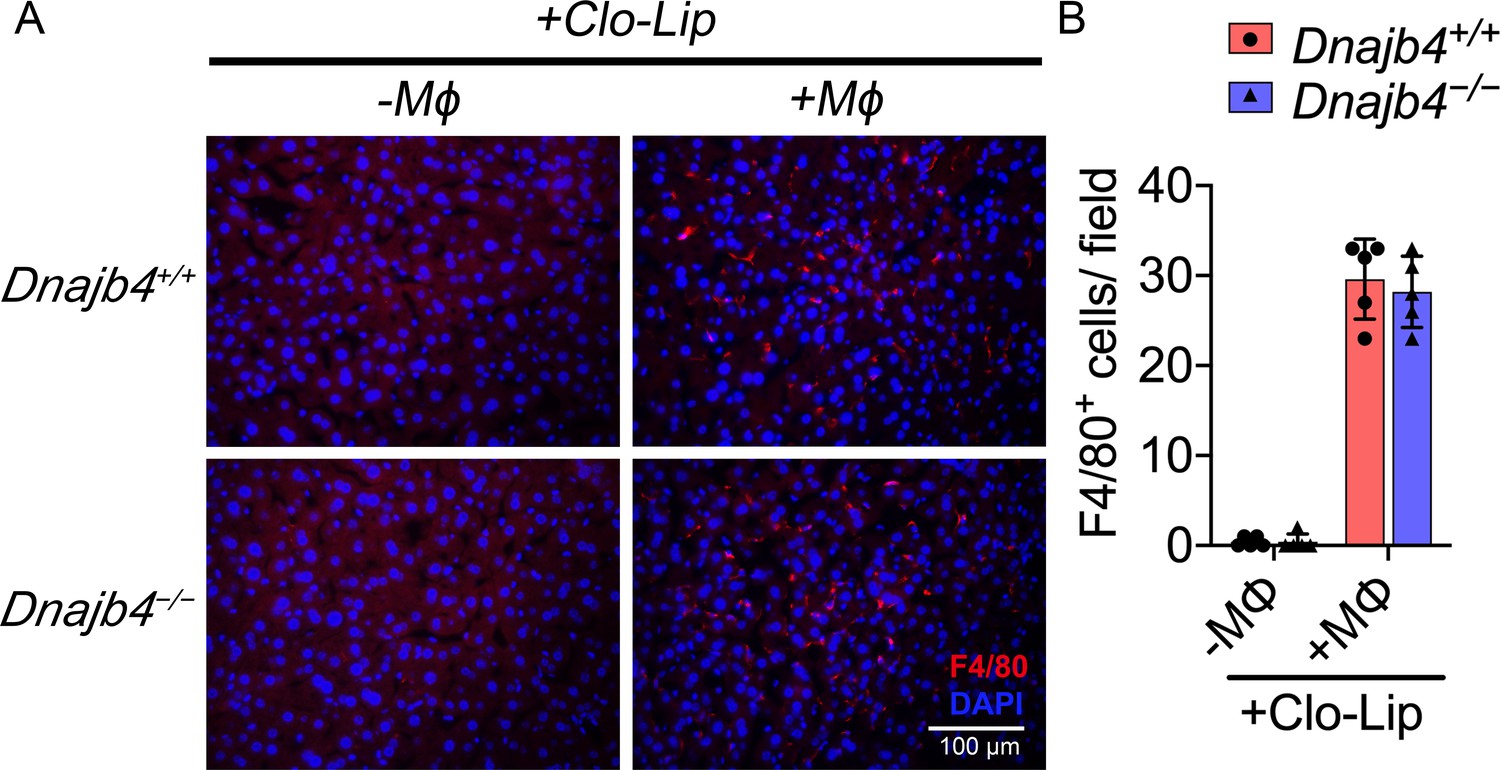
Quantification of liver macrophages in bone marrow-derived macrophage (BMDM)-transplanted mice.
(A) Representative photographs of F4/80 immunofluorescence staining from liver sections of Dnajb4+/+ and Dnajb4−/− mice with BMDMs adoptive transfer or with Clo-Lip alone. 24 hr after i.v. injection of BMDMs, mice were sacrificed and liver was fixed, dehydrated, embedded, cryosectioned into 8 μm thickness, and incubated with anti-F4/80 antibodies to stain mature macrophages (red). (B) Quantitation of F4/80+ macrophages. Positively stained cells were counted at ×400 magnification in 6 fields from 3 sections/mouse and from 5 mice/group. Statistical analysis was performed by using the two-tailed, unpaired Student’s t-test.
-
Figure 8—figure supplement 1—source data 1
Data for graphs depicted in Figure 8—figure supplement 1B.
- https://cdn.elifesciences.org/articles/76094/elife-76094-fig8-figsupp1-data1-v2.xlsx
Figure 9 with 2 supplements
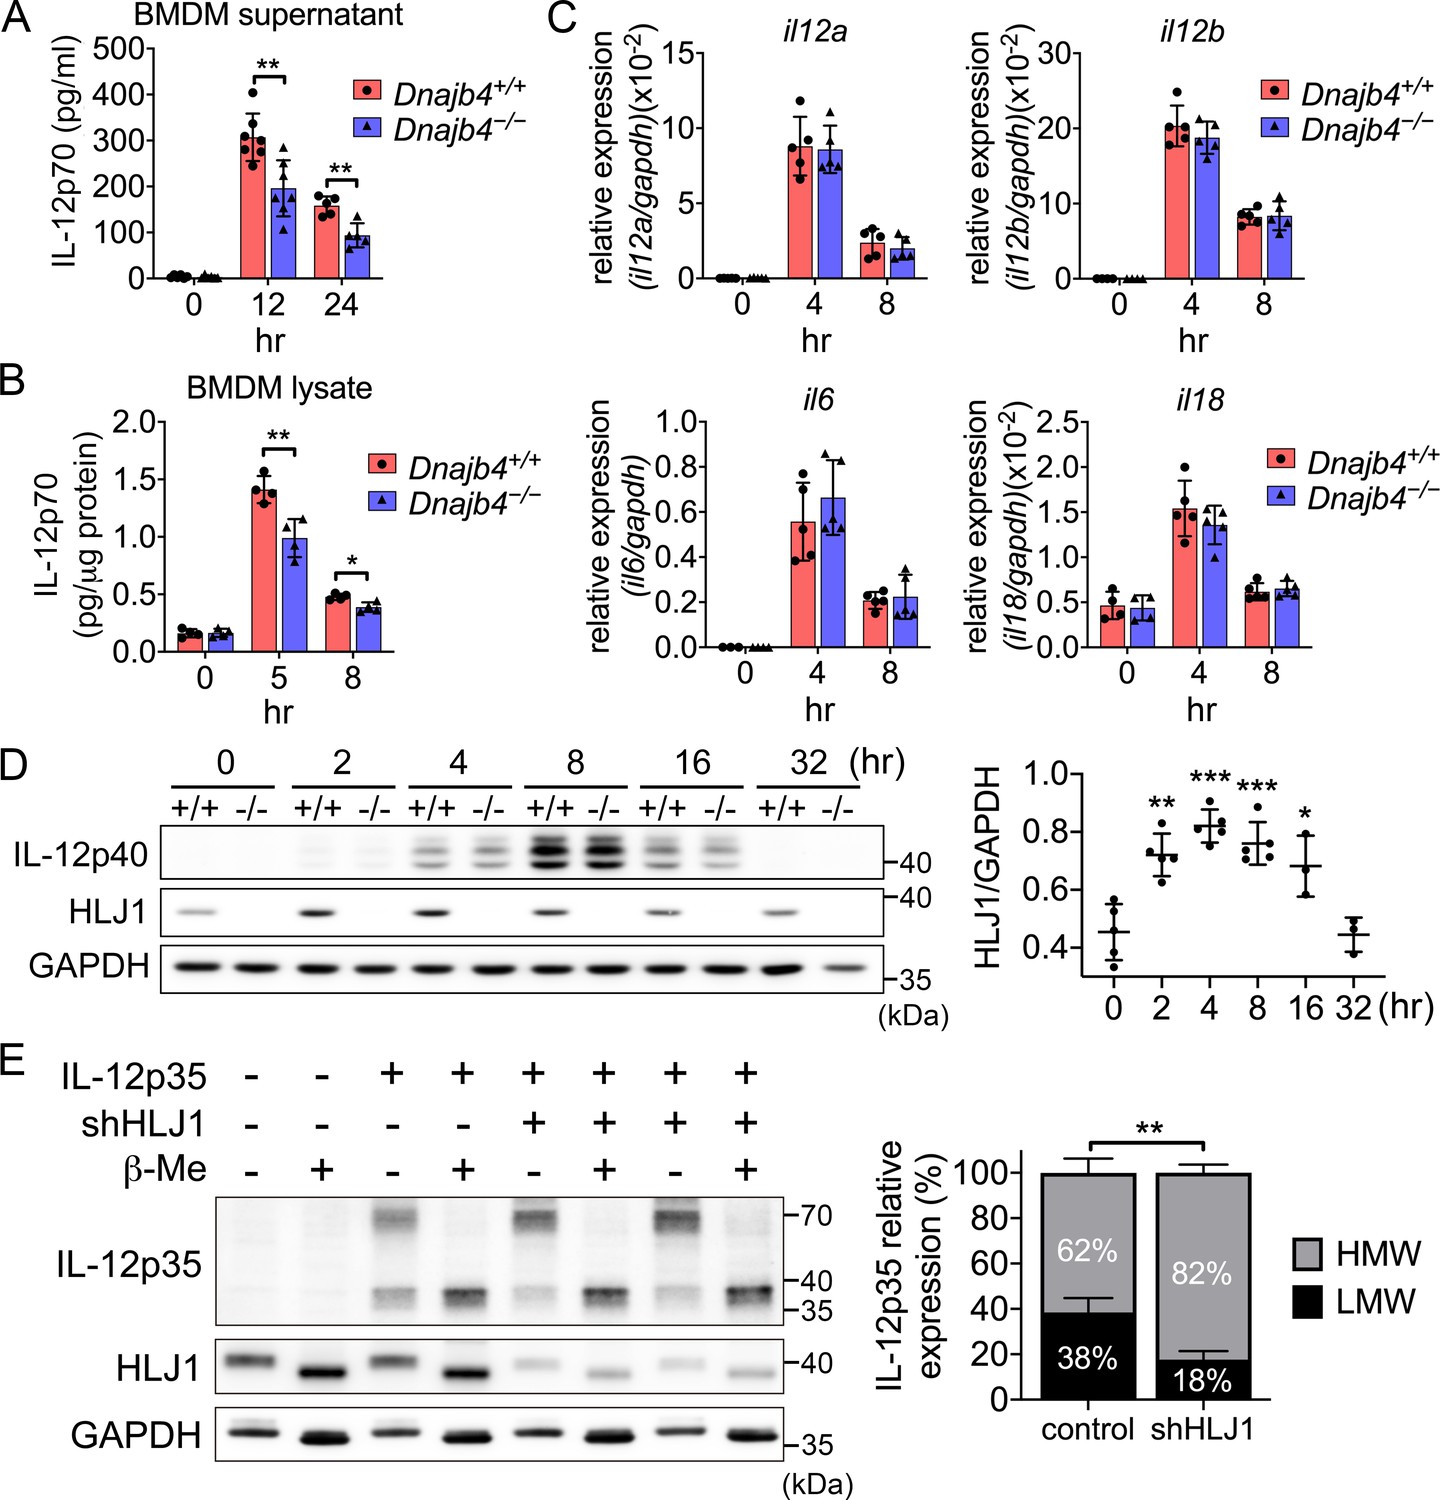
HLJ1 deletion leads to the accumulation of homodimeric IL-12p35 and reduced levels of heterodimeric IL-12p70.
(A) Bone marrow-derived macrophages (BMDMs) isolated from n = 6–7 Dnajb4+/+ and Dnajb4−/− mice were treated with 10 ng/ml lipopolysaccharide (LPS) and 20 ng/ml IFN-γ. Supernatant was collected at the indicated time points, and IL-12p70 was quantified via ELISA. 12 hr, p = 0.003; 24 hr, p = 0.003. (B) LPS/IFN-γ-treated BMDMs from n = 4–5 mice were lysed at the indicated time points and intracellular IL-12p70 was quantified via ELISA. 5 hr, p = 0.006; 8 hr, p = 0.012. (C) IL-12a, IL-12b, IL-6, and IL-18 expression was determined via quantitative real-time PCR (qRT-PCR) in LPS/IFN-γ-treated BMDMs isolated from n = 5 mice. (D) Intracellular IL-12p40 and HLJ1 expression levels were analyzed in LPS/IFN-γ-treated BMDMs isolated from Dnajb4+/+ (+/+) and Dnajb4−/− (−/−) mice. Representative samples of n = 3–5 biological replicates are shown. GAPDH served as a loading control. In comparisons with the 0 hr group (right panel): 2 hr, p = 0.001; 4 hr, p < 0.001; 8 hr, p = <0.001; 16 hr, p = 0.02. (E) The influence of human HLJ1 knockdown on the redox state of human IL-12p35 was analyzed via non-reducing sodium dodecyl sulfate–polyacrylamide gel electrophoresis (SDS–PAGE). 293T cells were (co-)transfected with the indicated IL-12p35 subunits and shRNA targeting HLJ1. The percentage of high-molecular-weight (HMW) and low-molecular-weight (LMW) IL-12p35 species in the presence or absence of shHLJ1 was quantified (right panel, n = 4 biological repeats for shHLJ1- and control-transfected cultures; p = 0.001). Where indicated, samples were treated with β-mercaptoethanol (β-Me) after cell lysis to provide a standard for completely reduced protein. GAPDH served as a loading control. Data presented are means ± standard deviation (SD). Statistical analysis was performed by using the two-tailed, unpaired Student’s t-test. *p < 0.05, **p < 0.01, ***p < 0.001.
-
Figure 9—source data 1
Data for graphs depicted in Figure 9A–E.
- https://cdn.elifesciences.org/articles/76094/elife-76094-fig9-data1-v2.xlsx
-
Figure 9—source data 2
Original and labeled blots images of Figure 9D, E.
- https://cdn.elifesciences.org/articles/76094/elife-76094-fig9-data2-v2.zip
Figure 9—figure supplement 1
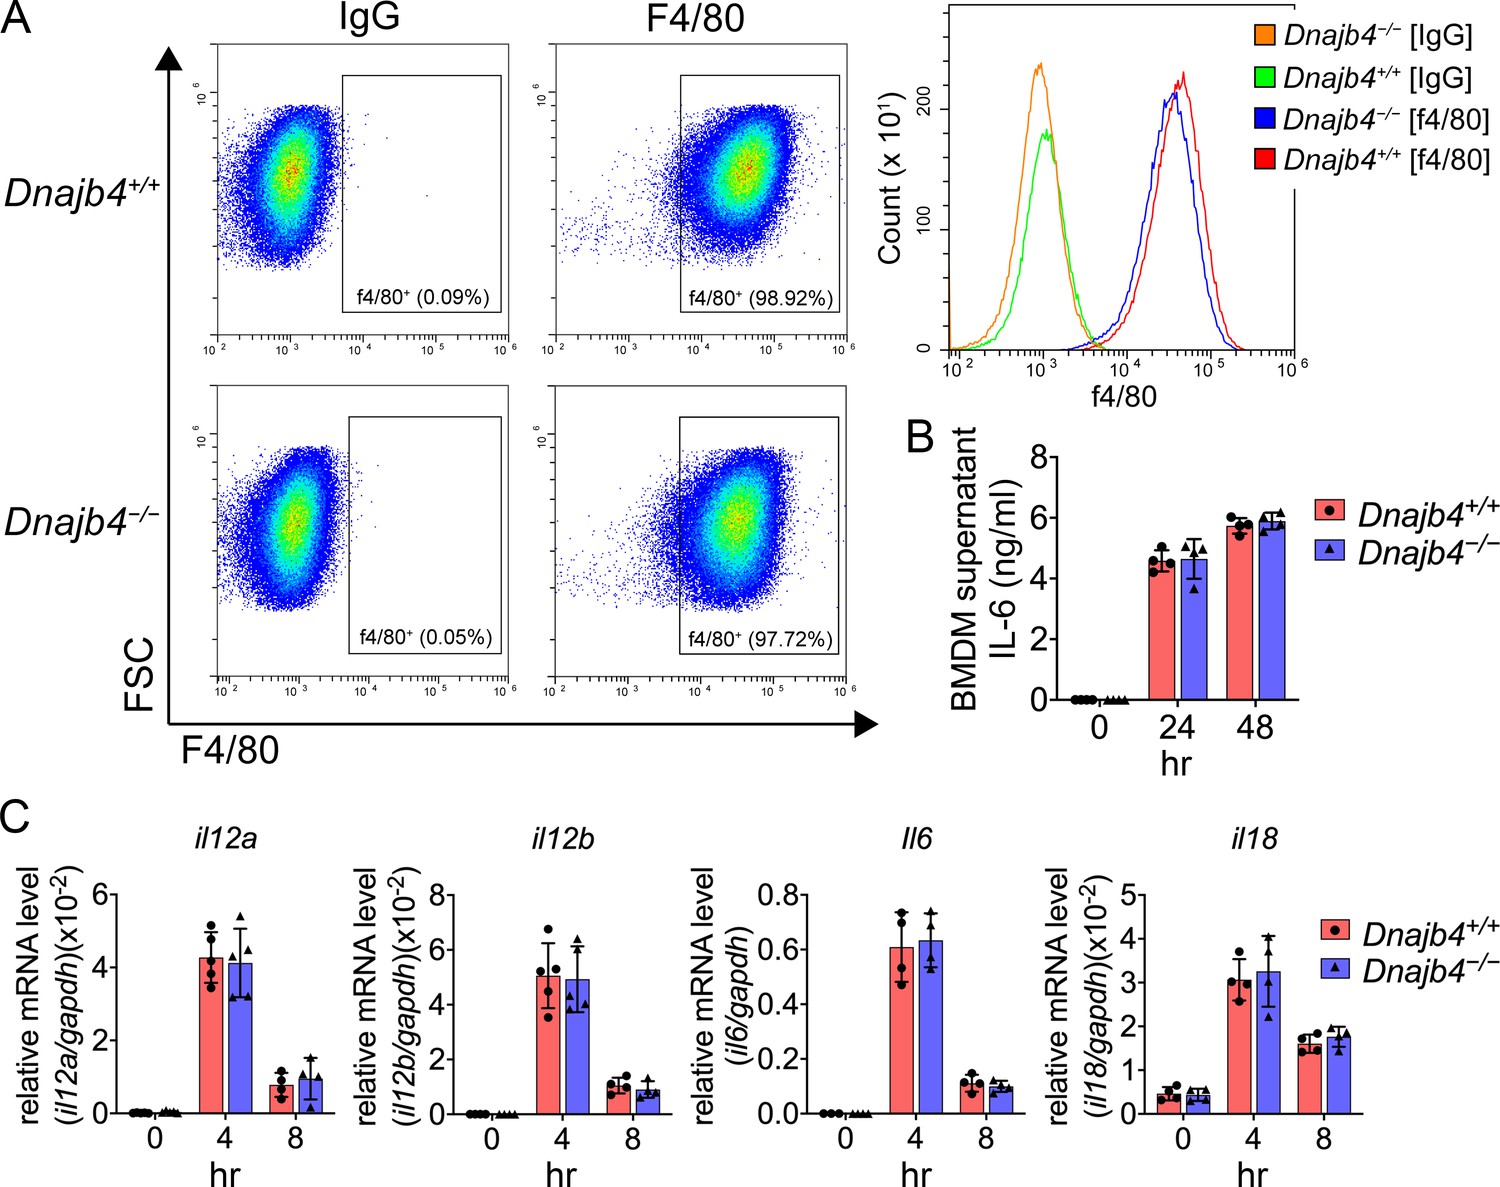
Transcriptional levels of proinflammatory cytokines in lipopolysaccharide (LPS)-treated bone marrow-derived macrophages (BMDMs).
(A) F4/80+ BMDMs analyzed with flow cytometry. Bone marrow cells were isolated from Dnajb4+/+ and Dnajb4−/− mouse and differentiated with M-CSF (10 ng/ml) for 7 days. (B) Dnajb4+/+ and Dnajb4−/− BMDMs isolated from n = 4 mice were treated with 100 ng/ml LPS and supernatants were collected at the indicated time points and IL-6 was analyzed by ELISA. (C) Transcriptional levels of il12a, il12b, il6, and il18 in BMDMs isolated from n = 4–5 mice were quantified by quantitative real-time PCR (qRT-PCR). Data are mean ± standard deviation (SD). Statistical analysis was performed by using the two-tailed, unpaired Student’s t-test.
-
Figure 9—figure supplement 1—source data 1
Data for graphs depicted in Figure 9—figure supplement 1B, C.
- https://cdn.elifesciences.org/articles/76094/elife-76094-fig9-figsupp1-data1-v2.xlsx
Figure 9—figure supplement 2
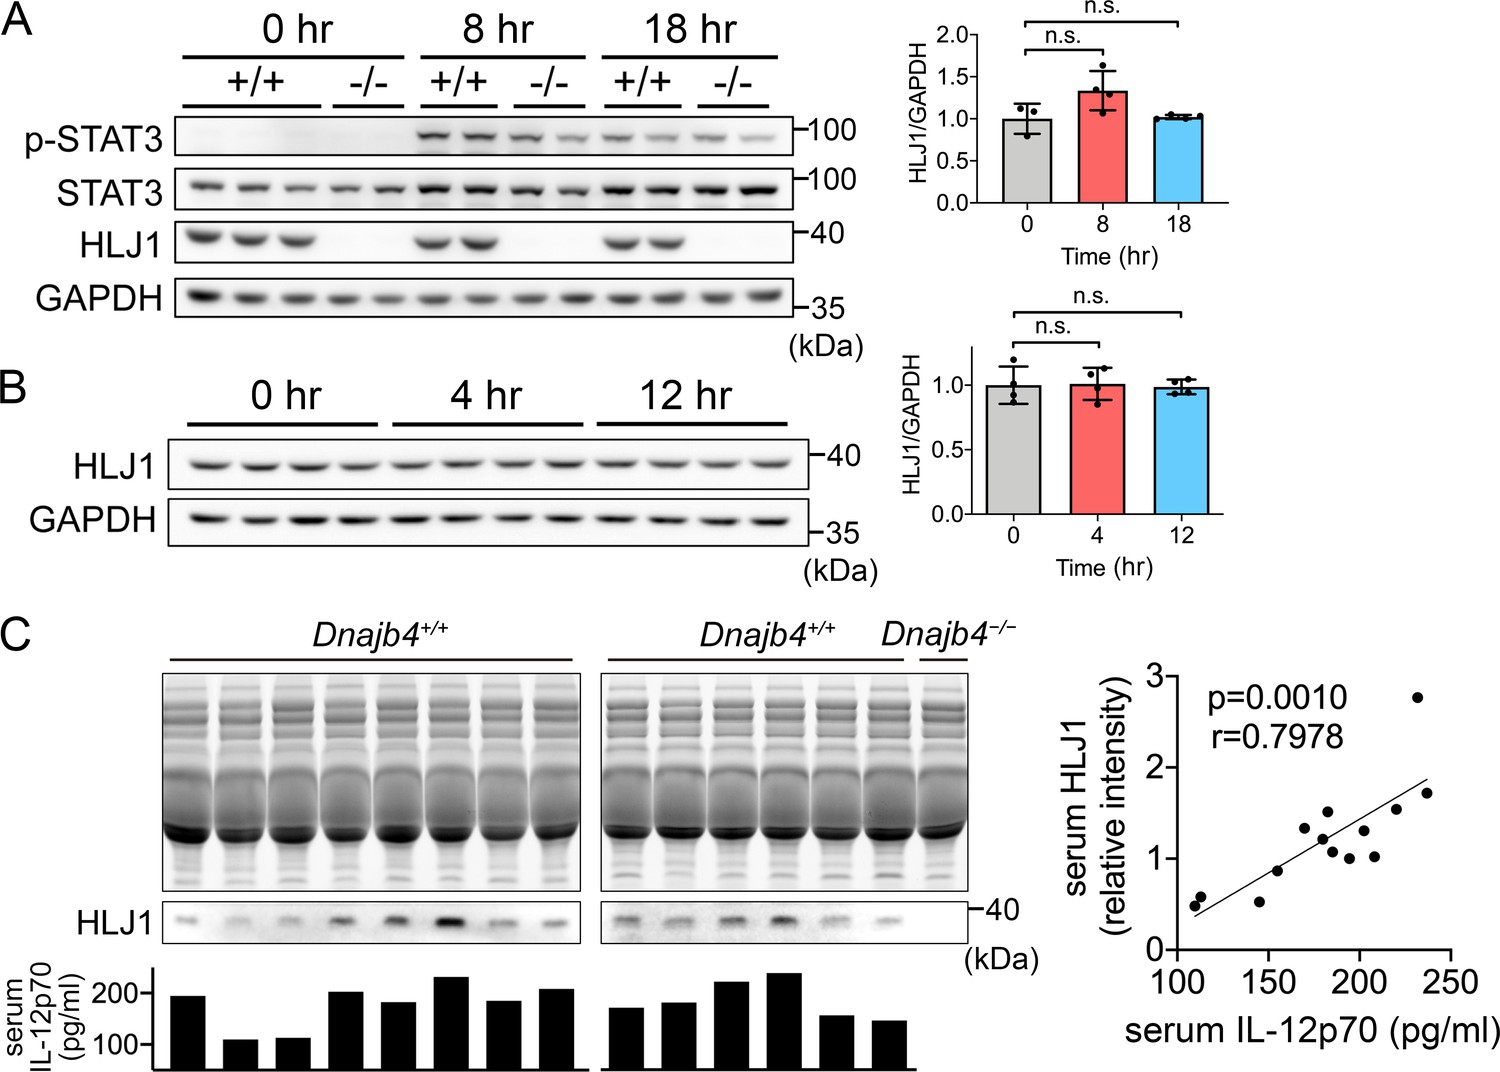
Expression levels of HLJ1 in the liver and serum from lipopolysaccharide (LPS)-injected mice.
(A, B) HLJ1 and STAT3 protein levels and phosphorylation levels in LPS-treated 6–8 weeks Dnajb4+/+ (+/+) and Dnajb4−/− (−/−) mouse liver were determined. Representative samples are showed from n = 4 per group. Data are mean ± standard deviation (SD). Image J software was used to quantify the intensity and statistical analysis was performed by using the two-tailed, unpaired Student’s t-test. n.s., not significant. (C) Dnajb4+/+ and Dnajb4−/− mice were administrated with 20 mg/kg LPS and after 4 hr serum was collected for analysis of IL-12p70 and HLJ1 expression by ELISA and western blotting, respectively. For western blotting, 4 μl serum were used for each lane and total proteins in the acrylamide gel were stained as internal control. p value and r value were calculated from 14 samples by Spearman’s correlation coefficient testing.
-
Figure 9—figure supplement 2—source data 1
Data for graphs depicted in Figure 9—figure supplement 2A–C.
- https://cdn.elifesciences.org/articles/76094/elife-76094-fig9-figsupp2-data1-v2.zip
-
Figure 9—figure supplement 2—source data 2
Original and labeled blots images of Figure 9—figure supplement 2A–C.
- https://cdn.elifesciences.org/articles/76094/elife-76094-fig9-figsupp2-data2-v2.zip
Figure 10
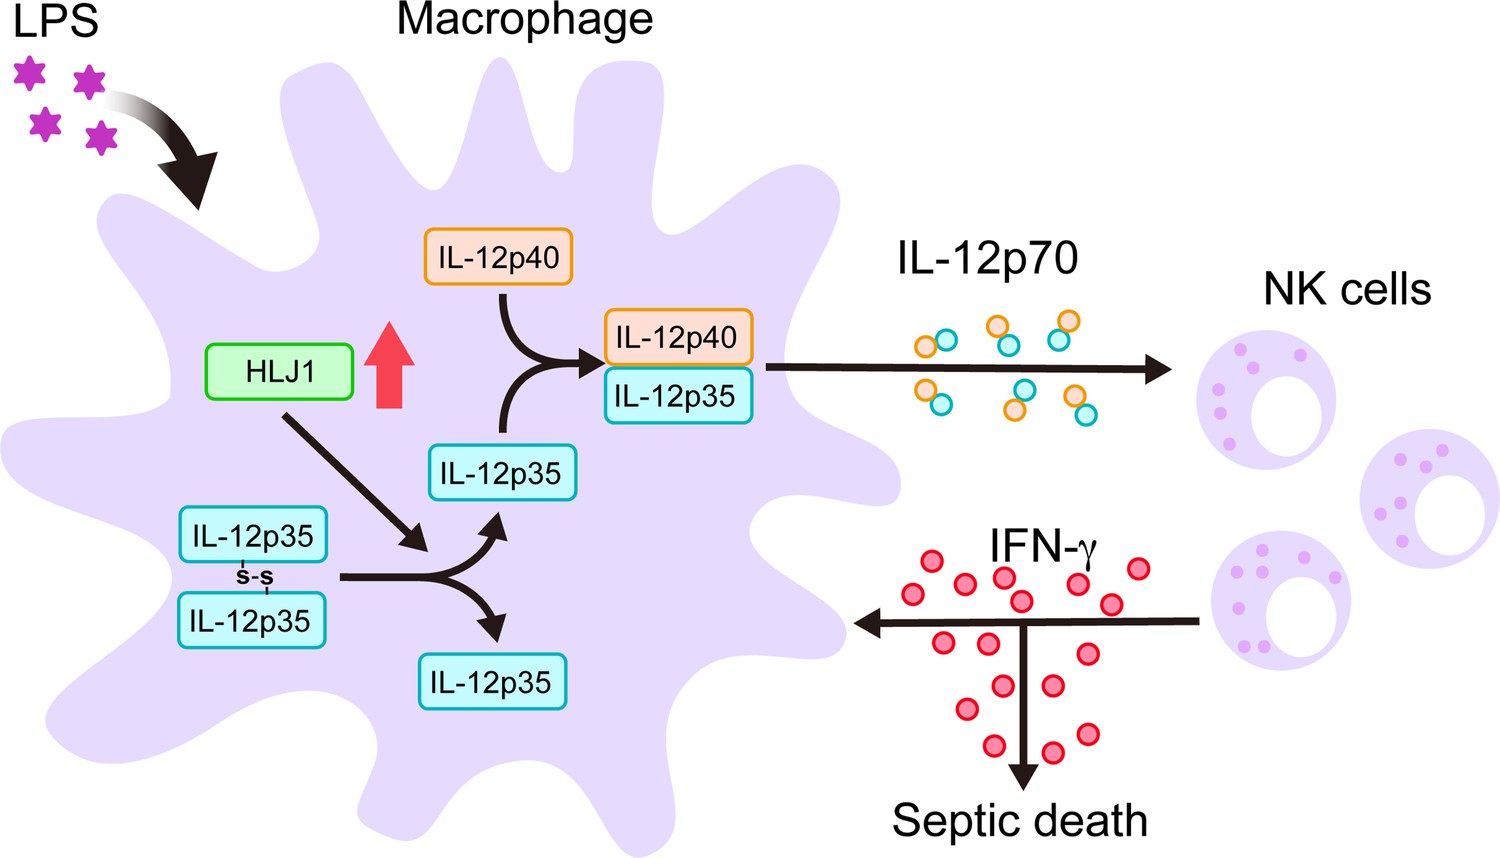
Schematic diagram delineates how HLJ1 functions and controls IL-12 biosynthesis, IFN-γ production, and subsequent sepsis-related mortality.
HLJ1 protein, which can be induced when macrophages are stimulated with lipopolysaccharide (LPS), helps the conversion of high-molecular-weight (HMW) misfolded IL-12p35 homodimers to IL-12p35 monomers. Bioactive IL-12p70 heterodimers, composed of IL-12p35 and IL-12p40 subunits, are released into the circulation by macrophages and thereby stimulates natural killer (NK) cells. Eventually, activated NK cells in the liver and spleen release IFN-γ in sufficient quantities to lead to organ damage and even death during sepsis.
Tables
Key resources table
| Reagent type (species) or resource | Designation | Source or reference | Identifiers | Additional information |
|---|---|---|---|---|
| Gene (Mus musculus) | HLJ1 (Dnajb4) | GenBank | MGI:1914285 | |
| Strain, strain background (Mus musculus) | HLJ1 knockout mice (Dnajb4−/−) in C57BL/6 background | Medical College, National Taiwan University | N/A | National Core Facility for Biopharmaceuticals – A4, Ministry of Science and Technology, Taiwan (https://ncfb.nycu.edu.tw/en/a4.html) |
| Cell line (Homo sapiens) | Epithelial Kidney; Embryo | ATCC | 293T | Transfected with HLJ1-shRNA containing vectors |
| Transfected construct (Homo sapiens) | HLJ1 shRNA | National RNAi Core Facility (Academia Sinica, Taiwan) | TRCN0000419874 NM_007034 | Transfected construct to express the shRNA |
| Transfected construct (Homo sapiens) | IL-12p35 overexpression | Origene | RC211224 NM_000882 | Transfected construct to express the human IL12A |
| Biological sample (Mus musculus) | Primary NK cells | This paper | Freshly isolated from Mus musculus | |
| Biological sample (Mus musculus) | Bone marrow-derived macrophages | This paper | Freshly isolated from Mus musculus | |
| Antibody | Anti-IL-12 (Clone: C17.8) (Rat monoclonal) | Biolegend | Cat# 505310 | WB (1:1000) Neutralization (100 and 500 μg/mouse) |
| Antibody | Anti-IFN-γ (Clone: XMG1.2) (Rat monoclonal) | BioXCell | Cat# BE0055 | Neutralization (100 μg/mouse) |
| Antibody | Anti-IL-12A (Clone: EPR5736) (Rabbit monoclonal) | Abcam | Cat# Ab133751 | WB (1:1000) |
| Antibody | Anti-Dnajb4 (HLJ1) (Rabbit polyclonal) | Proteintech | Cat# 13064-1-AP | WB (1:5000) |
| Antibody | Anti-F4/80 [CI:A3-1] (Rat monoclonal) | Abcam | Cat# ab6640 | ICC/IF (1:100) |
| Sequence-based reagent | Ifng_F | Arterioscler Thromb Vasc Biol. 2005 Apr;25(4):791–6. | qRT-PCR primer | AGCAACAGCAAGGCGAAAA |
| Sequence-based reagent | Ifng_R | Arterioscler Thromb Vasc Biol. 2005 Apr;25(4):791–6. | qRT-PCR primer | CTGGAC CTGTGGGTTGTTGA |
| Sequence-based reagent | Il12a_F | PNAS July 10, 2012 109 (28) 11200–11205 | qRT-PCR primer | AAGAACGAGAGTTGCCTGGCT |
| Sequence-based reagent | IL12a_R | PNAS July 10, 2012 109 (28) 11200–11205 | qRT-PCR primer | TTGATGGCCTGGAACTCTGTC |
| Sequence-based reagent | Il12b_F | J Immunol March 1, 2019, 202 (5) 1406–1416 | qRT-PCR primer | GAAGTTCAACATCAAGAGCAGTAG |
| Sequence-based reagent | Il12b_R | J Immunol March 1, 2019, 202 (5) 1406–1416 | qRT-PCR primer | AGGGAGAAGTAGGAATGGGG |
| Peptide, recombinant protein | IFN-γ | Peprotech | Cat# 315-05 | 20 ng/ml |
| Peptide, recombinant protein | M-CSF | Peprotech | Cat# 315-02 | 10 ng/ml |
| Commercial assay or kit | Mouse IFN-γ ELISA | Biolegend | Cat# 430804 | |
| Commercial assay or kit | Mouse IL-12 ELISA | Biolegend | Cat# 433604 | |
| Commercial assay or kit | LEGENDplex | Biolegend | Cat# 740446 | |
| Chemical compound, drug | Liposome-encapsulated clodronate | Liposoma | Car# C-025 | 100 μl/10 gbw |
| Software, algorithm | MetaCore software | Clarivate https://portal.genego.com/ | Pathway analysis | |
| Software, algorithm | GraphPad Prism software | GraphPad Prism | Version 8.0.0 | |
| Software, algorithm | Loupe browser | 10× genomics https://www.10xgenomics.com/products/loupe-browser | ||
| Other | Lipopolysaccharide (LPS) from E. coli O111:B4 | Sigma-Aldrich | Cat# L2630 | Low-dose 4 mg/kg LD50 10 mg/kg High-dose 20 mg/kg |
Additional files
Download links
A two-part list of links to download the article, or parts of the article, in various formats.
Downloads (link to download the article as PDF)
Open citations (links to open the citations from this article in various online reference manager services)
Cite this article (links to download the citations from this article in formats compatible with various reference manager tools)
HLJ1 amplifies endotoxin-induced sepsis severity by promoting IL-12 heterodimerization in macrophages
eLife 11:e76094.
https://doi.org/10.7554/eLife.76094


