Absence of CEP78 causes photoreceptor and sperm flagella impairments in mice and a human individual
- State Key Laboratory of Reproductive Medicine, Department of Histology and Embryology, Gusu School, Nanjing Medical University, China
- Department of Ophthalmology and Vision Science, Eye & ENT Hospital, Shanghai Medical College, Fudan University, China
- Department of Ophthalmology, The First Affiliated Hospital of Nanjing Medical University, Nanjing Medical University, China
- Gansu Aier Ophthalmiology and Optometry Hospital, China
- Ningxia Eye Hospital, People’s Hospital of Ningxia Hui Autonomous Region, Third Clinical Medical College of Ningxia Medical University, China
Figures
Figure 1 with 3 supplements
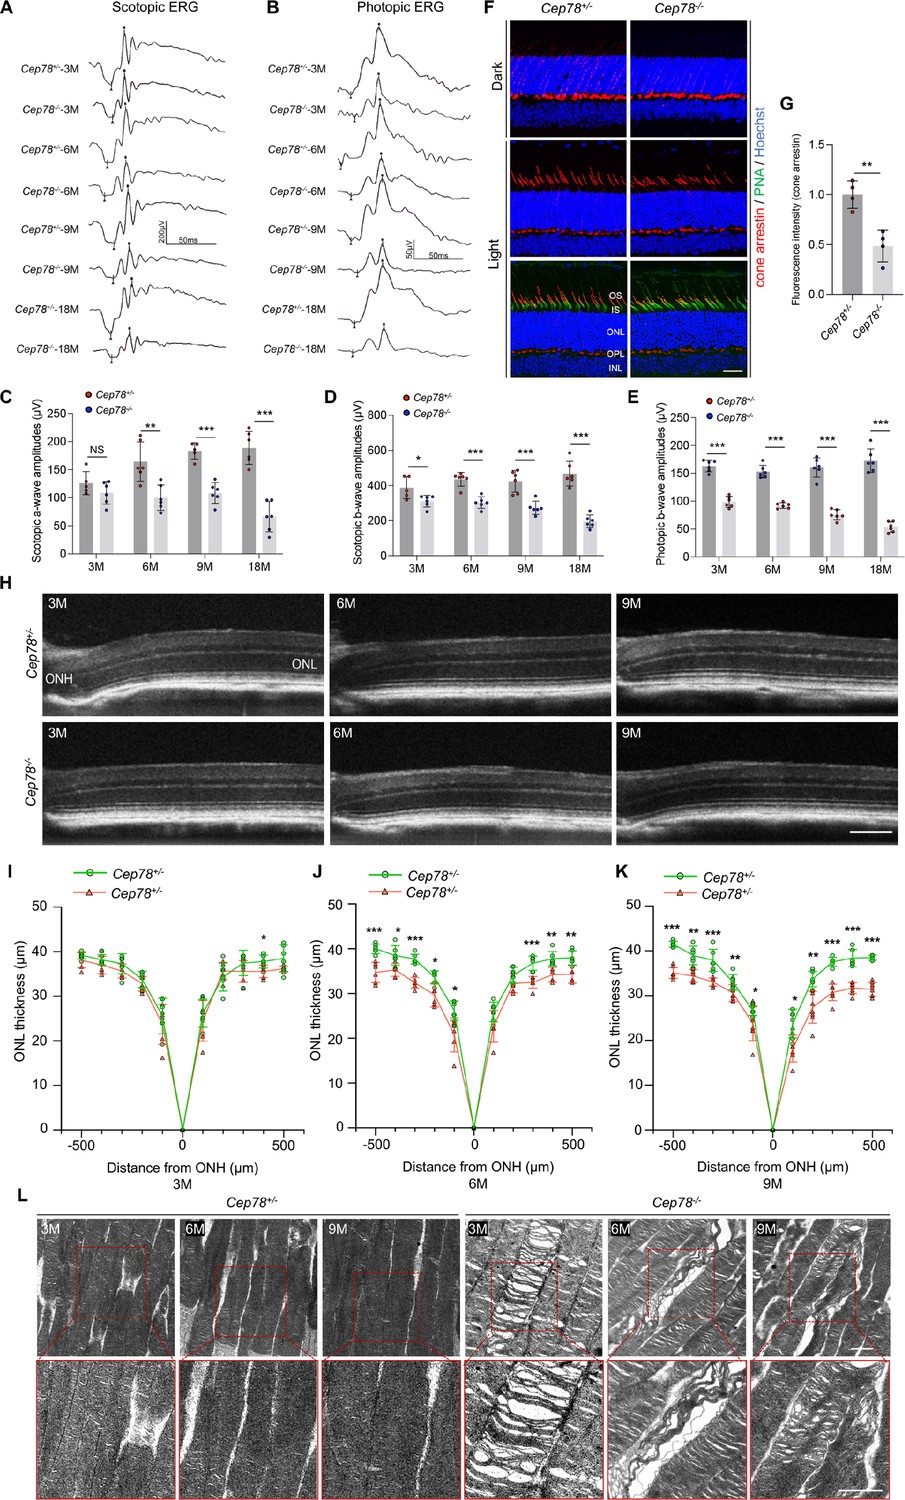
Cep78 deletion leads to photoreceptor impairments in mice retina.
(A–E) Scotopic and photopic ERG of Cep78−/− mice at the indicated ages. Representative images along with the quantification results were shown (n=6 for each sample, two-tailed Student’s t-test). (F–G) Immunofluorescence staining of cone arrestin and peanut agglutinin (PNA) lectin in dark- and light-adapted retinas of Cep78+/− and Cep78−/− mice at 3 months. Scale bar, 25 µm. Representative images (F) along with quantification results (G) of cone arrestin signal intensity at light exposure condition were shown (n=4 for each sample, two-tailed Student’s t-test). (H–K) Spectral domain-optical CT (SD-OCT) revealed thickness of outer nucleic layer (ONL) in retinas of Cep78+/− and Cep78−/− mice of indicated ages. Scale bar, 150 µm. Representative images (H) along with the quantification results (I–K) were shown (n=6 for each sample, two-tailed Student’s t-test). (L) Transmission electron microscopy (TEM) revealed ultra-structures of photoreceptors in Cep78+/− and Cep78−/− mice at the indicated ages, scale bar, 1 µm. N.S, not significant, *, p<0.05, **, p<0.01, and ***, p<0.001.
-
Figure 1—source data 1
Original numbers used for quantification in Figure 1C–E, G, I, J, and K.
- https://cdn.elifesciences.org/articles/76157/elife-76157-fig1-data1-v2.xlsx
-
Figure 1—source data 2
Immunofluorescence, spectral domain-optical CT (SD-OCT), and transmission electron microscopy (TEM) analysis images in Figure 1F, H and L.
- https://cdn.elifesciences.org/articles/76157/elife-76157-fig1-data2-v2.zip
Figure 1—figure supplement 1
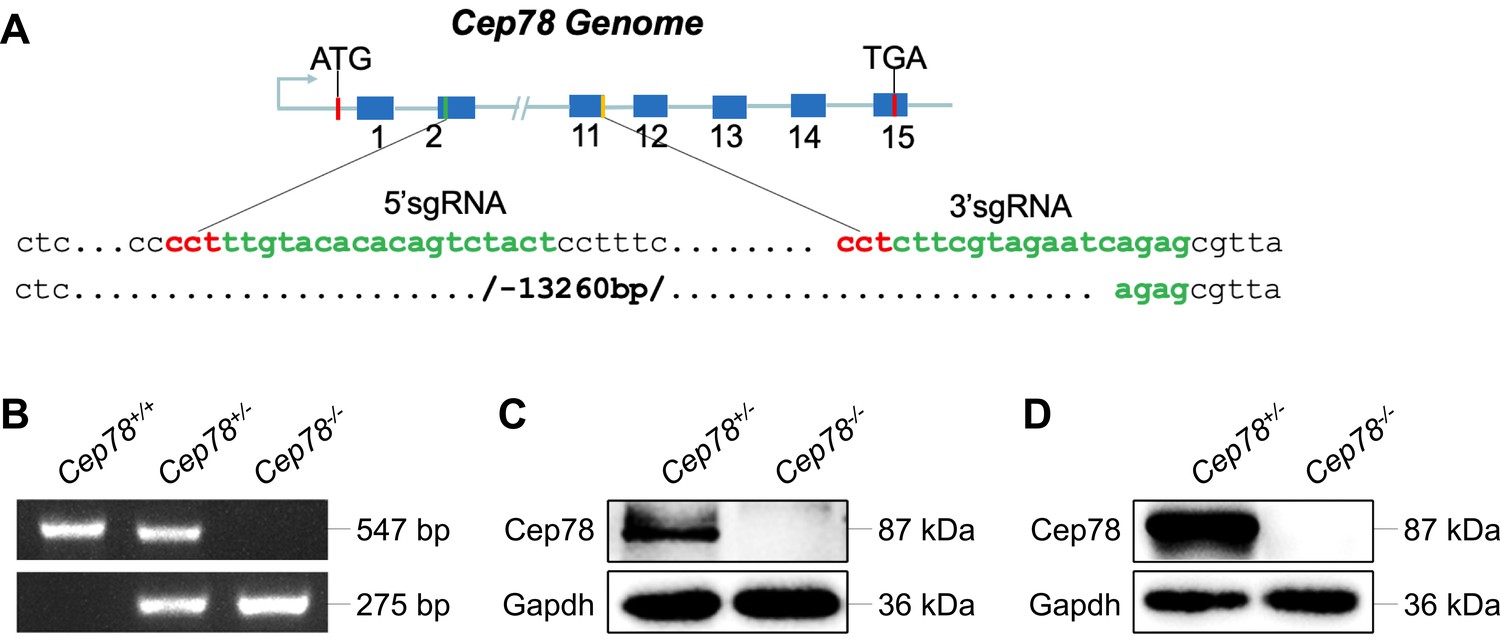
Generation of Cep78−/− mice using the CRISPR/Cas 9 system.
(A) A single-guide RNA (sgRNA) targeting exons 2 and 11 of the Cep78 mice gene was designed, generated, and injected into C57BL/6 mice zygote. (B) Genotyping confirmed deletion of exons 2–11 in Cep78+/− and Cep78−/− mice. (C–D) Immunoblotting showed Cep78 and Gapdh expressions in lysates of neural retina (C) and testes (D) from Cep78+/− and Cep78−/− mice.
-
Figure 1—figure supplement 1—source data 1
Uncropped gels and blots of Figure 1—figure supplement 1B, C, D.
- https://cdn.elifesciences.org/articles/76157/elife-76157-fig1-figsupp1-data1-v2.zip
Figure 1—video 1
Sperm motility analysis video of Cep78+/− male mice.
Figure 1—video 2
Sperm motility analysis video of Cep78−/− male mice.
Figure 2

Cep78−/− mice exhibit disturbed ciliary structure in photoreceptors.
(A–B) Retinal cryosections from Cep78+/− and Cep78−/− mice at indicated ages were stained with anti-Nphp1 (red) to visualize the connecting cilium (A) along with the quantification (B). Scale bar, 5 µm (three biological replications, n=19 for 3 M Cep78+/−, n=18 for 3 M Cep78−/−, n=23 for 6 M Cep78+/−, n=15 for 6 M Cep78−/−, n=17 for 9 M Cep78+/−, n=17 for 9 M Cep78−/−, two-tailed Student’s t-test). (C–D) Transmission electron microscopy (TEM) was applied to observe longitudinal sections of the ciliary region of photoreceptors in Cep78+/− and Cep78−/− mice at indicated ages. Scale bar, 1 µm. OS, outer segment; IS, inner segment; Ce, Centriole (three biological replications, n=26 for 3 M Cep78+/−, n=22 for 3 M Cep78−/−, n=32 for 6 M Cep78+/−, n=19 for 6 M Cep78−/−, n=21 for 9 M Cep78+/−, n=47 for 9 M Cep78−/−, two-tailed Student’s t-test). (E–G) TEM was used to observe the ultrastructure of connecting cilium in photoreceptors of Cep78+/− and Cep78−/− mice at indicated ages. Scale bar, upper 1 µm, below 200 nm. OS, outer segment; CC, connecting cilium; IS, inner segment; BB, basal body. Red arrows indicated the swelled upper part and disorganized microtubules of connecting cilia. *, p<0.05 and ***, p<0.001.
-
Figure 2—source data 1
Original numbers used for quantification of Figure 2B and D.
- https://cdn.elifesciences.org/articles/76157/elife-76157-fig2-data1-v2.xlsx
-
Figure 2—source data 2
Immunofluorescence and transmission electron microscopy (TEM) analysis images in Figure 2A, C, E, F and G.
- https://cdn.elifesciences.org/articles/76157/elife-76157-fig2-data2-v2.zip
Figure 3 with 1 supplement
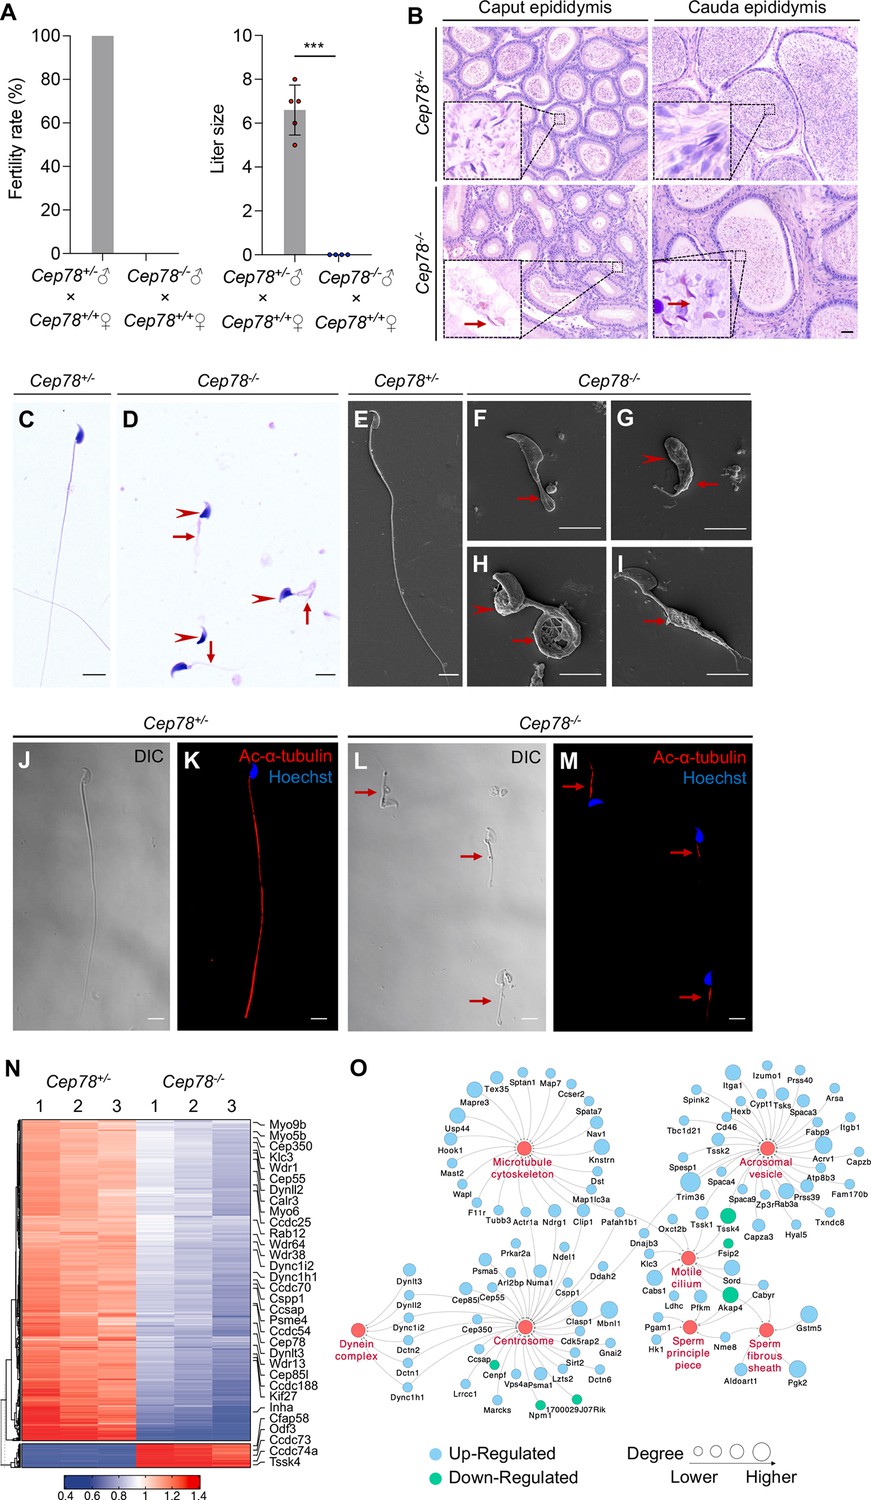
Cep78−/− mice present male infertility and morphological abnormalities of sperm.
(A) Fertility rates (left) and litter sizes (right) of Cep78+/− and Cep78−/− male mice crossed with Cep78+/+ female mice, n=4 for Cep78+/− male mice crossed with Cep78+/+ female mice, n=5 for Cep78+/− male mice crossed with Cep78+/+ female mice, two-tailed Student’s t-test. ***, p<0.001. (B) Hematoxylin-eosin (H&E) staining was utilized to observe the structures of caput and cauda epididymis in Cep78+/− and Cep78+/− mice. Scale bar, 100 µm. (C–D) Spermatozoa from Cep78+/− (C) and Cep78−/− (D) mice were observed with H&E staining. Abnormal heads and short, missing, or coiled flagella were indicated by arrow heads and arrows respectively. Scale bar, 5 µm. (E–I) Spermatozoa of Cep78+/− (E) and Cep78−/− (F–I) mice were observed by scanning-electron microscopy (SEM). Abnormal heads were represented by arrow heads. Absent, short, coiled, or multi flagella were indicated by arrows. (J–M) Spermatozoa of Cep78+/− and Cep78−/− mice were pictured using differential interference contrast (J and L) and were stained with anti-Ac-α-tubulin (red) and Hoechst (blue) to visualize axonemes and heads, respectively (K and M). (N) Heatmap showing differentially expressed proteins between Cep78+/− and Cep78−/− mice elongating spermatids. (O) Network analysis of gene ontology (GO) cellular components terms enriched in differential expressed proteins between Cep78+/− and Cep78−/− mice elongating spermatids. Scale bar, 5 μm.
-
Figure 3—source data 1
Original numbers used for quantification of Figure 3A.
- https://cdn.elifesciences.org/articles/76157/elife-76157-fig3-data1-v2.xlsx
-
Figure 3—source data 2
Hematoxylin-eosin (H&E) staining, scanning-electron microscopy (SEM), and immunofluorescence analysis images in Figure 2B–M.
- https://cdn.elifesciences.org/articles/76157/elife-76157-fig3-data2-v2.zip
Figure 3—figure supplement 1
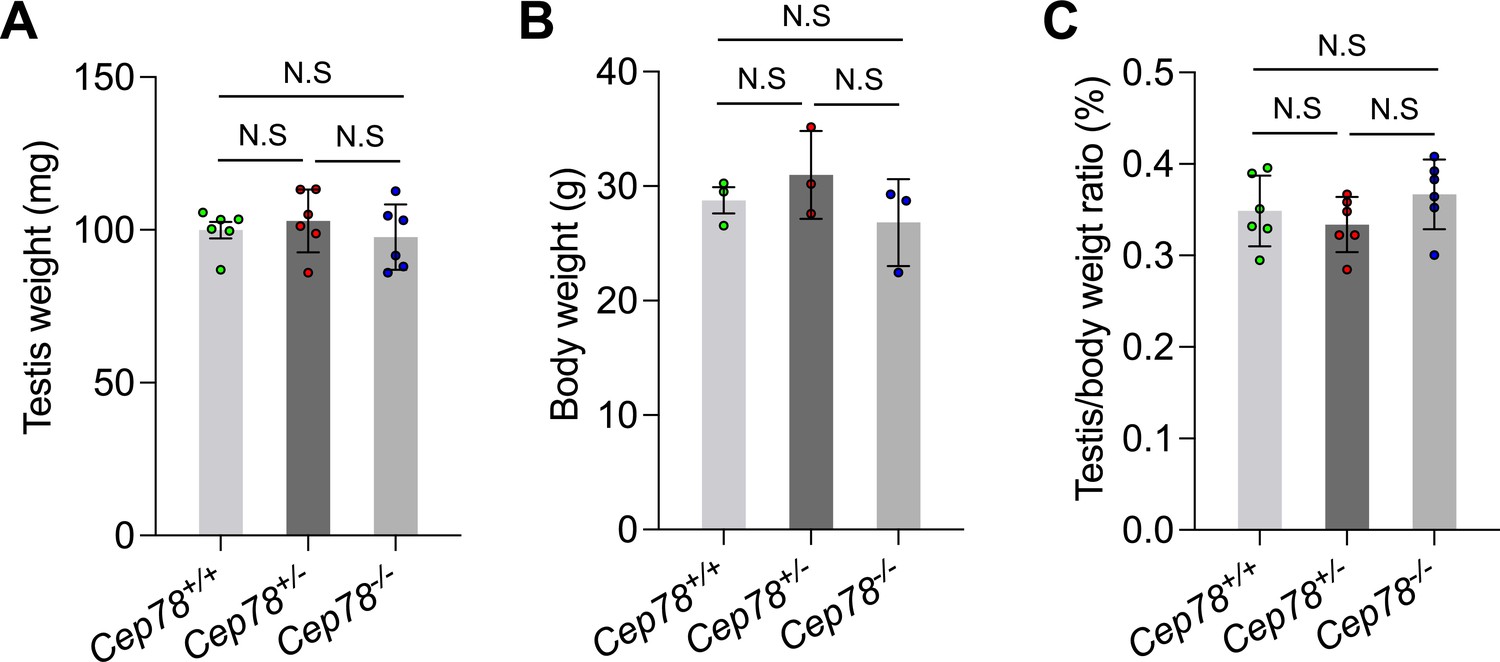
Statistics for testis weights, body weights, and testis/body weight ratios of Cep78+/+, Cep78+/−, and Cep78−/− mice.
Comparisons of testis weights (A), body weights (B), and testis/body weight ratios (C) among Cep78+/+, Cep78+/−, and Cep78−/− mice (three biological replications for Cep78+/+, Cep78+/−, and Cep78−/− mice, two-tailed Student’s t-test). N.S, not significant.
-
Figure 3—figure supplement 1—source data 1
Original numbers used for quantification in Figure 3—figure supplement 1A-C.
- https://cdn.elifesciences.org/articles/76157/elife-76157-fig3-figsupp1-data1-v2.xlsx
Figure 4
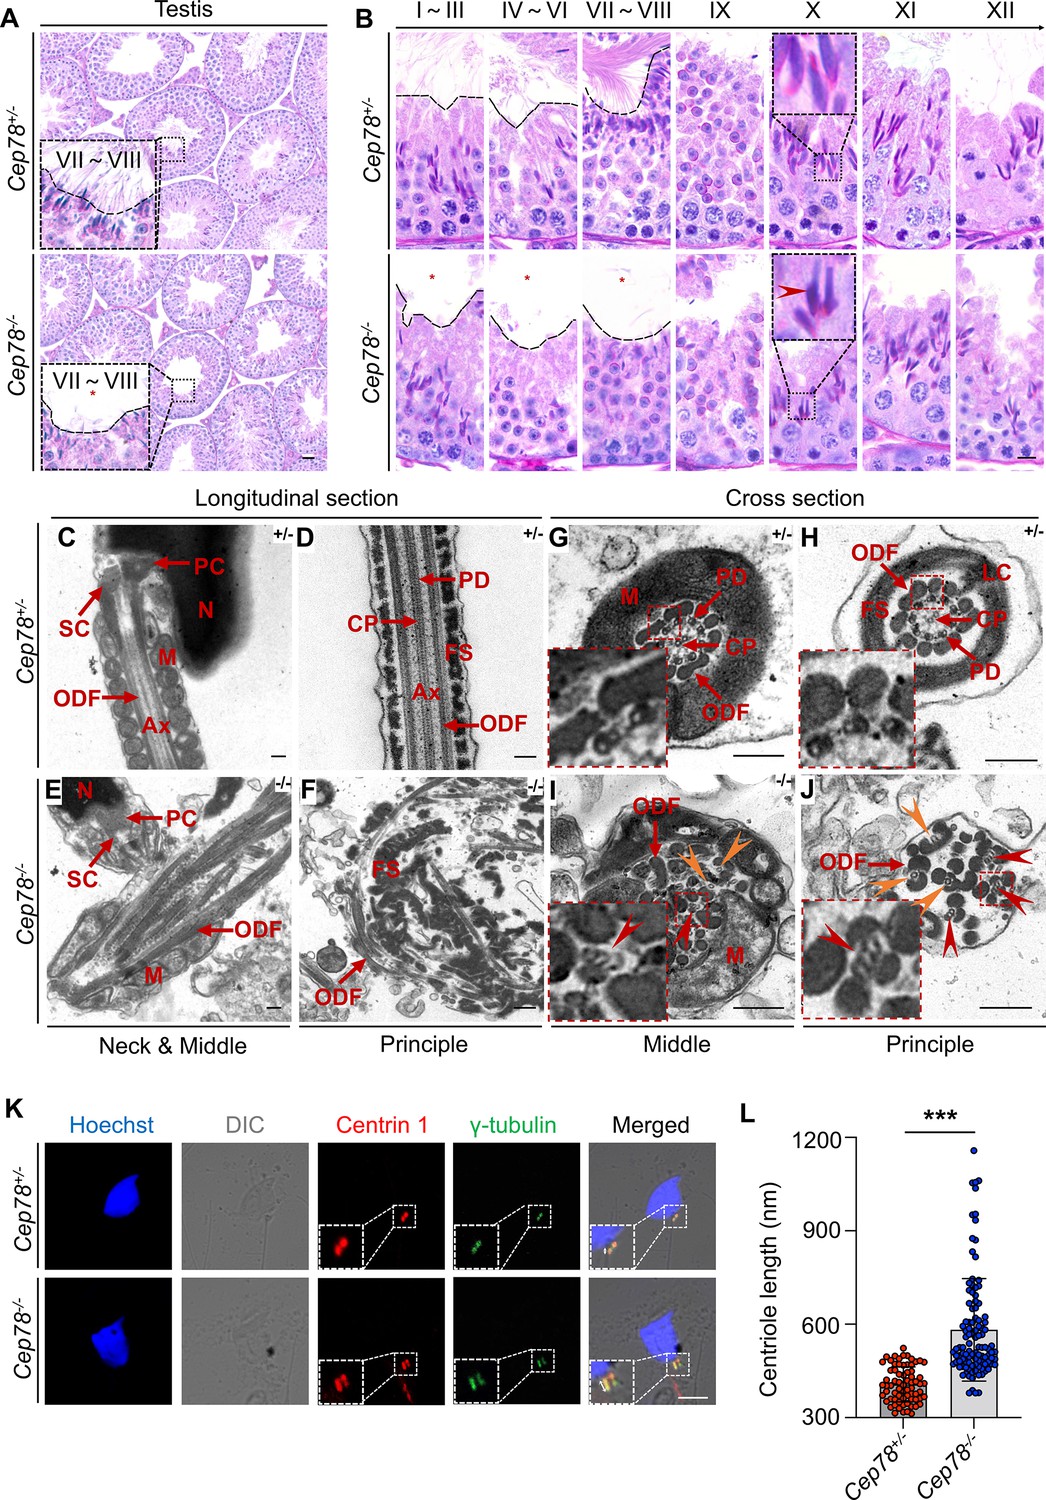
Defective microtubule arrangements and elongated centrioles in sperm flagella of Cep78−/− mice.
(A) Paraffin sections of testicular tissues from Cep78+/− and Cep78−/− male mice were stained with periodic acid-Schiff (PAS). Defects of sperm tails were indicated by asterisk. Scale bar, 50 μm. (B) Twelve stages of spermatogenesis in Cep78+/− and Cep78−/− male mice were presented by PAS-stained paraffin sections of seminiferous tubules. Lack of sperm tails and abnormal nuclei shape of elongated spermatids were indicated by asterisk and arrowhead, respectively. Schematic diagrams were attached. Scale bar, 10 μm. (C–J) Transmission electron microscopy (TEM) was applied to visualize ultra-structures of Cep78+/− and Cep78−/− spermatozoa in longitudinal sections of neck and middle pieces (C and E) and principal pieces (D and F), and in cross sections of middle pieces (G and I) and principal pieces (H and J). Triplet and singlet microtubules were indicated by red and orange arrow heads (I–J), respectively. Scale bar, 200 nm. N, nucleus; M, mitochondria; Ax, axoneme; SC, segmented column of the connecting piece; PC, proximal centriole; ODF, outer dense fiber; PD, peripheral microtubule doublets; CP, central pair of microtubules; FS, fibrous sheath; LC, longitudinal column. (K–L) Cep78+/− and Cep78−/− mice spermatozoa were stained with anti-Centrin 1 and anti-γ-tubulin to reveal the structure of centrosome (K). Scale bar, 5 µm. (L) Length of Centrin 1 positive centriole was quantification and compared (n=70 for Cep78+/− and n=107 Cep78−/−, two-tailed Student’s t-test). ***, p<0.001.
-
Figure 4—source data 1
Original numbers used for quantification in Figure 4L.
- https://cdn.elifesciences.org/articles/76157/elife-76157-fig4-data1-v2.xlsx
-
Figure 4—source data 2
Periodic acid-Schiff (PAS) staining, transmission electron microscopy (TEM), and immunofluorescence analysis images in Figure 4A-K.
- https://cdn.elifesciences.org/articles/76157/elife-76157-fig4-data2-v2.zip
Figure 5
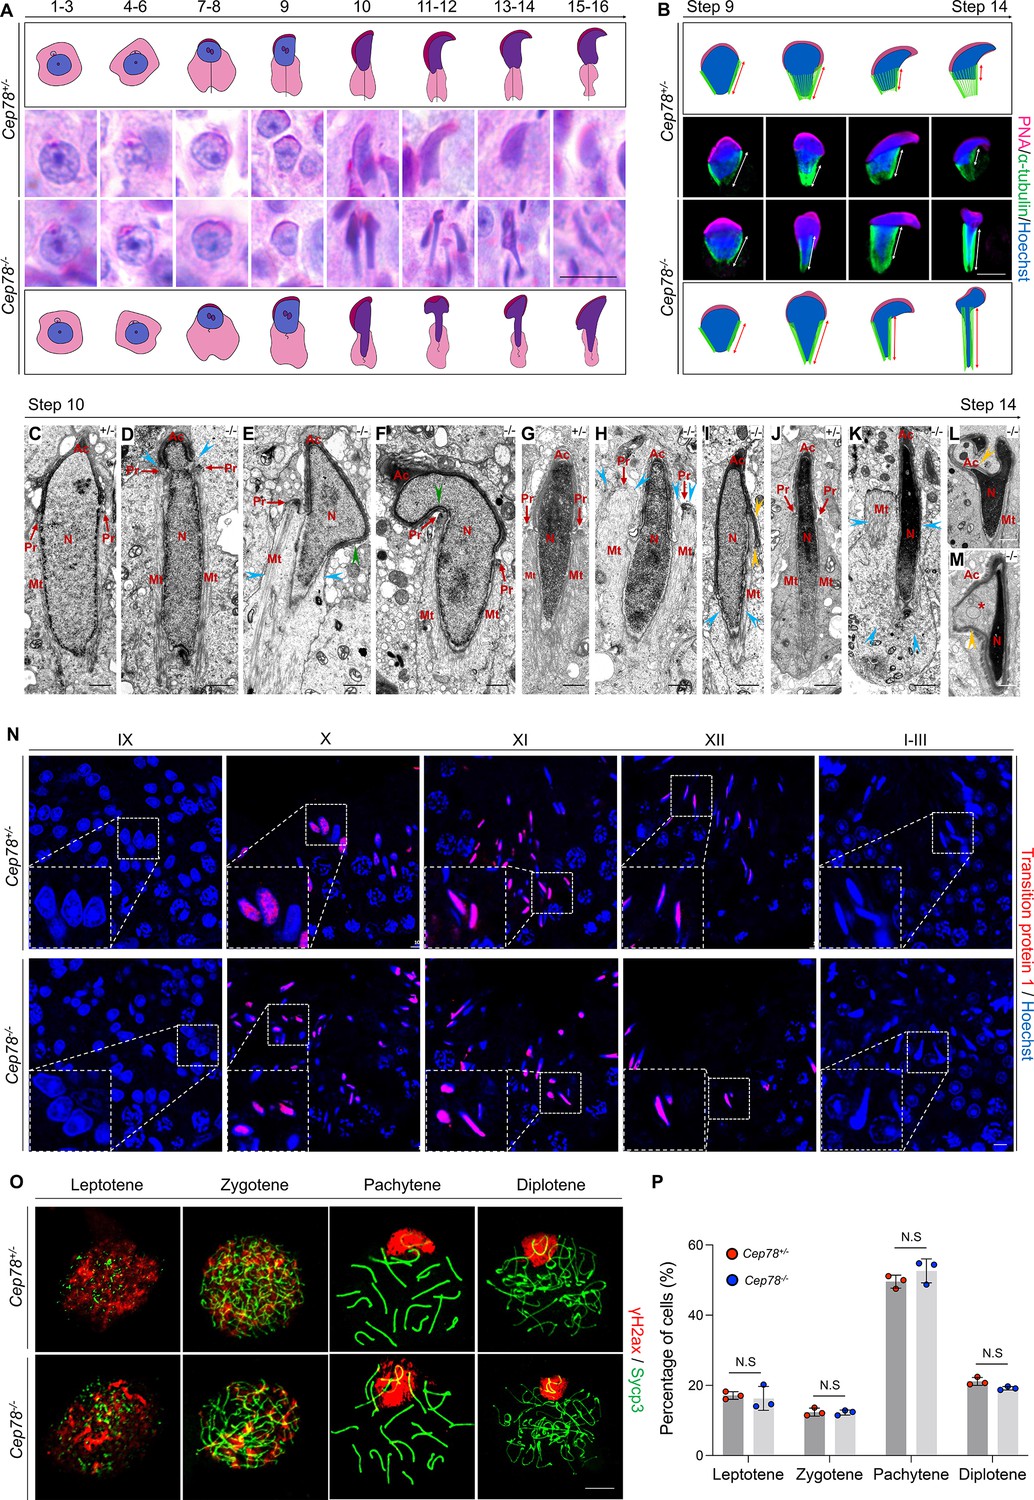
Cep78−/− testes present abnormalities in spermatid head formation during spermiogenesis.
(A) Sixteen steps of spermiogenesis in Cep78+/− and Cep78−/− male mice were presented by periodic acid-Schiff (PAS)-stained paraffin sections of seminiferous tubules. Lack of sperm tails and abnormal nuclei shape of elongated spermatids were indicated by asterisk and arrowhead, respectively. Schematic diagrams were attached. Scale bar, 10 μm. (B) Elongated spermatids from stages 9 to 14 from Cep78+/− and Cep78−/− mice were stained with peanut agglutinin (PNA; red) and α-tubulin (green) to see elongation of manchette structures. Nuclei were counterstained with Hoechst (blue). Manchette structures were recognized by double-head arrows. Scale bar, 5 μm. Schematic diagrams were attached. (C–M) Transmission electron microscopy (TEM) was used to visualize ultra-structures of Cep78+/− and Cep78−/− spermiogenic spermatids from steps 10 to 14. Scale bar, 500 nm. N, nucleus; Ac, acrosome; Pr, perinuclear ring; Mt, manchette. Abnormal structures of manchette were indicated by celeste arrow heads (D, E, H, I, and K). Green arrow heads pointed at abnormal bend of spermatid heads (E and F). Yellow arrow heads represented abnormal acrosomes (I, L, and M). Asterisk indicated expanded perinuclear space (M). (N) Paraffin sections of testicular seminiferous tubules from stage IX of spermatogenesis to stage I in Cep78+/− and Cep78−/− mice were stained with anti-transition protein 1 (red) and Hoechst (blue) to observe nuclear condensation. Scale bar, 5 μm. (O–P) Immunofluorescence staining of anti-γH2ax (red) and anti-Sycp3 (green) in chromosome spreads of spermatocytes from the testes of Cep78+/− and Cep78−/− mice. Scale bar, 5 μm. Representative image along with the quantification results was shown (n=219 for Cep78+/− spermatocytes, n=208 for Cep78−/− spermatocytes, two-tailed Student’s t-test, N.S, not significant).
-
Figure 5—source data 1
Original numbers used for quantification in Figure 5P.
- https://cdn.elifesciences.org/articles/76157/elife-76157-fig5-data1-v2.xlsx
-
Figure 5—source data 2
Periodic acid-Schiff (PAS) staining analysis images in Figure 5A.
- https://cdn.elifesciences.org/articles/76157/elife-76157-fig5-data2-v2.zip
-
Figure 5—source data 3
Immunofluorescence and transmission electron microscopy (TEM) analysis images in Figure 5B–O.
- https://cdn.elifesciences.org/articles/76157/elife-76157-fig5-data3-v2.zip
Figure 6 with 2 supplements
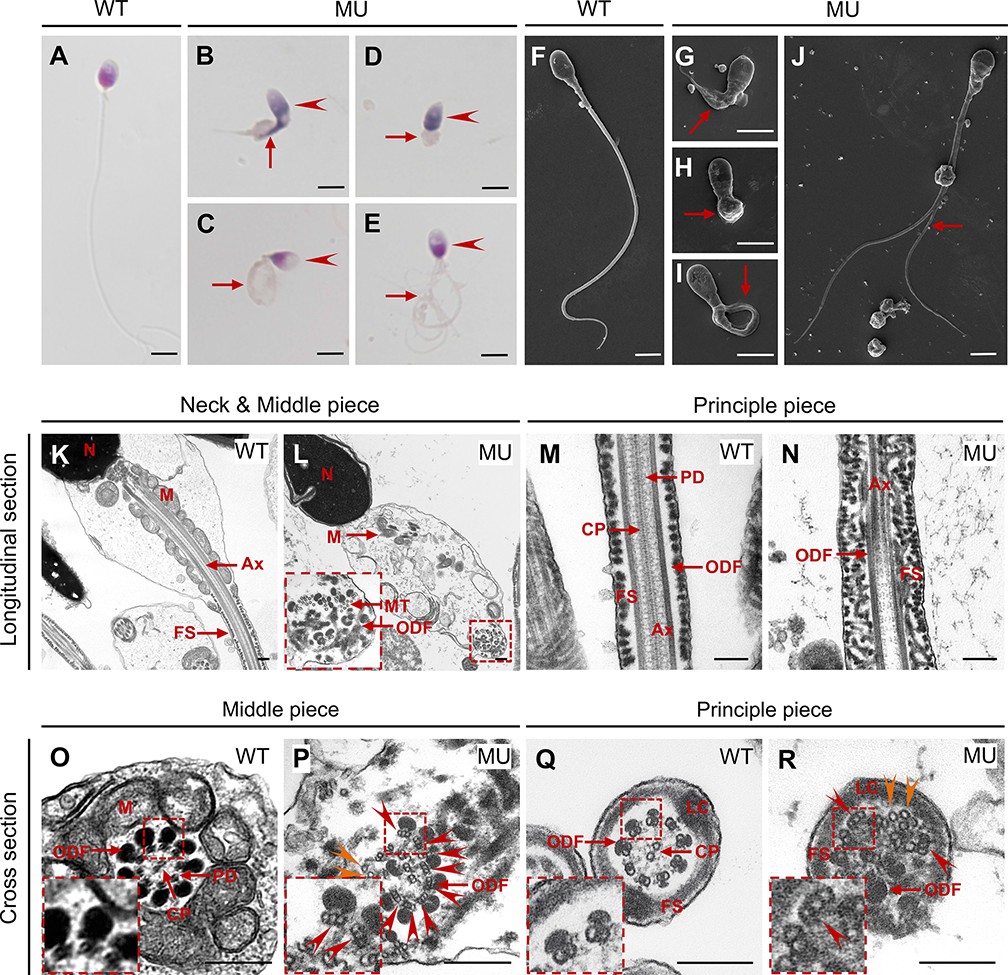
CEP78 mutation causes multiple morphological abnormalities of sperm flagella (MMAF) phenotypes in human.
(A–E) Hematoxylin-eosin (H&E) staining was utilized to see structures of spermatozoa from a healthy control (A) and a patient carrying homozygous CEP78 c.1629–2A>G mutation (B–E). Scale bar, 5 μm. Arrow heads represented abnormal sperm heads. Short, coiled, absent, or multi flagella were indicated by arrows. (F–J) Ultra-structures of spermatozoa from the healthy control (F) and the patient with CEP78 mutation (G–J) were observed using scanning-electron microscopy (SEM). Short, coiled, absent or multi flagella, and cytoplasm remains were indicated by arrows. Scale bar, 5 μm. (K–R) Transmission electron microscopy (TEM) was applied to visualize ultra-structures of spermatozoa from the healthy control and the patient in longitudinal sections of neck and middle pieces (K–L) and principal pieces (M–N), and in cross sections of middle pieces (O–P) and principal pieces (Q–R). Triplet and singlet microtubules were indicated by red and orange arrow heads (P and R), respectively. Scale bar, 200 nm (K–R). N, nucleus; M, mitochondria; MT, microtubules; Ax, axoneme; FS, fibrous sheath; ODF, outer dense fiber; PD, peripheral microtubule doublets; CP, central pair of microtubules; LC, longitudinal column.
-
Figure 6—source data 1
Hematoxylin-eosin (H&E) staining, scanning-electron microscopy (SEM), and transmission electron microscopy (TEM) analysis images in Figure 6A–R.
- https://cdn.elifesciences.org/articles/76157/elife-76157-fig6-data1-v2.zip
Figure 6—figure supplement 1
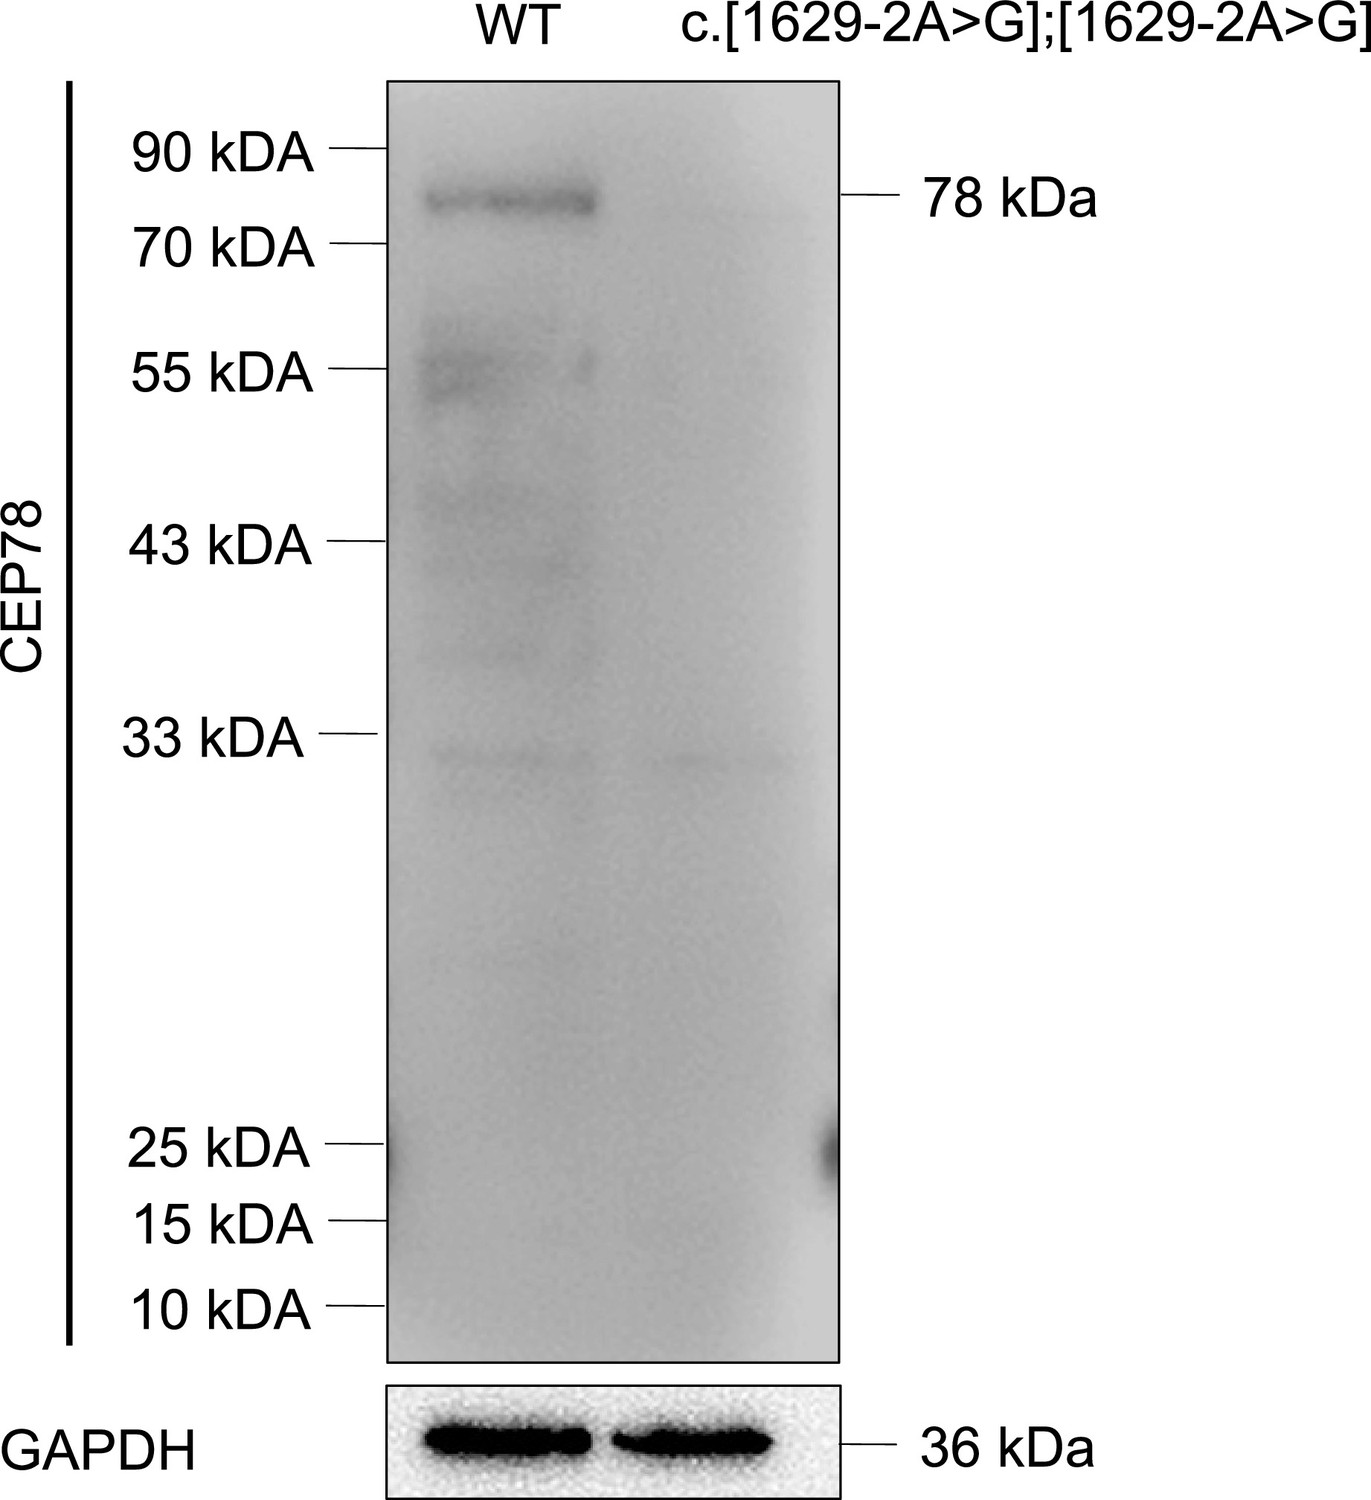
CEP78 mutation causes absence of CEP78 protein.
Immunoblotting presented CEP78 and GAPDH expressions in lysates of white blood cells from a healthy control without CEP78 mutation and a male patient carrying homozygous CEP78 c.1629–2A>G mutation.
-
Figure 6—figure supplement 1—source data 1
Uncropped blots of Figure 6—figure supplement 1.
- https://cdn.elifesciences.org/articles/76157/elife-76157-fig6-figsupp1-data1-v2.zip
Figure 6—video 1
Sperm motility analysis video of the patient carrying CEP78 c.1629–2A>G mutation.
Figure 7 with 5 supplements
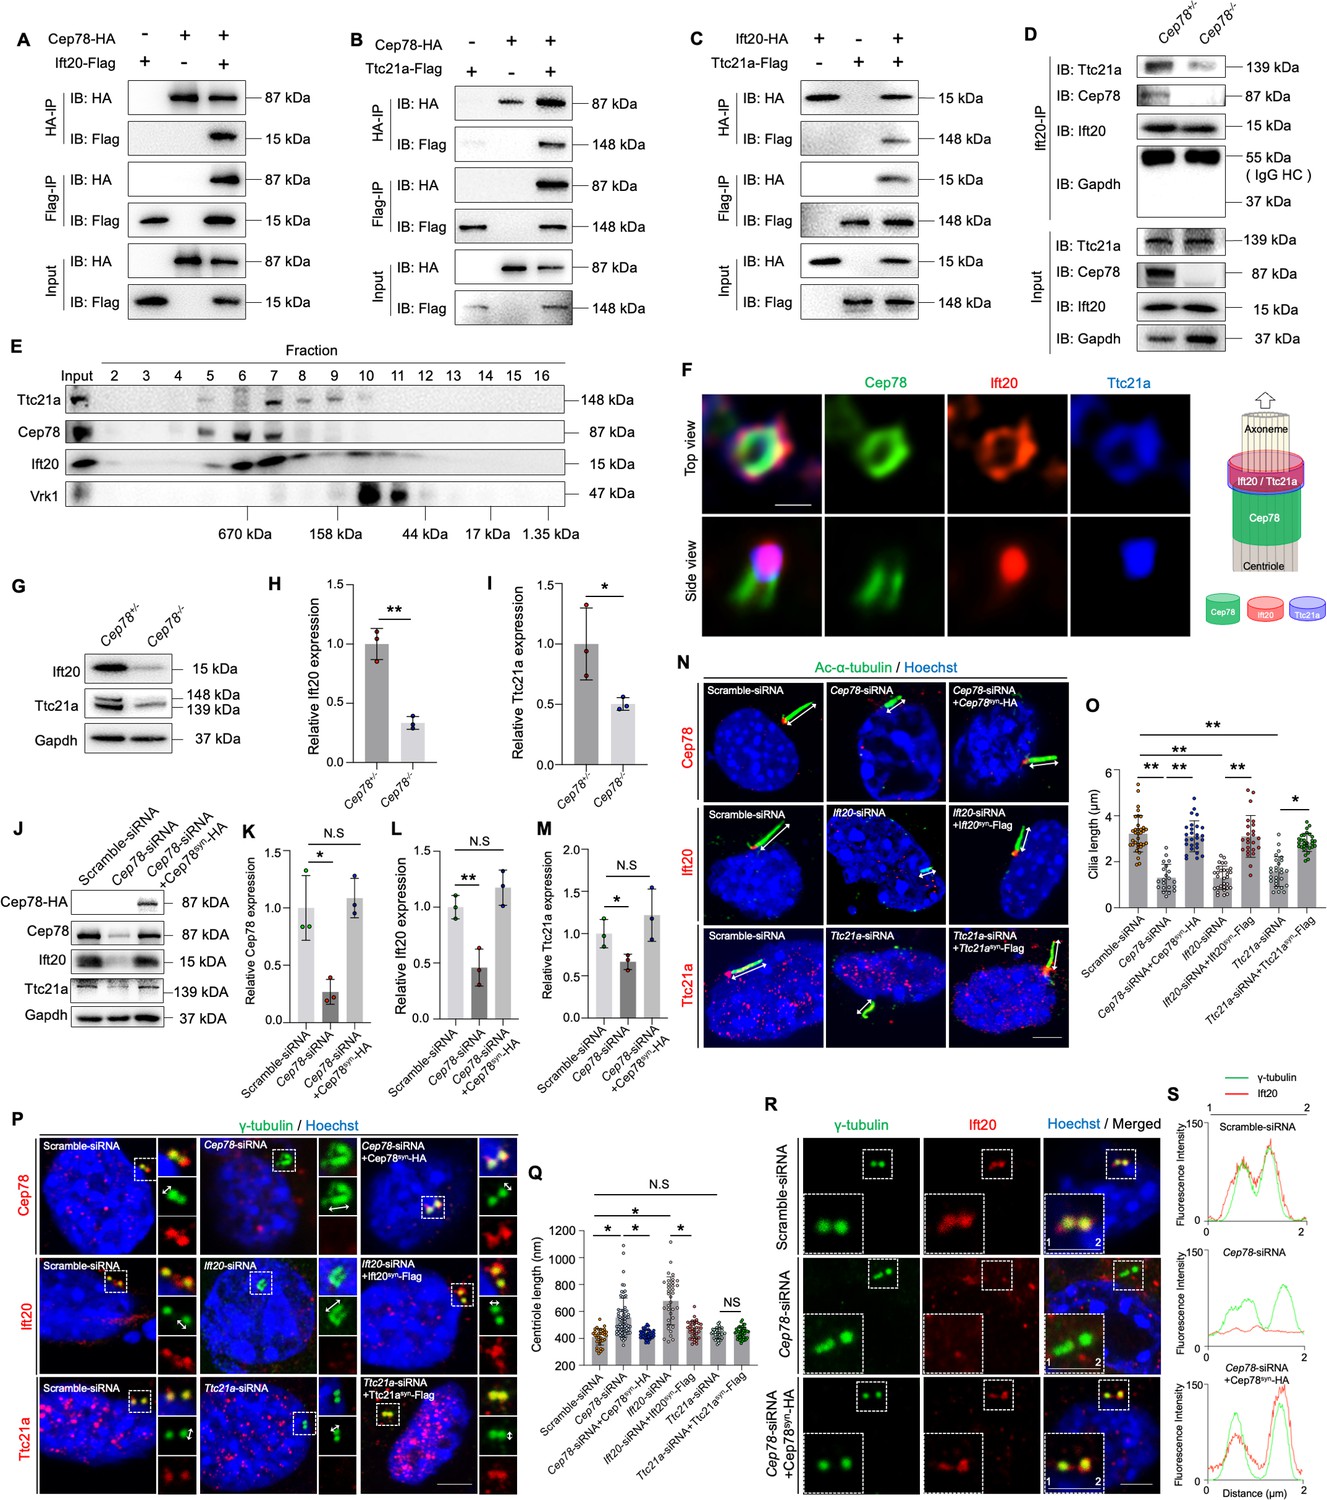
CEP78 interacted physically with IFT20 and TTC21A to regulate ciliary axonemal and centriole elongations.
(A–C) HEK293T cells were co-transfected with plasmids expressing Cep78-HA and Ift20-Flag (A), Cep78-HA and Ttc21a-Flag (B), or Ift20-HA and Ttc21a-Flag (C). Cellular lysates were immunoprecipitated with an anti-HA or anti-Flag antibody in 1% Sodium dodecyl sulfate (SDS) and then immunoblotted (IB) with anti-HA or anti-Flag antibodies. (D) Lysates of testicular tissues from Cep78+/− and Cep78−/− male mice were immunoprecipitated with anti-Ift20 antibody in 1% SDS and then immunoblotted with anti-Ttc21a, anti-Cep78, anti-Ift20, and anti-Gapdh antibodies. To balance the protein amount of Ift20 and Ttc21a between Cep78+/− and Cep78−/− testes, the amount of input and proteins for immunoprecipitation in Cep78−/− was three times that of Cep78+/−. HC, Heavy chain. (E) Mouse testicular lysates were chromatographed on a Superpose-6 size exclusion column, and the resulting fractions (Fractions 2–16) were western blotted with the indicated antibodies of Ttc21a, Cep78, and Ift20 with Vaccinia related kinase 1 (Vrk1) as a negative control. (F) 3D structured illumination microscopy (SIM) analysis (left) and schematic diagram (right) of localizations of CEP78, Ift20, and Ttc21a in NIH3T3 cells, scale bar = 200 nm. (G–I) Immunoblotting showed Ift20 and Ttc21a expressions in lysates of testes from Cep78+/− and Cep78−/− mice. (G) Representative images along with the quantification results were shown (H–I); three biological replications for Cep78+/− and Cep78−/− testes, two-tailed Student’s t-test.(J–M) Expression levels of Cep78 (J and K), Ift20 (J and L), Ttc21a (J and M), and Cep78-HA (J) proteins were tested in NIH3T3 cells transfected with scramble siRNA, Cep78-siRNA, and Cep78-siRNA+Cep78syn-HA through western blot (three biological replications for scramble siRNA, Ift20-siRNA, and Ift20-siRNA+Ift20syn-Flag, two-tailed Student’s t-test). (N–Q) Cilia (N) and centrioles (P) in cells transfected with scramble siRNA, Cep78-siRNA, Ift20-siRNA, Ttc21a-siRNA, Cep78-siRNA+Cep78syn-HA, Ift20-siRNA+Ift20syn-Flag, and Ttc21a-siRNA+Ttc21asyn-Flag were stained with anti-Ac-α-tubulin and anti-γ-tubulin, respectively. Nuclei were counterstained with Hoechst (blue). Cilium and centriole structures were recognized by double-head arrows. Scale bar, 2 μm. The quantification results were shown. (O and Q) Comparisons in cilia and centriole size between the above-mentioned samples were addressed by accumulated data from three independent experiments, for cilia length: n=34 for scramble-siRNA, n=21 for Cep78 siRNA, n=27 for Cep78-siRNA+Cep78syn-HA, n=30 for Ift20 siRNA, n=24 for Ift20-siRNA+Ift20syn-Flag, n=27 for Ttc21a siRNA, n=30 for Ttc21a-siRNA+Ttc21asyn-Flag; for centriole length: n=34 for scramble-siRNA, n=67 for Cep78 siRNA, n=39 for Cep78-siRNA+Cep78syn-HA, n=35 for Ift20 siRNA, n=36 for Ift20-siRNA+Ift20syn-Flag, n=33 for Ttc21a siRNA, n=42 for Ttc21a-siRNA+Ttc21asyn-Flag; one-way ANOVA, with Dunnet´s multiple comparison test amongst all groups. (R and S) Cells transfected with scramble siRNA, Cep78-siRNA, and Cep78-siRNA+Cep78syn-HA were stained with anti-Ift20 and anti-γ-tubulin to reveal the intensities and locations of Ift20 and centrioles. Fluorescence intensity traces are plotted. Scale bar, 2 µm. N.S, not significant, *, p<0.05; **, p<0.01.
-
Figure 7—source data 1
Uncropped blots of Figure 7A–E, G and J.
- https://cdn.elifesciences.org/articles/76157/elife-76157-fig7-data1-v2.zip
-
Figure 7—source data 2
Original numbers used for quantification in Figure 7H, I, K-M, O, Q, and S.
- https://cdn.elifesciences.org/articles/76157/elife-76157-fig7-data2-v2.xlsx
-
Figure 7—source data 3
Immunofluorescence analysis images in Figure 7F, N and P (Row 3), and R.
- https://cdn.elifesciences.org/articles/76157/elife-76157-fig7-data3-v2.zip
-
Figure 7—source data 4
Immunofluorescence analysis images in Figure 7P (Rows 1–2).
- https://cdn.elifesciences.org/articles/76157/elife-76157-fig7-data4-v2.zip
Figure 7—figure supplement 1
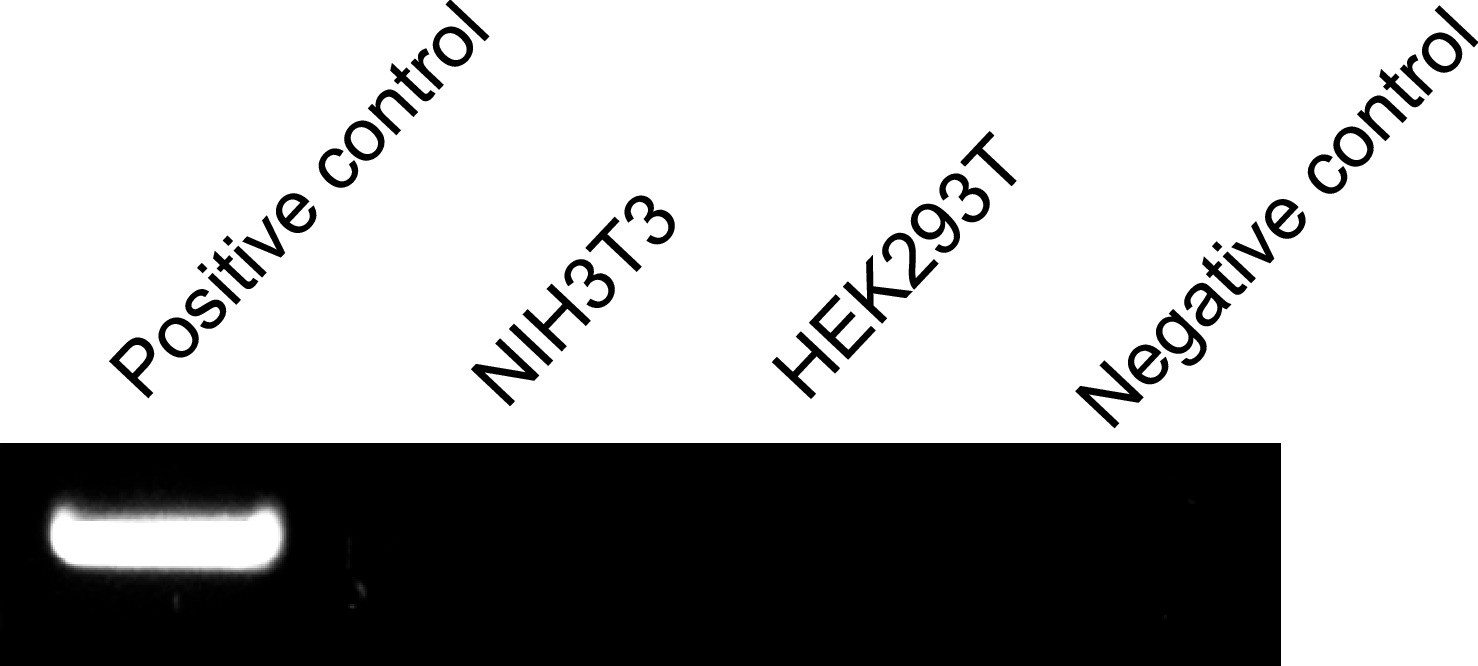
PCR test of mycoplasma in cell lines used in this study.
Positive control: mycoplasma DNA sample provided with mycoplasma PCR testing kit. NIH3T3: culture medium of NIH3T3 cells. HEK293T: culture medium of 293T cells. Negative control: culture medium before cell culture.
-
Figure 7—figure supplement 1—source data 1
Uncropped gel of Figure 7—figure supplement 1.
- https://cdn.elifesciences.org/articles/76157/elife-76157-fig7-figsupp1-data1-v2.zip
Figure 7—figure supplement 2
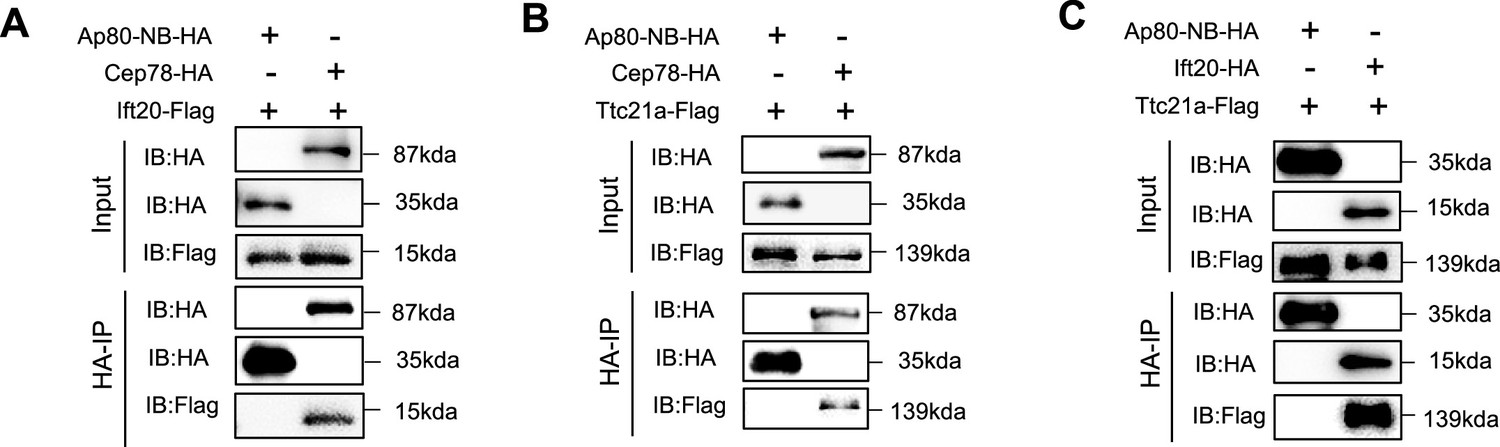
Co-immunoprecipitation (Co-IP) between Cep78, Ift20, and Ttc21a with negative control.
HEK293T cells were co-transfected with plasmids expressing Cep78-HA, Ift20-Flag, and Ap80-NB-HA (A), Cep78-HA, Ttc21a-Flag, and Ap80-NB-HA (B), or Ift20-HA, Ttc21a-Flag, and Ap80-NB-HA (C). Cellular lysates were immunoprecipitated with an anti-HA in 1% SDS and then immunoblotted (IB) with anti-HA or anti-Flag antibodies.
-
Figure 7—figure supplement 2—source data 1
Uncropped blots of Figure 7—figure supplement 2.
- https://cdn.elifesciences.org/articles/76157/elife-76157-fig7-figsupp2-data1-v2.zip
Figure 7—figure supplement 3
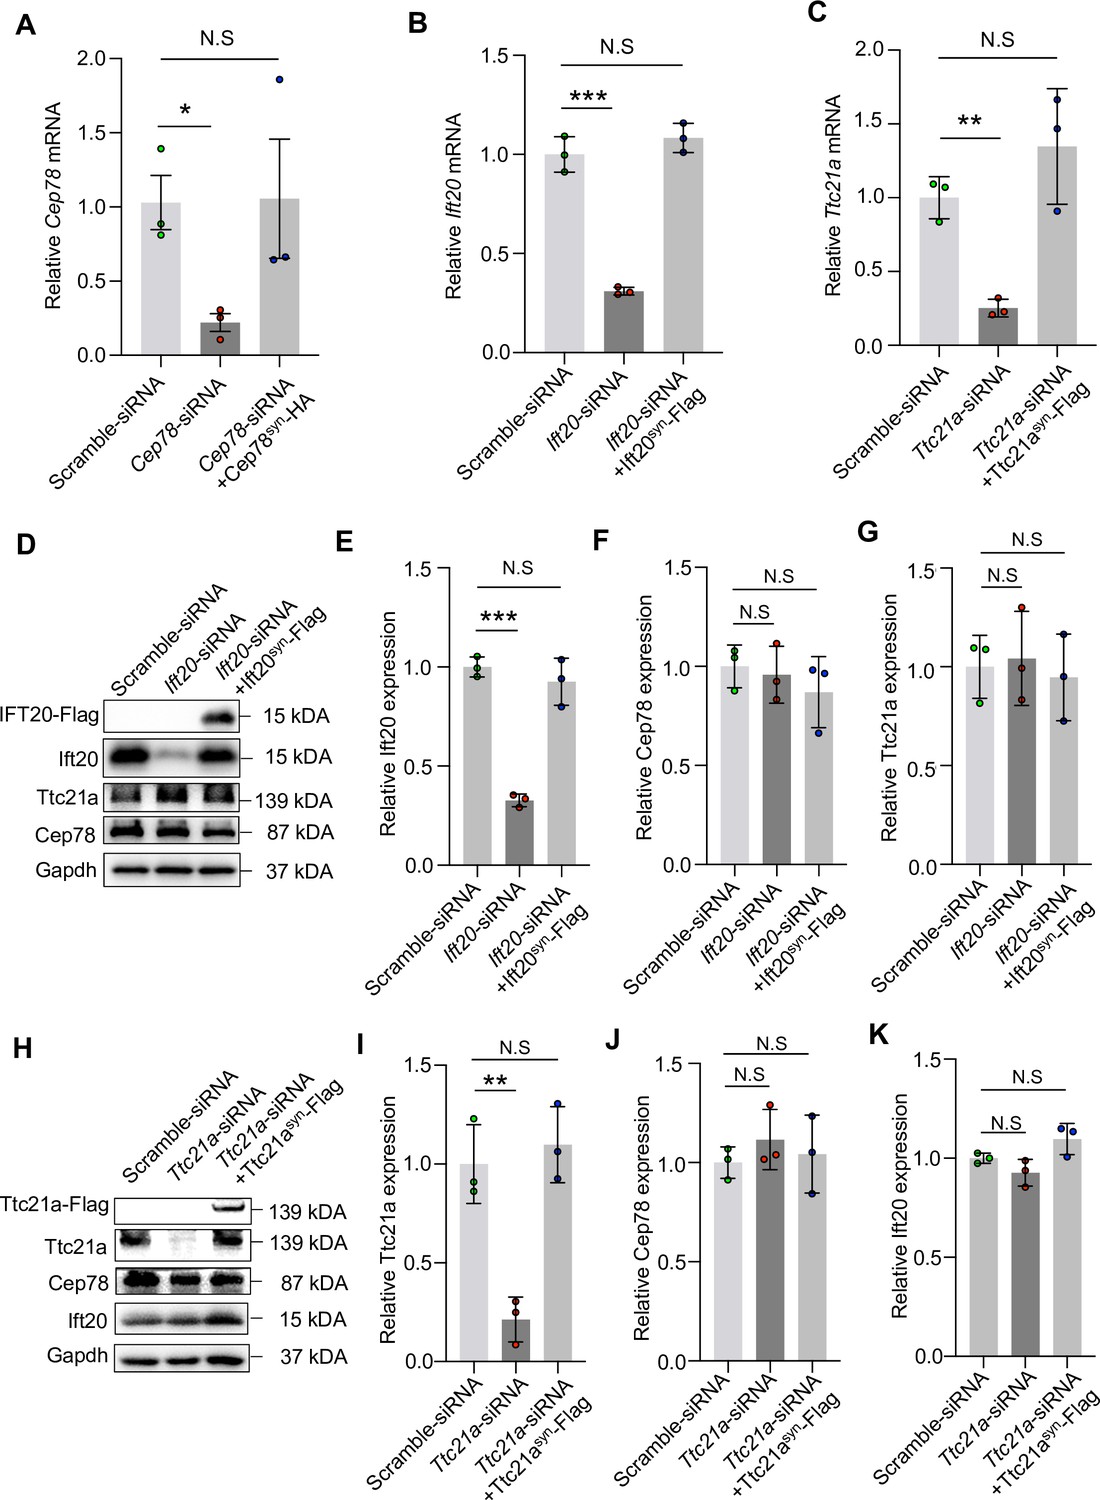
Expressions of Cep78, Ift20, and Ttc21a mRNAs in NIH3T3 cells transfected with siRNAs and rescue plasmids.
(A) Cep78 mRNA expression was tested using quantitative Polymerase Chain Reaction (Q-PCR) in cells transfected with scramble siRNA, Cep78-siRNA, and Cep78-siRNA+Cep78syn-HA. (B) Ift20 mRNA expression was monitored in cells transfected with scramble siRNA, Ift20-siRNA, and Ift20-siRNA+Ift20syn-Flag using Q-PCR. (C) Ttc21a mRNA level was detected in cells transfected with scramble siRNA, Ttc21a-siRNA, and Ttc21a-siRNA+Ttc21asyn-Flag by Q-PCR. (D–G) Expression levels of Ift20 (D and E), Cep78 (D and F), Ttc21a (D and G), and Ift20-Flag (D) protein were tested in cells transfected with scramble siRNA, Ift20-siRNA, and Ift20-siRNA+Ift20syn-Flag by western blot. (H–K) Western blot examined expression levels Ttc21a (H and I), Cep78 (H and J), Ift20 (H and K), and Ttc21a-Flag (H) protein of cells transfected with scramble siRNA, Ttc21a-siRNA, and Ttc21a-siRNA+Ttc21asyn-Flag. The above-mentioned experiments were done with three biological replications, two-tailed Student’s t-test. *, p<0.05; **, p<0.01; N.S, not significant.
-
Figure 7—figure supplement 3—source data 1
Uncropped blots of Figure 7—figure supplement 3D, H.
- https://cdn.elifesciences.org/articles/76157/elife-76157-fig7-figsupp3-data1-v2.zip
-
Figure 7—figure supplement 3—source data 2
Original numbers used for quantification in Figure 7—figure supplement 3A-C, E-G, and I-K.
- https://cdn.elifesciences.org/articles/76157/elife-76157-fig7-figsupp3-data2-v2.xlsx
Figure 7—figure supplement 4
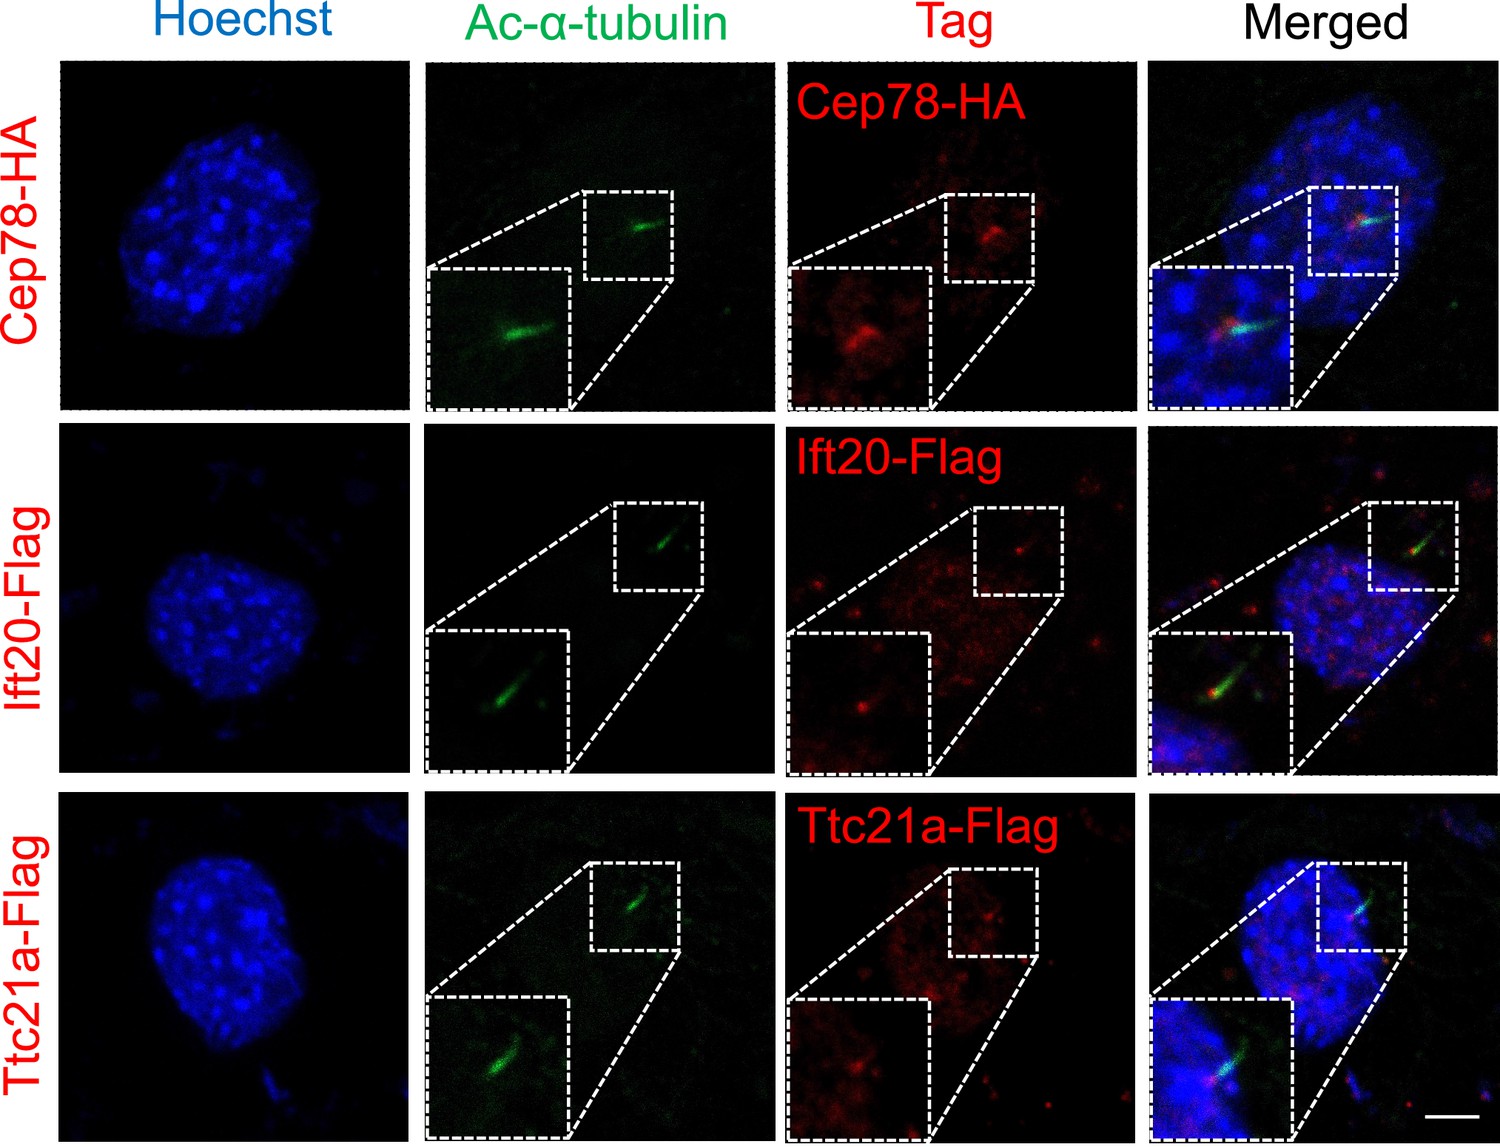
Cep78,Ift20, and Ttc21a located in the base of the cilium.
HA-tag, Flag-tag, and cilia in NIH3T3 cells overexpressing Cep78-HA, Ift20-Flag, or Ttc21a-Flag were visualized using antibodies against HA, Flag, and Ac-α-tubulin, respectively. Nuclei were counterstained with Hoechst (blue).
-
Figure 7—figure supplement 4—source data 1
Immunofluorescence analysis images in Figure 7—figure supplement 4.
- https://cdn.elifesciences.org/articles/76157/elife-76157-fig7-figsupp4-data1-v2.zip
Figure 7—figure supplement 5
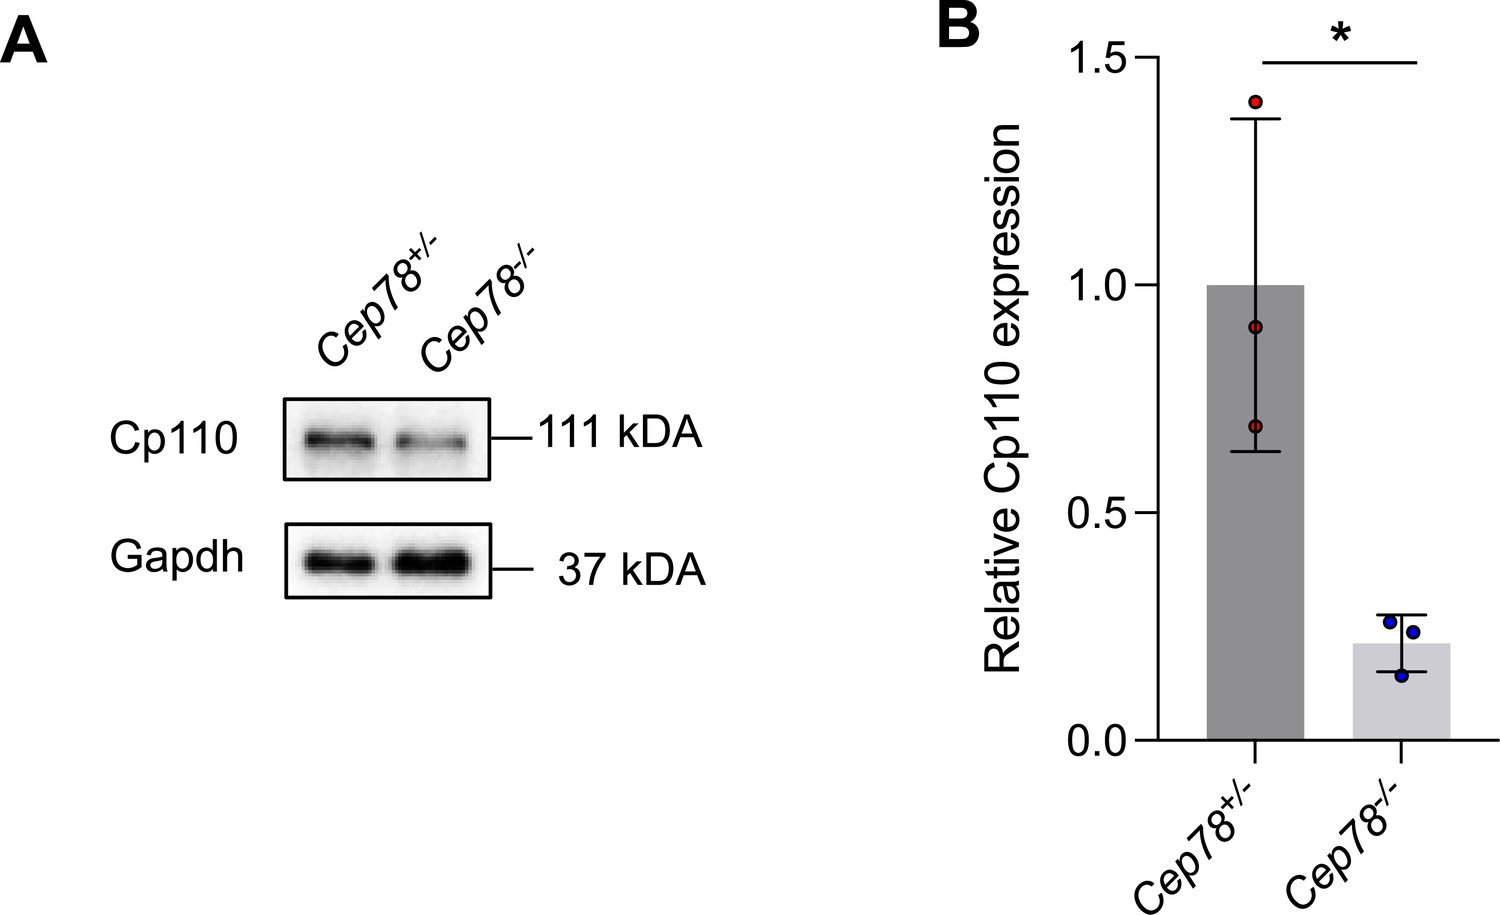
Immunoblotting showed Cp110 expressions in lysates of testes from Cep78+/− and Cep78−/− mice.
(A) Representative images along with the quantification results were shown (B, three biological replications for Cep78+/− and Cep78−/− testes, two-tailed Student’s t-test). *, p<0.05.
-
Figure 7—figure supplement 5—source data 1
Uncropped blots of Figure 7—figure supplement 5.
- https://cdn.elifesciences.org/articles/76157/elife-76157-fig7-figsupp5-data1-v2.zip
-
Figure 7—figure supplement 5—source data 2
Original numbers used for quantification in Figure 7—figure supplement 5.
- https://cdn.elifesciences.org/articles/76157/elife-76157-fig7-figsupp5-data2-v2.xlsx
Figure 8
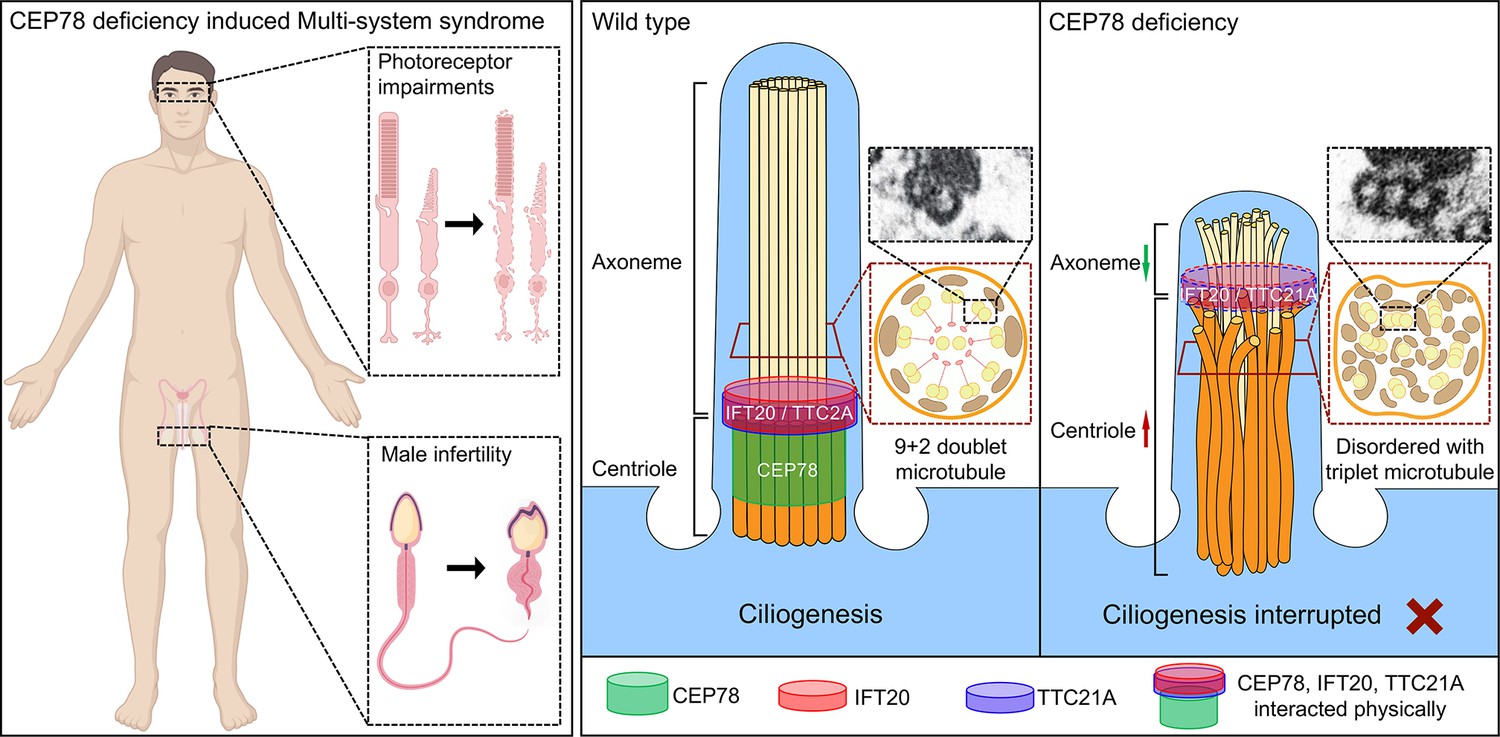
Schematic diagram of pathogenesis induced by CEP78 deficiency.
Loss of CEP78 deregulated the expression of and interactions between IFT20 and TTC21A, two proteins interacted physically with CEP78. CEP78 deficiency causes elongated centrioles, shortened axonemes, abnormal presence of triplet microtubules, and disordered 9+2 microtubule axoneme.
Tables
Table 1
Semen characteristics and sperm morphology in Cep78−/− male mice and the Chinese man carrying CEP78 mutation.
| Cep78−/− male mice | Cep78+/− male mice | Patient | Reference value* | |
|---|---|---|---|---|
| Semen parameters | ||||
| Semen volume (mL) | - | - | 2.6 | 1.5 |
| Sperm concentration (106/mL) | 9.48±1.75 | 30.45±3.21 | 14.298 | 15 |
| Motility (%) | 8.44±1.90 | 71.45±2.24 | 11.428 | 40 |
| Progressive motility (%) | 0 | 22.72±2.24 | 2.857 | 32 |
| Sperm morphology | ||||
| Normal spermatozoa (%) | 0 | 84.07±1.78 | 0 | 4 |
| Abnormal head (%) | 92.10±3.68 | 3.88±0.67 | 95.42 | - |
| Abnormal neck (%) | 82.61±1.39 | 3.89±1.22 | 85.62 | - |
| Abnormal flagella (%) | 95.67±1.98 | 12.50±1.60 | 97.39 | - |
| Short flagella (%) | 39.08±2.74 | 2.15±0.76 | 22.88 | - |
| Absent flagella (%) | 32.26±2.58 | 1.73±0.40 | 21.57 | - |
| Coiled flagella (%) | 7.71±0.98 | 3.45±0.46 | 15.69 | - |
| Multi flagella (%) | 6.01±1.29 | 1.30±0.30 | 10.46 | - |
| Cytoplasm remains (%) | 4.51±1.29 | 1.94±0.65 | 15.03 | - |
| Irregular caliber (%) | 2.59±1.74 | 0.21±0.37 | 6.54 | - |
| Angulation (%) | 3.49±2.06 | 1.73±0.40 | 5.23 | - |
| 1The lower limit of reference value (WHO laboratory manual for the examination and processing of human sperm). | ||||
-
*
The lower limit of reference value (WHO laboratory manual for the examination and processing of human sperm).
Table 2
Cep78* interacting proteins identified with immunoprecipitation coupled with quantitative mass spectrometry (IP-MS).
| Genes | Proteins | Q-value | Fold change (Cep78+/− vs Cep78−/−) |
|---|---|---|---|
| Ehd1 | EH domain-containing protein 1 | 0 | 3.69472331 |
| Traf3ip1 | TRAF3-interacting protein 1 | 0 | 4.46937703 |
| Armc4 | Armadillo repeat-containing protein 4 | 0 | 6.50427256 |
| Cep131 | Centrosomal protein of 131 kDa | 0 | 10.1830839 |
| Cct8 | T-complex protein 1 subunit theta | 0 | 27.7594376 |
| Dync2h1 | Cytoplasmic dynein 2 heavy chain 1 | 0 | 3.52034955 |
| Dync2li1 | Cytoplasmic dynein 2 light intermediate chain 1 | 0 | 2.35693042 |
| Hspb11 | Intraflagellar transport protein 25 homolog | 0 | 2.591138 |
| Ift122 | Intraflagellar transport protein 122 homolog | 0 | 73,932 |
| Ift140 | Intraflagellar transport protein 140 homolog | 0 | 20,456 |
| Ift20 | Intraflagellar transport protein 20 homolog | 0 | 16.4424842 |
| Pfkm | ATP-dependent 6-phosphofructokinase, muscle type | 0 | 90,119 |
| Spef1 | Sperm flagellar protein 1 | 0 | 3.34178683 |
| Ttc21a | Tetratricopeptide repeat protein 21 A | 0 | 3.12239761 |
| Ttc21b | Tetratricopeptide repeat protein 21B | 0 | 3.17696419 |
| Ttc30a1 | Tetratricopeptide repeat protein 30A1 | 0.0024355 | 38,700 |
-
*
The antibody against mouse Cep78 (p457-741) was used for IP-MS analysis.
Table 3
Primers used in this study.
| Gene/RNA | Forward primer (5’→3’) | Reverse primer (5’→3’) |
|---|---|---|
| Genotyping | ||
| Cep78-null allele | CTCTGGTCATCCCTTTGTCTAATT | TAAGACCAAACGACTTCCTCAAAC |
| Wild type Cep78 allele | CTCTGGTCATCCCTTTGTCTAATT | CCTCTAAGAGCCTTACATAACTGG |
| Quantitative PCR (Q-PCR) | ||
| Cep78 | GTTGGTTCTGAAAACTGGAATAGG | GTCCATTGGCAAATATTAACTTGAA |
| Ift20 | TGAACTGAACAAGCTCCGAGT | GCAAGTTCCGAGCACCAAT |
| Ttc21a | GGCAGGATTGGGATCAGACG | GGTTTGGATTGTGGGGCTCT |
| 18S rRNA | CATTCGAACGTCTGCCCTATC | CCTGCTGCCTTCCTTGGA |
Table 4
Sequences of siRNAs and synonymous mutation sequences in rescue plasmid used in this study.
| Sequence (5’→3’) | Synonymous mutation sequence in rescue plasmid (5’→3’) | |
|---|---|---|
| Scramble-siRNA | sense: UUCUCCGAACGUGUCACGUTT | |
| Cep78-siRNA | sense: GCACUUGUCUCUUGCAAAUTT | ACATTTATCCCTCCGAAC |
| Ift20-siRNA | sense: GUGGUCUAAUUGAGCUUGUTT | GCGGCCTGATCGAACTCGT |
| Ttc21a-siRNA | sense: GCGCCCUGAAAUCCUAUAATT | GTGCACTTAAGTCTTACAA |
Table 5
Antibodies and dyes used in this study.
| Anti-protein | Host | Dilution and application | Supplier |
|---|---|---|---|
| CEP78-human | Rabbit | 1:1000, Immunoblotting | Abclonal (custom made) |
| GAPDH-human | Rabbit | 1:3000, Immunoblotting | Abways |
| Cep78-mouse | Rabbit | 1:1000, Immunoblotting; 1:100, Immunofluorescence | Abclonal (custom made) |
| Gapdh-mouse | Rabbit | 1:3000, Immunoblotting | Abways |
| Cone arrestin | Rabbit | 1:100, Immunofluorescence | Millipore |
| Peanut agglutinin (PNA) | 1:500, Immunofluorescence | VectorLaboratories | |
| Ac-α-tubulin | Rabbit | 1:100, Immunofluorescence (retina) | Abcam |
| Ac-α-tubulin | Mouse | 1:1000, Immunofluorescence (sperm) | Sigma-Aldrich |
| Centrin 1 | Rabbit | 1:100, Immunofluorescence | Proteintech |
| γ-tubulin | Mouse | 1:1000, Immunofluorescence | Sigma-Aldrich |
| α-tubulin | Rabbit | 1:100, Immunofluorescence | Beyotime |
| Transition protein 1 | Rabbit | 1:200, Immunofluorescence | Proteintech |
| α-tubulin | Rabbit | 1:100, Immunofluorescence | Beyotime |
| HA | Rabbit | 1:1000, Immunoblotting; 1:200, Immunofluorescence | Sigma-Aldrich |
| Flag | Rabbit | 1:1000, Immunoblotting; 1:200, Immunofluorescence | MBL |
| Ttc21a | Rabbit | 1:500, Immunoblotting, 1:100, Immunofluorescence | ABNOVA |
| Ift20 | Rabbit | 1:1000, Immunoblotting, 1:100, Immunofluorescence | Proteintech |
| Vrk1 | Mouse | 1:500, Immunoblotting | Santa Cruz |
| γH2ax | Mouse | 1:500, Immunofluorescence | Abcam |
| Sycp3 | Rabbit | 1:200, Immunofluorescence | Proteintech |
Additional files
-
Supplementary file 1
Protein groups and cellular components analysis of mass spectrometry (MS) proteomics on elongating spermatids lysates of Cep78+/− and Cep78−/− mice.
(A) Different expression proteins between Cep78+/− and Cep78−/− male mice elongating spermatids. (B) The enriched cellular components of different expression proteins between Cep78+/− and Cep78−/− male mice elongating spermatids.
- https://cdn.elifesciences.org/articles/76157/elife-76157-supp1-v2.xlsx
-
Transparent reporting form
- https://cdn.elifesciences.org/articles/76157/elife-76157-transrepform1-v2.docx
Download links
A two-part list of links to download the article, or parts of the article, in various formats.
Downloads (link to download the article as PDF)
Open citations (links to open the citations from this article in various online reference manager services)
Cite this article (links to download the citations from this article in formats compatible with various reference manager tools)
Absence of CEP78 causes photoreceptor and sperm flagella impairments in mice and a human individual
eLife 12:e76157.
https://doi.org/10.7554/eLife.76157


