FER-mediated phosphorylation and PIK3R2 recruitment on IRS4 promotes AKT activation and tumorigenesis in ovarian cancer cells
- School of Life Science and Technology, ShanghaiTech University, China
- Department of Gynecology, Women’s Hospital of Nanjing Medical University, Nanjing Maternity and Child Health Care Hospital, China
- ENT Institute and Department of Otorhinolaryngology, Eye & ENT Hospital, Fudan University, China
Figures
Figure 1
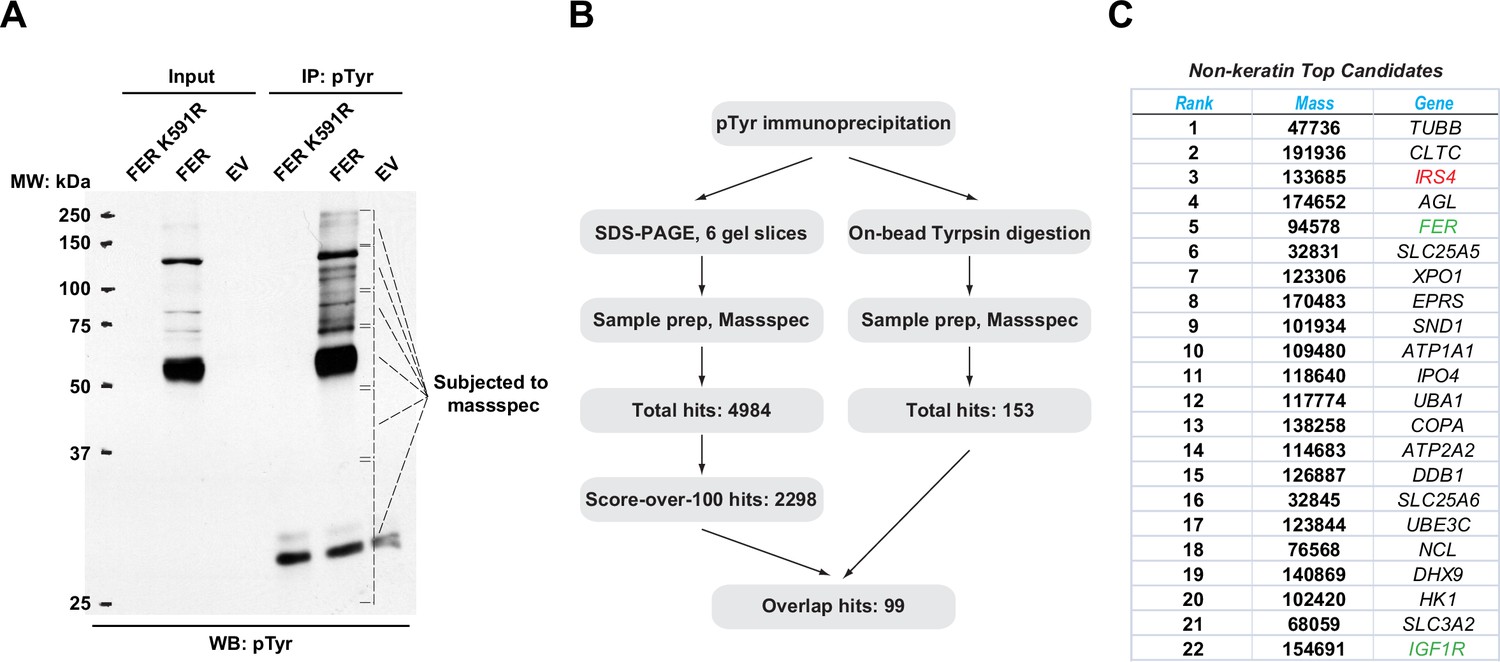
Mass spectrometry analysis identified insulin receptor substrate 4 (IRS4) as a novel substrate of FER.
(A) FER-WT or FER-K591R was transfected into HEK293FT cells, followed by immunoprecipitation with antibody against pTyr. Immunoprecipitates and whole cell lysates were subjected to immublotting analysis with anti-pTyr antibody (Figure 1—source data 1). (B) Experimental flow chart and results of two methods for potential substrates identification of FER kinase. The immunoprecipitated samples were subjected to in-gel (left) or on-bead (right) tryptic digestion, followed by mass spectrometry protein identification. (C) Top-ranked overlapping candidate genes from both mass spectrometry analyses listed in B. Keratin genes were not shown.
-
Figure 1—source data 1
Original images for Western blots in Figure 1A.
- https://cdn.elifesciences.org/articles/76183/elife-76183-fig1-data1-v1.zip
Figure 2 with 3 supplements
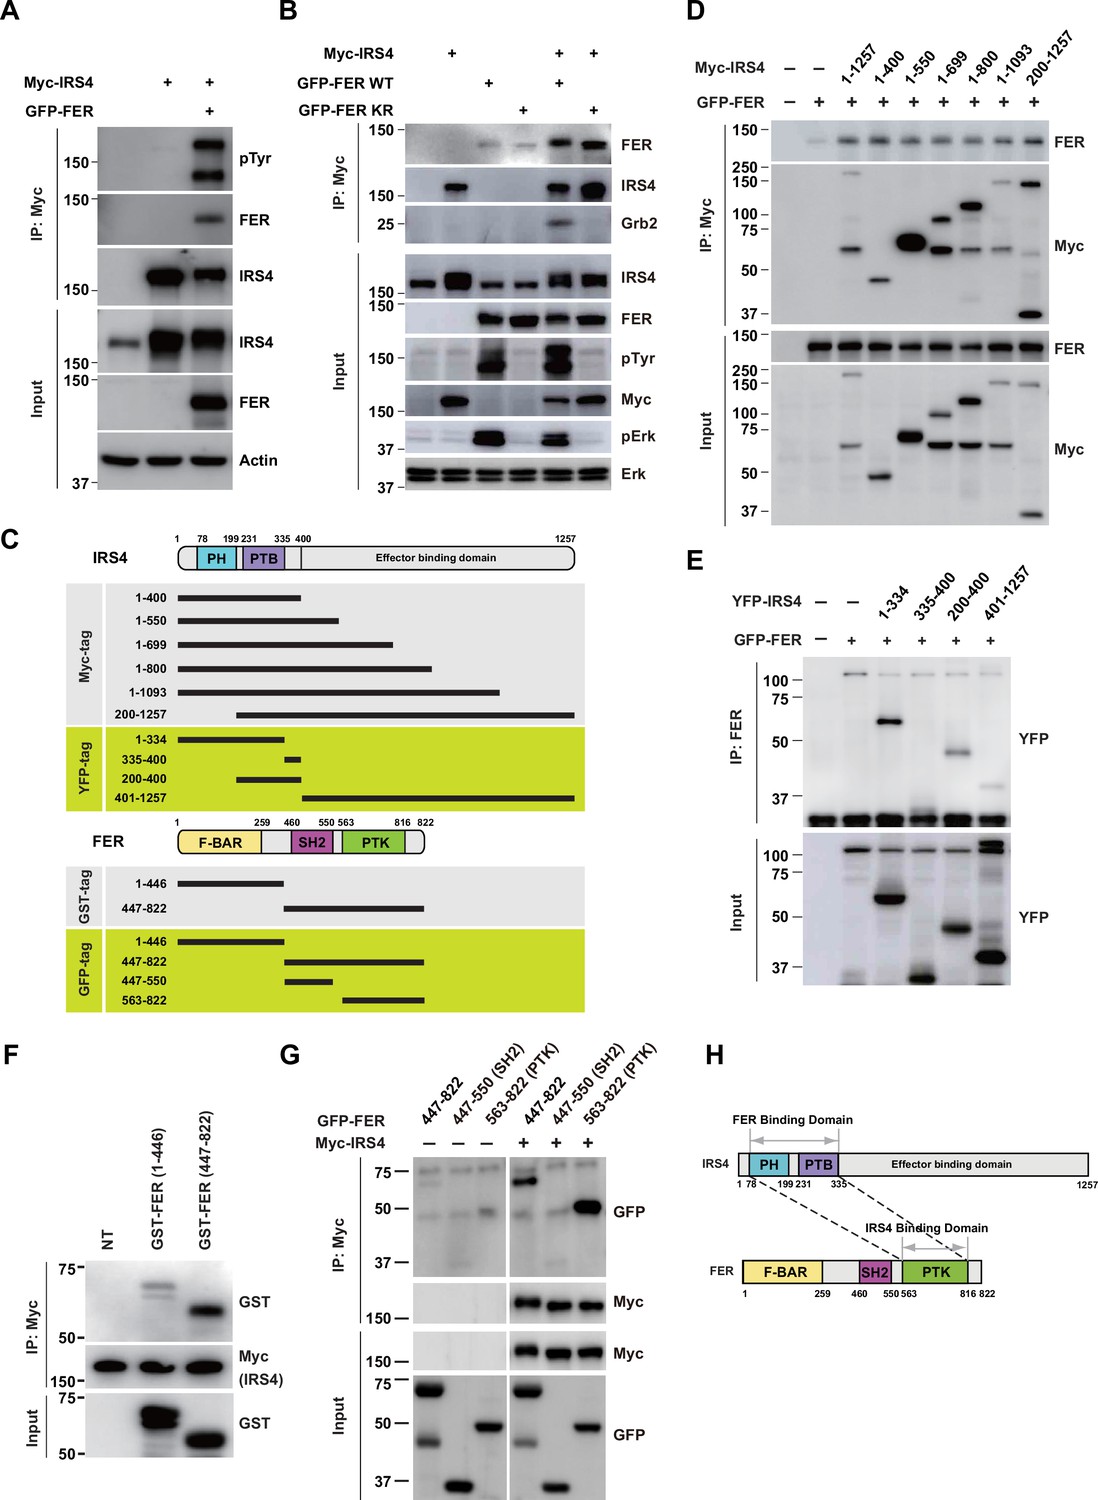
FER engaged its kinase domain to physically interact with PH and PTB domains of insulin receptor substrate 4 (IRS4).
(A) Myc-tagged IRS4 were transiently transfected alone, or together with FER in HEK293FT cells, followed by immunoprecipitation with resin against Myc-tag, and immunoblotting with IRS4, FER, 4G10 antibodies, respectively. The interaction of FER with IRS4 was examined. Expressions of IRS4, FER, and loading control actin in whole cell lysate samples were also probed (Figure 2—source data 1). (B) After transient transfection with Myc-tagged IRS4, FER-WT, or KR mutant in HEK293FT cells, IRS4 was immunoprecipitated with resin against Myc-tag from cell lysates and probed for association with FER and GRB2. The blot was also probed with antibodies against IRS4, FER, 4G10, Myc, phosphor- and total-ERK in whole cell lysate samples (Figure 2—source data 2). (C) Schematic illustration of domain structure of IRS4 and FER. PH: pleckstrin homology; PTB: phosphotyrosine binding. Multiple truncation mutants of IRS4, including fragments corresponding to amino acid residues 1–400, 1–550, 1–699, 1–800, 1–1093, 200–1257, 1–334, 335–400, 200–400, and 401–1257, with Myc or YFP tag were also listed. F-BAR: FER/CIP4 homology/Bin1/amphiphysin/RVS; SH2: Src homology 2; PTK: protein tyrosine kinase; multiple truncation mutants of FER, including fragments corresponding to amino acid residues 1–446, 447–822, 447–550, and 563–822, with GST or GFP tag were also listed. (D) FER was expressed alone or co-expressed with a series of Myc-tagged truncated forms of IRS4 in HEK293FT cells, as indicated. Lysates were harvested and immunoprecipitated with anti-Myc resin. The associations of FER with different IRS4 truncation mutants were compared. Expressions of IRS4 and FER in whole cell lysate samples were also probed (Figure 2—source data 3). (E) HEK293FT cells were transiently co-transfected with GFP-tagged FER and truncated versions of IRS4 with YFP tag, followed by immunoprecipitation with FER antibody and immunoblotting with YFP antibody (Figure 2—source data 4). (F) Two truncated FER protein with GST tag were expressed and purified from Escherichia coli. Recombinant proteins were further incubated with whole HEK293FT cell lysates expressing Myc-tagged IRS4, respectively. Immunoprecipitates were subjected to immunoblotting analysis to assess the region requirement for IRS4 interaction (Figure 2—source data 5). (G) IRS4 was expressed alone or co-expressed with a series of GFP-tagged truncated forms of FER in HEK293FT cells, as indicated. Lysates were harvested and immunoprecipitated with anti-Myc resin. The associations of IRS4 with different FER truncation mutants were compared. Expressions of IRS4 and FER in whole cell lysate samples were also probed (Figure 2—source data 6). (H) Schematic illustration of regions involved in binding between IRS4 and FER.
-
Figure 2—source data 1
Original images for Western blots in Figure 2A.
- https://cdn.elifesciences.org/articles/76183/elife-76183-fig2-data1-v1.zip
-
Figure 2—source data 2
Original images for Western blots in Figure 2B.
- https://cdn.elifesciences.org/articles/76183/elife-76183-fig2-data2-v1.zip
-
Figure 2—source data 3
Original images for Western blots in Figure 2D.
- https://cdn.elifesciences.org/articles/76183/elife-76183-fig2-data3-v1.zip
-
Figure 2—source data 4
Original images for Western blots in Figure 2E.
- https://cdn.elifesciences.org/articles/76183/elife-76183-fig2-data4-v1.zip
-
Figure 2—source data 5
Original images for Western blots in Figure 2F.
- https://cdn.elifesciences.org/articles/76183/elife-76183-fig2-data5-v1.zip
-
Figure 2—source data 6
Original images for Western blots in Figure 2G.
- https://cdn.elifesciences.org/articles/76183/elife-76183-fig2-data6-v1.zip
Figure 2—figure supplement 1
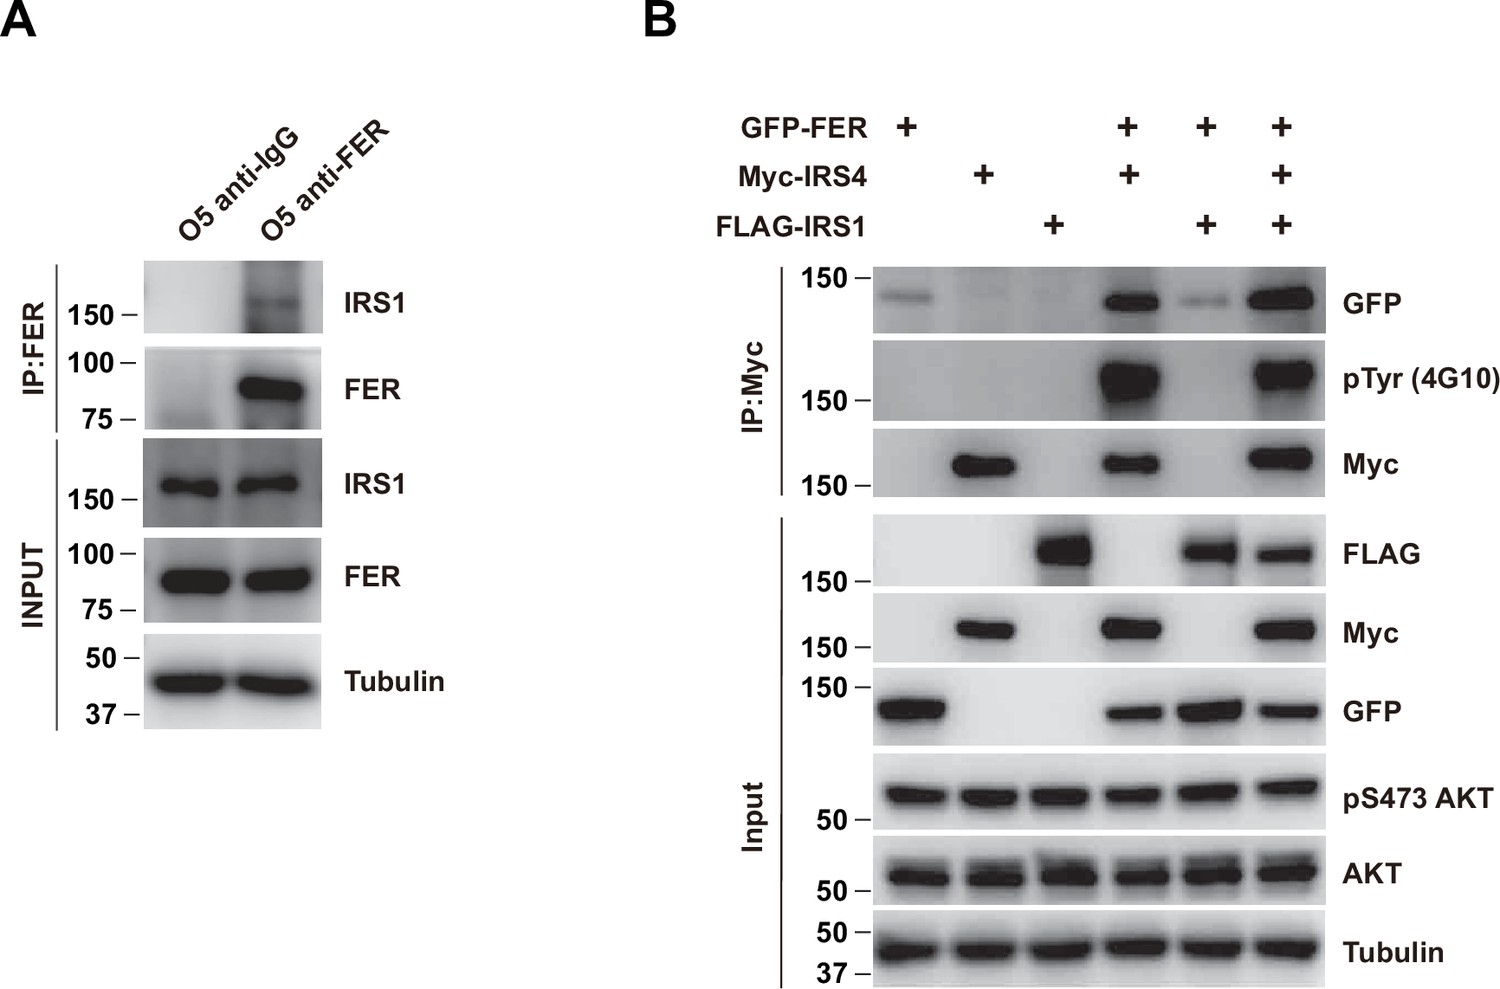
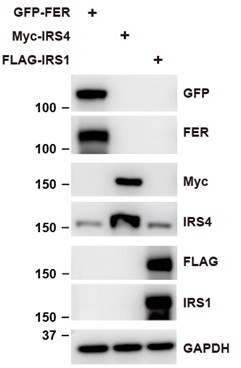
The association between FER and insulin receptor substrate 4 (IRS4) was not affected in the absence and/or presence of IRS1.
(A) Co-immunoprecipitation assay in OVCAR-5 cell line to demonstrate endogenous interaction between FER and IRS1 (Figure 2—figure supplement 1—source data 1). (B) GFP-tagged FER and Myc-tagged IRS4 were co-expressed in HEK293FT cells in the absence and/or presence of FLAG-tagged IRS1, as indicated. Lysates were harvested and immunoprecipitated with anti-Myc resin. The associations of IRS4 with FER were compared. Expressions of IRS1, IRS4, and FER in whole cell lysate samples were also probed (Figure 2—figure supplement 1—source data 2).
-
Figure 2—figure supplement 1—source data 1
Original images for Western blots in Figure 2—figure supplement 1A.
- https://cdn.elifesciences.org/articles/76183/elife-76183-fig2-figsupp1-data1-v1.zip
-
Figure 2—figure supplement 1—source data 2
Original images for Western blots in Figure 2—figure supplement 1B.
- https://cdn.elifesciences.org/articles/76183/elife-76183-fig2-figsupp1-data2-v1.zip
Figure 2—figure supplement 2
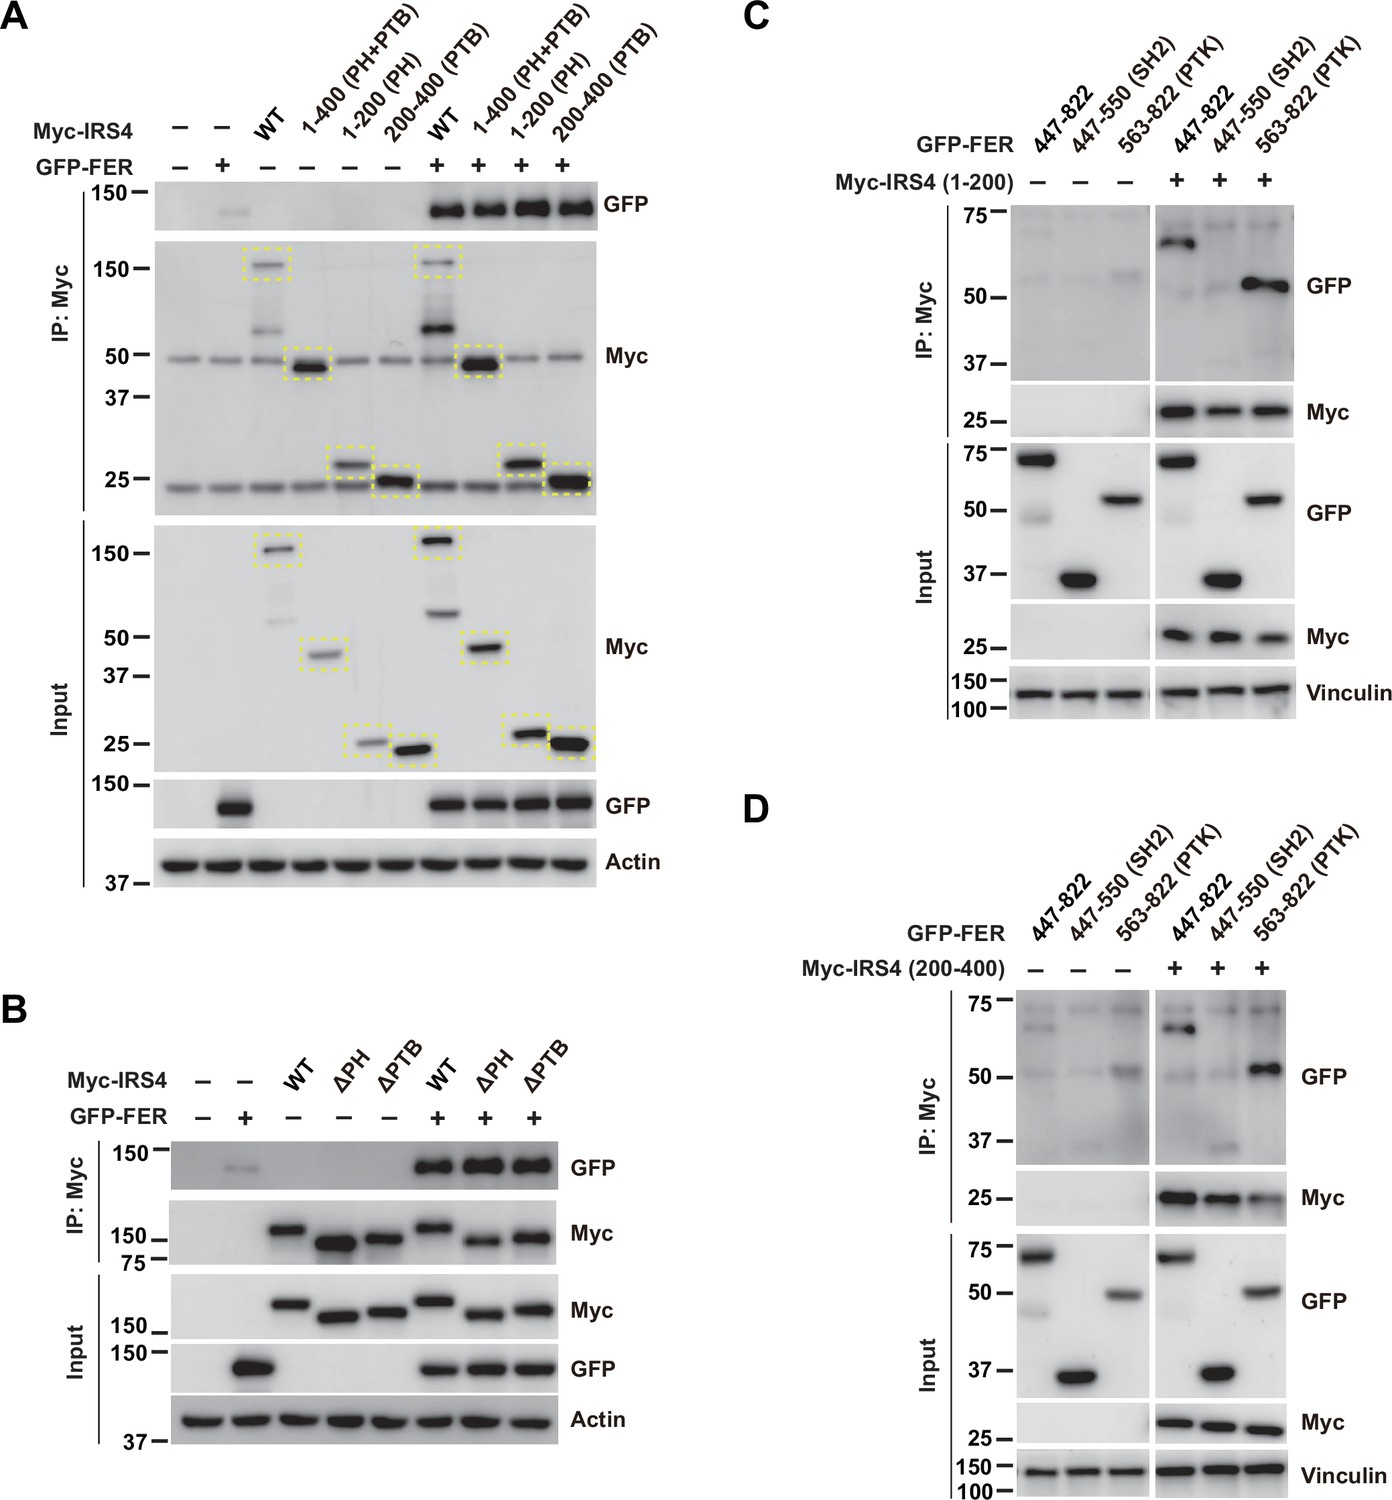
FER engaged its kinase domain to physically interact with PH and PTB domains of insulin receptor substrate 4 (IRS4).
(A) GFP-tagged FER was expressed alone or co-expressed with a series of Myc-tagged truncated forms of IRS4 in HEK293FT cells, as indicated. Lysates were harvested and immunoprecipitated with anti-Myc resin. The associations of FER with different IRS4 truncation mutants were compared. Expressions of IRS4 and FER in whole cell lysate samples were also probed (Figure 2—figure supplement 2—source data 1). (B) GFP-tagged FER was expressed alone or co-expressed with Myc-tagged IRS4 wild-type (WT) or deletion mutants in HEK293FT cells, as indicated. Lysates were harvested and immunoprecipitated with anti-Myc resin. The associations of FER with either PH or PTB deletion mutants of IRS4 were compared. Expressions of IRS4 and FER in whole cell lysate samples were also probed (Figure 2—figure supplement 2—source data 2). (C–D) 1–200aa or 200–400aa mutant of IRS4 was expressed alone or co-expressed with a series of GFP-tagged truncated forms of FER in HEK293FT cells, as indicated. Lysates were harvested and immunoprecipitated with anti-Myc resin. The associations of IRS4 with different FER truncation mutants were compared. Expressions of IRS4 and FER in whole cell lysate samples were also probed (Figure 2—figure supplement 2—source data 3–4).
-
Figure 2—figure supplement 2—source data 1
Original images for Western blots in Figure 2—figure supplement 2A.
- https://cdn.elifesciences.org/articles/76183/elife-76183-fig2-figsupp2-data1-v1.zip
-
Figure 2—figure supplement 2—source data 2
Original images for Western blots in Figure 2—figure supplement 2B.
- https://cdn.elifesciences.org/articles/76183/elife-76183-fig2-figsupp2-data2-v1.zip
-
Figure 2—figure supplement 2—source data 3
Original images for Western blots in Figure 2—figure supplement 2C.
- https://cdn.elifesciences.org/articles/76183/elife-76183-fig2-figsupp2-data3-v1.zip
-
Figure 2—figure supplement 2—source data 4
Original images for Western blots in Figure 2—figure supplement 2D.
- https://cdn.elifesciences.org/articles/76183/elife-76183-fig2-figsupp2-data4-v1.zip
Figure 2—figure supplement 3
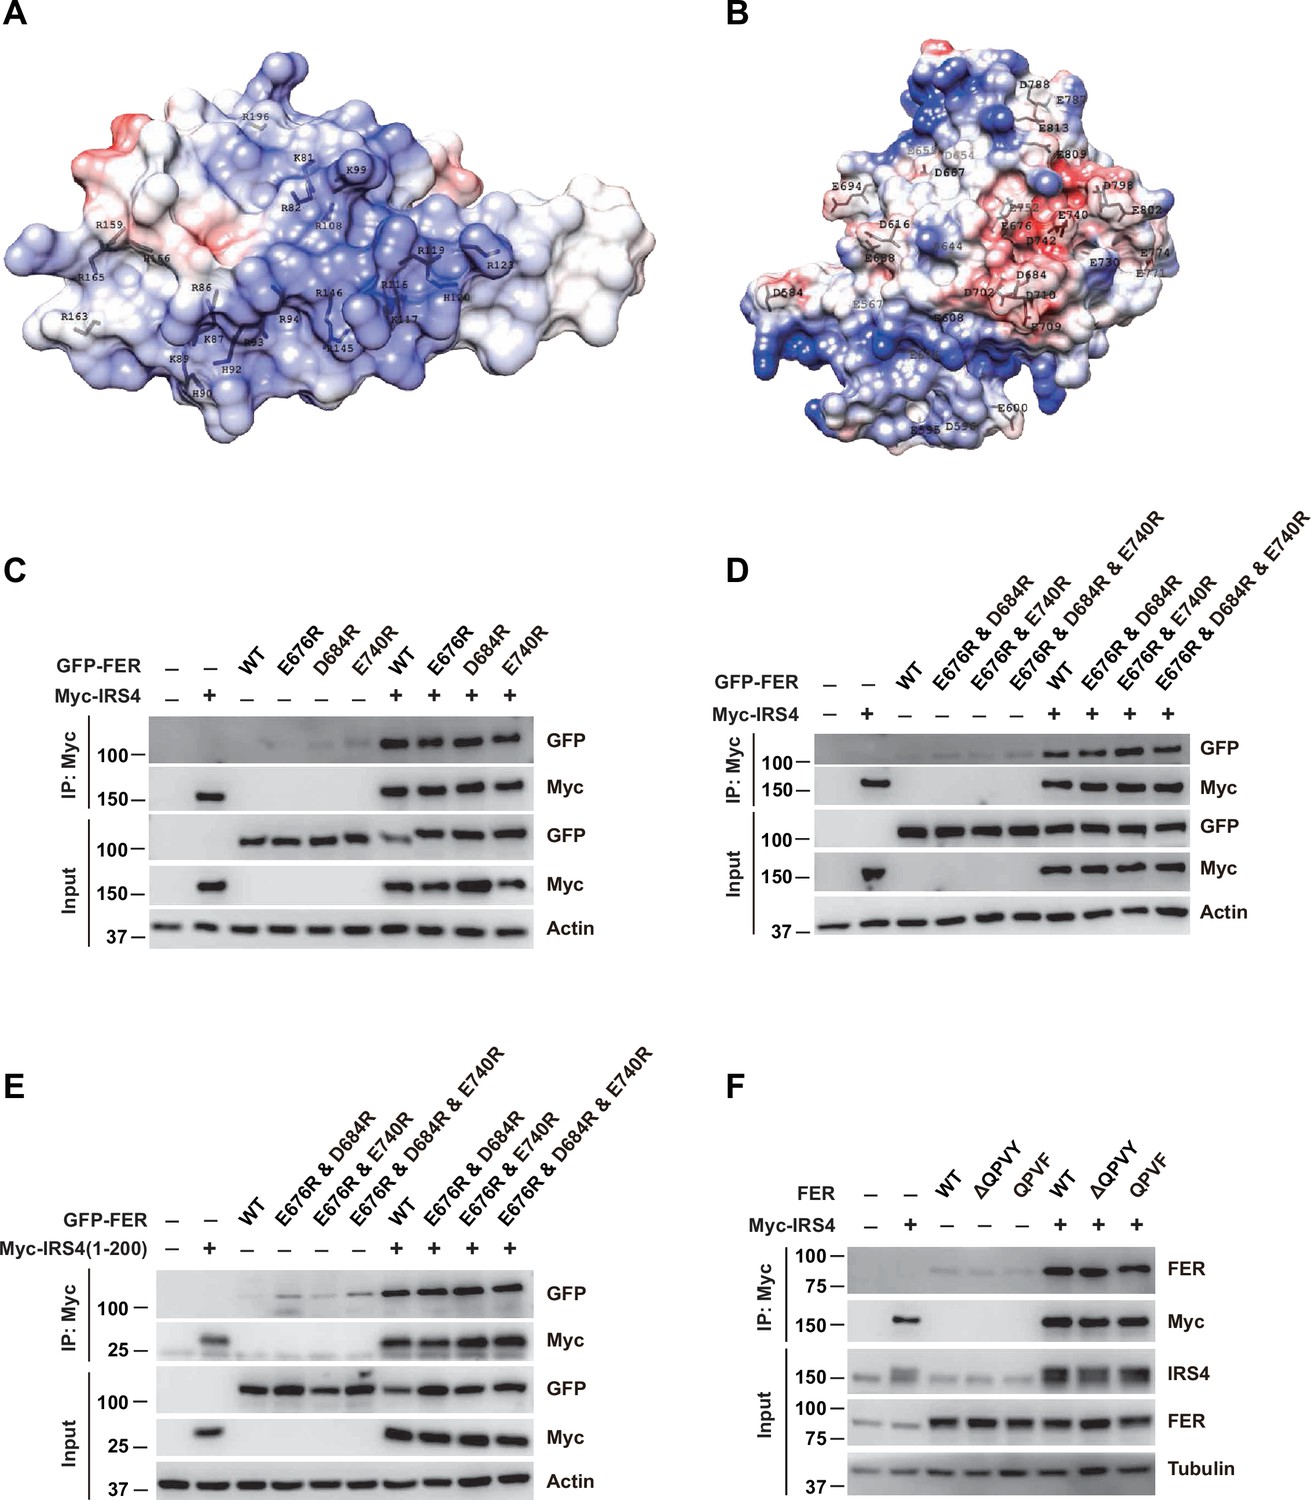
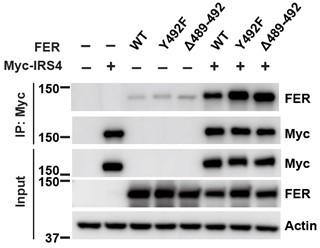
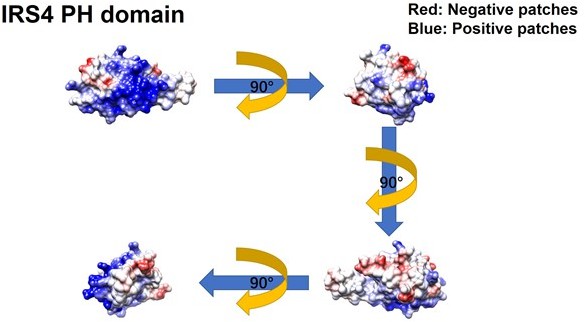
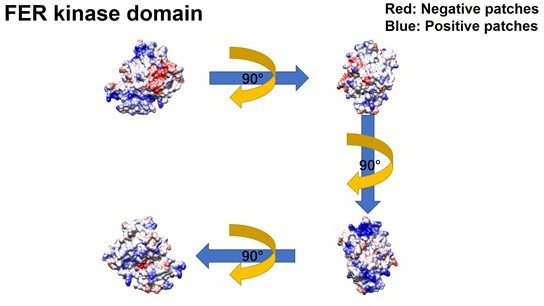
Further evaluation of the PH and PTB domain of insulin receptor substrate 4 (IRS4) in binding with the kinase domain of FER.
(A–B) The crystal structure of IRS4 PH domain (A) and FER kinase domain (B) was obtained from the AlphaFold Protein Structure Database (https://www.alphafold.ebi.ac.uk/). Then 3D structures were displayed by UCSF Chimera v1.14 (https://www.cgl.ucsf.edu/chimera/) with charged amino acids labeling. The red areas represent negative patches, while the blue areas represent positive patches. (C–E) Myc-tagged wild-type (WT) IRS4 or 1–200aa mutant of IRS4 was expressed alone or co-expressed with single or multiple mutants of E676, D684, and E740 in the kinase domain of FER in HEK293FT cells, as indicated. Lysates were harvested and immunoprecipitated with anti-Myc resin. The associations of IRS4 with mutants of FER were compared. Expressions of IRS4 and FER in whole cell lysate samples were also probed (Figure 2—figure supplement 3—source data 1–3). (F) Myc-tagged IRS4 was expressed alone or co-expressed with QPVY motif deletion mutant or Y634F mutant of FER in HEK293FT cells, as indicated. Lysates were harvested and immunoprecipitated with anti-Myc resin. The associations of IRS4 with different FER mutants were compared. Expressions of IRS4 and FER in whole cell lysate samples were also probed (Figure 2—figure supplement 3—source data 4).
-
Figure 2—figure supplement 3—source data 1
Original images for Western blots in Figure 2—figure supplement 3C.
- https://cdn.elifesciences.org/articles/76183/elife-76183-fig2-figsupp3-data1-v1.zip
-
Figure 2—figure supplement 3—source data 2
Original images for Western blots in Figure 2—figure supplement 3D.
- https://cdn.elifesciences.org/articles/76183/elife-76183-fig2-figsupp3-data2-v1.zip
-
Figure 2—figure supplement 3—source data 3
Original images for Western blots in Figure 2—figure supplement 3E.
- https://cdn.elifesciences.org/articles/76183/elife-76183-fig2-figsupp3-data3-v1.zip
-
Figure 2—figure supplement 3—source data 4
Original images for Western blots in Figure 2—figure supplement 3F.
- https://cdn.elifesciences.org/articles/76183/elife-76183-fig2-figsupp3-data4-v1.zip
Figure 3
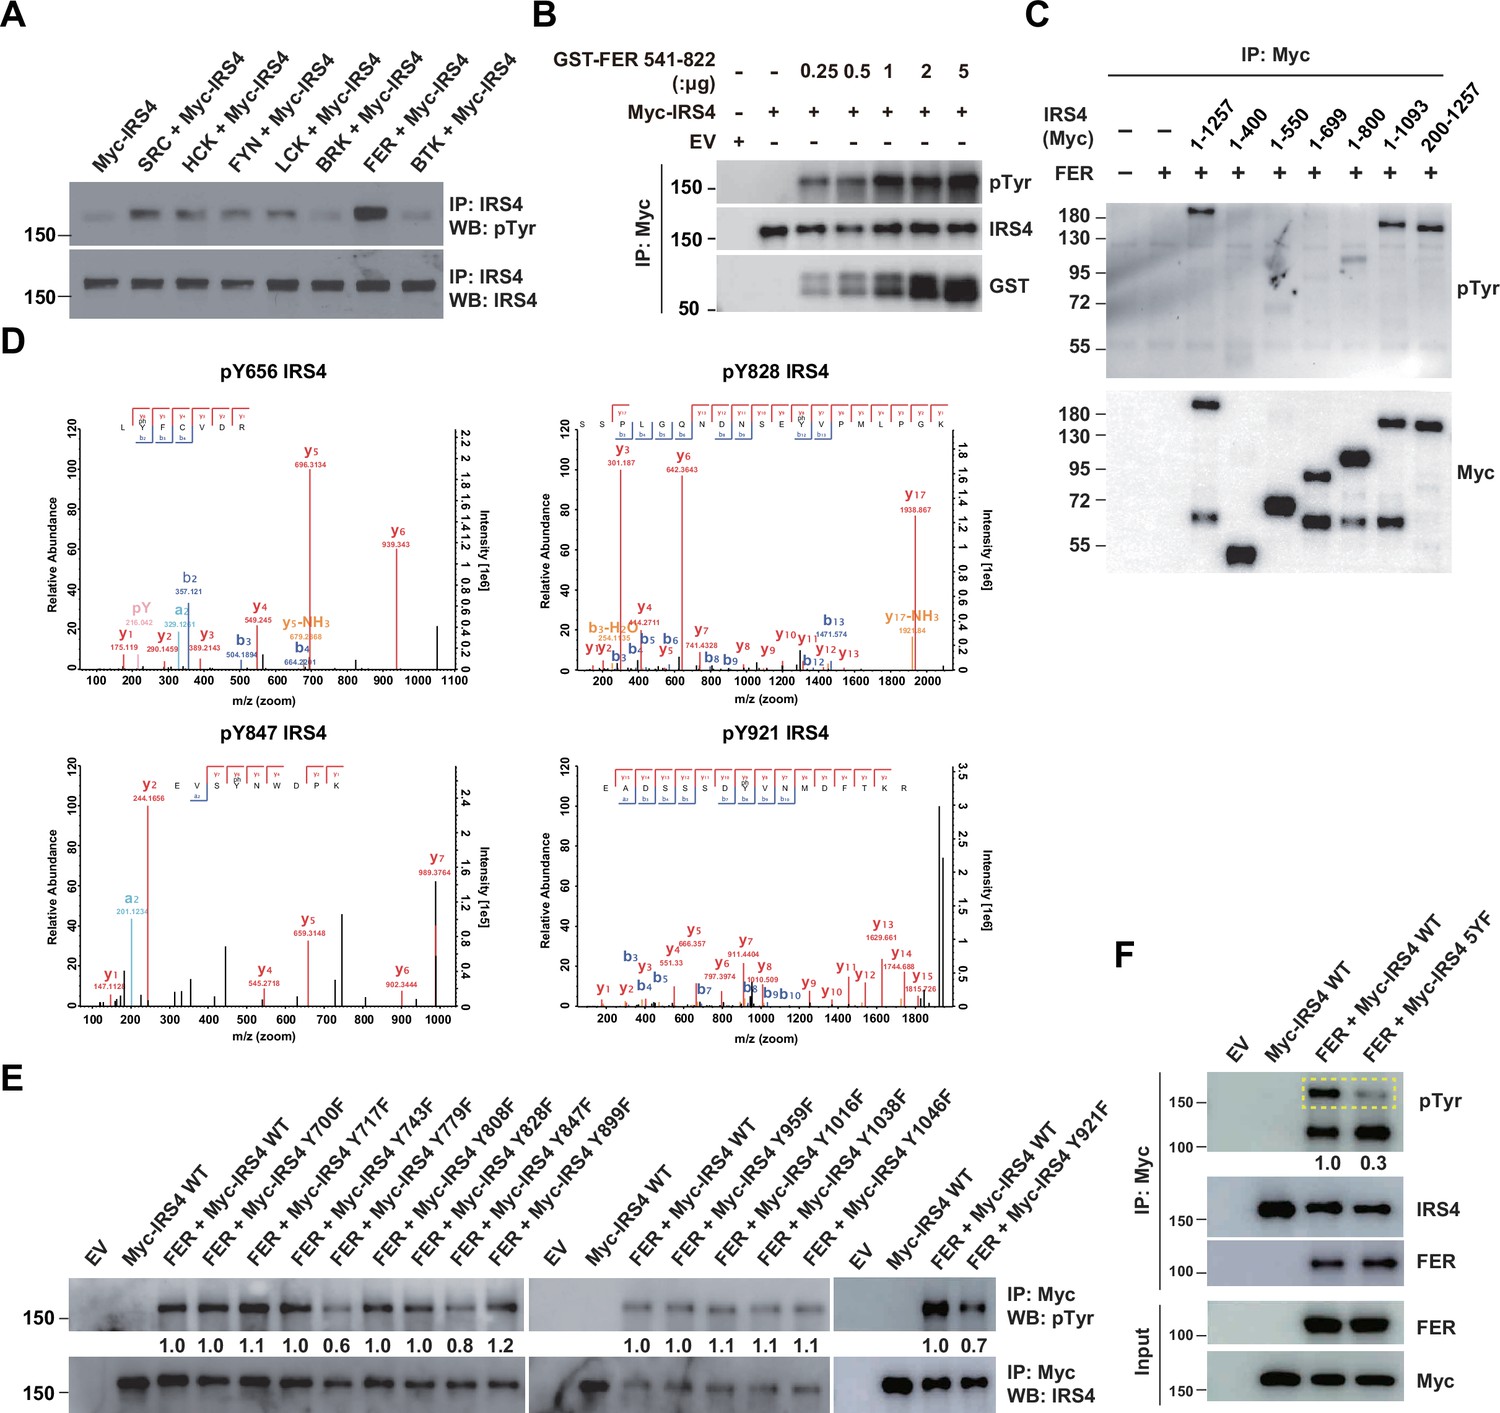
Mass spectrometry analysis and site-directed mutagenesis identified several FER-phosphorylated tyrosine residues on insulin receptor substrate 4 (IRS4).
(A) Myc-IRS4 was transfected alone, or together with several protein-tyrosine kinases in HEK293FT cells, as indicated. Myc-IRS4 was immunoprecipitated with resin against Myc-tag and the phosphorylation level of IRS4 was examined by pTyr (4G10) immunoblotting (Figure 3—source data 1). (B) Myc-tagged human IRS4 protein was expressed and purified in HEK293FT cells, and in vitro kinase (IVK) assay with purified GST-tagged human FER tyrosine kinase domain (541–822aa) was performed (Figure 3—source data 2). (C) After transient transfection of a series of Myc-tagged different truncated forms of IRS4 along with FER in HEK293FT cells, as indicated, lysates were harvested and immunoprecipitated with anti-Myc resin. The tyrosine phosphorylation level of IRS4 truncations was examined with antibody against pTyr (4G10) (Figure 3—source data 3). (D) Results of mass spectrometry analysis identified four tyrosine residues (Y656, Y828, Y847, and Y921) of IRS4 phosphorylated by FER kinase. (E–F) HEK293FT cells were transiently transfected with Myc-tagged IRS4 or its YF mutants with FER, as indicated, followed by immunoprecipitation with resin against Myc-tag and immunoblotting with IRS4, FER, pTyr (4G10) antibody. The phosphorylation levels of different IRS4 mutants (quantified by ImageJ software) were compared to illustrate the effects of point mutations in IRS4 on its phosphorylation by FER (Figure 3—source data 4–5).
-
Figure 3—source data 1
Original images for Western blots in Figure 3A.
- https://cdn.elifesciences.org/articles/76183/elife-76183-fig3-data1-v1.zip
-
Figure 3—source data 2
Original images for Western blots in Figure 3B.
- https://cdn.elifesciences.org/articles/76183/elife-76183-fig3-data2-v1.zip
-
Figure 3—source data 3
Original images for Western blots in Figure 3C.
- https://cdn.elifesciences.org/articles/76183/elife-76183-fig3-data3-v1.zip
-
Figure 3—source data 4
Original images for Western blots in Figure 3E.
- https://cdn.elifesciences.org/articles/76183/elife-76183-fig3-data4-v1.zip
-
Figure 3—source data 5
Original images for Western blots in Figure 3F.
- https://cdn.elifesciences.org/articles/76183/elife-76183-fig3-data5-v1.zip
Figure 4 with 2 supplements

Insulin receptor substrate 4 (IRS4) was upregulated in certain ovarian carcinoma-derived cell lines and important for PI3K-AKT pathway activation and ovarian cancer cell proliferation.
(A) Immunoblotting of IRS4 with two immortalized human ovarian surface epithelial (HOSE) cell lines and 14 ovarian carcinoma-derived cell lines to demonstrate increased expression level of IRS4 in certain ovarian carcinoma-derived cell lines (Figure 4—source data 1). (B and D) Immunoblotting analysis to illustrate the overexpression effect of IRS4 on activation of downstream signaling pathways. Sample lysates were prepared from parental and IRS4 ectopically expressed HEY (B) and OVCAR-8 (D) cell lines, and immunoblotted with the designated antibodies, including IRS4, pS473- and total-AKT antibodies, with tubulin as loading control (Figure 4—source data 2–3). (C and E) Cell Titer-Glo luminescent cell viability assay with parental and IRS4 ectopically expressed HEY (C) and OVCAR-8 (E) cells at the indicated time intervals. Results represented means ± SD from six replicates (HEY) or four replicates (OVCAR-8). Significance was determined with two-way ANOVA. ****p < 0.0001. (F) Immunoblotting analysis to illustrate the knockout effect of IRS4 on activation of downstream signaling pathways. Sample lysates were prepared from parental and IRS4-KO OVCAR-5 cell lines, and immunoblotted with the designated antibodies, including IRS4, pS473- and total-AKT, phosphor- and total-ERK, and phosphor- and total-p38 antibodies, with actin as loading control (Figure 4—source data 4). (G) CellTiter-Glo luminescent cell viability assay with OVCAR-5 wild-type (WT) cells and OVCAR-5 IRS4-KO cells at the indicated time intervals. Results represented means ± SD from six replicates. Significance was determined with two-way ANOVA. ****p < 0.0001. (H) CellTiter-Glo cell viability assay was conducted to evaluate cell proliferation after restoration of IRS4 expression in OVCAR-5 IRS4-KO cells. The ectopic expression of empty vector (EV) was used as a negative control. Results represented means ± SD from six replicates. Significance was determined with two-way ANOVA. ****p < 0.0001. (I) Immunoblotting analysis to illustrate the knockdown effect of IRS4 on activation of downstream signaling pathways. Sample lysates were prepared from OVCAR-3 shLuc and shIRS4 cells, and immunoblotted with the designated antibodies, including IRS4, pS473- and total-AKT antibodies, with actin as loading control (Figure 4—source data 5). (J) CellTiter-Glo luminescent cell viability assay with OVCAR-3 shLuc cells and OVCAR-3 shIRS4 cells at the indicated time intervals. Results represented means ± SEM from six replicates. Significance was determined with two-way ANOVA. ****p < 0.0001. (K) Lysates from OVCAR-5 WT and IRS4-KO cells were harvested and the expression of pS473- and total-AKT was detected by immunoblotting. PI3K inhibitor LY294002 (0.1, 1, and 10 μM), as indicated, were incubated for 24 hr (Figure 4—source data 6). (L) Cell proliferation was assessed in OVCAR-5 cells following IRS4 knockout (IRS4-KO sg1 or sg2) or incubation with PI3K inhibitor LY294002 (1 and 10 μM) using the CellTiter-Glo luminescent cell viability assay at the indicated time intervals. Results represented means ± SD from six replicates. Significance was determined with two-way ANOVA. ****p < 0.0001. (M) Cell proliferation was assessed in OVCAR-5 cells following incubation with PI3K inhibitor LY294002 (10 μM) along with ERK pathway inhibitor U0126 (1 and 5 μM) using the CellTiter-Glo luminescent cell viability assay at the indicated time intervals. Results represented means ± SD from five replicates. Significance was determined with two-way ANOVA. ****p < 0.0001.
-
Figure 4—source data 1
Original images for Western blots in Figure 4A.
- https://cdn.elifesciences.org/articles/76183/elife-76183-fig4-data1-v1.zip
-
Figure 4—source data 2
Original images for Western blots in Figure 4B.
- https://cdn.elifesciences.org/articles/76183/elife-76183-fig4-data2-v1.zip
-
Figure 4—source data 3
Original images for Western blots in Figure 4D.
- https://cdn.elifesciences.org/articles/76183/elife-76183-fig4-data3-v1.zip
-
Figure 4—source data 4
Original images for Western blots in Figure 4F.
- https://cdn.elifesciences.org/articles/76183/elife-76183-fig4-data4-v1.zip
-
Figure 4—source data 5
Original images for Western blots in Figure 4I.
- https://cdn.elifesciences.org/articles/76183/elife-76183-fig4-data5-v1.zip
-
Figure 4—source data 6
Original images for Western blots in Figure 4K.
- https://cdn.elifesciences.org/articles/76183/elife-76183-fig4-data6-v1.zip
Figure 4—figure supplement 1
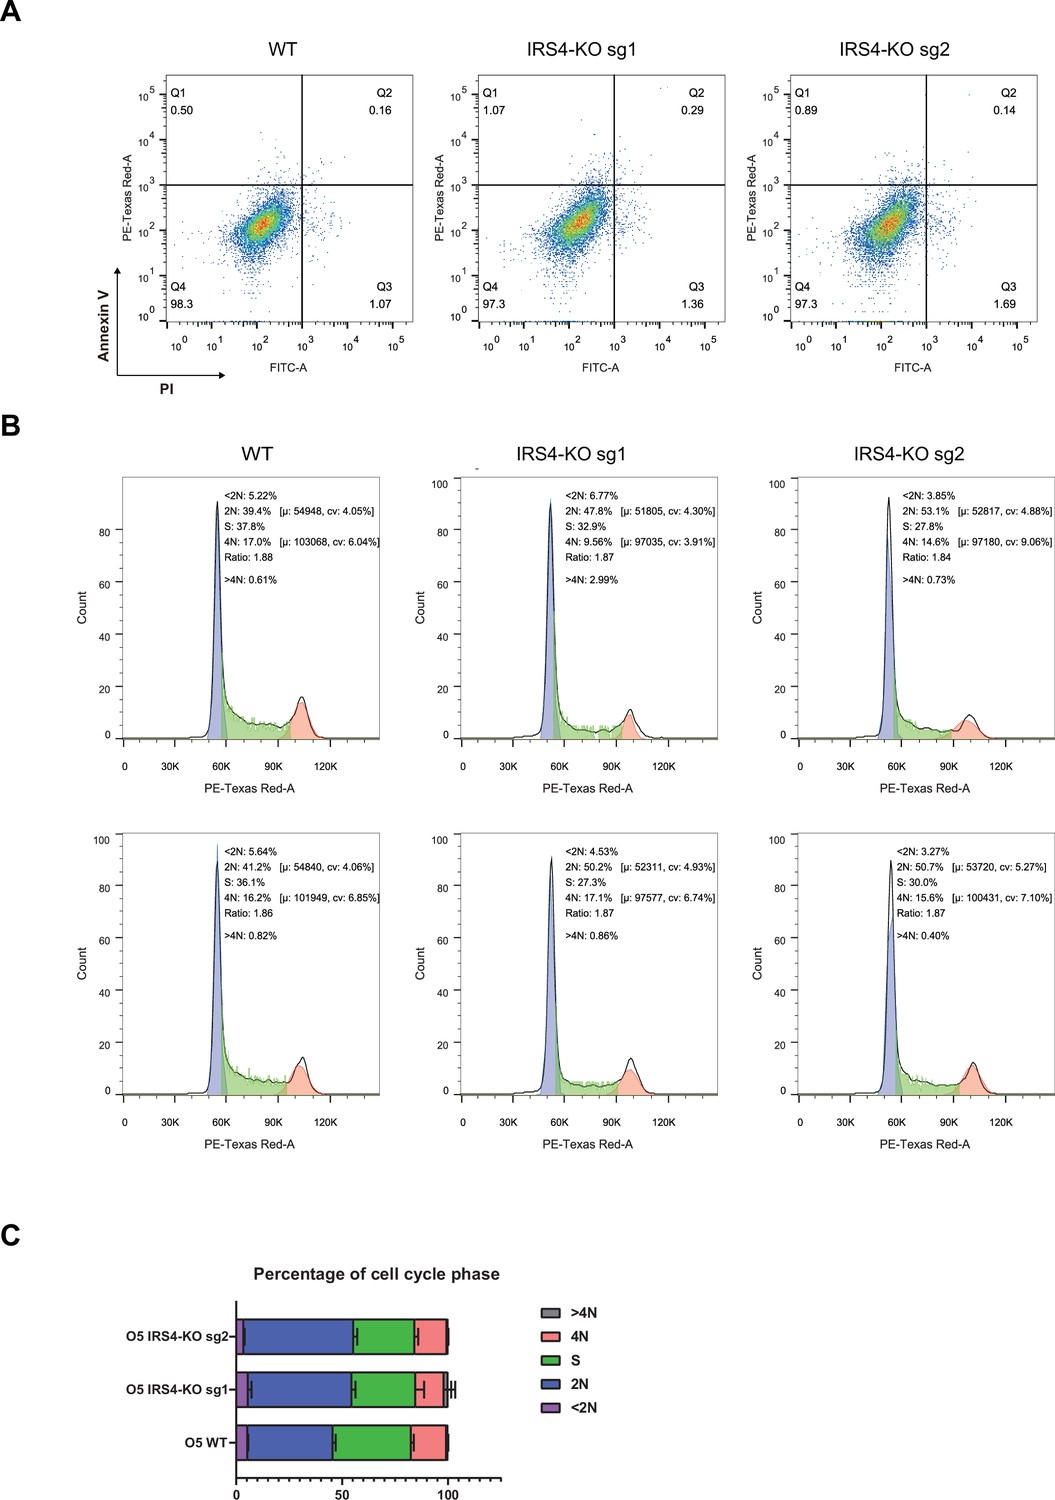
Flow cytometry assay demonstrated that insulin receptor substrate 4 (IRS4) knockout had no effect on cell survival, but significantly delayed cell proliferation.
(A) Annexin V-FITC and propidium iodide (PI) double staining assay in parental and IRS4-KO OVCAR-5 cell lines to assess the effect of IRS4 knockout on cell survival. (B–C) PI staining assay in parental and IRS4-KO OVCAR-5 cell lines to analyze the effect of IRS4 knockout on cell cycle progression.
Figure 4—figure supplement 2
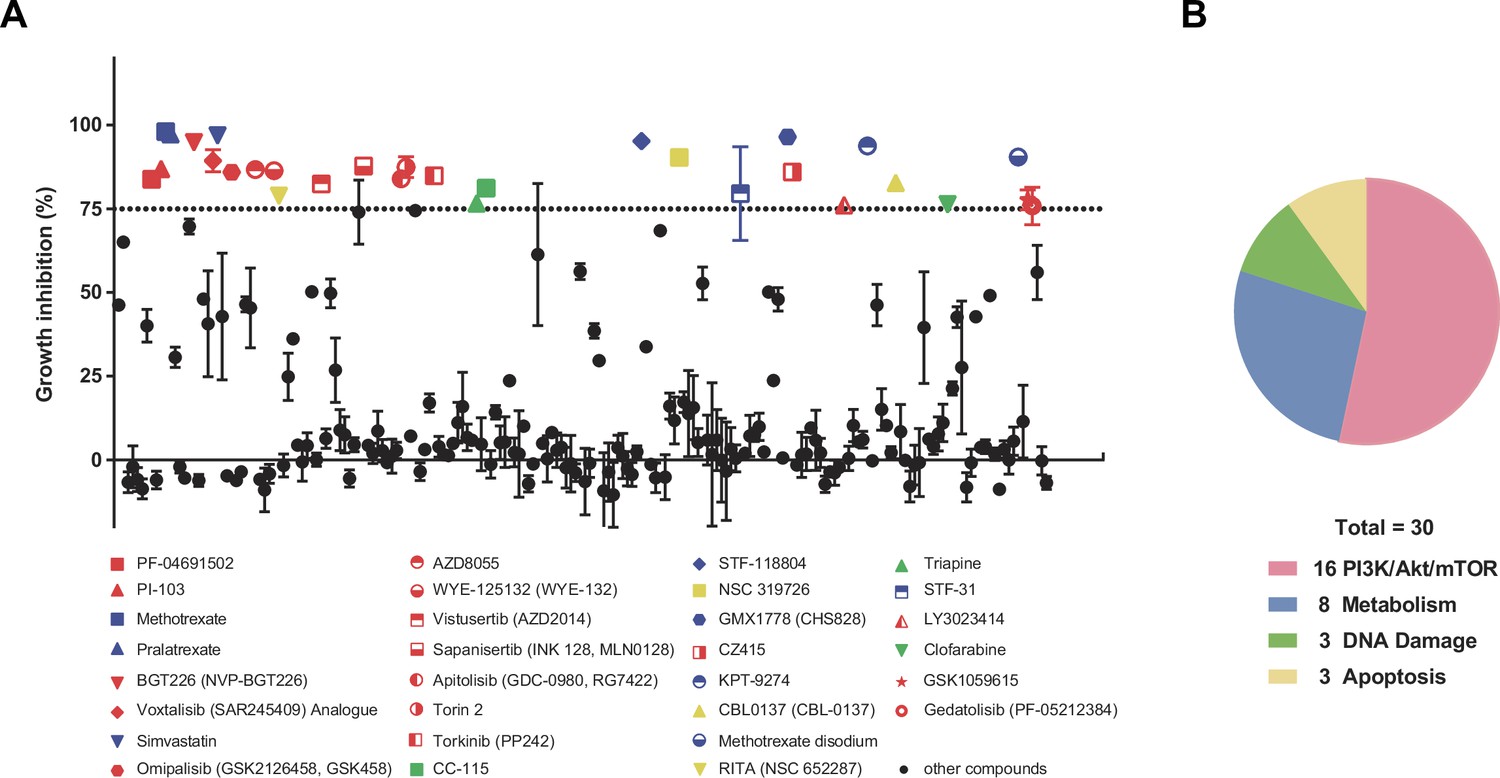
PI3K-AKT-mTOR signaling pathway plays a critical role in controlling the proliferation of OVCAR-5 ovarian cancer cells.
(A) Cell Titer-Glo cell viability assay was used to assess proliferation inhibition in OVCAR-5 cells following the treatment of 198 metabolic targeting compounds (1 μM) in compound library from Selleck for 24 hr. The ratios of luminescence in treated OVCAR-5 cells to that in untreated OVCAR-5 cells were calculated as the percentage of proliferation inhibition. Dashed lines indicate 75% proliferation inhibition percentage. All compounds above this threshold are represented as color dots: red dots represent compounds targeting PI3K-AKT-mTOR pathway, blue dots represent compounds targeting metabolism-related pathway, green dots represent compounds targeting DNA damage-related pathway, and yellow dots represent compounds targeting apoptosis-related pathway. Data were shown as means ± SEM from two or three replicates. (B) Pie chart summary representing the proportion of different signaling pathway targeted by the compounds with over 75% proliferation inhibition percentage (%) in OVCAR-5 cells, where red color represents 16 compounds targeting PI3K-AKT-mTOR pathway, blue color represents eight compounds targeting metabolism-related pathway, green color represents three compounds targeting DNA damage-related pathway, and yellow color represent three compounds targeting apoptosis-related pathway.
Figure 5 with 1 supplement
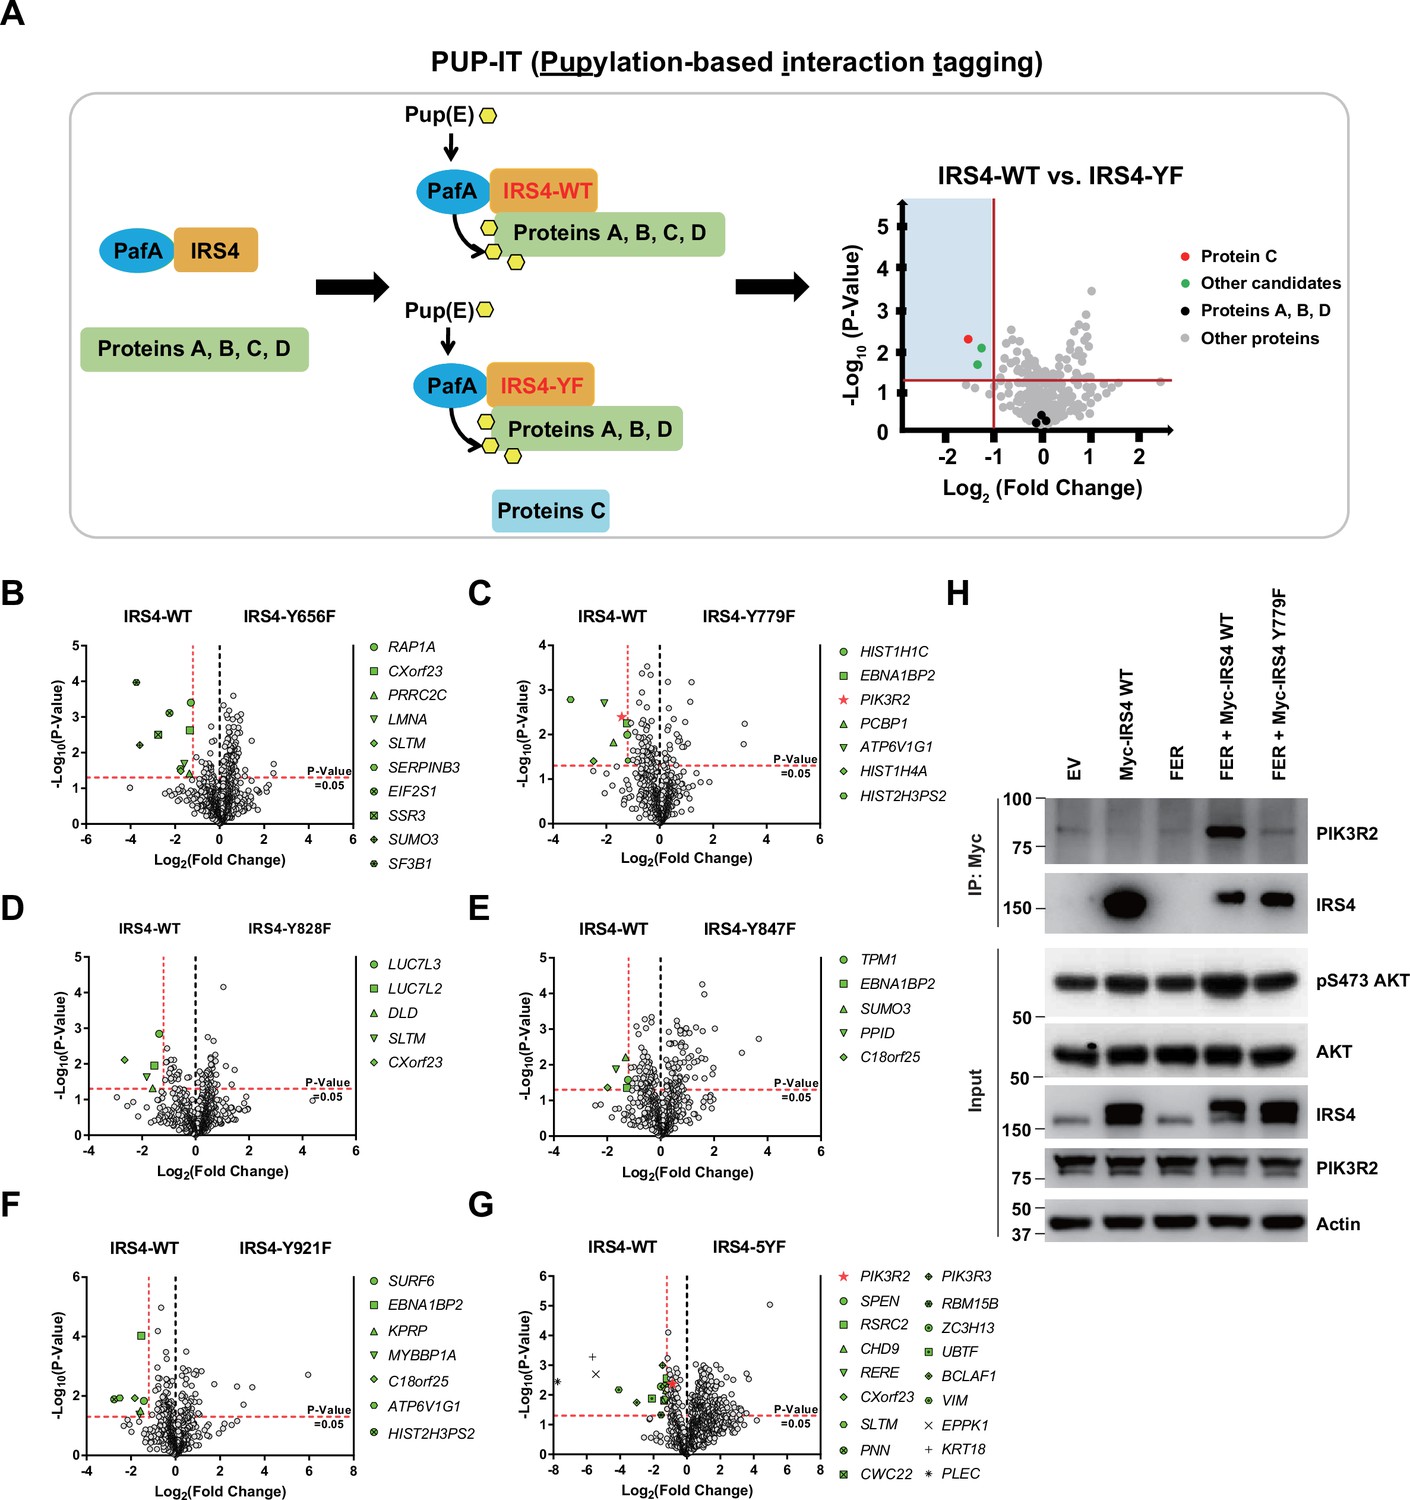
PIK3R2 was identified as one of the major downstream signaling components of insulin receptor substrate 4 (IRS4) by proximity labeling pupylation-based interaction tagging (PUP-IT) assay.
(A) Scheme of potential interacting proteins identification for tyrosine phosphorylated IRS4 using PUP-IT proximity labeling platform. Final results were illustrated with volcano plots drawn by GraphPad Prism. (B–G) PUP-IT results from mass spectrometry analysis for each potential interacting protein were showed in volcano plots, with LFQ intensity (three replicates) fold change (x-axis) and p-value change (y-axis). Fold change >2.3 was regarded as difference and p-value < 0.05 calculated by Student’s t-test was regarded as statistical significance. Genes with significant binding differences were presented as green or red (PIK3R2) dots. (H) Myc-tagged IRS4 or its Y779F mutant was co-expressed with FER in HEK293FT cells, as indicated, followed by immunoprecipitation with resin against Myc-tag and immunoblotting with IRS4 and PIK3R2 antibodies. The blot was also probed with antibodies against IRS4, PIK3R2, actin, pS473-, and total-AKT in input samples (Figure 5—source data 1).
-
Figure 5—source data 1
Original images for Western blots in Figure 5H.
- https://cdn.elifesciences.org/articles/76183/elife-76183-fig5-data1-v1.zip
Figure 5—figure supplement 1
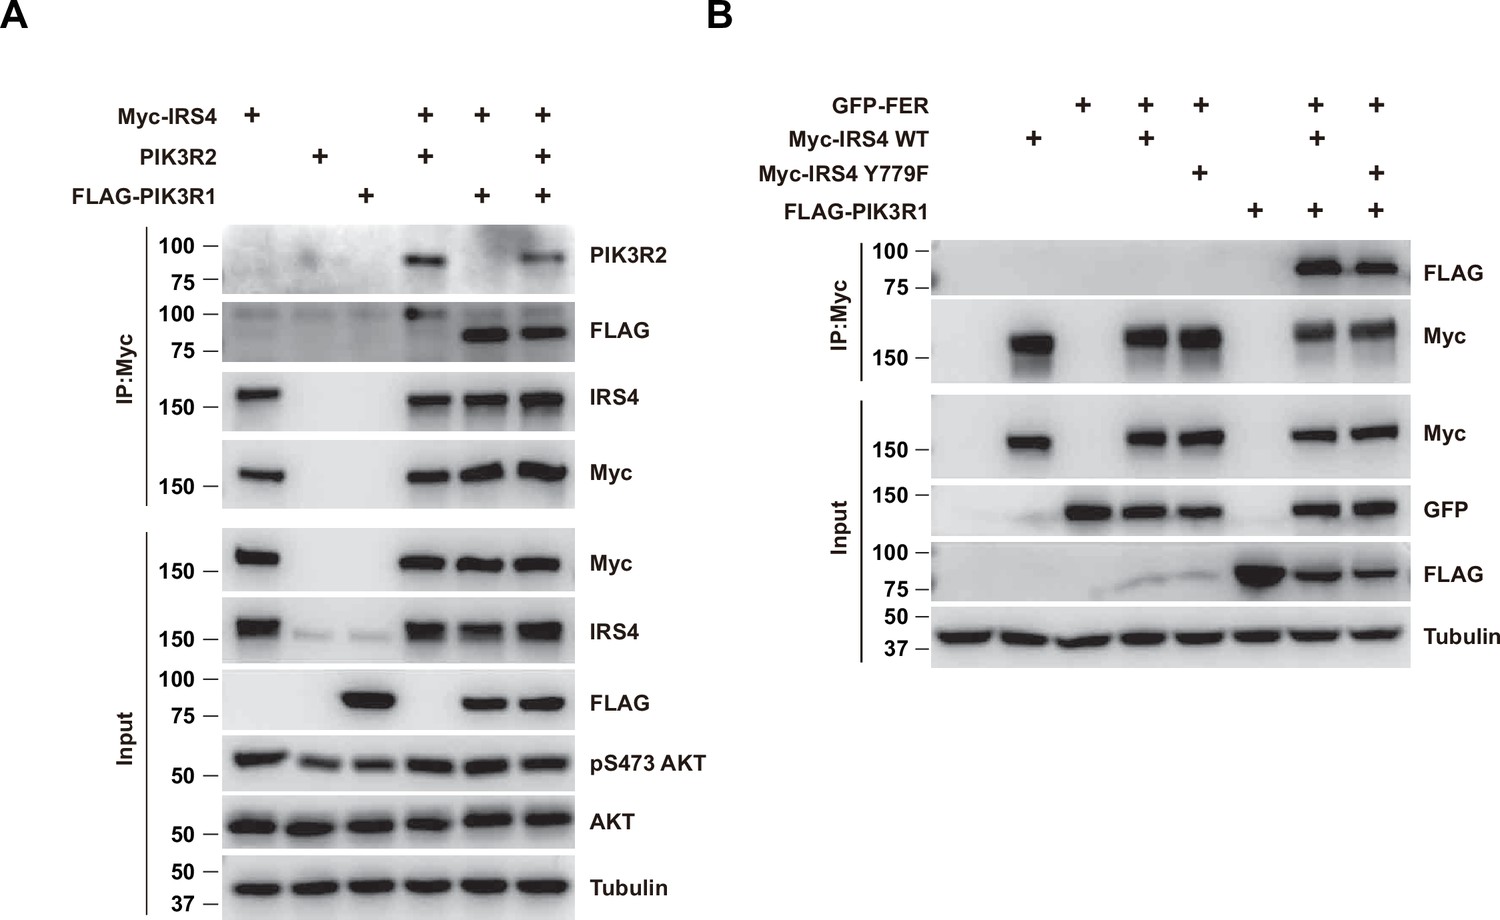
Both PIK3R1 and PIK3R2 formed complex with insulin receptor substrate 4 (IRS4), and the presence of PIK3R1 didn’t block the formation of the IRS4-PIK3R2 complex.
(A) Myc-tagged IRS4 and PIK3R2 were co-expressed in HEK293FT cells in the absence and/or presence of FLAG-tagged PIK3R1, as indicated. Lysates were harvested and immunoprecipitated with anti-Myc resin. The association of IRS4 with PIK3R2 were compared. Expressions of IRS4, PIK3R1, and PIK3R2 in whole cell lysate samples were also probed (Figure 5—figure supplement 1—source data 1). (B) Co-immunoprecipitation assay was performed to assess the necessity of phosphor-Tyr779 of IRS4 in recruiting PIK3R1 (Figure 5—figure supplement 1—source data 2).
-
Figure 5—figure supplement 1—source data 1
Original images for Western blots in Figure 5—figure supplement 1A.
- https://cdn.elifesciences.org/articles/76183/elife-76183-fig5-figsupp1-data1-v1.zip
-
Figure 5—figure supplement 1—source data 2
Original images for Western blots in Figure 5—figure supplement 1B.
- https://cdn.elifesciences.org/articles/76183/elife-76183-fig5-figsupp1-data2-v1.zip
Figure 6 with 2 supplements
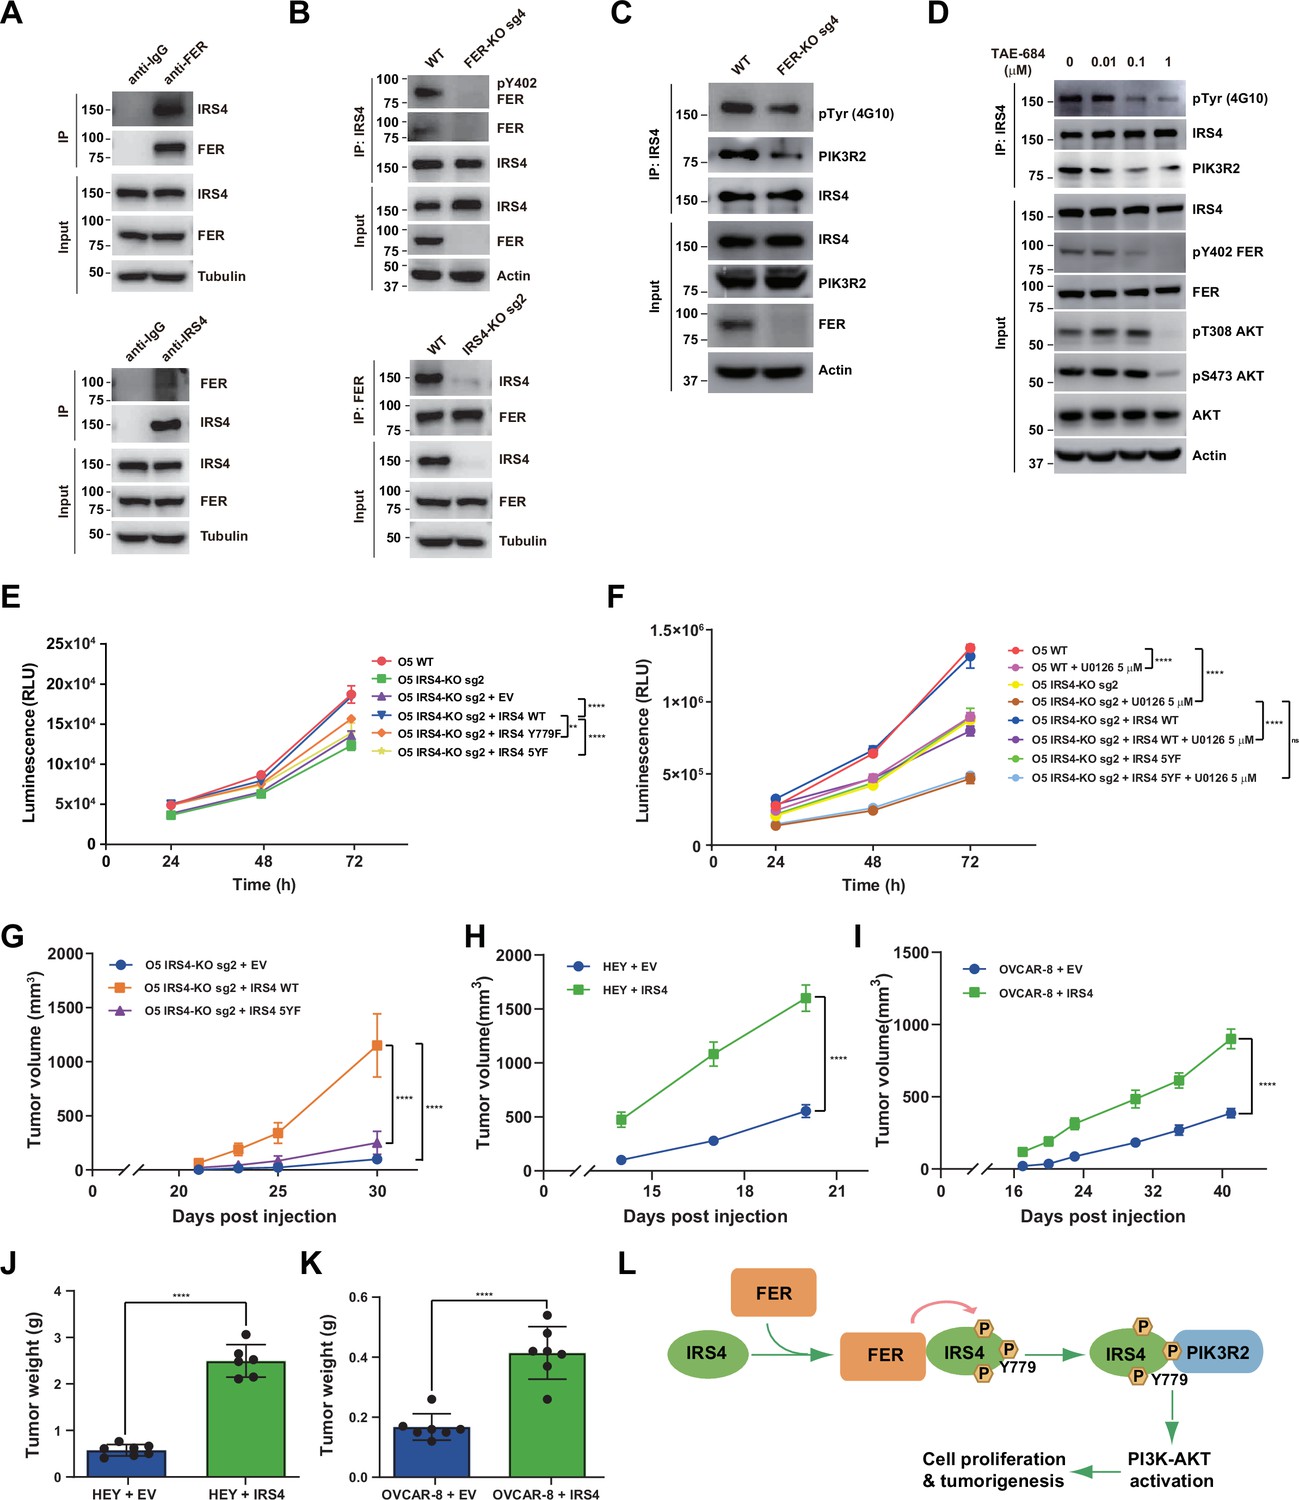
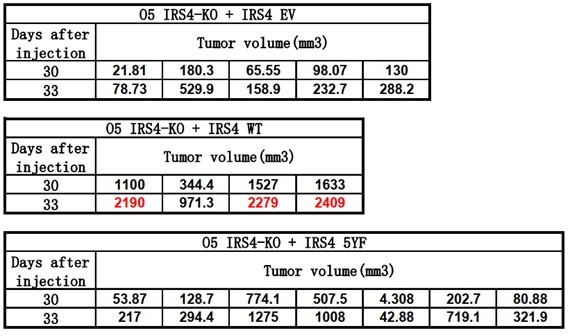
FER-mediated PIK3R2 recruitment by insulin receptor substrate 4 (IRS4) is crucial to ovarian cancer cell proliferation in vitro and tumorigenesis in vivo.
(A) Reciprocal co-immunoprecipitation assay in OVCAR-5 cell line to demonstrate endogenous interaction between FER and IRS4 (Figure 6—source data 1). (B) Co-immunoprecipitation assay in parental, FER-KO, and IRS4-KO OVCAR-5 cell lines to demonstrate endogenous interaction between FER and IRS4 (Figure 6—source data 2). (C) OVCAR-5 wild-type (WT) and OVCAR-5 FER-KO cell lysates were harvested and immunoblotted for pTyr (4G10), PIK3R2, and IRS4. Actin was probed as loading control. After IRS4 was immunoprecipitated from cell lysates, the global tyrosine phosphorylation of IRS4 and co-immunoprecipitation of PIK3R2 were examined with pTyr (4G10) and PIK3R2 antibodies (Figure 6—source data 3). (D) OVCAR-5 cells treated with TAE684 (0.01, 0.1, and 1 μM) for 24 hr were lysed, and the expressions of IRS4, pY402-FER, FER, pS473-AKT, pT308-AKT, and actin were detected by immunoblotting as indicated. Endogenous IRS4 immunoprecipitation followed by pTyr and PIK3R2 immunoblotting analysis were also performed (Figure 6—source data 4). (E) CellTiter-Glo cell viability assay was conducted to evaluate cell proliferation after rescue expression of WT or YF IRS4 in OVCAR-5 IRS4-KO cells. OVCAR-5 IRS4-KO cells and OVCAR-5 IRS4-KO cells expressing empty vector (EV) were included as negative controls. The parental OVCAR-5 cells were used as a positive control. Results represented means ± SEM from three replicates. Significance was determined with two-way ANOVA. **p = 0.0024; ****p < 0.0001. (F) Cell Titer-Glo cell viability assay was conducted to evaluate cell growth capacity after rescue expression of WT or 5YF IRS4 in OVCAR-5 IRS4-KO cells exposed to ERK pathway inhibitor U0126 (5 μM) treatment. Results represented means ± SD from five replicates. Significance was determined with two-way ANOVA. ns = no significance; ****p < 0.0001. (G) After subcutaneous injection of OVCAR-5 IRS4-KO cells rescued with EV (n = 5), IRS4-WT (n = 4), and IRS4-5YF (n = 7), respectively, in the xenograft NSG mouse model (NSG mice were randomly assigned and divided into three groups), tumor volumes were measured with calipers at the indicated time intervals. Results represent mean ± SEM. Significance was determined with two-way ANOVA. ****p < 0.0001. (H and I) Subcutaneous injections were performed with IRS4-negative cells (HEY or OVCAR-8) with ectopic expression of empty vector (n = 7 for both HEY and OVCAR-8) or IRS4 (n = 6 for HEY, n = 7 for OVCAR-8), respectively. Tumor volumes were measured with calipers at the indicated time intervals. Results represent mean ± SEM. Significance was determined with two-way ANOVA. ****p < 0.0001. (J and K) Tumors in (I-J) were dissected at endpoint and weighed. Results represent mean ± SD. Significance was determined with t-test. ****p < 0.0001. (L) Working model: FER binds directly to IRS4, and phosphorylates its several tyrosine residues. FER-mediated phosphorylation of Tyr779 on IRS4 enhances recruitment of PIK3R2/p85β, the regulatory subunit of PI3K, and promotes PI3K-AKT signaling pathway, which eventually leading to cell proliferation and tumorigenesis in ovarian cancer.
-
Figure 6—source data 1
Original images for Western blots in Figure 6A.
- https://cdn.elifesciences.org/articles/76183/elife-76183-fig6-data1-v1.zip
-
Figure 6—source data 2
Original images for Western blots in Figure 6B.
- https://cdn.elifesciences.org/articles/76183/elife-76183-fig6-data2-v1.zip
-
Figure 6—source data 3
Original images for Western blots in Figure 6C.
- https://cdn.elifesciences.org/articles/76183/elife-76183-fig6-data3-v1.zip
-
Figure 6—source data 4
Original images for Western blots in Figure 6D.
- https://cdn.elifesciences.org/articles/76183/elife-76183-fig6-data4-v1.zip
Figure 6—figure supplement 1
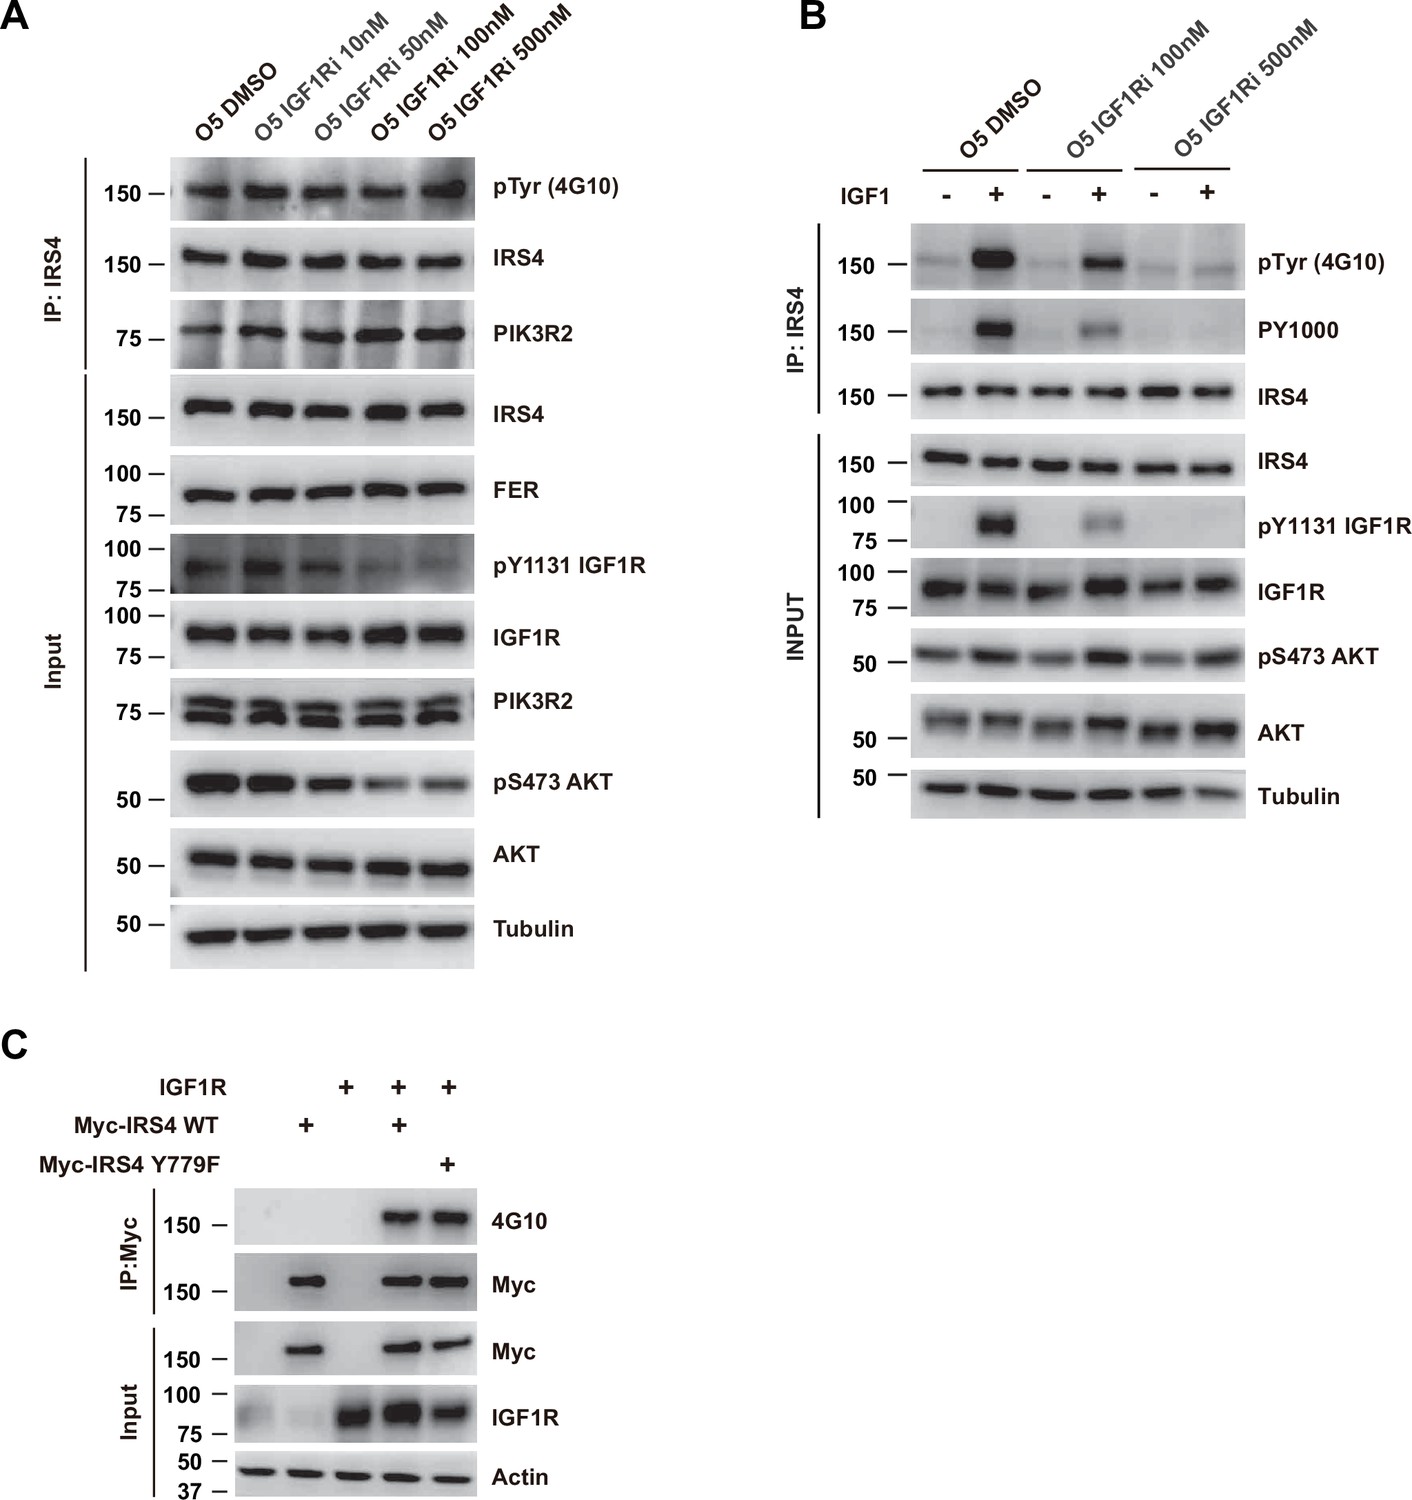
Pharmacological inhibition of IGF1R didn’t decrease tyrosine phosphorylation of insulin receptor substrate 4 (IRS4).
(A) OVCAR-5 cells, treated with DMSO control or increasing dosage of IGF1R inhibitor BMS-536924, were harvested and immunoblotted for phosphor- and total-IGF1R, phosphor- and total-AKT, PIK3R2, IRS4, and FER. Tubulin was probed as loading control. After IRS4 was immunoprecipitated from cell lysates, both the global tyrosine phosphorylation of IRS4 and its interaction with endogenous PIK3R2 were examined (Figure 6—figure supplement 1—source data 1). (B) OVCAR-5 cells, treated with DMSO control or IGF1R inhibitor BMS-536924 (100 and 500 nM) for 6 hr followed by stimulation with ligand IGF1 (2 nM), were harvested and immunoblotted for phosphor- and total-IGF1R, phosphor- and total-AKT, and IRS4. Tubulin was probed as loading control. After IRS4 was immunoprecipitated from cell lysates, the global tyrosine phosphorylation of IRS4 was examined with 4G10 as well as PY1000 antibody (Figure 6—figure supplement 1—source data 2). (C) Myc-tagged IRS4 or its Y779F mutant was co-expressed with IGF1R in HEK293FT cells, as indicated, followed by immunoprecipitation with resin against Myc-tag and immunoblotting with Myc and 4G10 antibodies. The blot was also probed with antibodies against Myc, IGF1R, and actin in input samples (Figure 6—figure supplement 1—source data 3).
-
Figure 6—figure supplement 1—source data 1
Original images for Western blots in Figure 6—figure supplement 1A.
- https://cdn.elifesciences.org/articles/76183/elife-76183-fig6-figsupp1-data1-v1.zip
-
Figure 6—figure supplement 1—source data 2
Original images for Western blots in Figure 6—figure supplement 1B.
- https://cdn.elifesciences.org/articles/76183/elife-76183-fig6-figsupp1-data2-v1.zip
-
Figure 6—figure supplement 1—source data 3
Original images for Western blots in Figure 6—figure supplement 1C.
- https://cdn.elifesciences.org/articles/76183/elife-76183-fig6-figsupp1-data3-v1.zip
Figure 6—figure supplement 2
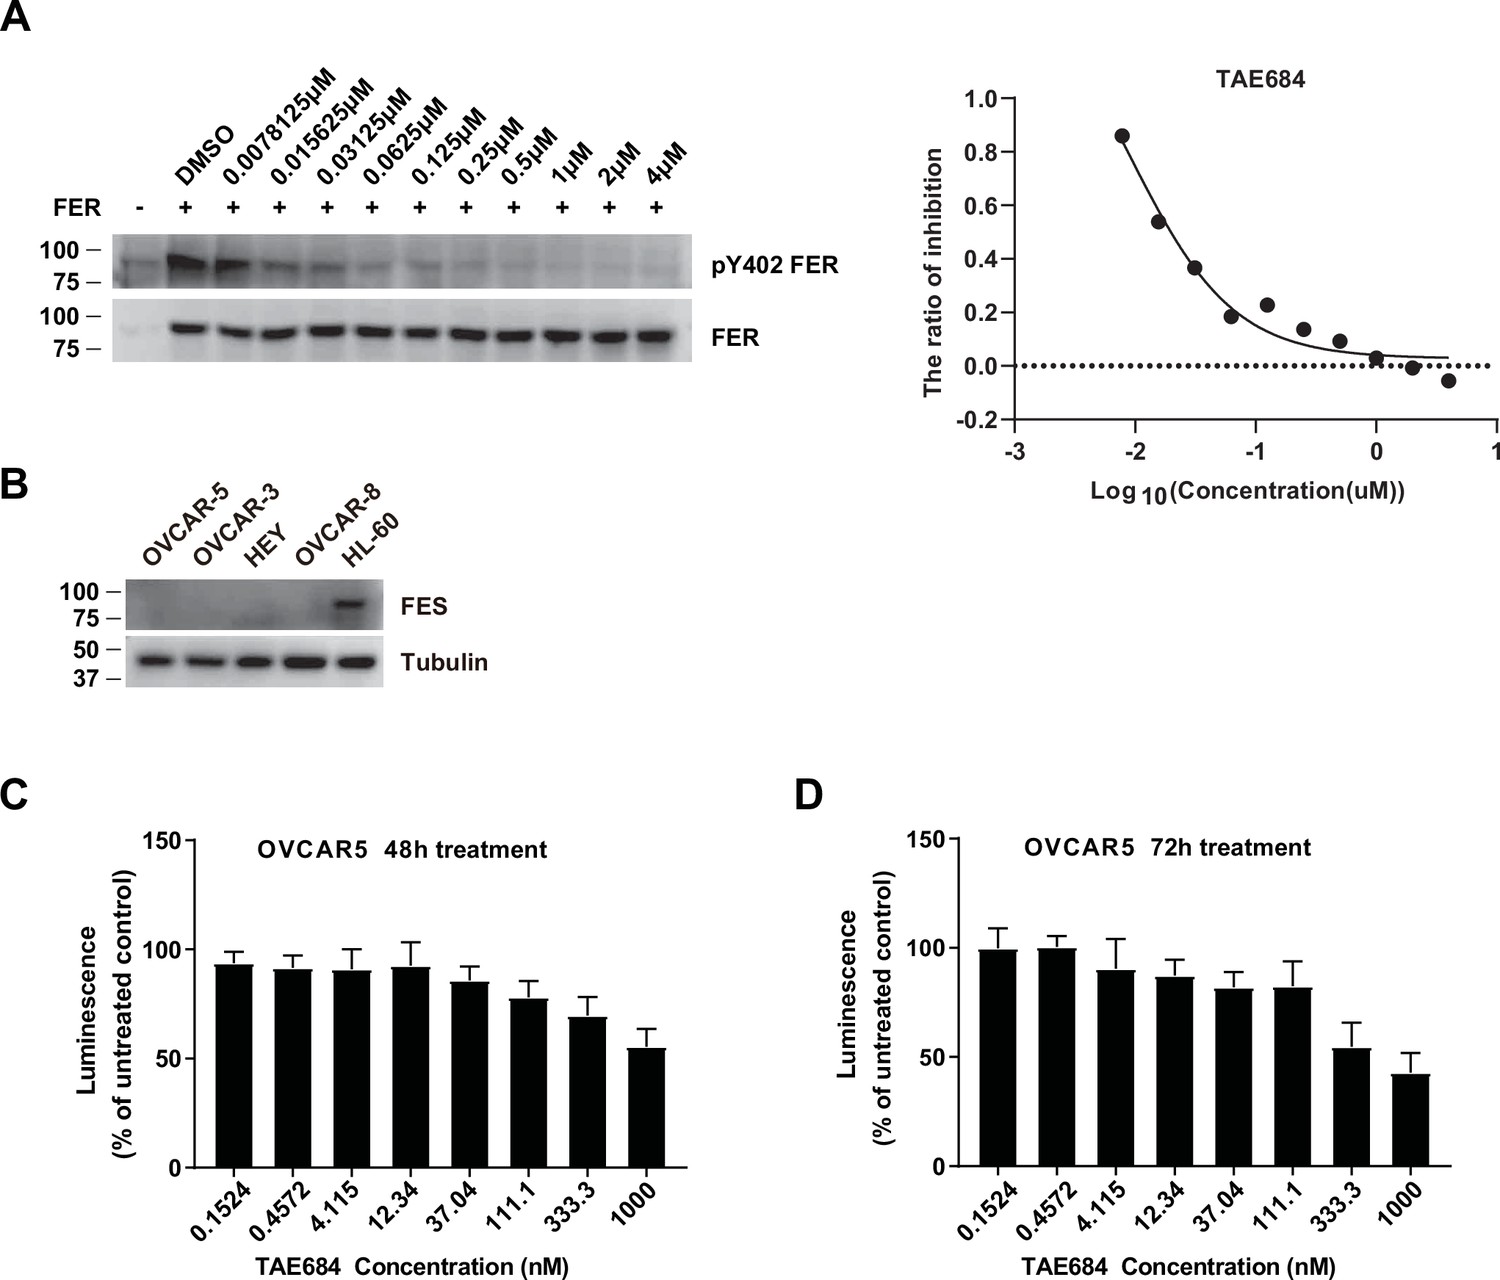
OVCAR-5 cells treated with TAE684 showed a dose-dependent growth inhibition.
(A) HEK293FT cells were transiently transfected with pLV-FER, followed by TAE684 treatment with a series of concentrations for 16 hr, as indicated. The phosphorylation level of tyrosine 402 of FER was detected by immunoblotting with specific anti-pY402-FER. Total FER in whole cell lysate samples were also probed as loading control. IC50 was calculated with dose-response nonlinear regression drawn by GraphPad Prism (Figure 6—figure supplement 2—source data 1). (B) Immunoblotting of FES with four ovarian carcinoma-derived cell lines and one myeloid leukemia cell HL-60 to demonstrate no expression level of FES in these ovarian carcinoma-derived cell lines (Figure 6—figure supplement 2—source data 2). (C) Cell proliferation was assessed in OVCAR-5 cells following incubation with increasing concentration of TAE684 for 48 hr using the CellTiter-Glo luminescent cell viability assay. (D) Cell proliferation was assessed in OVCAR-5 cells following incubation with increasing concentration of TAE684 for 72 hr using the CellTiter-Glo luminescent cell viability assay.
-
Figure 6—figure supplement 2—source data 1
Original images for Western blots in Figure 6—figure supplement 2A.
- https://cdn.elifesciences.org/articles/76183/elife-76183-fig6-figsupp2-data1-v1.zip
-
Figure 6—figure supplement 2—source data 2
Original images for Western blots in Figure 6—figure supplement 2B.
- https://cdn.elifesciences.org/articles/76183/elife-76183-fig6-figsupp2-data2-v1.zip
Figure 7 with 1 supplement
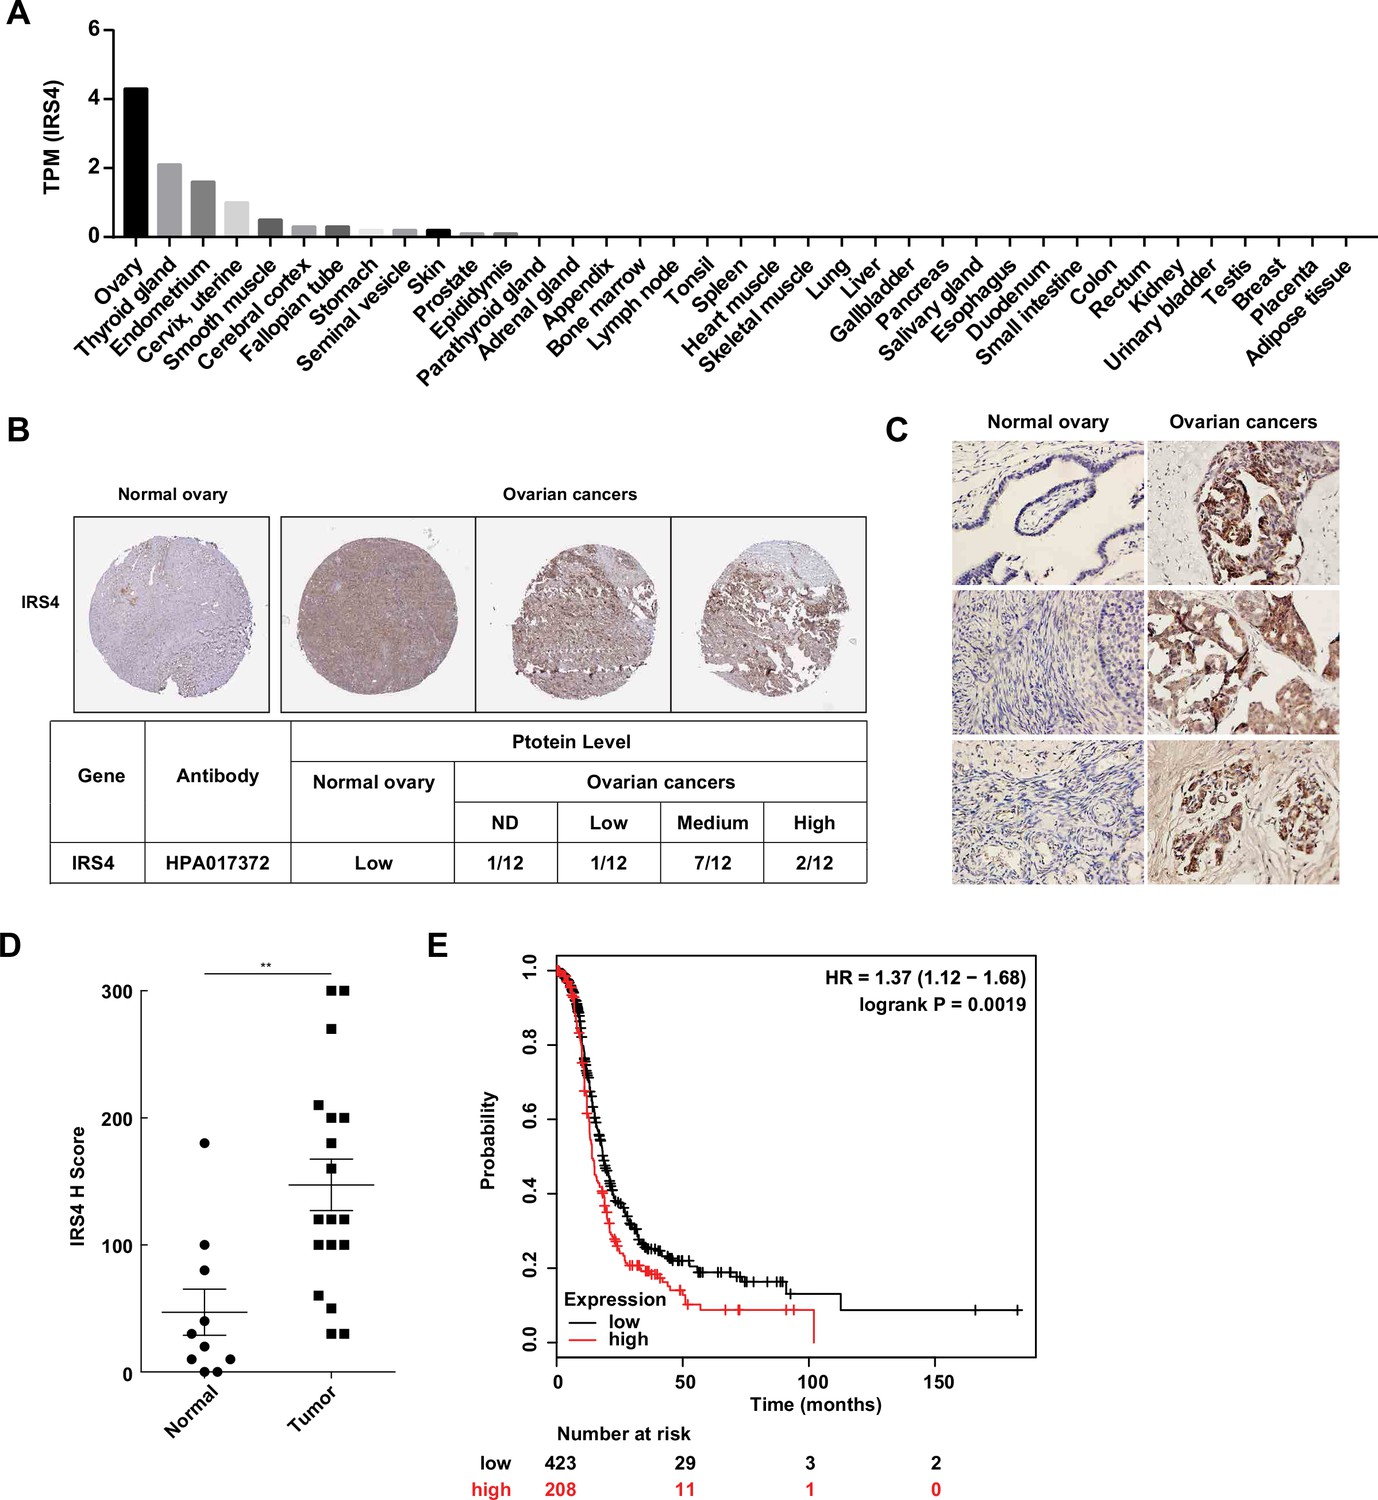
Aberrantly high expression of insulin receptor substrate 4 (IRS4) was inversely correlated with prognosis in patients with ovarian cancer.
(A) mRNA expression profile of IRS4 in multiple human tissues based on RNA-seq tissue data from the Human Protein Atlas (HPA) dataset (http://proteinatlas.org). Data were reported as mean pTPM (protein-coding transcripts per million), corresponding to mean values of the different individual samples from each tissue. (B) The expression of IRS4 in the sections of normal ovary and malignant ovarian carcinoma according to representative tissue microarrays cores from the HPA database. (C) Immunohistochemistry staining for IRS4 protein in normal ovaries (n = 10) and malignant ovarian carcinomas (n = 18) samples. Representative images were shown. (D) Summary and statistical analysis of immunohistochemistry staining status of IRS4 H score between normal ovaries (n = 10) and malignant ovarian carcinomas (n = 18) samples. Results represented means ± SD. Significance was determined with Student’s t-test. **p = 0.0029. (E) Overall survival from over 600 ovarian cancer patients among previously published datasets by the km Plotter (http://www.kmplot.com). IRS4 expression was stratified as high versus low against median expression.
Figure 7—figure supplement 1
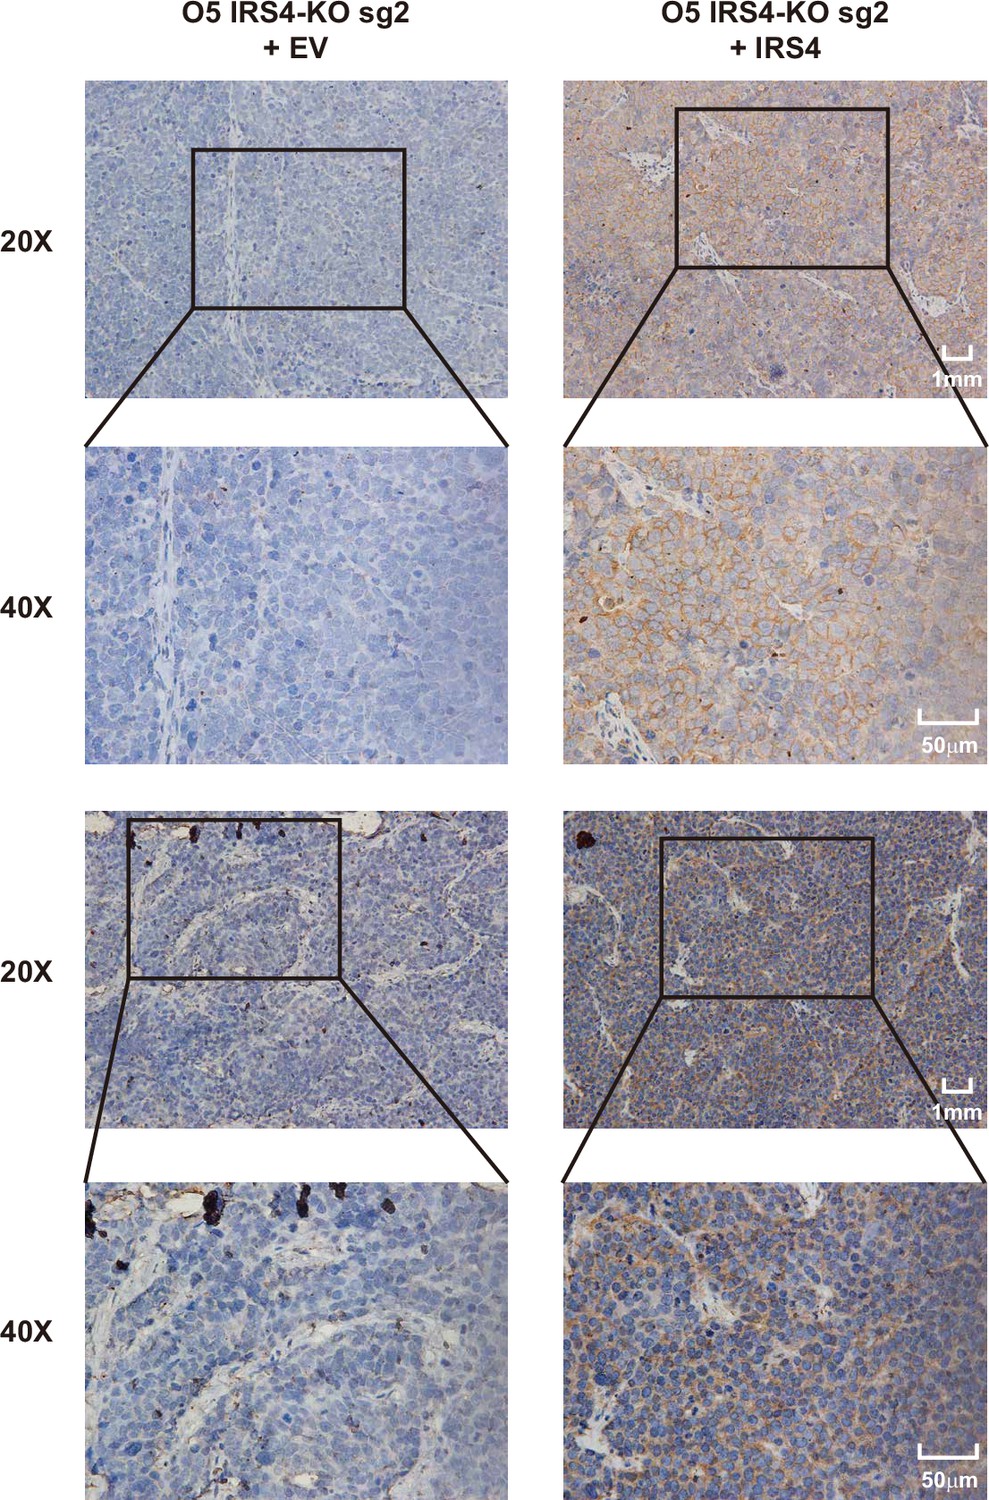
Insulin receptor substrate 4 (IRS4) antibody was specific for IRS4.
Immunohistochemistry (IHC) analysis was performed in xenograft tumor samples generated from IRS4-KO OVCAR-5 cells rescued with either empty vector (n = 2) or wild-type IRS4 (n = 2).
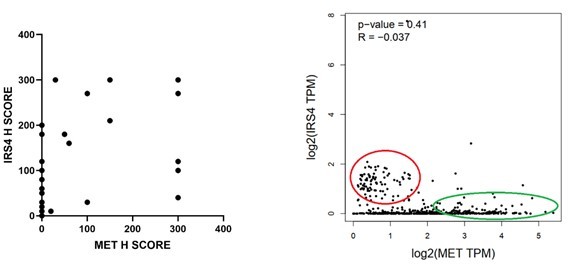
Author response image 1
Author response image 2
Author response image 3
Author response image 4
Author response image 5
Author response image 6
Author response image 7
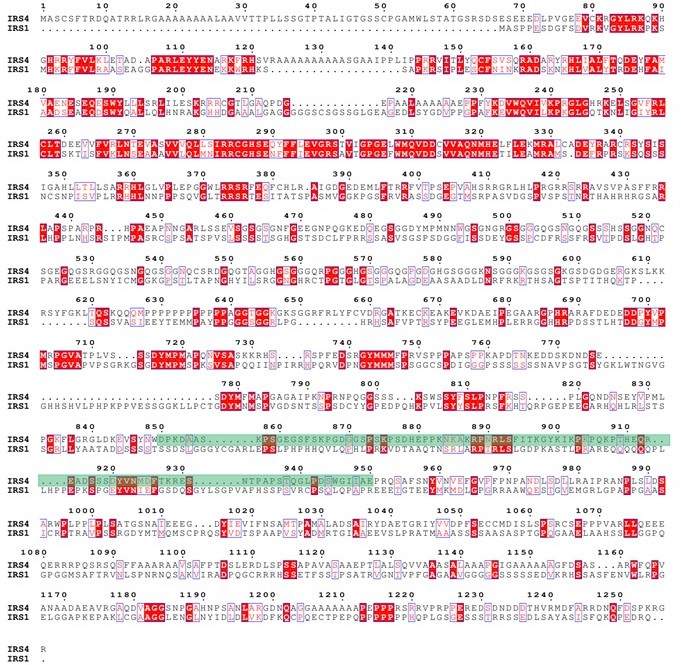
Protein sequence alignment between IRS4 and IRS1.</Author response image 7 title/legend>.
Author response image 8
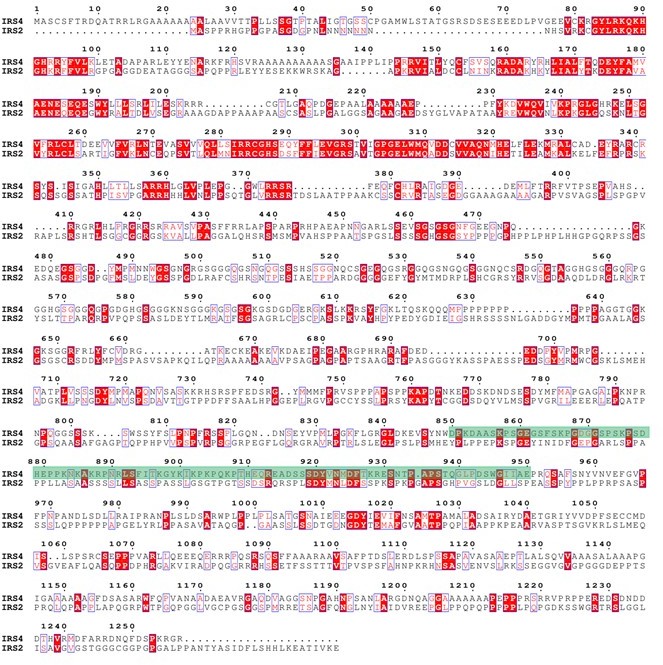
Protein sequence alignment between IRS4 and IRS1.
Author response image 9
Additional files
-
Supplementary file 1
Identification of potential FER interactome by in-gel tryptic digestion.
Identification of novel substrates for tyrosine kinase FER by pTyr immunoprecipitation and in-gel tryptic digestion followed by mass spectrometry analysis in Figure 1B. The details of raw data analysis and database search have been described in the section of Materials and methods. The analyzed MS data was provided in Supplementary files 1-6. Potential FER interactome between 25- and 37 kDa is shown in this file.
- https://cdn.elifesciences.org/articles/76183/elife-76183-supp1-v1.xlsx
-
Supplementary file 2
Potential FER Interactome with molecular weight between 37 and 50kDa.
Potential FER interactome between 37– and 50 kDa is shown in this file.
- https://cdn.elifesciences.org/articles/76183/elife-76183-supp2-v1.xlsx
-
Supplementary file 3
Potential FER Interactome with molecular weight between 50 and 75kDa.
Potential FER interactome between 50– and 75 kDa is shown in this file.
- https://cdn.elifesciences.org/articles/76183/elife-76183-supp3-v1.xlsx
-
Supplementary file 4
Potential FER Interactome with molecular weight between 75 and 100kDa.
Potential FER interactome between 75– and 100 kDa is shown in this file.
- https://cdn.elifesciences.org/articles/76183/elife-76183-supp4-v1.xlsx
-
Supplementary file 5
Potential FER Interactome with molecular weight between 100 and 150kDa.
Potential FER interactome between 100– and 150 kDa is shown in this file.
- https://cdn.elifesciences.org/articles/76183/elife-76183-supp5-v1.xlsx
-
Supplementary file 6
Potential FER Interactome with molecular weight greater than 150kDa.
Potential FER interactome above 150 kDa is shown in this file.
- https://cdn.elifesciences.org/articles/76183/elife-76183-supp6-v1.xlsx
-
Supplementary file 7
Identification of potential FER interactome by beads digestion.
Identification of novel substrates for tyrosine kinase FER by pTyr immunoprecipitation and on beads tryptic digestion followed by mass spectrometry analysis in Figure 1B. The details of raw data analysis and database search have been described in the section of Materials and methods. The analyzed MS data is provided in this file.
- https://cdn.elifesciences.org/articles/76183/elife-76183-supp7-v1.xlsx
-
Supplementary file 8
Identification of tyrosine phosphorylation sites on insulin receptor substrate 4 (IRS4) by mass spectrometry analysis.
Identification of tyrosine residue(s) that undergo phosphorylation in the presence of FER by mass spectrometry analysis in duplicate in Figure 3D. The details of raw data analysis and database search have been described in the section of Materials and methods. The analyzed MS data was provided in Supplementary files 8-9. First identification of tyrosine phosphorylation sites on IRS4 is shown in this file.
- https://cdn.elifesciences.org/articles/76183/elife-76183-supp8-v1.xlsx
-
Supplementary file 9
Identification of tyrosine phosphorylation sites on insulin receptor substrate 4 (IRS4) by mass spectrometry analysis (2nd attempt).
Second identification of tyrosine phosphorylation sites on IRS4 is shown in this file.
- https://cdn.elifesciences.org/articles/76183/elife-76183-supp9-v1.xlsx
-
Supplementary file 10
Identification of potential interacting proteins of insulin receptor substrate 4 (IRS4) wild-type (WT) and YF mutants by pupylation-based interaction tagging (PUP-IT) system.
Exploration for differences in binding proteins between IRS4-WT and multiple IRS4-YF in OVCAR-5 cells in Figure 5A–G. The details of raw data analysis and database search have been described in the section of Materials and methods. The analyzed MS data was provided in Supplementary files 10-12. The IRS4-WT, IRS4-Y779F, IRS4-Y847F, and IRS4-Y921F interactome is shown in this file.
- https://cdn.elifesciences.org/articles/76183/elife-76183-supp10-v1.xlsx
-
Supplementary file 11
Identification of potential interacting proteins of insulin receptor substrate 4 (IRS4) wild-type (WT) and YF mutants (Y656F and Y828F) by pupylation-based interaction tagging (PUP-IT) system.
The IRS4-WT, IRS4-Y656F, and IRS4-Y828F interactome is shown in this file.
- https://cdn.elifesciences.org/articles/76183/elife-76183-supp11-v1.xlsx
-
Supplementary file 12
Identification of potential interacting proteins of insulin receptor substrate 4 (IRS4) wild-type (WT) and 5YF mutant by pupylation-based interaction tagging (PUP-IT) system.
The IRS4-WT and IRS4-5YF interactome is shown in this file.
- https://cdn.elifesciences.org/articles/76183/elife-76183-supp12-v1.xlsx
-
Supplementary file 13
Primers used in the construction of related FER and insulin receptor substrate 4 (IRS4) mutants.
Primers used in the construction of related FER and IRS4 mutants.
- https://cdn.elifesciences.org/articles/76183/elife-76183-supp13-v1.xlsx
-
Transparent reporting form
- https://cdn.elifesciences.org/articles/76183/elife-76183-transrepform1-v1.doc
Download links
A two-part list of links to download the article, or parts of the article, in various formats.
Downloads (link to download the article as PDF)
Open citations (links to open the citations from this article in various online reference manager services)
Cite this article (links to download the citations from this article in formats compatible with various reference manager tools)
FER-mediated phosphorylation and PIK3R2 recruitment on IRS4 promotes AKT activation and tumorigenesis in ovarian cancer cells
eLife 11:e76183.
https://doi.org/10.7554/eLife.76183


