TUBA1A tubulinopathy mutants disrupt neuron morphogenesis and override XMAP215/Stu2 regulation of microtubule dynamics
- Department of Cell and Developmental Biology, University of Colorado Anschutz Medical Campus, United States
- Department of Pediatrics, University of Colorado Anschutz Medical Campus, United States
Figures
Figure 1 with 1 supplement
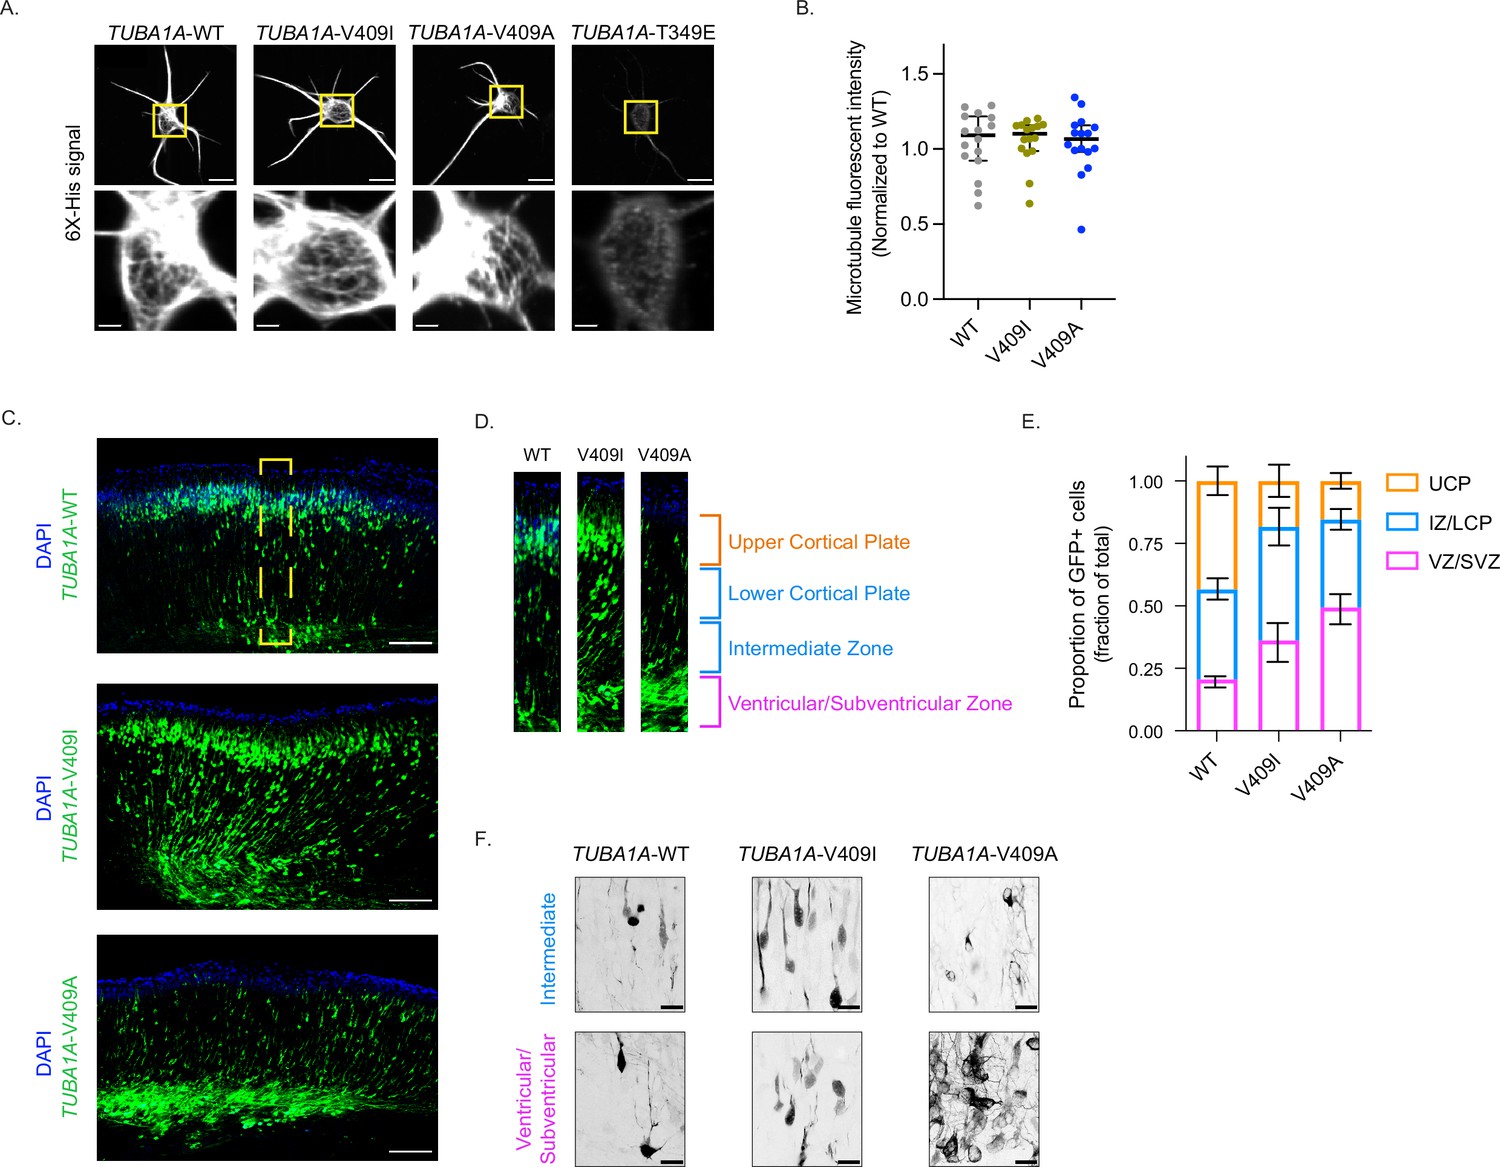
TUBA1A-V409I/A mutants dominantly disrupt cortical neuron migration.
(A) Representative images of neurons ectopically expressing 6X-His-tagged TUBA1A-WT, -V409I, -V409A, and -T349E. The soluble tubulin was extracted from the cells, and then cells were stained with an anti-6X-His antibody. Bottom insets are representative of yellow boxes. Scale bar = 10 µm in top panels. Scale bar = 2 µm in bottom panels. Images were collected from three independent experiments; n=16 cells for wild-type (WT), n=16 for V409I, and n=16 for V409A. (B) 6X-His fluorescence intensity was measured for each neuron imaged in panel A. Each dot represents a single cell. Bars are median ± 95% confidence interval. (C) Representative coronal sections of E18.5 mouse brains that were electroporated with the above constructs at E14.5. GFP labels electroporated cells. Scale bar = 200 µm. Images were collected from three independent experiments; n=8 sections for WT, n=10 for V409I, and n=14 for V409A. Yellow box represents region in (D). (E) Representative cortical region was divided into four equal quartiles and GFP fluorescence intensity was measured in each. 1st quartile = ventricular/subventricular zones (VZ/SVZ), 2nd quartile = intermediate zone (IZ), 3rd quartile = lower cortical plate (LCP), 4th quartile = upper cortical plate (UCP). Bars are mean ± 95% confidence interval. (F) Representative zoomed in images of cells in the VZ/SVZ and the IZ. Scale bar = 20 µm. Images were collected from same set of coronal sections described in (C).
-
Figure 1—source data 1
6X-His tagged tubulin fluorescence intensity.
- https://cdn.elifesciences.org/articles/76189/elife-76189-fig1-data1-v3.xlsx
-
Figure 1—source data 2
Proportion of GFP+ cells in quartiles of cortical sections.
- https://cdn.elifesciences.org/articles/76189/elife-76189-fig1-data2-v3.xlsx
Figure 1—figure supplement 1
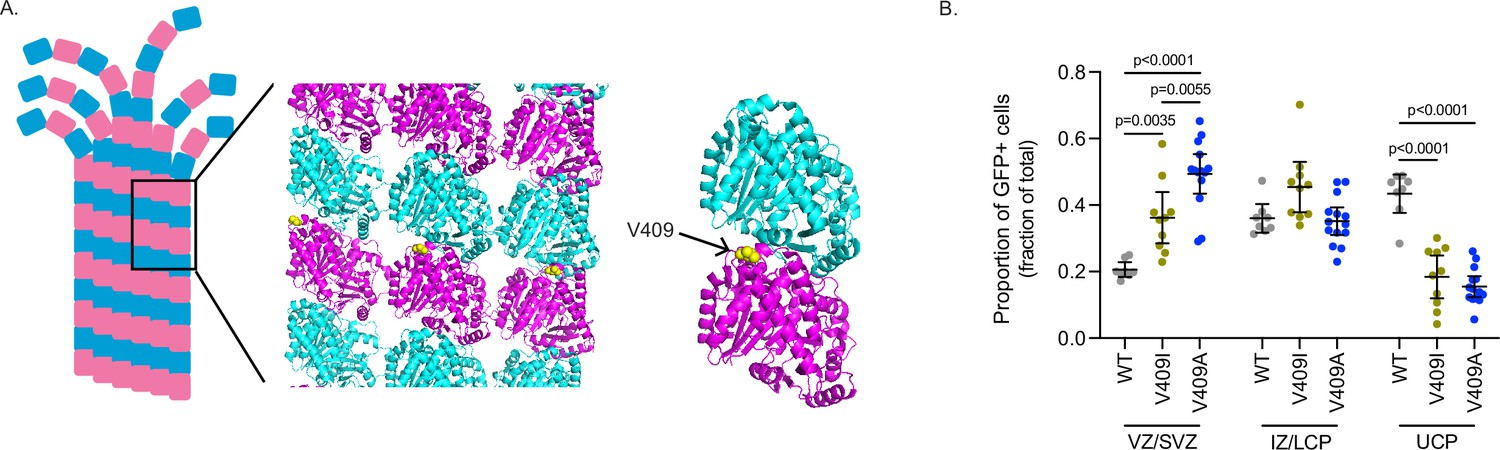
Effects of human TUBA1A-V409I/A mutants.
(A) Microtubule lattice structure modified from PDB: 3J6F (Alushin et al., 2014). TUBA1A-V409 residue displayed as yellow ball structure and labeled in zoomed in portion. (B) Individual values of the proportion of GFP fluorescence intensity in each of the three zones that make up the average values in Figure 1E. Images were collected from same set of coronal sections described in Figure 1C. Bars are mean ± 95% confidence interval. Statistical analysis between multiple groups was analyzed by two-way ANOVA and corrected for multiple comparisons post hoc by Tukey test. All statistics with p≤0.05 are indicated on graph.
Figure 2 with 2 supplements

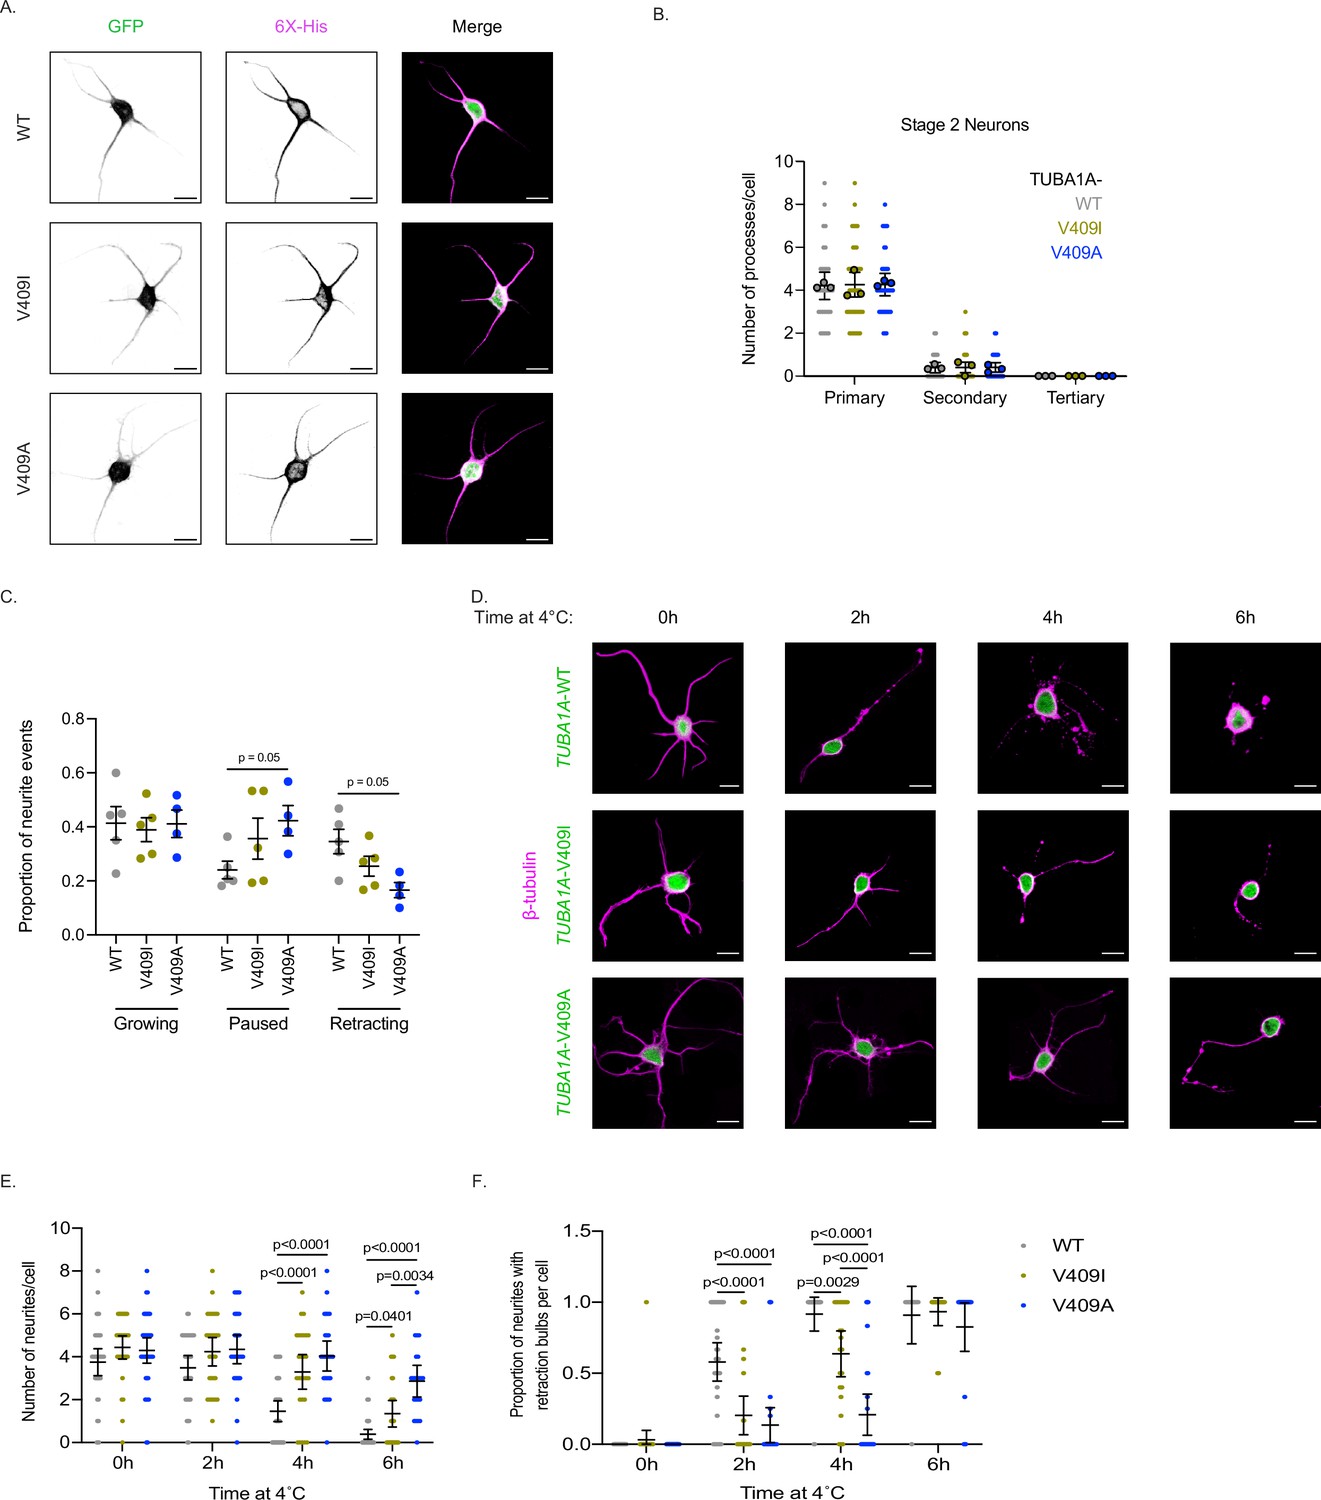
TUBA1A-V409I/A mutants alter neuron morphologies.
(A) Representative days in vitro 2 (DIV2) cortical neurons expressing cytoplasmic GFP and 6X-His-tagged TUBA1A-WT, -V409I, and -V409A. Scale bar = 10 µm. (B) Quantification of number of primary, secondary, and tertiary branches along axons and dendrites in each condition. Images were collected from three independent experiments; n=65 cells for wild-type (WT), n=56 for V409I, and n=59 for V409A. Each dot represents a single cell. Bars are mean ± 95% confidence interval. Statistical analysis between multiple groups was analyzed by two-way ANOVA and corrected for multiple comparisons post hoc by Tukey test. All statistics with p≤0.05 are indicated on graph. (C) Example image of DIV2 cortical neuron expressing cytoplasmic GFP and TUBA1A-WT. Scale bar = 10 µm. Yellow box indicates a representative region measured every 30 s for 15 min at 37°C, 5% CO2. Scale bar in insets = 5 µm. (D) Proportion of events classified as the neurite growing, paused, or shrinking, depending on if the length of the neurite grew, stayed the same, or shrunk, respectively. Images were collected from three independent experiments; n=10 cells for WT, n=13 for V409I, and n=13 for V409A. Bars are mean ± standard error of the mean. (E) Quantification of the amount of time a neurite was in a paused state, neither growing nor shrinking. Each dot represents a period of pause; cell numbers are the same as stated in (D). Bars are mean ± 95% confidence interval. Statistical analysis was done using an unpaired t-test. All statistics with p≤0.05 are indicated on graph. (F) Representative images of neurons expressing the above plasmids, exposed to 4°C for indicated time, and stained with TUBB2A/B. Scale bar = 10 µm. (G) Quantification of the number of neurites per cell every 2 hr over a 6 hr 4°C cold shock. Images were collected from three independent experiments; for WT n=36 cells at 0 hr, n=35 at 2 hr, n=41 at 4 hr, n=44 at 6 hr; for V409I n=32 at 0 hr, n=30 at 2 hr, n=27 at 4 hr, n=29 at 6 hr; for V409A n=37 at 0 hr, n=29 at 2 hr, n=27 at 4 hr, n=22 at 6 hr. Dots represent averages from the three separate experiments and error bars are ± 95% confidence interval. (H) The proportion of neurites that have retraction bulbs per cell measured every 2 hr over a 6 hr 4°C cold shock. Cell numbers and error bars are the same as stated in (G).
-
Figure 2—source data 1
Number of processes per cell.
- https://cdn.elifesciences.org/articles/76189/elife-76189-fig2-data1-v3.xlsx
-
Figure 2—source data 2
Neurite dynamics under standard conditions.
- https://cdn.elifesciences.org/articles/76189/elife-76189-fig2-data2-v3.xlsx
-
Figure 2—source data 3
Number of neurites and retraction bulbs under cold temperature conditions.
- https://cdn.elifesciences.org/articles/76189/elife-76189-fig2-data3-v3.xlsx
Figure 2—figure supplement 1
Effect of TUBA1A-V409I/A on neuronal morphologies.
(A) Representative days in vitro 1 (DIV1) cortical neurons expressing GFP and 6X-His-tagged TUBA1A-WT, -V409I, and -V409A. Scale bar = 10 µm. (B) Quantification of number of primary, secondary, and tertiary branches along axons and dendrites in each condition. Images were collected from three independent experiments; n=32 cells for wild-type (WT), n=41 for V409I, and n=36 for V409A. Each dot represents a single cell. Bars are mean ± 95% confidence interval. Statistical analysis between multiple groups was analyzed by two-way ANOVA and corrected for multiple comparisons post hoc by Tukey test. All statistics with p≤0.05 are indicated on graph. (C) Individual values of the proportion of neurite events that classify as growing, paused, or shrinking that make up the average values in Figure 2D. (D) Representative merge images of neurons expressing the above plasmids, exposed to 4°C for indicated time, stained with TUBB2A/B in magenta, and expressing cytoplasmic GFP in green. Scale bar = 10 µm. (E) Individual values of the number of neurites per cell that make up the average values in Figure 2G. Cell numbers are the same as stated in Figure 2G. Statistical analysis between multiple groups was analyzed by two-way ANOVA and corrected for multiple comparisons post hoc by Tukey test. All statistics with p≤0.05 are indicated on graph. (F) Individual quantifications of the proportion of neurites per cell that have retraction bulbs measured every 2 hr over a 6 hr 4°C cold shock that make up the average values in Figure 2H. Each dot represents one cell. Cell numbers and error bars are the same as stated in (E). Statistical analysis between multiple groups was analyzed by two-way ANOVA and corrected for multiple comparisons post hoc by Tukey test. All statistics with p≤0.05 are indicated on graph.
Figure 2—video 1
Neurite dynamics.
Primary cortical neurons transfected with a pCIG2 plasmid co-expressing TUBA1A-6X-His and cytoplasmic GFP imaged at days in vitro 2 (DIV2). Z-series of 6 µm were collected at 30 s intervals for 15 min.
Figure 3 with 2 supplements
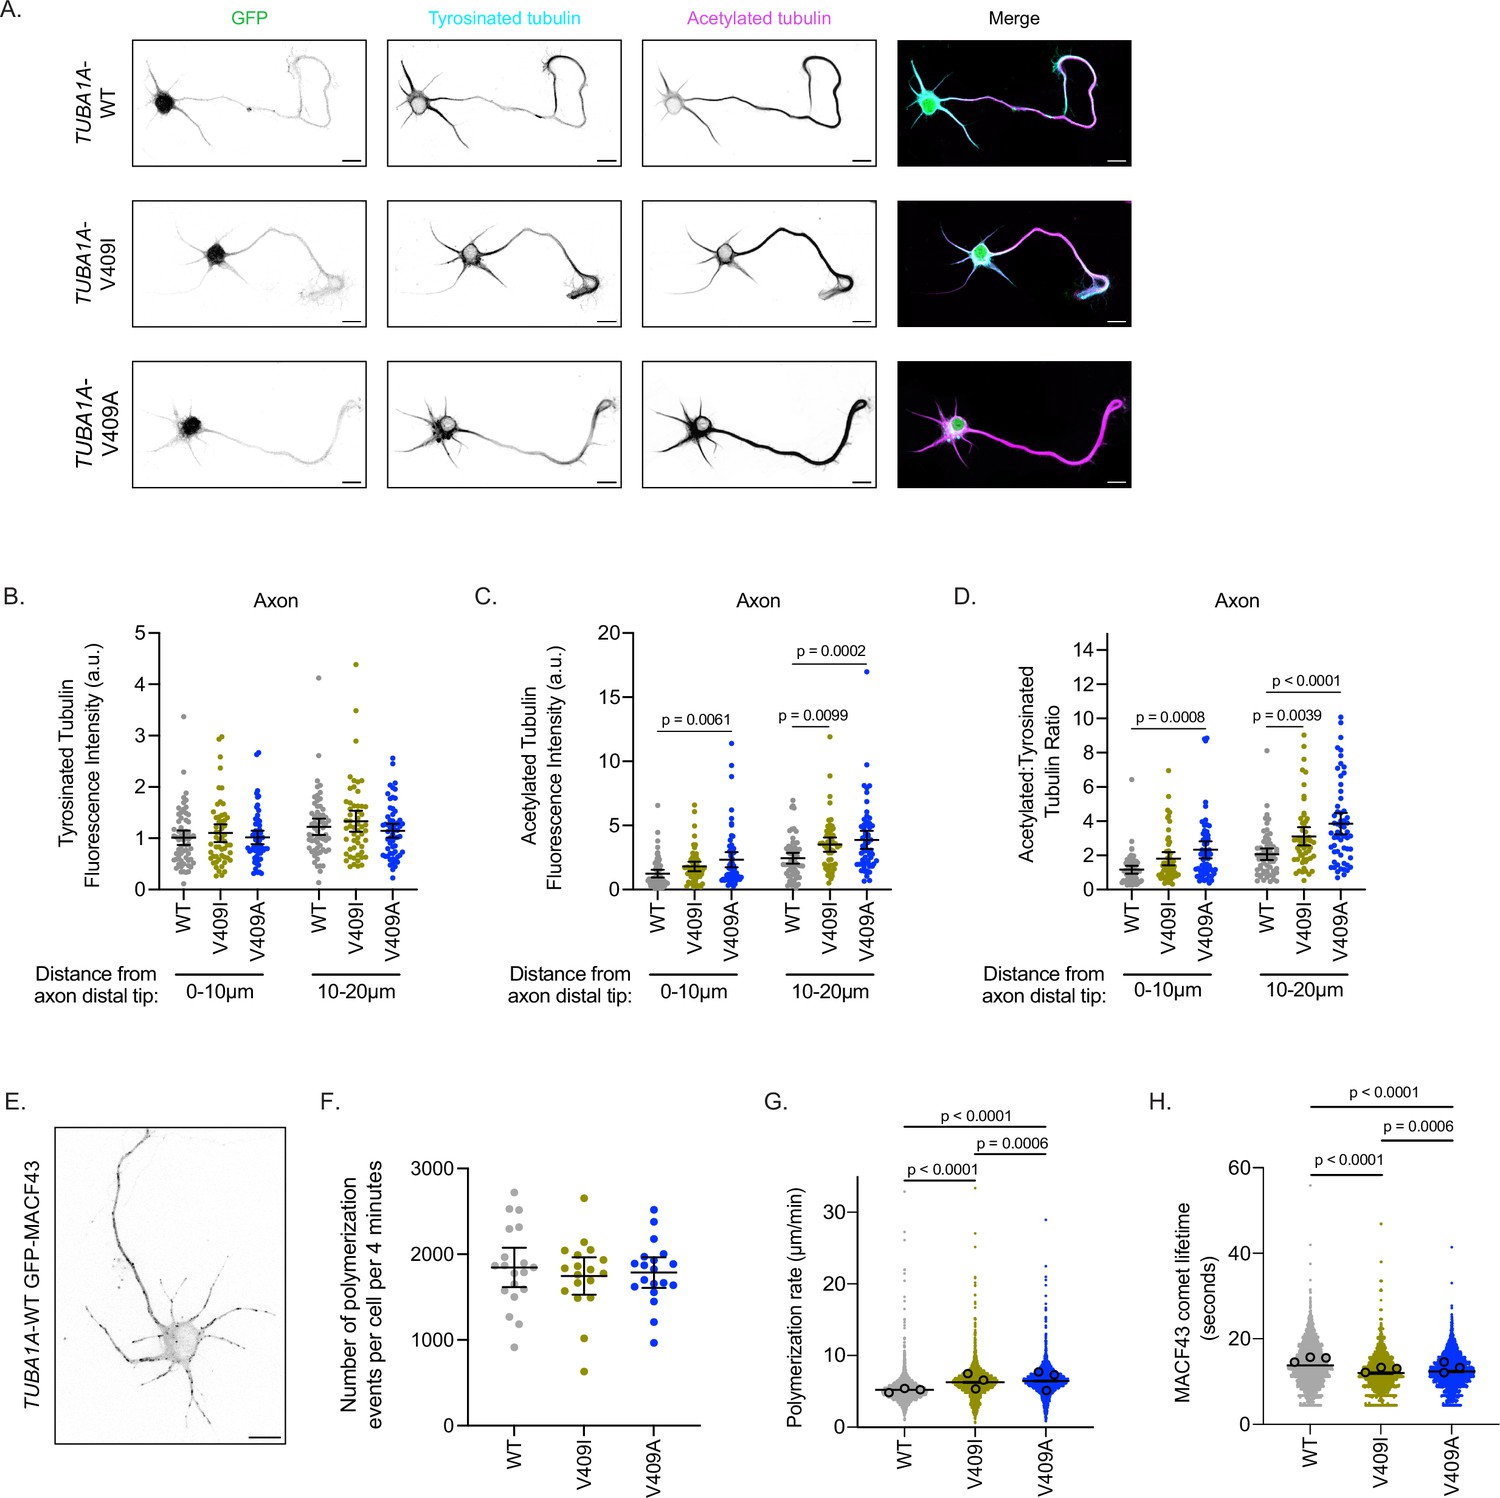
TUBA1A-V409I/A microtubules have altered microtubule dynamics in neurons.
(A) Representative days in vitro 2 (DIV2) cortical neurons expressing plasmids with cytoplasmic GFP and 6X-His-tagged TUBA1A-WT, -V409I, and -V409A. Cells stained with tyrosinated tubulin and acetylated tubulin. Scale bar = 10 µm. (B) Quantification of acetylated tubulin fluorescence intensity or tyrosinated tubulin (C) binned in two, 10 µm segments at the distal end of the axon tip. Images were acquired in three independent experiments; n=61 cells for wild-type (WT), n=54 for V409I, n=59 for V409A. Each dot represents the quantification from one cell. Bars are mean ± 95% confidence interval. Statistical analysis between multiple groups was analyzed by two-way ANOVA and corrected for multiple comparisons post hoc by Tukey test. All statistics with p≤0.05 are indicated on graph. (D) Calculated ratio of acetylated tubulin over tyrosinated tubulin measurements displayed in (B) and (C). (E) Example image of DIV2 cortical neuron co-expressing TUBA1A-WT and GFP-MACF43. Scale bar = 10 µm. (F) Quantification of the number of microtubule polymerization events that occur in each cell over the course of 4 min. Images were obtained from three independent experiments; n=19 cells for WT, n=18 for V409I, n=19 for V409A. Each dot represents one cell. Bars represent mean ± 95% confidence interval. Statistical analysis for panels F–H was done using an unpaired t-test. All statistics with p≤0.05 are indicated on graph. (G) Quantification of microtubule polymerization rates measured from GFP-MACF43 comets. Each dot represents the rate of one microtubule polymerization rate. Larger dots outlined in black indicate the average of all polymerization rates from the three independent experiments where these images were obtained. (H) Quantification of GFP-MACF43 comet lifetime in seconds.
-
Figure 3—source data 1
Microtubule post-translational modifications fluorescence intensity.
- https://cdn.elifesciences.org/articles/76189/elife-76189-fig3-data1-v3.xlsx
-
Figure 3—source data 2
Quantification of microtubule dynamics in neurons by GFP-MACF43 comets.
- https://cdn.elifesciences.org/articles/76189/elife-76189-fig3-data2-v3.xlsx
Figure 3—figure supplement 1
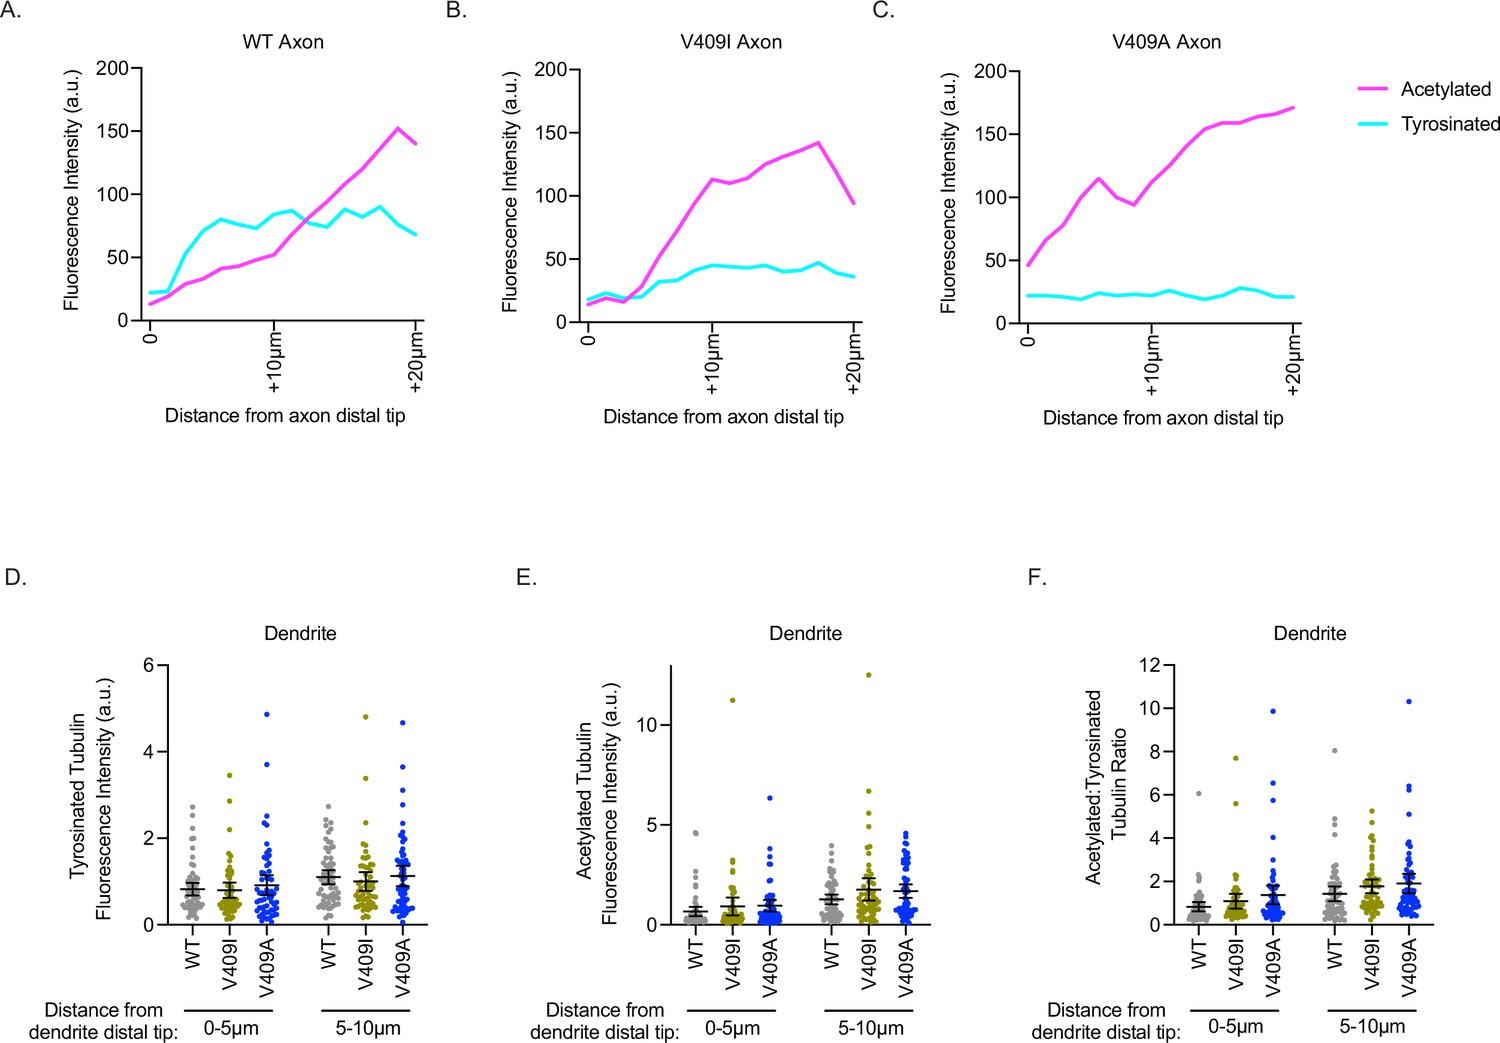
TUBA1A-V409I/A microtubules have increased microtubule acetylation but not tyrosination.
(A–C) Example line scan from one TUBA1A-WT (A), -V409I (B), and -V409A (C) neuron measuring the fluorescence intensity along the distal 10 µm of the axon and the next proximal 10 µm. Acetylated tubulin values are in magenta and tyrosinated tubulin values are in aqua. (D) Quantification of acetylated tubulin fluorescence intensity or tyrosinated tubulin (E) binned in two, 5 µm segments at the distal end of a dendrite tip. Images were acquired in three independent experiments; n=61 for wild-type (WT), n=54 for V409I, n=59 for V409A. Each dot represents the quantification from one cell. Bars are mean ± 95% confidence interval. Statistical analysis between multiple groups was analyzed by two-way ANOVA and corrected for multiple comparisons post hoc by Tukey test. All statistics with p≤0.05 are indicated on graph. (F) Calculated ratio of acetylated tubulin over tyrosinated tubulin measurements displayed in (D) and (E).
Figure 3—video 1
Microtubule dynamics in neurons.
Primary cortical neurons transfected with a pCIG2 plasmid co-expressing TUBA1A and GFP-MACF43 imaged at days in vitro 2 (DIV2). Z-series of 5 µm were collected at 2.2 s intervals for 4 min.
Figure 4 with 1 supplement
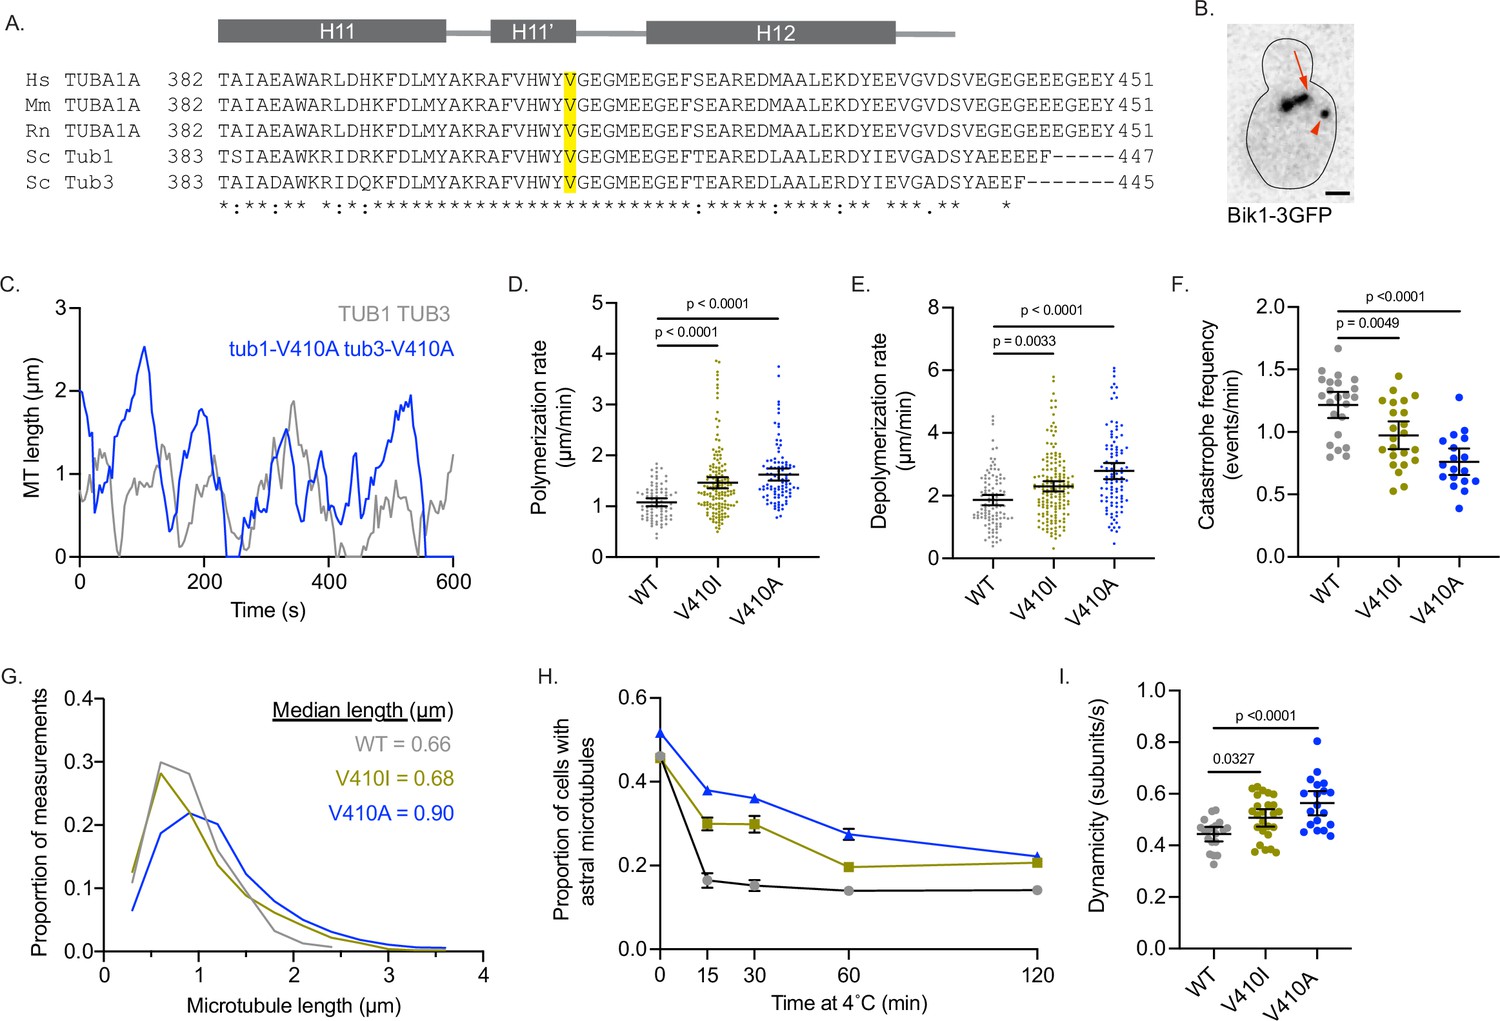
Modeling TUBA1A-V409I/A mutants in budding yeast reveals altered microtubule dynamics.
(A) Sequence alignment of human, mouse, and rat TUBA1A and budding yeast α-tubulins Tub1 and Tub3. Valine 409 is highlighted in yellow and resides in a highly conserved helix known as H11’. (B) Representative image of budding yeast cell with microtubule plus end binding protein Bik1 labeled with 3GFP. Scale bar = 1 µm. (C) Life plot of the dynamics of individual microtubules from wild-type (WT) (gray) and V410A (blue) cells showing the change in length over time. (D) Polymerization rates of astral microtubules. Images were obtained from three independent experiments; n=19 cells for WT, n=25 for V410I, n=19 for V409A. Each dot represents a single polymerization event. Bars are mean ± 95% confidence interval. Statistical analysis was done using a one-way ANOVA followed by a Tukey test to correct for multiple comparison tests. All statistics with p≤0.05 are indicated on graph. (E) Depolymerization rates of astral microtubules. Each dot represents a single depolymerization event. (F) Catastrophe frequency for astral microtubules expressed as the number of catastrophe events that occur per minute. Each dot represents the average catastrophe frequency of a single cell. (G) Histogram of all astral microtubule lengths from time lapse imaging of WT, V410I, and V410A cells. (H) Proportion of cells with astral microtubules after indicated time at 4°C. Symbols represent average of three independent experiments; for WT n=581 cells at 0 min, n=385 at 15 min, n=362 at 30 min, n=365 at 60 min, n=283 at 120 min; for V409I n=574 cells at 0 min, n=502 at 15 min, n=235 at 30 min, n=383 at 60 min, n=484 at 120 min; for V409A n=677 cells at 0 min, n=401 at 15 min, n=257 at 30 min, n=247 at 60 min, n=238 at 120 min. (I) Dynamicity of astral microtubules calculated as the total change in length divided by the total change in time. Each dot represents the calculated dynamicity value of a single cell. Bars are mean ± 95% confidence interval. Statistical analysis was done using a one-way ANOVA followed by a Tukey test to correct for multiple comparison tests. All statistics with p≤0.05 are indicated on graph.
-
Figure 4—source data 1
Quantification of microtubule dynamcis in yeast by Bik1-3GFP.
- https://cdn.elifesciences.org/articles/76189/elife-76189-fig4-data1-v3.xlsx
-
Figure 4—source data 2
Proportion of cells with astral microtubules at cold temperature.
- https://cdn.elifesciences.org/articles/76189/elife-76189-fig4-data2-v3.xlsx
Figure 4—figure supplement 1
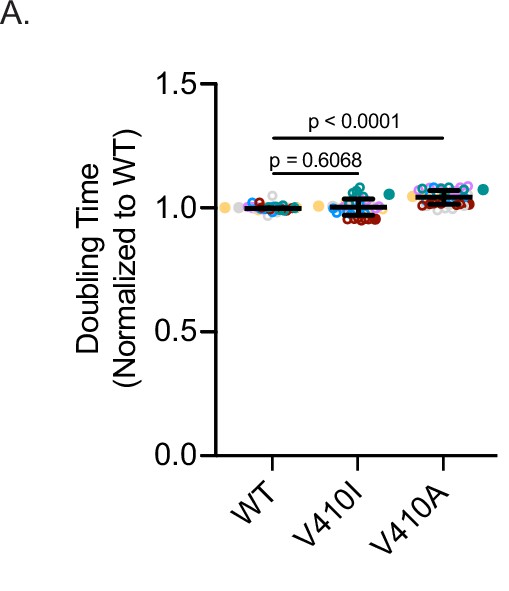
Fitness assay for V410I/A yeast mutants.
(A) Doubling times of cells expressing the indicated mutation at the genomic TUB1 locus. For each genotype, three technical replicates of two biological replicates were used over the course of three independent experiments; n=18 replicates for all wild-type (WT), V409I, and V409A. Bars are mean ± 95% confidence interval. Statistical analysis between multiple groups was analyzed by two-way ANOVA and corrected for multiple comparisons post hoc by Tukey test. All statistics with p≤0.05 are indicated on graph.
-
Figure 4—figure supplement 1—source data 1
Doubling time of yeast with WT or V410I/A tubulin.
- https://cdn.elifesciences.org/articles/76189/elife-76189-fig4-figsupp1-data1-v3.xlsx
Figure 5 with 1 supplement
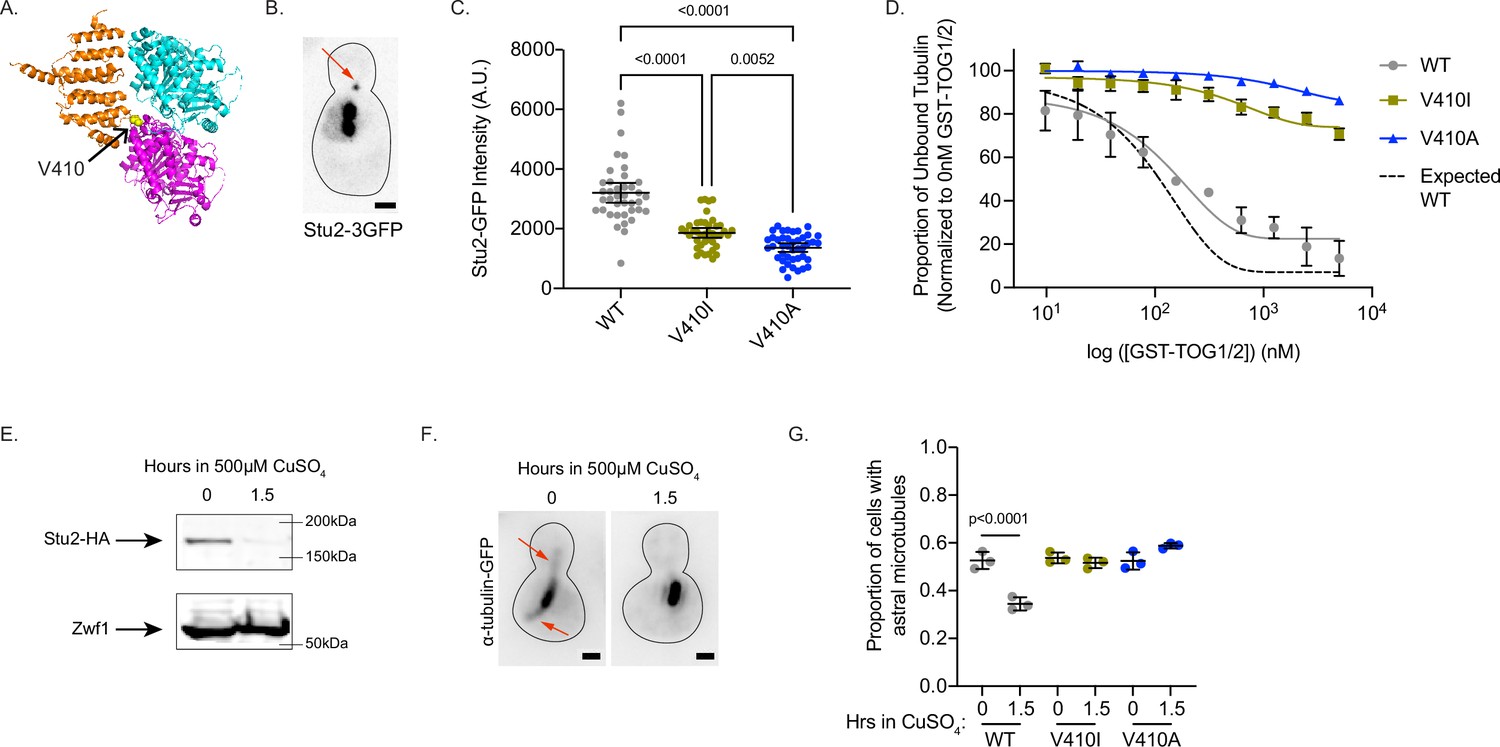
V410I/A mutants subvert Stu2 regulation.
(A) Structure of yeast tubulin heterodimer with Stu2 TOG1 modified from PDB: 4FFB (Ayaz et al., 2012). Tub1-V409 residue displayed as yellow ball structure and labeled in zoomed in portion. (B) Representative image of budding yeast cell expressing Stu2-3GFP. Red arrow indicates Stu2 at microtubule plus end. Scale bar = 1 µm. (C) Quantification of Stu2-3GFP fluorescence intensity at microtubule plus ends. Images were acquired from three independent experiments; n=39 cells for wild-type (WT), n=42 for V410I, n=42 for V409A. Each dot represents the quantification from a single cell. Bars are mean ± 95% confidence interval. Statistical analysis was done using a one-way ANOVA followed by a Tukey test to correct for multiple comparison tests. All statistics with p≤0.05 are indicated on graph. (D) Proportion of unbound tubulin in solution in the presence of increasing concentrations of GST-TOG1/2. Data was analyzed from the α-tubulin signal on supernatant samples run on western blots. Each condition was normalized to the constant amount of tubulin added to each sample in the absence of GST-TOG1/2. Dots represent averages from three separate experiments. Bars are standard error of the mean. (E) Western blot of protein lysate from cells induced with 500 µM CuSO4 for 0 and 1.5 hr. Blots were probed for HA and Zwf1. (F) Example images of WT cells induced with 500 µM CuSO4 for 0 and 1.5 hr stained for α-tubulin. Red arrows indicate astral microtubules. Scale bar = 1 µm. (G) Quantification of proportion of cells imaged that have at least one astral microtubule. Images were acquired from three independent experiments; for WT n=1389 cells at 0 hr, n=1,525 at 1.5 hr; for V409I n=940 cells at 0 hr, n=2221 at 1.5 hr; for V409A n=1483 at 0 hr, n=1677 at 1.5 hr. Each dot represents the average proportion of cells from the three separate experiments. Bars are mean ± standard error of the mean. Statistical analysis was done using a one-way ANOVA followed by a Tukey test to correct for multiple comparison tests. All statistics with p≤0.05 are indicated on graph.
-
Figure 5—source data 1
Fluorescence intensity of Stu2-3GFP at microtubule plus ends.
- https://cdn.elifesciences.org/articles/76189/elife-76189-fig5-data1-v3.xlsx
-
Figure 5—source data 2
Proportion of unbound tubulin in the presence of TOG domains.
- https://cdn.elifesciences.org/articles/76189/elife-76189-fig5-data2-v3.xlsx
-
Figure 5—source data 3
Proportion of cells with astral microtubules following Stu2 depletion.
- https://cdn.elifesciences.org/articles/76189/elife-76189-fig5-data3-v3.xlsx
-
Figure 5—source data 4
Western blot of HA-tagged Stu2 in the absence and prescence of 500µM copper sulfate.
- https://cdn.elifesciences.org/articles/76189/elife-76189-fig5-data4-v3.pdf
-
Figure 5—source data 5
Labeled western blot of HA-tagged Stu2 in the absence and prescence of 500µM copper sulfate.
- https://cdn.elifesciences.org/articles/76189/elife-76189-fig5-data5-v3.pdf
Figure 5—figure supplement 1
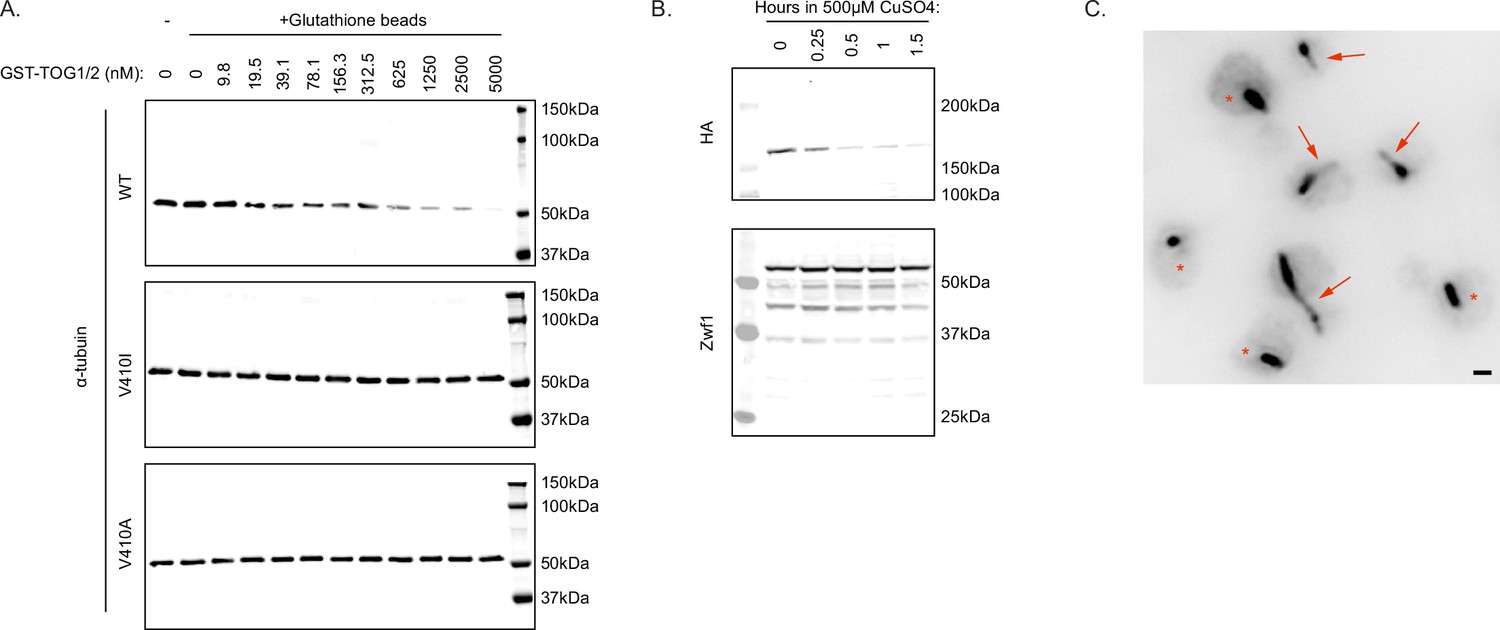
V410I/A mutants affect Stu2 interactions and regulation.
(A) Representative western blots of wild-type (WT), V410I, and V410A samples probed for α-tubulin in the absence of glutathione beads, as well as in the presence of glutathione beads and increasing concentrations of GST-TOG1/2. (B) Representative western blot of WT cells induced with 500 µM CuSO4 for indicated number of hours. Blots were probed with HA and Zwf1 antibodies. (C) Large field representative image of WT cells in the absence of 500 µM CuSO4 stained for α-tubulin. Red arrows represent cells with at least one astral microtubule. Red stars represent cells without an astral microtubule. Scale bar = 1 µm.
-
Figure 5—figure supplement 1—source data 1
Labeled western blot of WT alpha tubulin in the presence of increasing concentrations of GST-TOG1/2.
- https://cdn.elifesciences.org/articles/76189/elife-76189-fig5-figsupp1-data1-v3.pdf
-
Figure 5—figure supplement 1—source data 2
Western blot of WT alpha tubulin in the presence of increasing concentrations of GST-TOG1/2.
- https://cdn.elifesciences.org/articles/76189/elife-76189-fig5-figsupp1-data2-v3.pdf
-
Figure 5—figure supplement 1—source data 3
Western blot of V410I alpha tubulin in the presence of increasing concentrations of GST-TOG1/2.
- https://cdn.elifesciences.org/articles/76189/elife-76189-fig5-figsupp1-data3-v3.pdf
-
Figure 5—figure supplement 1—source data 4
Labeled western blot of V410I alpha tubulin in the presence of increasing concentrations of GST-TOG1/2.
- https://cdn.elifesciences.org/articles/76189/elife-76189-fig5-figsupp1-data4-v3.pdf
-
Figure 5—figure supplement 1—source data 5
Western blot of V410A alpha tubulin in the presence of increasing concentrations of GST-TOG1/2.
- https://cdn.elifesciences.org/articles/76189/elife-76189-fig5-figsupp1-data5-v3.pdf
-
Figure 5—figure supplement 1—source data 6
Labeled western blot of V410A alpha tubulin in the presence of increasing concentrations of GST-TOG1/2.
- https://cdn.elifesciences.org/articles/76189/elife-76189-fig5-figsupp1-data6-v3.pdf
-
Figure 5—figure supplement 1—source data 7
Western blot of time course of HA-tagged Stu2 in the prescence of 500µM copper sulfate.
- https://cdn.elifesciences.org/articles/76189/elife-76189-fig5-figsupp1-data7-v3.pdf
-
Figure 5—figure supplement 1—source data 8
Labeled western blot of time course of HA-tagged Stu2 in the prescence of 500µM copper sulfate.
- https://cdn.elifesciences.org/articles/76189/elife-76189-fig5-figsupp1-data8-v3.pdf
-
Figure 5—figure supplement 1—source data 9
Western blot of Zwf1 loading control for time course of HA-tagged Stu2 in the presence of 500µM copper sulfate.
- https://cdn.elifesciences.org/articles/76189/elife-76189-fig5-figsupp1-data9-v3.pdf
-
Figure 5—figure supplement 1—source data 10
Labeled western blot of Zwf1 loading control for time course of HA-tagged Stu2 in the presence of 500µM copper sulfate.
- https://cdn.elifesciences.org/articles/76189/elife-76189-fig5-figsupp1-data10-v3.pdf
Figure 6
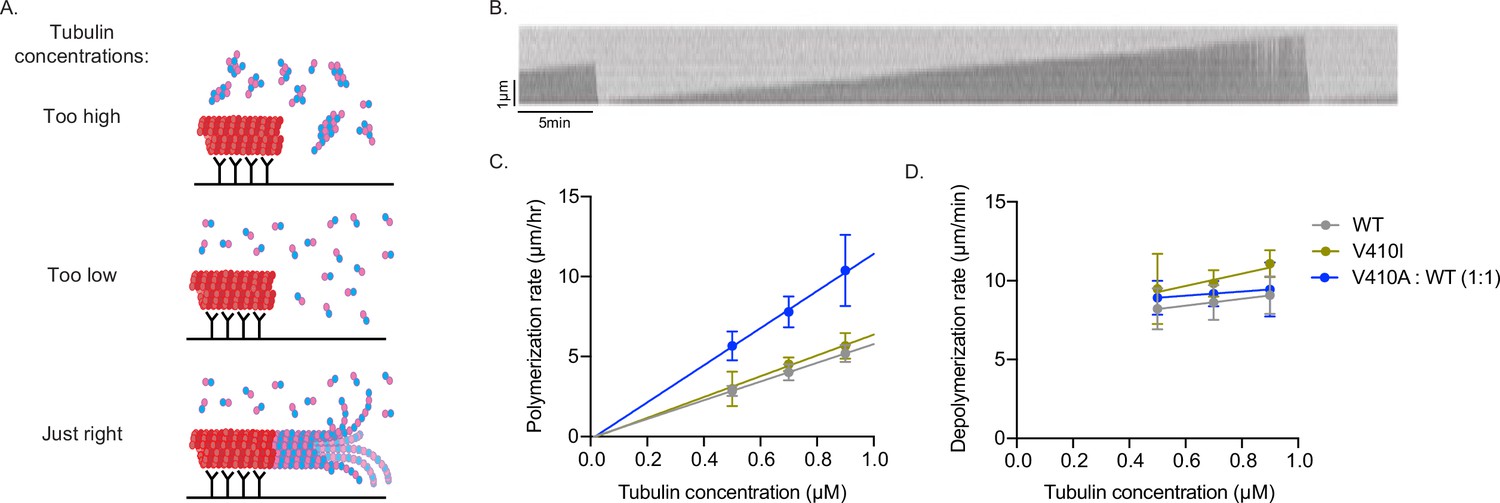
V410A has intrinsically faster microtubule polymerization rates in vitro.
(A) Graphic depicting aggregates and non-seeded nucleation when tubulin concentrations are too high, no nucleation when concentrations are too low, and dynamic microtubules when concentrations are at an appropriate level. (B) Example kymograph of dynamic microtubule from purified budding yeast tubulin measured using interference reflection microscopy. X and Y scale bars = 5 min and 1 µm, respectively. (C) Microtubule polymerization rates at 0.5, 0.7, and 0.9 µM of tubulin. Each data point represents the mean of three independent experiments; for wild-type (WT) n=15 microtubules at 0.5 µM, n=23 at 0.7 µM, n=18 at 0.9 µM; for V410I n=12 microtubules at 0.5 µM, n=14 at 0.7 µM, n=12 at 0.9 µM; for V410A n=16 microtubules at 0.5 µM, n=20 at 0.7 µM, n=10 at 0.9 µM. Bars are mean ± 95% confidence interval. (D) Microtubule depolymerization rates.
-
Figure 6—source data 1
In vitro microtubule dynamics.
- https://cdn.elifesciences.org/articles/76189/elife-76189-fig6-data1-v3.xlsx
-
Figure 6—source data 2
Microtubule dynamics in vitro.
Internal reflection microscopy imaging of purified yeast tubulin assembling from GMPCPP-stabilized seeds made of porcine tubulin.
- https://cdn.elifesciences.org/articles/76189/elife-76189-fig6-data2-v3.zip
Figure 7
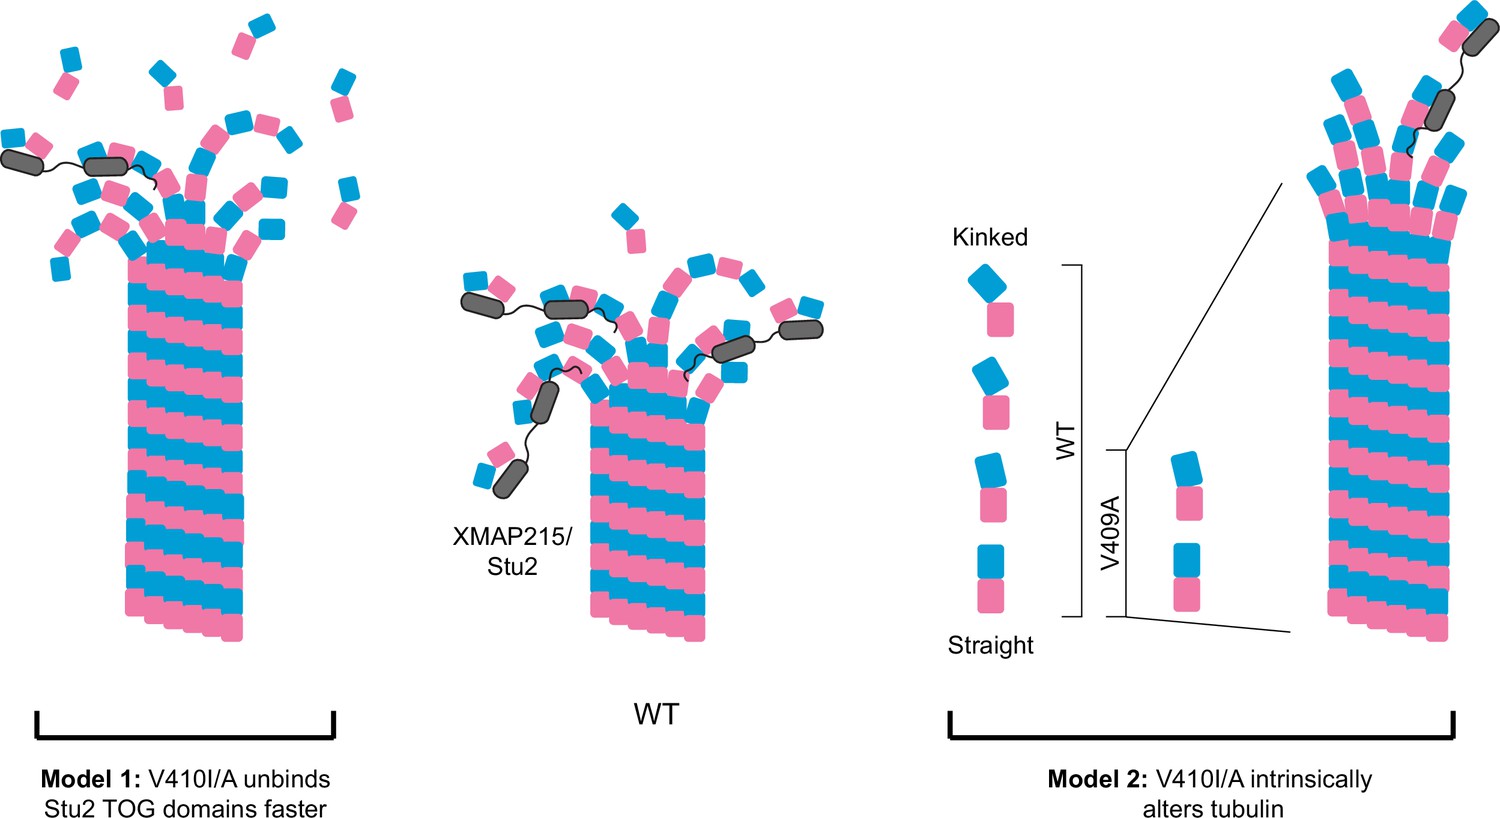
Potential models for the effect of α-tubulin V409I/A on XMAP215/Stu2 and microtubule polymerization.
Wild-type (WT) tubulin undergoes a series of conformational states as it transitions from a curved free heterodimer into the straight microtubule lattice, which is essential for tubulin binding to a variety of microtubule-associated proteins (MAPs), such as XMAP215/Stu2 (center). Our data suggest that V409I, and more severely V409A, have decreased XMAP215/Stu2 activity at microtubule plus ends, yet have faster microtubule polymerization rates. Model 1: V410I/A tubulin unbinds from TOG (tumor overexpressed gene) domains faster, thus increasing the concentration of free tubulin to promote faster microtubule polymerization. However, if the faster microtubule polymerization rates were solely driven by a decrease in XMAP215/Stu2 and/or free tubulin concentration, we would not expect to see an increase in intrinsic polymerization rates in V409A as compared to WT, as we do in our reconstitution experiments. Therefore, we favor the second model. Model 2: the V410I/A tubulin heterodimer is intrinsically altered in a way that disrupts normal XMAP215/Stu2 regulation and drives faster microtubule polymerization. One way in which tubulin could be intrinsically changed is through adopting a straighter, lattice-favoring conformation.
Tables
Table 1
Neurite dynamics.
| Growth rate (µm/min) | Retraction rate (µm/min) | Growth duration (min) | Retraction duration (min) | Paused duration (min) | |
|---|---|---|---|---|---|
| WT | 2.7±0.4 | 2.8±0.5 | 0.9±0.1 | 0.8±0.1 | 0.7±0.1 |
| V409I | 2.4±0.2 | 2.4±0.4 | 0.9±0.1 | 0.6±0.1 | 1.2±0.3 |
| V409A | 2.7±0.3 | 2.4±0.6 | 0.8±0.1 | 0.7±0.1 | 1.4±0.4 |
Key resources table
| Reagent type (species) or resource | Designation | Source or reference | Identifiers | Additional information |
|---|---|---|---|---|
| Gene (Homo sapiens) | TUBA1A | NCBI | Gene ID: 7846 | |
| Gene (Saccharomyces cerevisiae) | TUB1 | Saccharomyces genome database | SGD:S000004550 | |
| Gene (Saccharomyces cerevisiae) | TUB3 | Saccharomyces genome database | SGD:S000004593 | |
| Biological sample (Mus musculus) | In utero electroporation coronal brain slices | This paper | Coronal slices of E18.5 mouse brains | |
| Biological sample (Rattus norvegicus) | Primary cortical rat neurons | This paper | Cortices obtain from P0-P2 rats | |
| Recombinant DNA reagent | pCIG2-TUBA1A-6X-His | Buscaglia et al., 2020a | Human TUBA1A plasmids transfected in mouse or rat neurons | |
| Recombinant DNA reagent | pCIG2-TUBA1A-IRES-GFP-MACF43 | Aiken et al., 2019 | Plasmid to co-express human TUBA1A and GFP-MACF43 in rat neurons | |
| Sequence-based reagent | TUBA1A-V409A F QC | This paper | PCR primer; p674 | ctttgttcactggtacgctggggaggggatg |
| Sequence-based reagent | TUBA1A-V409A R QC | This paper | PCR primer; p675 | catcccctccccagcgtaccagtgaacaaag |
| Sequence-based reagent | TUBA1A-V409I F QC | This paper | PCR primer; p986 | cctttgttcactggtacattggggaggggatgg |
| Sequence-based reagent | TUBA1A-V409I R QC | This paper | PCR primer; p987 | ccatcccctccccaatgtaccagtgaacaaagg |
| Sequence-based reagent | tub1-V410A F | This paper | PCR primer; p545 | CGTCCACTGGTATGCCGGTGAAGGTATG |
| Sequence-based reagent | tub1-V410A R | This paper | PCR primer; p546 | CATACCTTCACCGGCATACCAGTGGACG |
| Sequence-based reagent | tub1-V410I F | This paper | PCR primer; p1018 | cgtgctttcgtccactggtatatcggtgaaggt |
| Sequence-based reagent | tub1-V410I R | This paper | PCR primer; p1019 | accttcaccgatataccagtggacgaaagcacg |
| Commercial assay, kit | Amaxa rat nucleofector kit | Lonza | VPG-1003 | For transfecting primary cortical neurons |
| Antibody | Anti-acetylated tubulin (mouse monoclonal) | Sigma | T7451 | IF (1:1000) |
| Antibody | Anti-tyrosinated tubulin (rat monoclonal) | Sigma | MAB1864-I | IF (1:1000) |
| Antibody | Anti-6X-His (mouse monoclonal) | Invitrogen | 4A12E4 37–2900 | IF (1:500) |
| Antibody | Anti-beta II tubulin (rabbit monoclonal) | Abcam | ab179512 | IF (1:500) |
| Antibody | Anti-rabbit IgG AF568 (goat polyclonal) | Thermo | A-11011 | IF (1:200) |
| Antibody | Anti-rat IgG AF568 (goat polyclonal) | Thermo | A-11077 | IF (1:200) |
| Antibody | Anti-mouse IgG AF647 (goat polyclonal) | Thermo | A32728 | IF (1:200) |
| Other | DAPI fluoromount-G | Southern Biotech | 0100–20 | Used in Figure 1C and D |
| Recombinant DNA reagent | pGEX6p1-GST-STU2 1–590 | Widlund et al., 2012 | Expression of GST-fused Stu2 TOG1/2 domains | |
| Recombinant DNA reagent | pRS426-GAL-Tub1-internal 6X-His | Johnson et al., 2011 | Overexpress α-tubulin in yeast | |
| Recombinant DNA reagent | pRS424-GAL-Tub2 (untagged) | Johnson et al., 2011 | Overexpress β-tubulin in yeast | |
| Strain, strain background (Saccharomyces cerevisiae) | Jel1 | Lindsley and Wang, 1993 | Protease deficient yeast strain used for expressing tubulin for purification | |
| Strain, strain background (Saccharomyces cerevisiae) | YEF473 | Bi and Pringle, 1996 | Lab yeast strain used for all genetic and cell biology experiments | |
| Strain, strain background (Saccharomyces cerevisiae) | Stu2 depletion strains | Kosco et al., 2001 | In this paper, y4835, y4836 | Depletion of Stu2 from strain upon addition of 500 µM CuSO4 |
| Strain, strain background (Escherichia coli) | BL21 | Invitrogen | D1306 | Competent bacterial cells |
| Software, algorithm | U-Track | Applegate et al., 2011 | Tracking microtubule plus ends in Figure 3E–H |
Appendix 1—table 1
Plasmids.
| Plasmid ID | Plasmid name | Source |
|---|---|---|
| pJM0157 | pGEX6p1-GST-STU2 1–590 | Widlund et al., 2012 |
| pJM0295 | pCIG2 | Hand et al., 2005 |
| pJM0288 | pRS426-GAL-Tub1-internal 6X-His | Johnson et al., 2011 |
| pJM0289 | pRS424-GAL-Tub2 (untagged) | Johnson et al., 2011 |
| pJM0430 | pCIG2-Tuba1a(WT)-IRES-GFP-MACF43 | Aiken et al., 2019 |
| pJM0459 | Stu2-3GFP | This study |
| pJM0469 | TUB1-pRS306 integrating plasmid | Aiken et al., 2020 |
| pJM0477 | pCIG2-Tuba1a(V409A)-IRES-GFP-MACF43 | This study |
| pJM0507 | Tub1-V410I-pRS306 integrating plasmid | This study |
| pJM0510 | pCIG2-Tuba1a(V409I)-IRES-GFP-MACF43 | This study |
| pJM0560 | Tub1-V410A-pRS306 integrating plasmid | This study |
| pJM0546 | pCIG2-TUBA1A-6X-His | Buscaglia et al., 2020a |
| pJM0558 | pRS426-GAL-Tub1(V410A)-internal 6X-His | This study |
| pJM0559 | pRS426-GAL-Tub1(V410I)-internal 6X-His | This study |
| pJM0612 | pCIG2-TUBA1A(V409I)-int-6X-His | This study |
| pJM0642 | pCIG2-TUBA1A(V409A)-int-6X-His | This study |
Appendix 1—table 2
Yeast strains.
| Yeast strain | Genotype | Source |
|---|---|---|
| yJM3733 | MATα tub1::pJM469(TUB1 + 487::URA) STU2-3GFP::TRP ura3-52 lys2-801 leu2-∆1 his3-∆200 trp1-∆63 | This study |
| yJM3734 | MATa tub1::pJM469(TUB1 + 487::URA) STU2-3GFP::TRP ura3-52 lys2-801 leu2-∆1 his3-∆200 trp1-∆63 | This study |
| yJM4010 | MATa BIK1-3GFP::TRP1 tub1::pJM560(TUB1-V410A+487::URA) tub3-V410A+150::hygB ura3-52 lys2-801 leu2-∆1 his3-∆200 trp1-∆63 | This study |
| yJM4011 | MATα BIK1-3GFP::TRP1 tub1::pJM560(TUB1-V410A+487::URA) tub3-V410A+150::hygB ura3-52 lys2-801 leu2-∆1 his3-∆200 trp1-∆63 | This study |
| yJM4014 | MATa BIK1-3GFP::TRP1 tub1::pJM507(TUB1-V410I+487::URA) tub3-V410I+150::hygB ura3-52 lys2-801 leu2-∆1 his3-∆200 trp1-∆63 | This study |
| yJM4015 | MATα BIK1-3GFP::TRP1 tub1::pJM507(TUB1-V410I+487::URA) tub3-V410I+150::hygB ura3-52 lys2-801 leu2-∆1 his3-∆200 trp1-∆63 | This study |
| yJM4077 | MATa STU2-3GFP::TRP1 tub1::pJM560(TUB1-V410A+487::URA) tub3-V410A+150::hygB ura3-52 lys2-801 leu2-∆1 his3-∆200 trp1-∆63 | This study |
| yJM4078 | MATα STU2-3GFP::TRP1 tub1::pJM560(TUB1-V410A+487::URA) tub3-V410A+150::hygB ura3-52 lys2-801 leu2-∆1 his3-∆200 trp1-∆63 | This study |
| yJM4081 | MATa STU2-3GFP::TRP1 tub1::pJM507(TUB1-V410I+487::URA) tub3-V410I+150::hygB ura3-52 lys2-801 leu2-∆1 his3-∆200 trp1-∆63 | This study |
| yJM4082 | MATα STU2-3GFP::TRP1 tub1::pJM507(TUB1-V410I+487::URA) tub3-V410I+150::hygB ura3-52 lys2-801 leu2-∆1 his3-∆200 trp1-∆63 | This study |
| yJM4726 | MATα tub1::pJM469(TUB1+487::URA) TUB3+150::hygB BIK1-3GFP::TRP1 ura3-52 lys2-801 leu2-∆1 his3-∆200 trp1-∆63 | This study |
| yJM4727 | MATa tub1::pJM469(TUB1+487::URA) TUB3+150::hygB BIK1-3GFP::TRP1 ura3-52 lys2-801 leu2-∆1 his3-∆200 trp1-∆63 | This study |
| yJM4835 | MATa PACE1-UBR1 PACE1-ROX1 stu2Δ::URA3::PANB1-UB-R-STU2 ura3-52 trp1-Δ1 ade2-101 lys2-801 | Kosco et al., 2001 |
| yJM4836 | MATa PACE1-UBR1 PACE1-ROX1 ura3-52::URA3 ura3-52 trp1-Δ1 ade2-101 lys2-801 | Kosco et al., 2001 |
| yJM4859 | MATa PACE1-UBR1 PACE1-ROX1 stu2Δ::URA3::PANB1-UB-R-STU2 tub1::pJM754(TUB1+487::TRP1) ura3-52 trp1-Δ1 ade2-101 lys2-801 | This study |
| yJM4860 | MATa PACE1-UBR1 PACE1-ROX1 stu2Δ::URA3::PANB1-UB-R-STU2 tub1-V410I::pJM755(TUB1+487-V410I::TRP1) ura3-52 trp1-Δ1 ade2-101 lys2-801 | This study |
| yJM4861 | MATa PACE1-UBR1 PACE1-ROX1 stu2Δ::URA3::PANB1-UB-R-STU2 tub1-V410A::pJM756(TUB1+487-V410A::TRP1) ura3-52 trp1-Δ1 ade2-101 lys2-801 | This study |
Appendix 1—table 3
Oligo sequences (5’ to 3’).
| # | Name | Application | Sequence | Species | Direction |
|---|---|---|---|---|---|
| 674 | TUBA1A-V409A F QC | TUBA1A-V409A F Quikchange | ctttgttcactggtacgctggggaggggatg | Human | Forward |
| 675 | TUBA1A-V409A R QC | TUBA1A-V409A R Quikchange | catcccctccccagcgtaccagtgaacaaag | Human | Reverse |
| 869 | MACF43 + NotI R | PCR up MACF43 and clone into pCIG2 | tatc GCGGCCGC TCATCTCTTTGAGGACTTGTCC | Mammalian | Reverse |
| 870 | BsrGI + MACF43 F | PCR up MACF43 and clone into pCIG2 | GAGC TGTACA AGTCCGGCCGGACTCAG | Mammalian | Forward |
| 986 | TUBA1A-V409I F QC | TUBA1A-V409I F Quikchange | cctttgttcactggtacattggggaggggatgg | Human | Forward |
| 987 | TUBA1A-V409I R QC | TUBA1A-V409I R Quikchange | ccatcccctccccaatgtaccagtgaacaaagg | Human | Reverse |
| 1042 | TUBA1A Gibson PstI insert F | Amplify TUBA1A from pINCY into pCIG2 | ctcaagcttcgaattctgcaATGcgtgagtgcatctccatcc | Mouse | Forward |
| 1043 | TUBA1A Gibson PstI insert R | Amplify TUBA1A from pINCY into pCIG2 | cggtaccgtcgactgcaTTAgtattcctctccttcttcctcaccc | Mouse | Reverse |
| 1075 | TUBA1A-T349E F QC | TUBA1A-T349E F Quikchange | gtttgtggattggtgccccgagggcttcaaggttggcatca | Human | Forward |
| 1076 | TUBA1A-T349E R QC | TUBA1A-T349E R Quikchange | tgatgccaaccttgaagccctcggggcaccaatccacaaac | Human | Reverse |
| 867 | pCIG2-TUBA1A stop +53 R | TUBA1A sequencing | GGCTTCGGCCAGTAACGTTAG | Mammalian | Reverse |
| 868 | pCIG2-TUBA1A start – 52 F | TUBA1A sequencing | CCTACAGCTCCTGGGCAACG | Mammalian | Forward |
| 545 | tub1-V410A F | tub1-V410A F Quikchange | CGTCCACTGGTATGCCGGTGAAGGTATG | Yeast | Forward |
| 546 | tub1-V410A R | tub1-V410A R Quikchange | CATACCTTCACCGGCATACCAGTGGACG | Yeast | Reverse |
| 1018 | tub1-V410I F | tub1-V410I F Quikchange | cgtgctttcgtccactggtatatcggtgaaggt | Yeast | Forward |
| 1019 | tub1-V410I R | tub1-V410I R Quikchange | accttcaccgatataccagtggacgaaagcacg | Yeast | Reverse |
| 1280 | tub3-V410A F | tub3-V410A F to introduce mutation at TUB3 locus | TGATGTATGC CAAACGTGCT TTCGTCCATT GGTAT GcC GGTGAAGGTATG GAAGAAGGTG | Yeast | Forward |
| 1281 | tub3-V410I F | tub3-V410I F to introduce mutation at TUB3 locus | TGATGTATGC CAAACGTGCT TTCGTCCATT GGTAT aTC GG TGAAGGTATG GAAGAAGGTG | Yeast | Forward |
| 5551 | TUB3 + 154 R | To introduce V410 mutations at TUB3 locus | GCTATTGTTCTAACTGTACACCTAAAGGTAAGTG gca tag gcc act agt gga tc | Yeast | Reverse |
Additional files
Download links
A two-part list of links to download the article, or parts of the article, in various formats.
Downloads (link to download the article as PDF)
Open citations (links to open the citations from this article in various online reference manager services)
Cite this article (links to download the citations from this article in formats compatible with various reference manager tools)
TUBA1A tubulinopathy mutants disrupt neuron morphogenesis and override XMAP215/Stu2 regulation of microtubule dynamics
eLife 11:e76189.
https://doi.org/10.7554/eLife.76189


