Full spectrum flow cytometry reveals mesenchymal heterogeneity in first trimester placentae and phenotypic convergence in culture, providing insight into the origins of placental mesenchymal stromal cells
- Department of Obstetrics and Gynaecology, Faculty of Medical and Health Sciences, University of Auckland, New Zealand
- School of Biological Sciences, University of Auckland, New Zealand
- Maurice Wilkins Centre, University of Auckland, New Zealand
Figures
Figure 1

Placental villus structure and specificity of markers used to exclude unwanted cell populations.
(A) Placental villous morphology and plane of section, (B) haematoxylin and eosin staining of a thin section though a placental villus (7.1 weeks), localisation of (C) β4 integrin (red) to cytotrophoblasts and (E) CD144 (red) and CD31 (green) to blood vessels (white arrows) in placental villus sections confirmed antibody specificity. No fluorescence is seen in negative IgG controls (D, F) run simultaneously. Nuclei are counterstained with DAPI (blue). Scale bar = 100 µm. Rendered images in (A) have been acquired from Biorender.com.
Figure 2
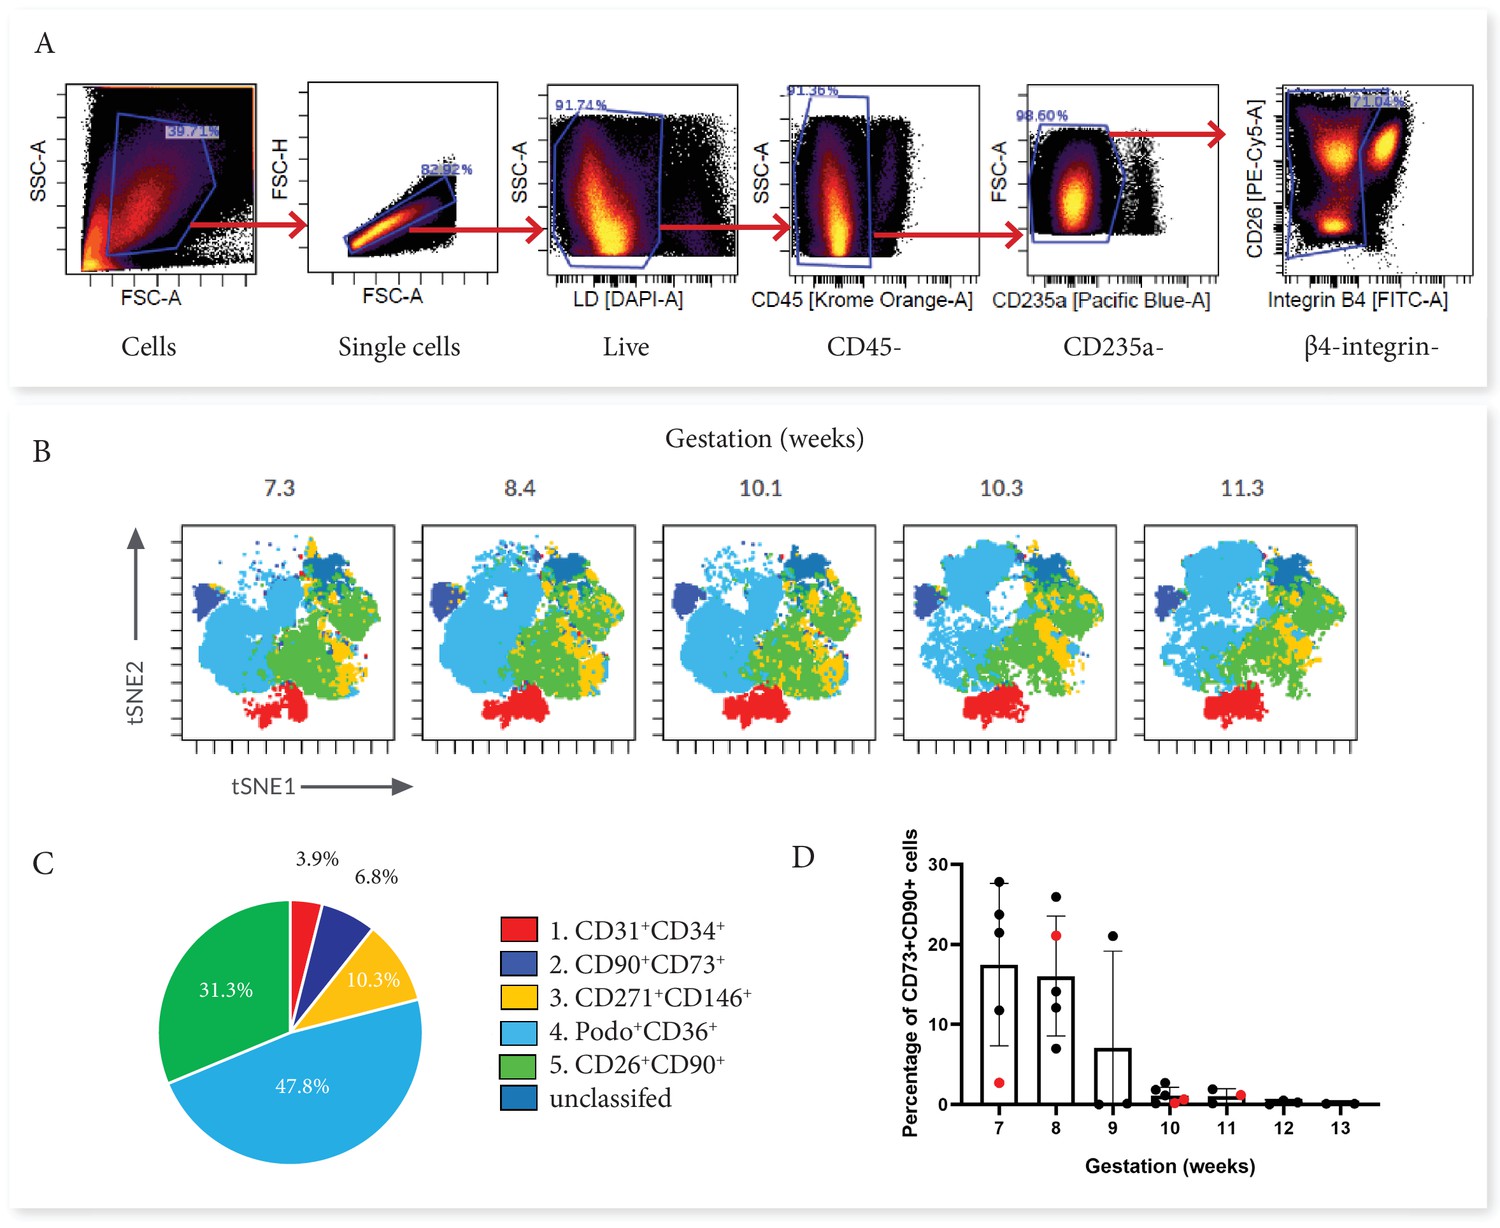
Categorisation of placental villus core subsets using Panel One markers.
(A) Samples were gated to exclude debris, doublets, dead cells, hematopoietic cells (CD45+ and CD235a+), and cytotrophoblasts (β4 integrin). (B) Marker expression was used to categorise five subsets that were overlaid onto viSNE plots generated in Cytobank. (C) The average percentage contribution of each subset is presented as a pie chart. (D) A scatter plot with bars depicting the mean percentage of CD73+CD90+ cells from villous core cells across first trimester analysed on an Aria II (n=24, black) or an Aurora spectral analyser (n=5, red). Error bars represent the standard deviation of the mean.
Figure 3
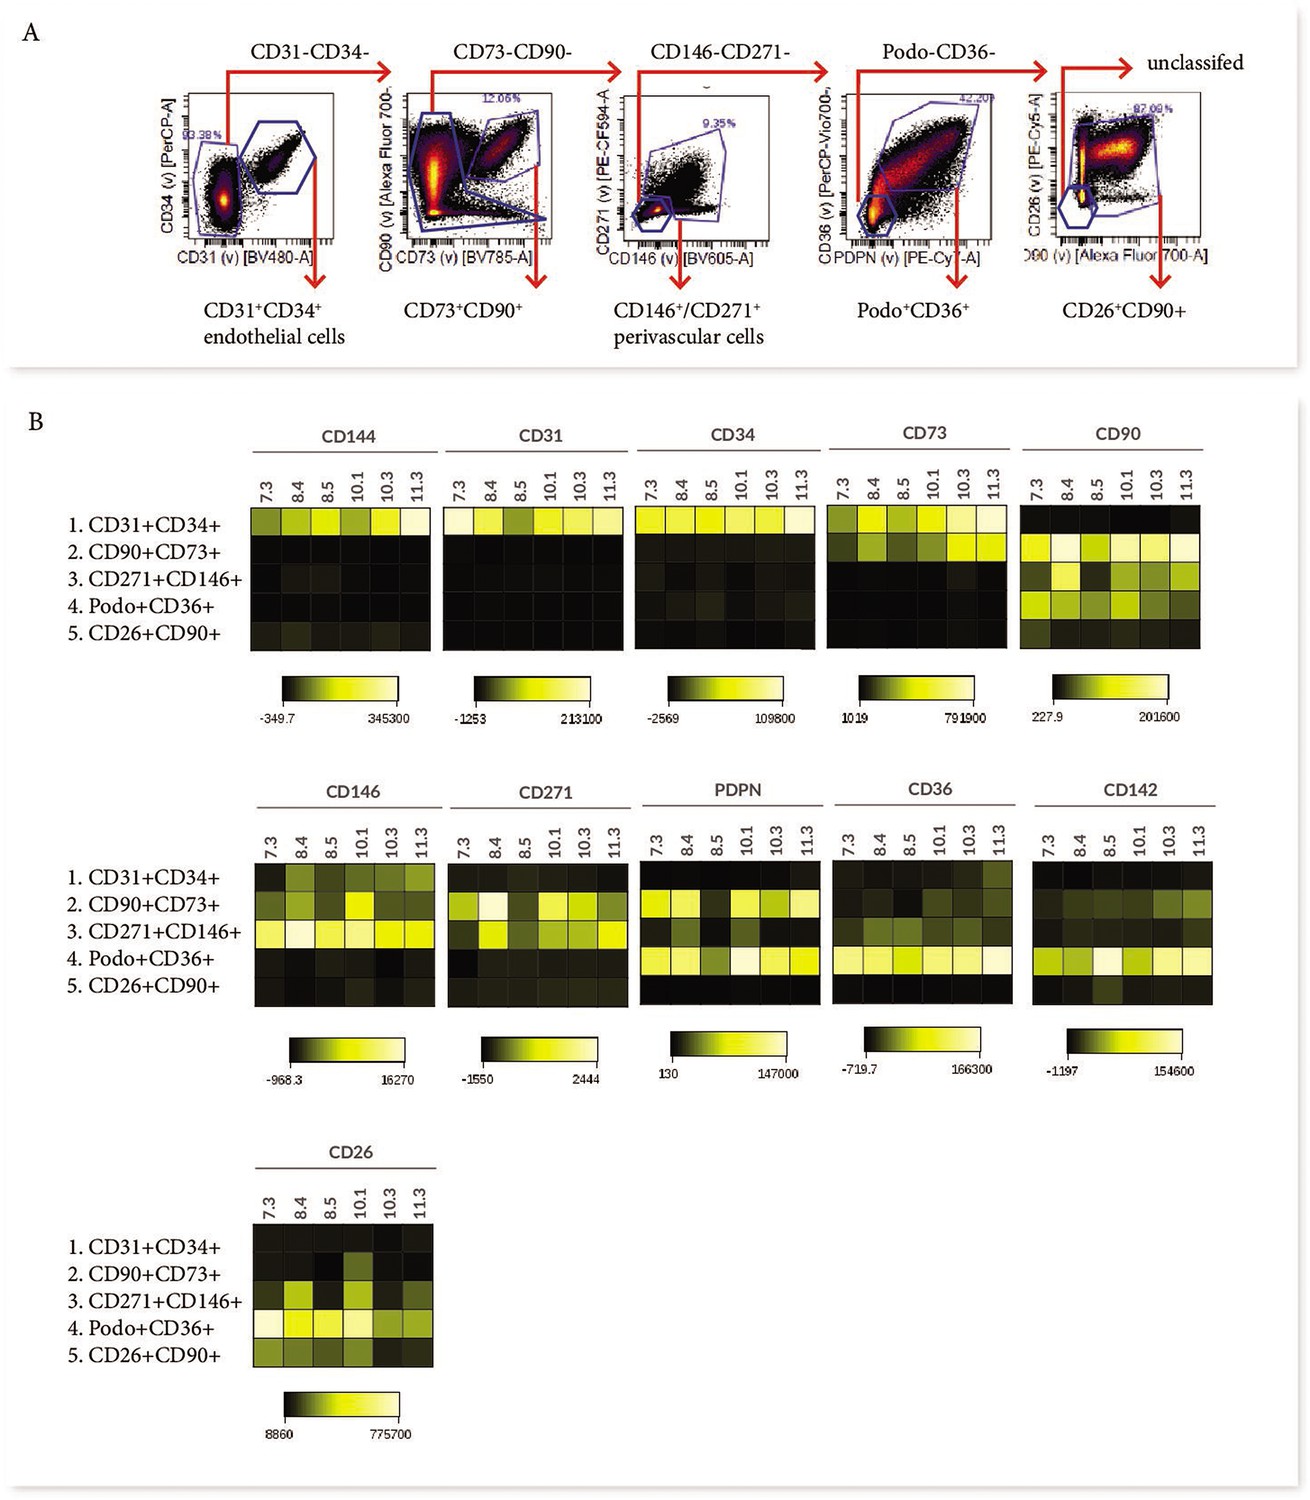
Phenotypic characterisation of villous core subsets.
(A) The gating strategy used to identify subsets (CD31+CD34+, CD73+CD90+, perivascular cells, podoplanin+CD36+ and CD26+CD90+), and (B) heat maps comparing the expression of specific antigens between subsets (n=5).
Figure 4 with 2 supplements
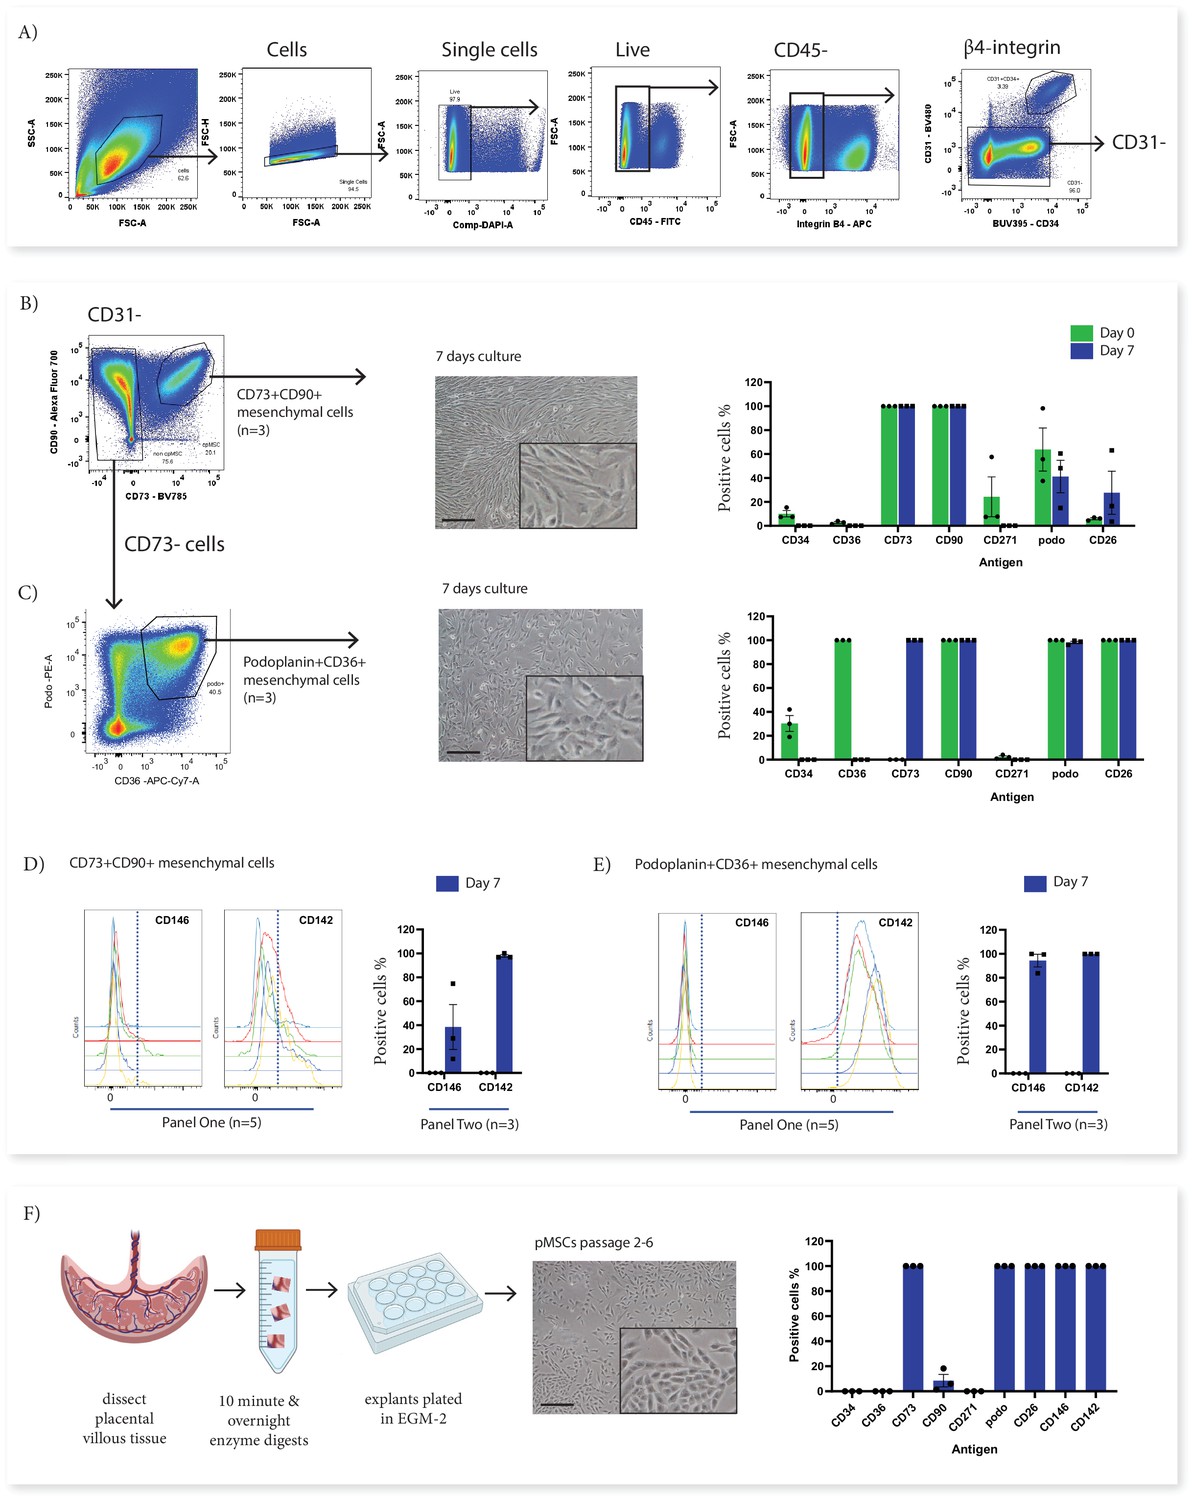
In vitro culture of CD73+CD90+ and podoplanin+CD36+ cells.
(A) FACS sorting was used to isolate CD73+CD90+ and podoplanin+CD36+ cells from placental villous core cells (n=3). (B) Morphology and phenotype of CD73+CD90+ cells after 7 days in culture. (C) Phenotype of podoplanin+CD36+ cells after 7 days in culture. (D) CD146 and CD142 expression on CD73+CD90+ analysed with Panel One (day 0, n=5) or at 7 days after culture (n=3). (E) CD146 and CD142 expression on podoplanin+CD36+ cells analysed with Panel One (day 0, n=5) or at 7 days after culture (n=3). (F) Isolation of explant-derived pMSCs, and morphology and phenotype of passaged pMSCs (n=3). Error bars = standard error of the mean and scale bar = 100 µm.
Figure 4—figure supplement 1
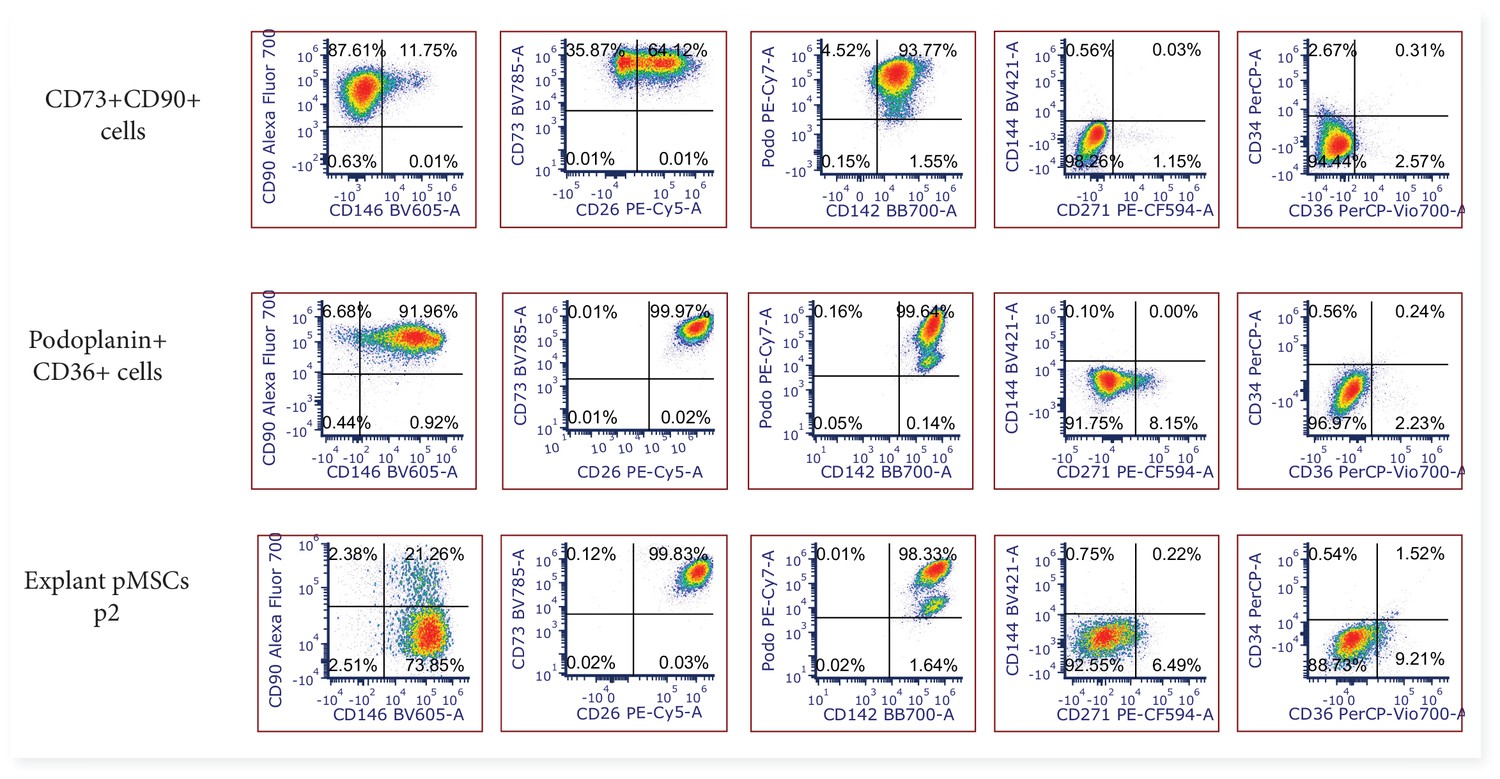
Representative 2-dimensional flow cytometry plots displaying the phenotype of FACS sorted CD73+CD90+ and podoplanin+CD36+ cells after 7 days culture in vitro (n=3), and explant isolated pMSCs after culture in vitro (n=3, p2-6).
Figure 4—figure supplement 2
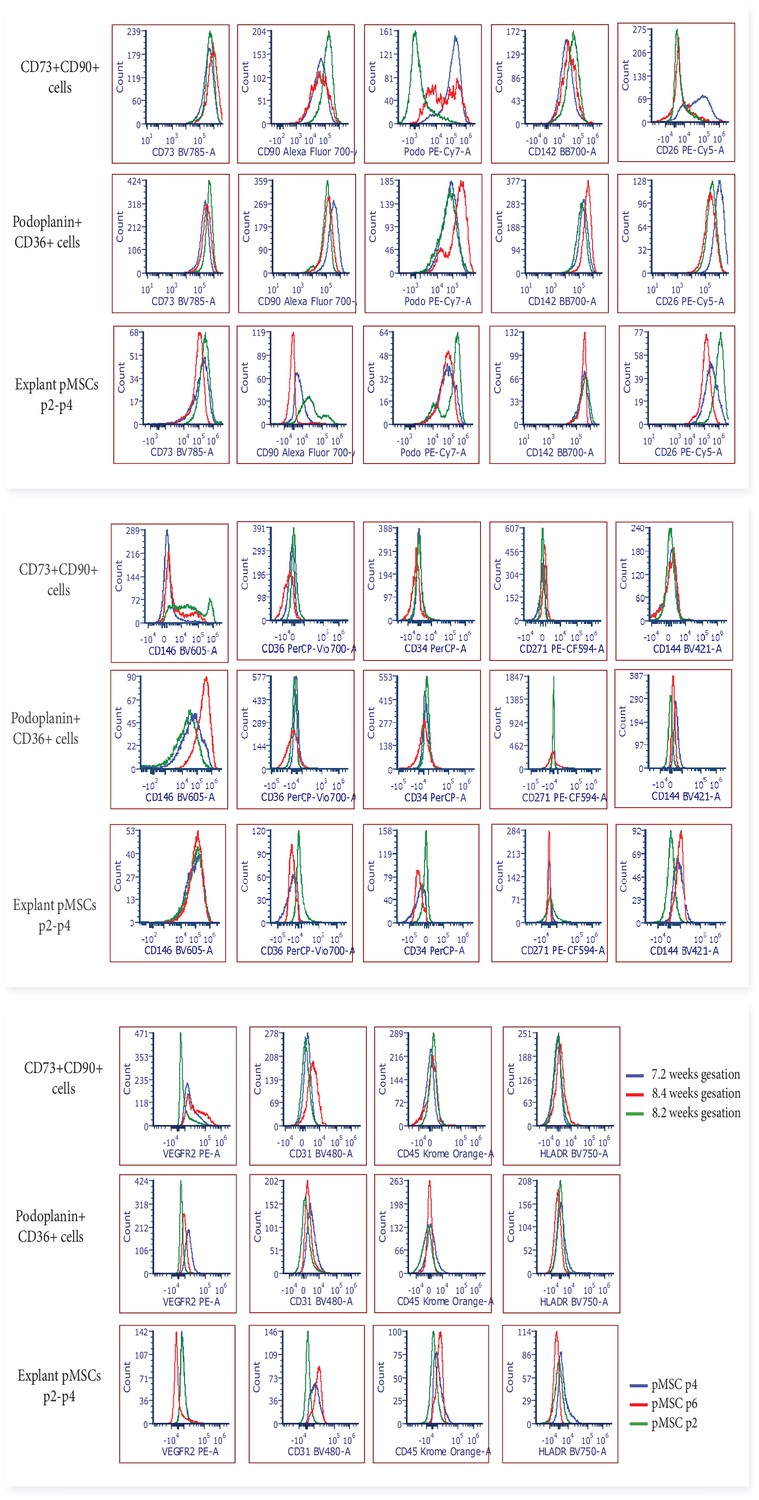
Flow cytometry histograms displaying the phenotype of FACS sorted CD73+CD90+ and podoplanin+CD36+ cells after 7 days culture in vitro (n=3), and explant isolated pMSCs after culture in vitro (n=3, p2-6).
Figure 5
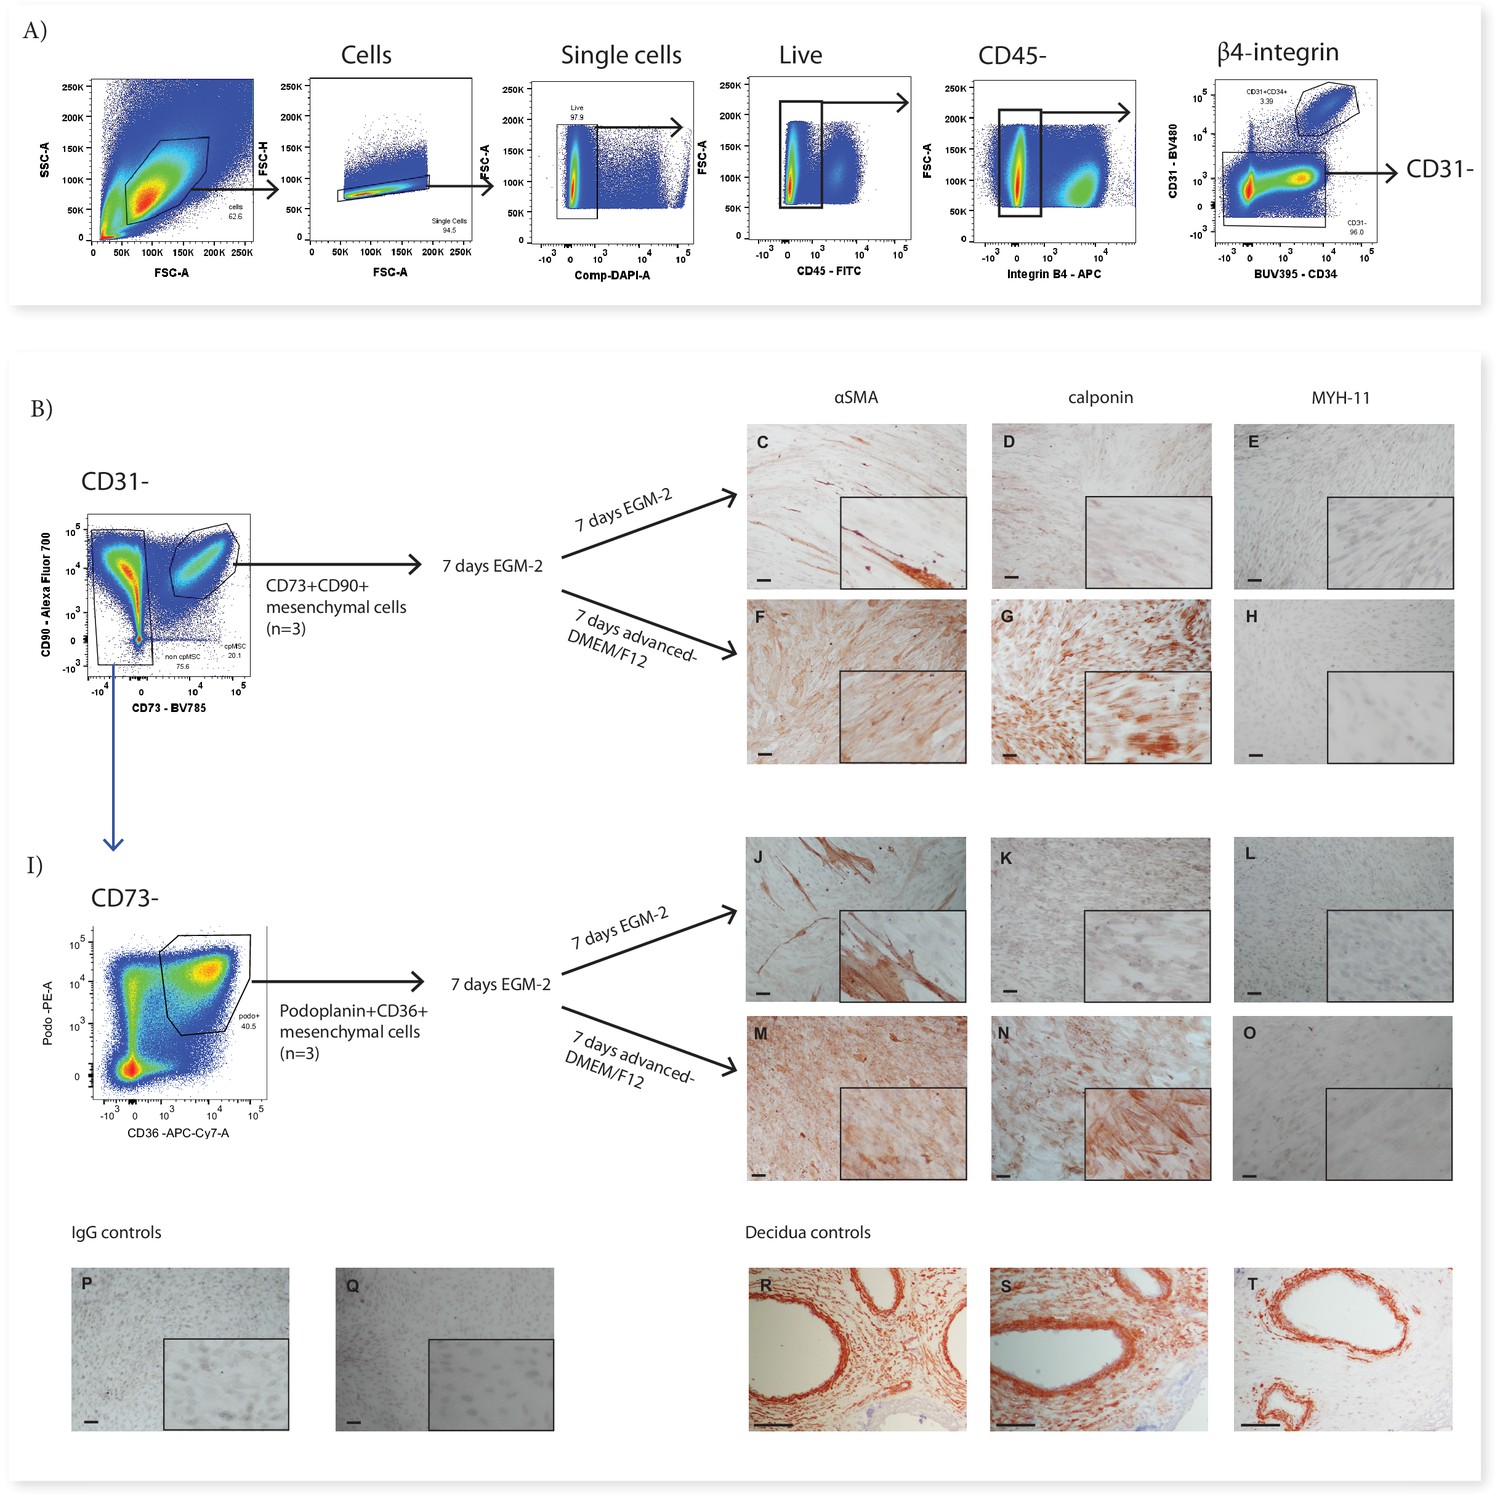
CD73+CD90+ and podoplanin+CD36+ cells upregulate markers consistent with contractile cells.
(A) FACS sorting was used to isolate CD73+CD90+ and podoplanin+CD36+ cells from placental villous core digests (n=3). CD73+CD90+ (B) and podoplanin+CD36+ (I) cell expression of αSMA (C, F, J, M), calponin (D, G, K, H) or MYH-11 (E, H, L, O) following 7 days of culture in advanced-DMEM/F12 or EGM-2. Irrelevant mouse IgG (P) and rabbit IgG (Q) were used as negative controls. Decidual sections containing spiral arteries with intact smooth muscle layers were used as positive controls for staining (R–T). Scale bar = 100 µm.
Figure 6
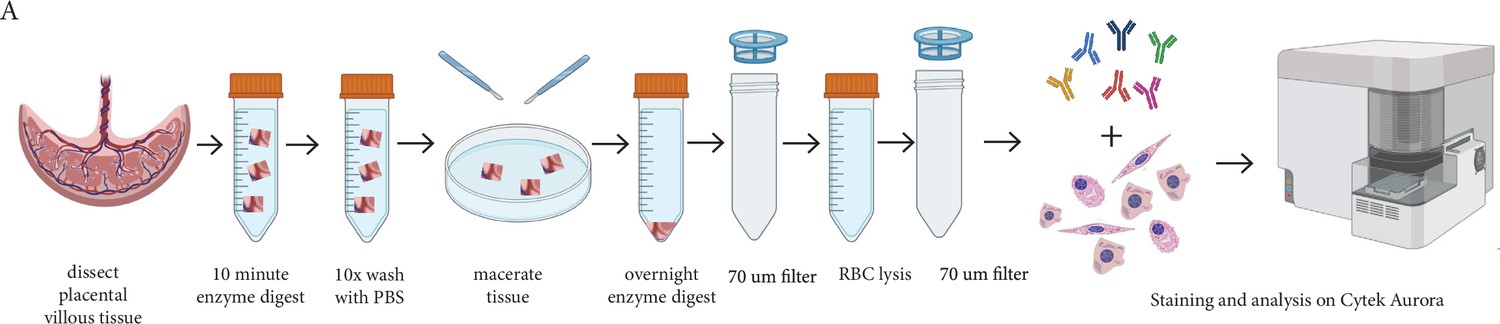
Schematic diagram demonstrating the enzymatic digestion process used to obtain a single-cell suspension of placental villous core cells for flow cytometry analysis.
Figure 7
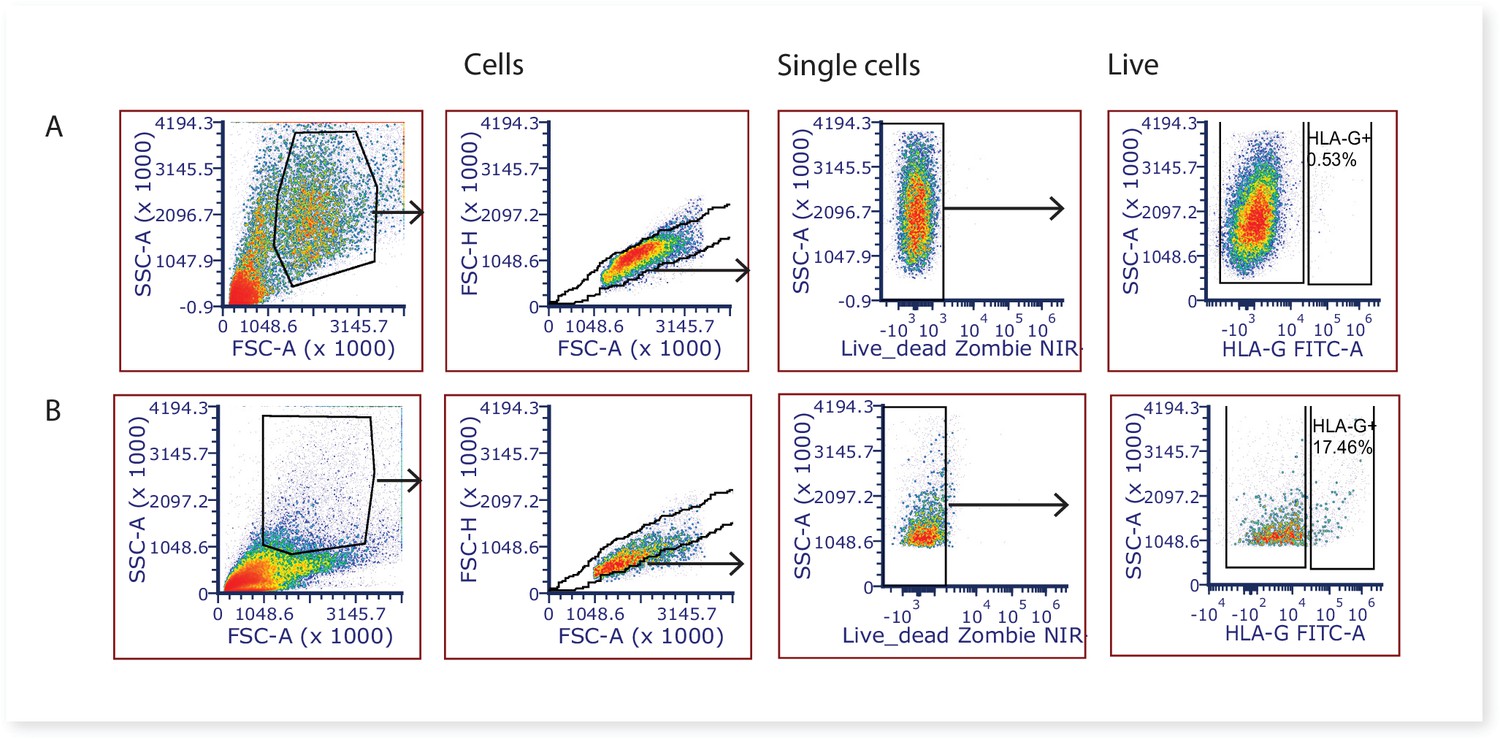
Representative 2-dimensional flow cytometry plots displaying the gating strategy used to assess the proportion of extravillous trophoblasts (HLAG +cells) in villous core digests.
(A) Villous core cells and, (B) cells from the first digest washing steps known to contain extravillous trophoblasts were used as a positive control.
Tables
Table 1
Antigens included in Panel One and their functional roles with respect to the villous core.
Antigens are grouped by cell type (grey and white boxes).
| Antigen | Full name/s | Functional capacity/relevance | References |
|---|---|---|---|
| ITGβ4/CD104 | β4 integrin | Cell adhesion molecule that uniquely identifies cytotrophoblasts in the placenta. | James et al., 2015 |
| CD45 | Protein tyrosine phosphatase, receptor type, C. lymphocyte common antigen | Expressed on all nucleated haematopoietic cells. | Hermiston et al., 2003 |
| HLA-DR | Human Leukocyte Antigen – DR isotype | Expressed by antigen presenting cells i.e. macrophages, MHC class II cell surface receptor, involved in antigen presentation and adaptive immunity, | Cruz-Tapias et al., 2013 |
| CD235a/GPA | Glycophorin A | Red blood cell marker, identifies early emerging RBCs/erythroblasts from haemogenic endothelium | Garcia-Alegria et al., 2018; Mao et al., 2016 |
| CD41 | Integrin alpha-IIb | Platelet marker. Expressed by earliest emerging haematopoietic cells from haemogenic endothelium | Garcia-Alegria et al., 2018; Li et al., 2005 |
| CD117/cKIT | Mast/stem cell growth factor receptor | Receptor expressed on haematopoietic stem cells and involved in their differentiation | Rönnstrand, 2004 |
| CD144 /VE-cadherin | Vascular endothelial cadherin | Endothelial cell-cell adherens junctional marker, stabilises vessels, inhibits vascular growth, regulates vascular permeability. | Giannotta et al., 2013 |
| CD34 | Haematopoietic Progenitor Cell Antigen | Expressed by haematopoietic and vascular progenitors and adipose-derived MSCs. Transmembrane phosphoglycoprotein, thought to identify early placental progenitors | Brooks et al., 2020; Sidney et al., 2014; Yoder, 2009 |
| CD31/PECAM1 | Platelet endothelial cell adhesion molecule | Expressed by endothelial cells, platelets, macrophages and Kupffer cells, granulocytes, lymphocytes, megakaryocytes. Adhesion molecule found at endothelial intercellular junctions. | Marelli-Berg et al., 2013 |
| VEGFR2/KDR | Vascular Endothelial Growth Factor Receptor 2/Kinase Insert Domain Receptor | Expressed by endothelial cells and thought to identify placental core progenitors. Receptor for angiogenic VEGF, involved in vasculogenesis and angiogenesis. | Demir et al., 2007 |
| CD54/ICAM1 | Intercellular Adhesion Molecule 1 | Expressed at low levels on endothelial cells, monocytes and lymphocytes. Increased expression in response to inflammatory cytokines. | Hubbard and Rothlein, 2000 |
| CD36/FAT | Platelet glycoprotein 4/fatty acid translocase | Expressed by microvascular endothelial cells, and fibroblasts. Has an anti-angiogenic effect via binding Thrombospondin 1. Involved in fatty acid uptake. | Dye et al., 2001; Heinzelmann et al., 2018; Silverstein and Febbraio, 2009 |
| CD90 /Thy-1 | Thymocyte differentiation antigen 1 | Expressed by MSCs, haematopoietic stem cells, fibroblasts, myofibroblasts. | Viswanathan et al., 2019 |
| CD73 /NT5E | Ecto-5′-nucleotidase | Expressed by MSCs and endothelial cells. Works with CD39 to convert extracellular ATP to adenosine to create immunosuppressive effect. | Roh et al., 2020; Viswanathan et al., 2019 |
| CD39 /NTPDase | Ectonucleoside triphosphate diphosphohydrolase-1 | Upregulated by MSCs to suppress lymphocyte activation. Immunosuppressive actions via the conversion of extracellular ATP (inflammatory) into adenosine (anti-inflammatory) | Saldanha-Araujo et al., 2011; Zhao et al., 2017 |
| CD55/DAF | Decay-accelerating factor | Expressed by MSCs. Complement regulatory protein, inhibits C3 convertases thereby creating a threshold for complement activation, increased expression correlated with evasion of innate immune system | Ruiz-Argüelles and Llorente, 2007; Soland et al., 2013 |
| CD271 /NGFR / p75NTR | Low-affinity Nerve Growth Factor Receptor | Used in MSC and pericyte identification. Hypothesised to identify “stem-cell” or progenitor populations with superior differentiation and colony forming capacity. | Barilani et al., 2018; Kumar et al., 2017 |
| CD146/MCAM | Melanoma cell adhesion molecule | Adhesion molecule expressed by pericytes, endothelial cells and smooth muscle cells. Involved in the regulation of angiogenesis and vessel permeability. | Crisan et al., 2009; Leroyer et al., 2019 |
| CD248 | Endosialin/ tumor endothelial marker 1 | Pericyte and stromal cell marker. Involved in cell–cell adhesion, and host defence. | Lax et al., 2010; Tomkowicz et al., 2010 |
| CD142/TF | Tissue Factor/ thromboplastin | Expression correlated with pericytes, smooth muscle and fibroblasts. Activates blood clotting after injury, located outside the vasculature, | Abe et al., 1999; Morrissey, 2004 |
| CD26/DDP4 | Dipeptidyl peptidase-4, adenosine deaminase complexing protein 2 | Expressed by many tissues; T-cells, epithelial cells, ESCs, progenitor cells, placental myofibroblasts. Serine protease that cleaves a range of chemokines. Downregulation is correlated with increased stromal/myofibroblast proliferation. | Kohnen et al., 1996; Mezawa et al., 2019; Ou et al., 2013 |
| PDPN | Podoplanin | Lymphatic vascular marker. Expression is correlated with increased fibroblast migration. Binds to CLEC-2 receptor on platelets. | Astarita et al., 2012; Suchanski et al., 2017 |
Table 2
Primary conjugated antibodies used to confirm specificity of cytotrophoblast or endothelial markers.
| Antigen | Fluorophore | Clone | Dilution | Supplier |
|---|---|---|---|---|
| β4 integrin | FITC/APC | 450-9D | 1:200 | Thermofisher |
| CD144 | BV421 | 55–7 H1 | 1:200 | BD |
| CD31 | BV480 | WM59 | 1:200 | BD |
Table 3
Panel One designed to assess villous core cells on a 3 L Cytek Aurora.
| Antibody | Fluorophore | Clone | Flow cytometry Dose (μL) | Reference control | Supplier |
|---|---|---|---|---|---|
| CD55 | BB515 | IA10 | 0.6 | Villous core cells | Beckman Coulter |
| β4 integrin | FITC | 450-9D | 0.6 | Villous core cells | Thermofisher |
| CD34 | PerCP | 581 | 0.3 | Villous core cells | BD |
| CD36 | PerCpVio700 | REA760 | 0.6 | Villous core cells | Miltenyi Biotec |
| VEGFR2 | PE | 7D4-6 | 0.6 | Villous core cells | Biolegend |
| CD271 | PE-CF594 | C40-1457 | 0.6 | Stromal vascular fraction | Biolegend |
| CD142 | BB700 | HTF-1 | 1.25 | Villous core cells | BD |
| CD26 | PE/Cy5 | BA5b | 0.15 | Villous core cells | BD |
| PDPN | PE/Cy7 | NC-08 | 0.3 | Villous core cells | BD |
| CD248 | Alexa Fluor 647 | B1/35 | 0.6 | Stromal vascular fraction | BD |
| CD41 | APC | HIP8 | 0.3 | Beads | BD |
| CD90 | Alexa700 | 5E10 | 0.6 | Villous core cells | Biolegend |
| CD39 | BUV737 | TU66 | 1.25 | Beads | BD |
| ICAM1 | APC/Fire750 | HA58 | 2.5 | Stromal vascular fraction | Biolegend |
| CD144 | BV421 | 55–7 H1 | 1.25 | Villous core cells | BD |
| CD235a | Pacific Blue | H1264 | 0.3 | Villous core cells | BD |
| CD31 | BV480 | WM59 | 0.3 | Villous core cells | BD |
| CD45 | Krome-Orange | B61840 | 0.3 | Villous core cells | Beckman Coulter |
| CD146 | BV605 | PIH12 | 0.3 | Villous core cells | BD |
| CD117 | BV650 | 104D2 | 0.3 | Beads | BD |
| HLADR | BV750 | L243 | 0.3 | Villous core cells | BD |
| CD73 | BV785 | AD2 | 0.3 | Villous core cells | BD |
-
Table 3—source data 1
All antibodies used in Panel One were titrated on placental villous core digest cells.
- https://cdn.elifesciences.org/articles/76622/elife-76622-table3-data1-v2.pdf
-
Table 3—source data 2
Titration of additional antibodies, not contained in Panel One, required for the FACS sorting with Panel Two.
- https://cdn.elifesciences.org/articles/76622/elife-76622-table3-data2-v2.pdf
-
Table 3—source data 3
Representative images depicting how forward scatter (FSC) (A) or addition of cell-specific antibodies improved detection of appropriate doses for specific placental populations.
(B) β4 integrin+ cells were negative for podoplanin but demonstrated an unspecific shift in expression at higher doses. (C) Removal of β4 integrin+ improved detection of the optimal podoplanin dose.
- https://cdn.elifesciences.org/articles/76622/elife-76622-table3-data3-v2.pdf
Table 4
Composition of Panel Two.
This panel was developed to sort CD73 + CD90 + and podoplanin + CD36 + cells from placental villous core using a BD FACS Aria II.
| Antibody | Fluorophore | Clone | Dose (μL) | Supplier |
|---|---|---|---|---|
| CD45 | FITC | HI30 | 0.3 | BD |
| PDPN | PE | NC-08 | 0.3 | Biolegend |
| CD26 | PE/Cy7 | BA5b | 0.6 | BD |
| CD271 | PE/Dazzle 594 | C40-1457 | 0.6 | BD |
| CD144 | PerCP-5.5 | 55–7 H1 | 0.6 | BD |
| CD90 | Alexa700 | 5E10 | 0.6 | Biolegend |
| CD36 | APC-Cy7 | 5–271 | 0.6 | Biolegend |
| β4 integrin | APC | 450-9D | 0.6 | Thermofisher |
| CD31 | BV480 | WM59 | 0.3 | BD |
| CD73 | BV785 | AD2 | 0.3 | BD |
| CD34 | BUV395 | 581 | 1.25 | BD |
Table 5
Composition of Panel Three.
This panel was designed to assess the phenotype of placental populations after culture in vitro using a three laser Cytek Aurora.
| Antibody | Fluorophore | Clone | Dose | Supplier |
|---|---|---|---|---|
| CD34 | PerCP | 581 | 0.3 | BD |
| CD36 | PerCpVio700 | REA760 | 0.6 | Miltenyi Biotec |
| VEGFR2 | PE | 7D4-6 | 0.6 | Biolegend |
| CD271 | PE/Dazzle 594 | C40-1457 | 0.6 | Biolegend |
| CD142 | BB700 | HTF-1 | 1.25 | BD |
| CD26 | PE/Cy5 | BA5b | 0.15 | BD |
| PDPN | PE/Cy7 | NC-08 | 0.3 | BD |
| CD90 | Alexa700 | 5E10 | 0.6 | Biolegend |
| CD144 | BV421 | 55–7 H1 | 1.25 | BD |
| CD31 | BV480 | WM59 | 0.3 | BD |
| CD45 | Krome-Orange | B61840 | 0.3 | Beckman Coulter |
| CD146 | BV605 | PIH12 | 0.3 | BD |
| HLADR | BV750 | L243 | 0.3 | BD |
| CD73 | BV785 | AD2 | 0.3 | BD |
Additional files
Download links
A two-part list of links to download the article, or parts of the article, in various formats.
Downloads (link to download the article as PDF)
Open citations (links to open the citations from this article in various online reference manager services)
Cite this article (links to download the citations from this article in formats compatible with various reference manager tools)
Full spectrum flow cytometry reveals mesenchymal heterogeneity in first trimester placentae and phenotypic convergence in culture, providing insight into the origins of placental mesenchymal stromal cells
eLife 11:e76622.
https://doi.org/10.7554/eLife.76622


