SLC38A2 provides proline to fulfill unique synthetic demands arising during osteoblast differentiation and bone formation
- Department of Orthopaedic Surgery, Duke University School of Medicine, United States
- Department of Internal Medicine, University of Texas Southwestern Medical Center, United States
- Department of Biostatistics and Bioinformatics, Duke University School of Medicine, United States
- Department of Cell and Molecular Biology, St. Jude Children’s Research Hospital, United States
- Sarah W. Stedman Nutrition and Metabolism Center & Duke Molecular Physiology Institute, Duke University Medical Center, United States
- Department of Medicine, Duke University School of Medicine, United States
- Charles and Jane Pak Center for Mineral Metabolism and Clinical Research, University of Texas Southwestern Medical Center at Dallas, United States
Figures
Figure 1 with 1 supplement
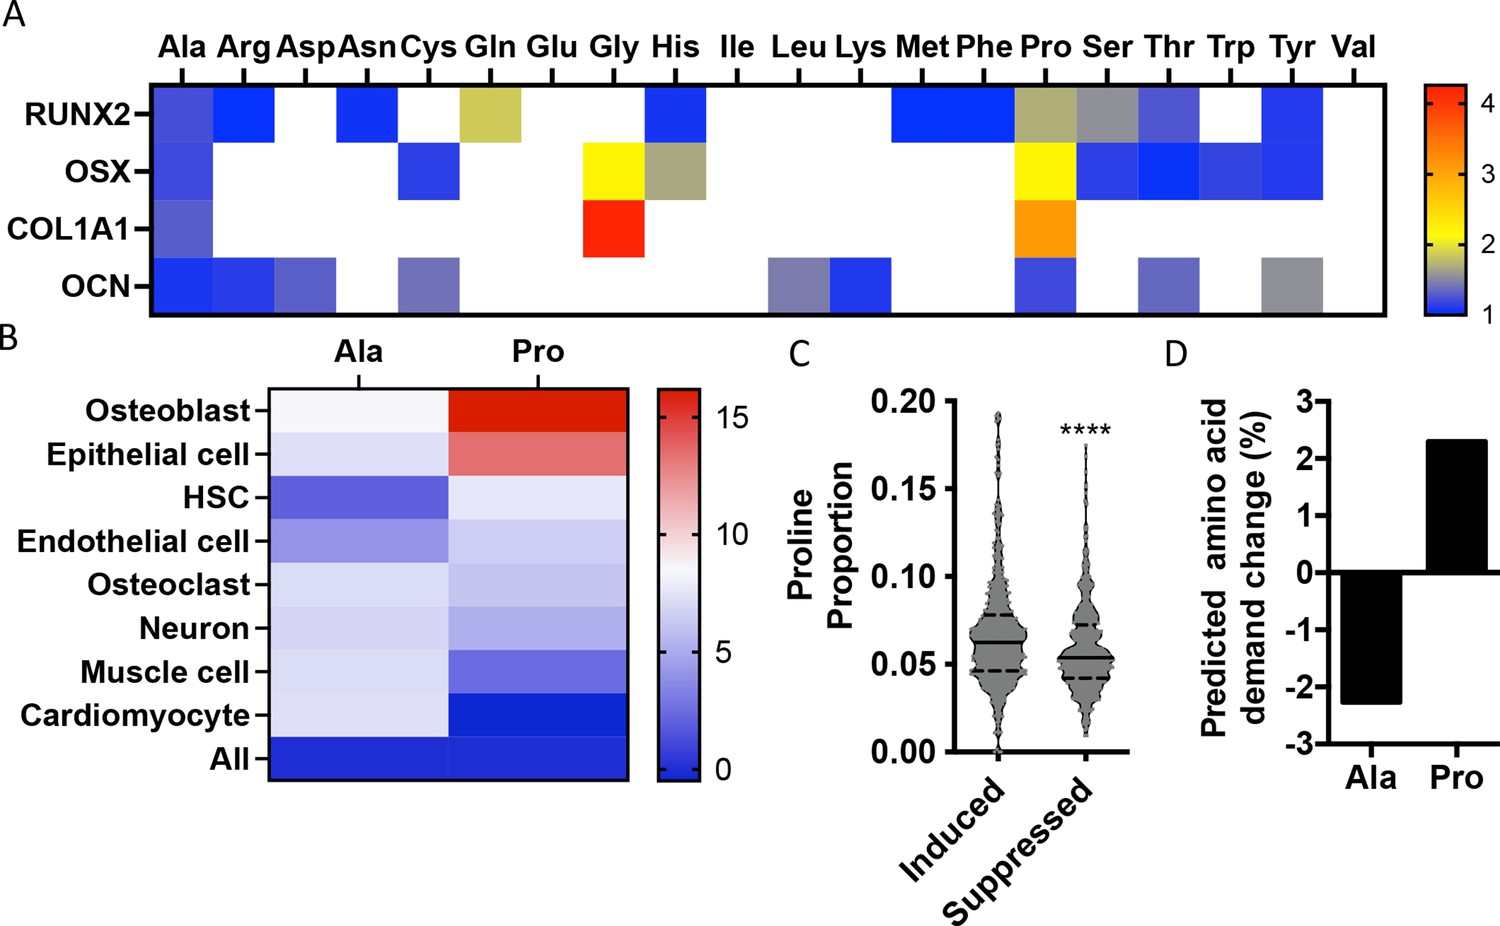
Osteoblast proteins are enriched with the amino acid proline.
(A) Heat map depicting the relative amino acid enrichment for the indicated osteoblast proteins. Color bar represents fold enrichment relative to the average amino acid content. White boxes denote below-average enrichment. (B) Heat map depicting alanine or proline enrichment in differentiation-associated proteins. Color bar represents the percent increase in abundance relative to all proteins. (C) Volcano plot depicting the proline proportion of the top 500 genes that are induced or suppressed during osteoblast differentiation. Dashed lines denote quartiles while the solid line denotes the median. ****p≤0.00005 by unpaired two-tailed Student’s t-test. (D) Graphical depiction of the predicted change in demand for alanine or proline based on changes in gene expression during osteoblast differentiation. See numerical source data and RNAseq source data in Figure 1—source data 1.
-
Figure 1—source data 1
Numerical source data for Figure 1.
- https://cdn.elifesciences.org/articles/76963/elife-76963-fig1-data1-v3.zip
Figure 1—figure supplement 1
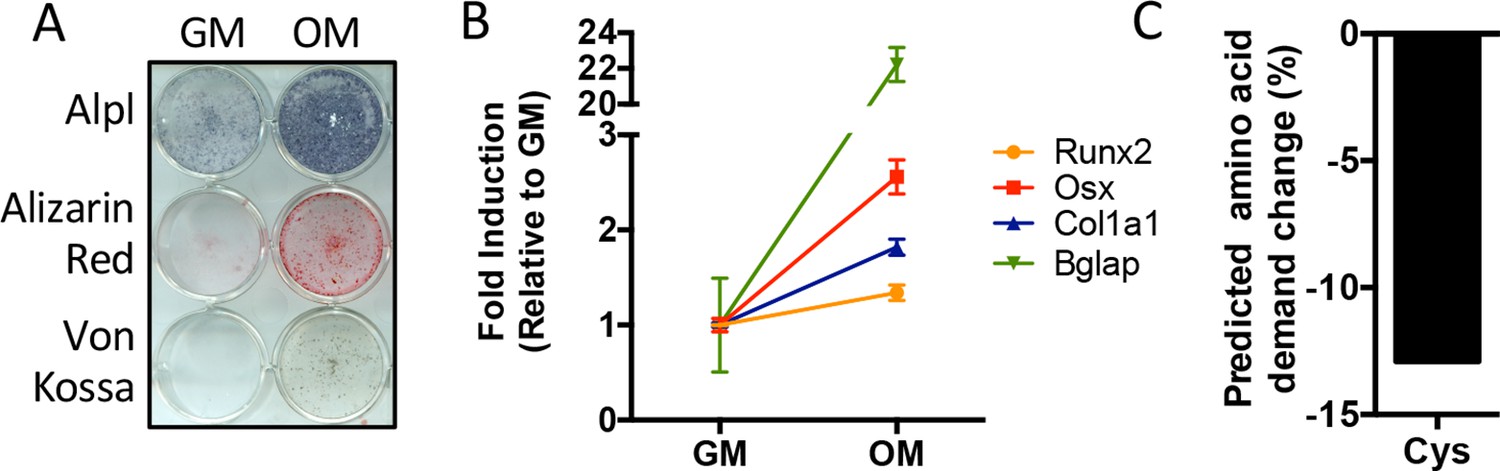
Predicted amino acid demand changes during osteoblast differentiation.
(A) Functional assays of calvarial cells cultured in growth media (GM) or osteogenic medium (OM) for 10 days (n = 3). (B) qRT-PCR analysis of osteogenic marker genes Runx2, Sp7 (OSX), Col1a1, and Bglap in calvarial cells cultured in GM or OM for 7 days (n = 3). Error bars depict SD. (C) Graphical depiction of the predicted change in demand for cysteine based on changes in gene expression during osteoblast differentiation. See numerical source data in Figure 1—figure supplement 1—source data 1.
-
Figure 1—figure supplement 1—source data 1
Numerical source data for Figure 1—figure supplement 1.
- https://cdn.elifesciences.org/articles/76963/elife-76963-fig1-figsupp1-data1-v3.zip
Figure 2 with 1 supplement
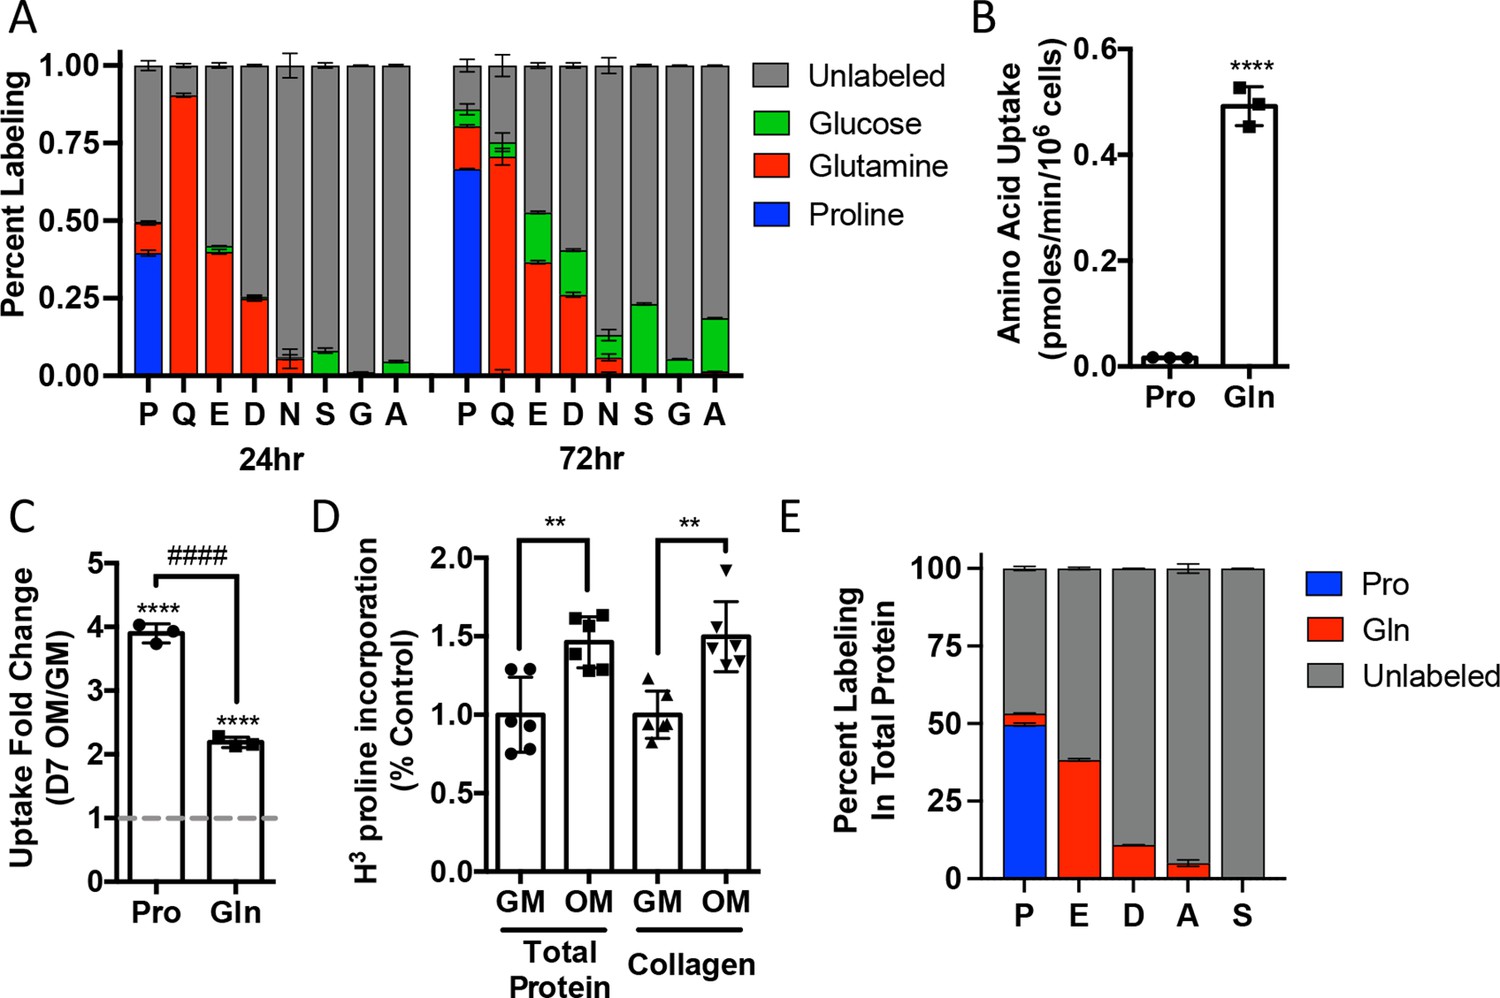
Proline uptake and incorporation into protein increases during osteoblast differentiation.
(A) Graphical depiction of proline, glutamine, glutamate, aspartate, asparagine, serine, glycine, and alanine labeling from [U-13C]-proline (n = 3), [U-13C]-glutamine (n = 3), or [1,2-13C]-glucose (n = 3) in naïve calvarial osteoblasts. (B, C) Radiolabeled 3H-proline uptake assay performed in naive bone marrow stromal cells (BMSC) (n = 3) (B) or after 7 days of osteoblast differentiation (n = 3) (C). ****p≤0.00005 for osteogenic media (OM) vs. growth media (GM, denoted by dashed line), ####p≤0.00005 comparison between change in proline and glutamine by unpaired two-tailed Student’s t-test. (D) Radiolabeled proline incorporation assay performed in primary calvarial cells cultured in GM or OM for 7 days (n = 6). **p≤0.005 by unpaired two-tailed Student’s t-test. (E) Contribution of [U-13C]-proline or [U-13C]-glutamine to proline, glutamate, aspartate, alanine, or serine isolated from total protein (n = 3). See numerical source data and isotopomer-tracing source data in Figure 2—source data 1.
-
Figure 2—source data 1
Numerical source data for Figure 2.
- https://cdn.elifesciences.org/articles/76963/elife-76963-fig2-data1-v3.zip
Figure 2—figure supplement 1
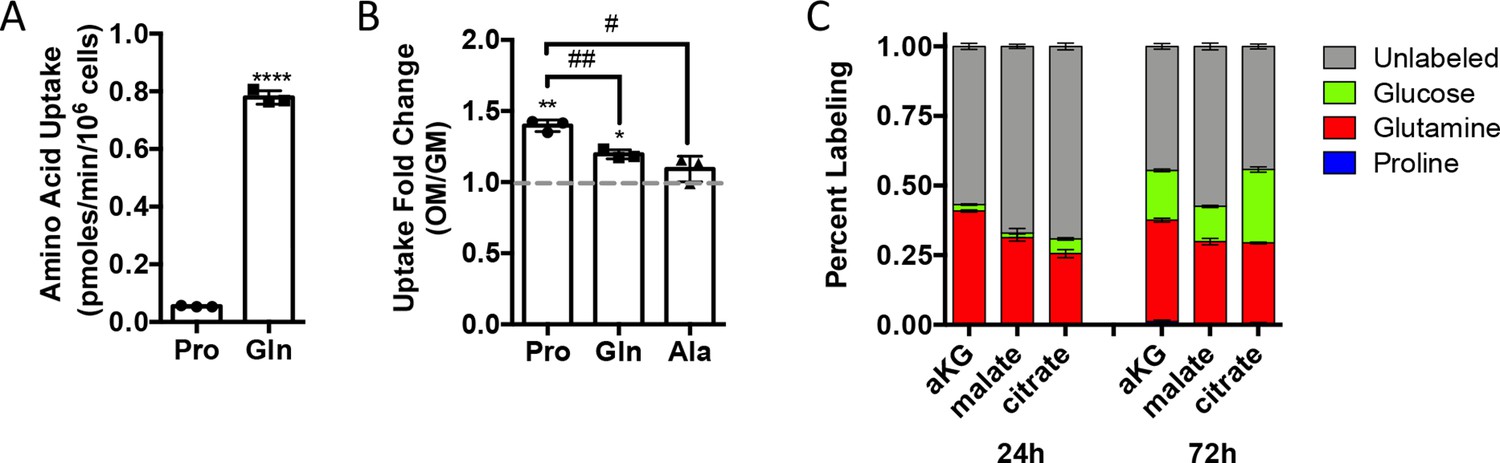
Proline uptake increases during osteoblast differentiation and does not contribute to TCA cycle intermediates.
(A, B) Radiolabeled proline or glutamine uptake assay performed in naïve calvarial osteoblasts (n = 3) (A) or after 7 days of osteoblast differentiation (n = 3) (B). Error bars depict SD. *p≤0.05, **p≤0.005 for growth media (GM) vs. osteogenic media (OM), ****p≤0.00005. #p≤0.05, ##p≤0.005 for proline vs. glutamine or alanine uptake, respectively, by unpaired two-tailed Student’s t-test. (C) Graphical depiction of aKG, malate, and citrate labeling from [U-13C]-proline (n = 3), [U-13C]-glutamine (n = 3), or [1,2-13C]-glucose (n = 3) after either 24 or 72 hr in naïve calvarial osteoblasts. See numerical source data in Figure 2—figure supplement 1—source data 1.
-
Figure 2—figure supplement 1—source data 1
Numerical source data for Figure 2—figure supplement 1.
- https://cdn.elifesciences.org/articles/76963/elife-76963-fig2-figsupp1-data1-v3.zip
Figure 3 with 1 supplement
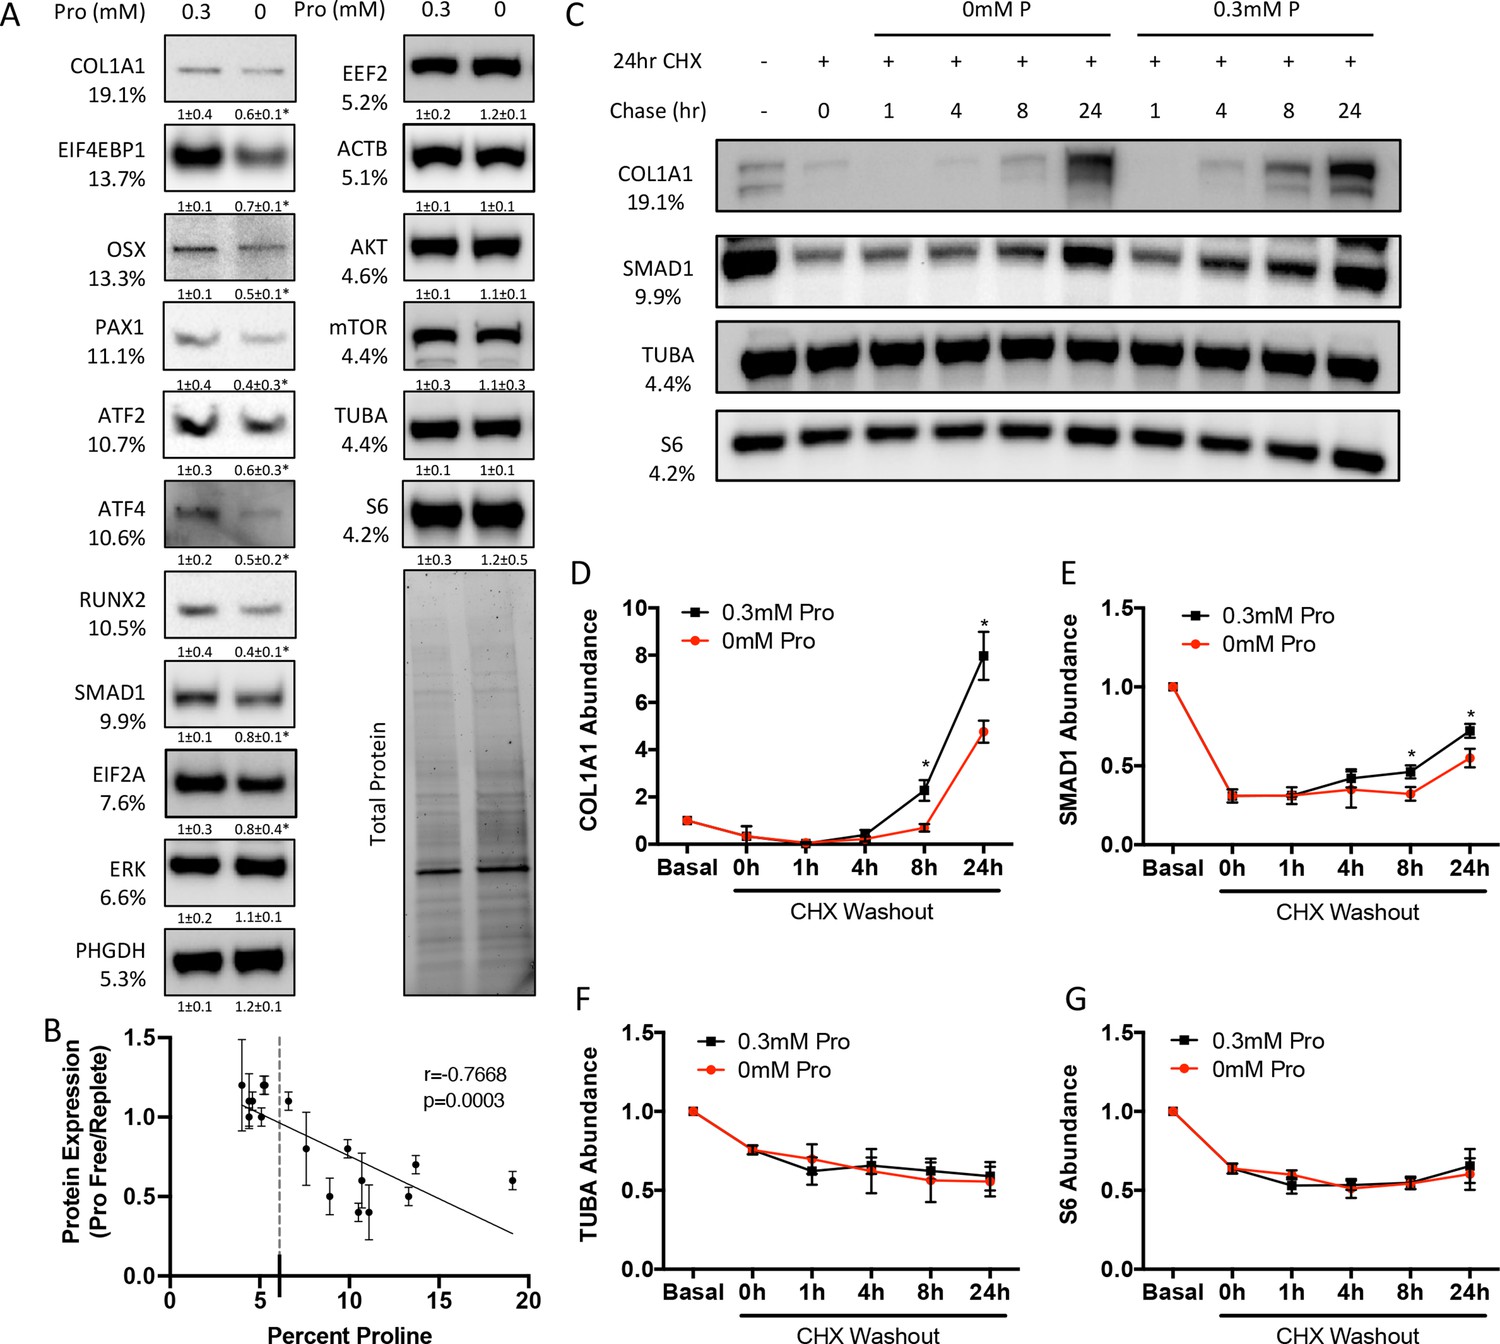
Proline is essential for the synthesis of proline-enriched osteoblast proteins.
(A) Western blot analyses of naïve calvarial cells cultured in 0.3 mM or 0 mM proline for 48 hr (n = 3). In all blots, the percent proline composition is noted under the protein name. Protein expression normalized to total protein. Fold change ± SD for three independent experiments. (B) Correlation analysis of protein expression as a function of the proline composition of proteins in naïve calvarial cells cultured in media containing either 0 mM or 0.3 mM proline for 48 hr. (C–G) The effect of proline availability on the synthesis of select proteins (n = 3). CHX, cycloheximide. Error bars depict SD. *p≤0.05 by unpaired two-tailed Student’s t-test. See numerical source data and uncropped Western blot images in Figure 3—source data 1.
-
Figure 3—source data 1
Numerical and uncropped western blot source data for Figure 3.
- https://cdn.elifesciences.org/articles/76963/elife-76963-fig3-data1-v3.zip
Figure 3—figure supplement 1

Proline is essential for the synthesis of proline-enriched osteoblast proteins.
(A) Effect of 48 hr proline withdrawal on tRNA aminoacylation (n = 3). (B) Western blot analysis of naïve calvarial cells cultured in 0.3 mM or 0 mM proline for 48 hr (n = 3). Phosphorylated EIF2A normalized to total EIF2A while phosphorylated S6RP normalized to total S6RP. Individual proteins normalized to total protein. Fold change ± SD for three independent experiments. (C) qRT-PCR analysis of the effect of 48 hr proline withdrawal on gene expression in calvarial cells (n = 3). (D–F) The effect of proline availability on the synthesis of select proteins. CHX, cycloheximide. Fold change ± SD for three independent experiments. Error bars depict SD. *p≤0.05 by unpaired two-tailed Student’s t-test. See numerical source data and uncropped Western blot images in Figure 3—figure supplement 1—source data 1.
-
Figure 3—figure supplement 1—source data 1
Numerical and uncropped western blot source data for Figure 3—figure supplement 1.
- https://cdn.elifesciences.org/articles/76963/elife-76963-fig3-figsupp1-data1-v3.zip
Figure 4 with 1 supplement
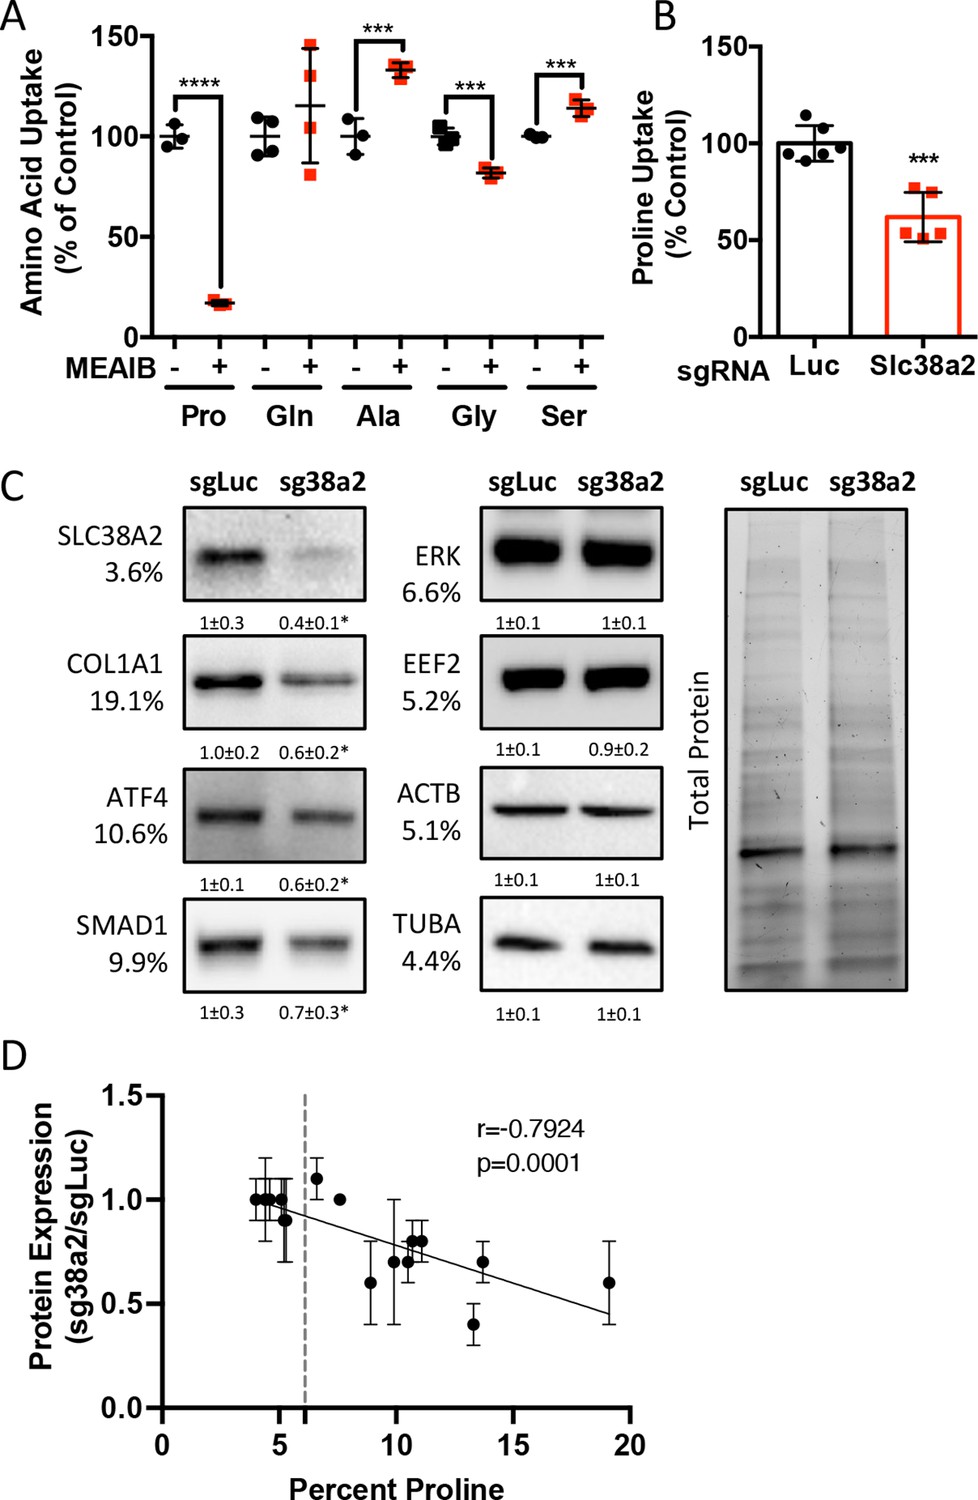
Slc38a2 provides proline critical for the synthesis of proline-rich proteins.
(A) Graphical depiction of the effects of 5 mM 2-(methylamino)-isobutyric acid (MeAIB) on radiolabeled amino acid uptake in primary calvarial cells (n = 3; except for glutamine n = 4). (B, C) Effect of Slc38a2 targeting on 3H-proline uptake (sgLuc n = 6; sgSlc38a2 n = 5) (B), or protein expression (n = 3) (C). In all blots, the percent proline composition is noted under the protein name. Protein expression normalized to total protein. Fold change ± SD for three independent experiments. (D) Correlation analysis of protein expression as a function of the proline composition of proteins in Slc38a2 (sg38a2) targeted or control (sgLuc) calvarial cells. *p≤0.05, ***p≤0.0005, ****p≤0.00005 by unpaired two-tailed Student’s t-test. See numerical source data and uncropped Western blot images in Figure 4—source data 1.
-
Figure 4—source data 1
Numerical and uncropped western blot source data for Figure 4.
- https://cdn.elifesciences.org/articles/76963/elife-76963-fig4-data1-v3.zip
Figure 4—figure supplement 1
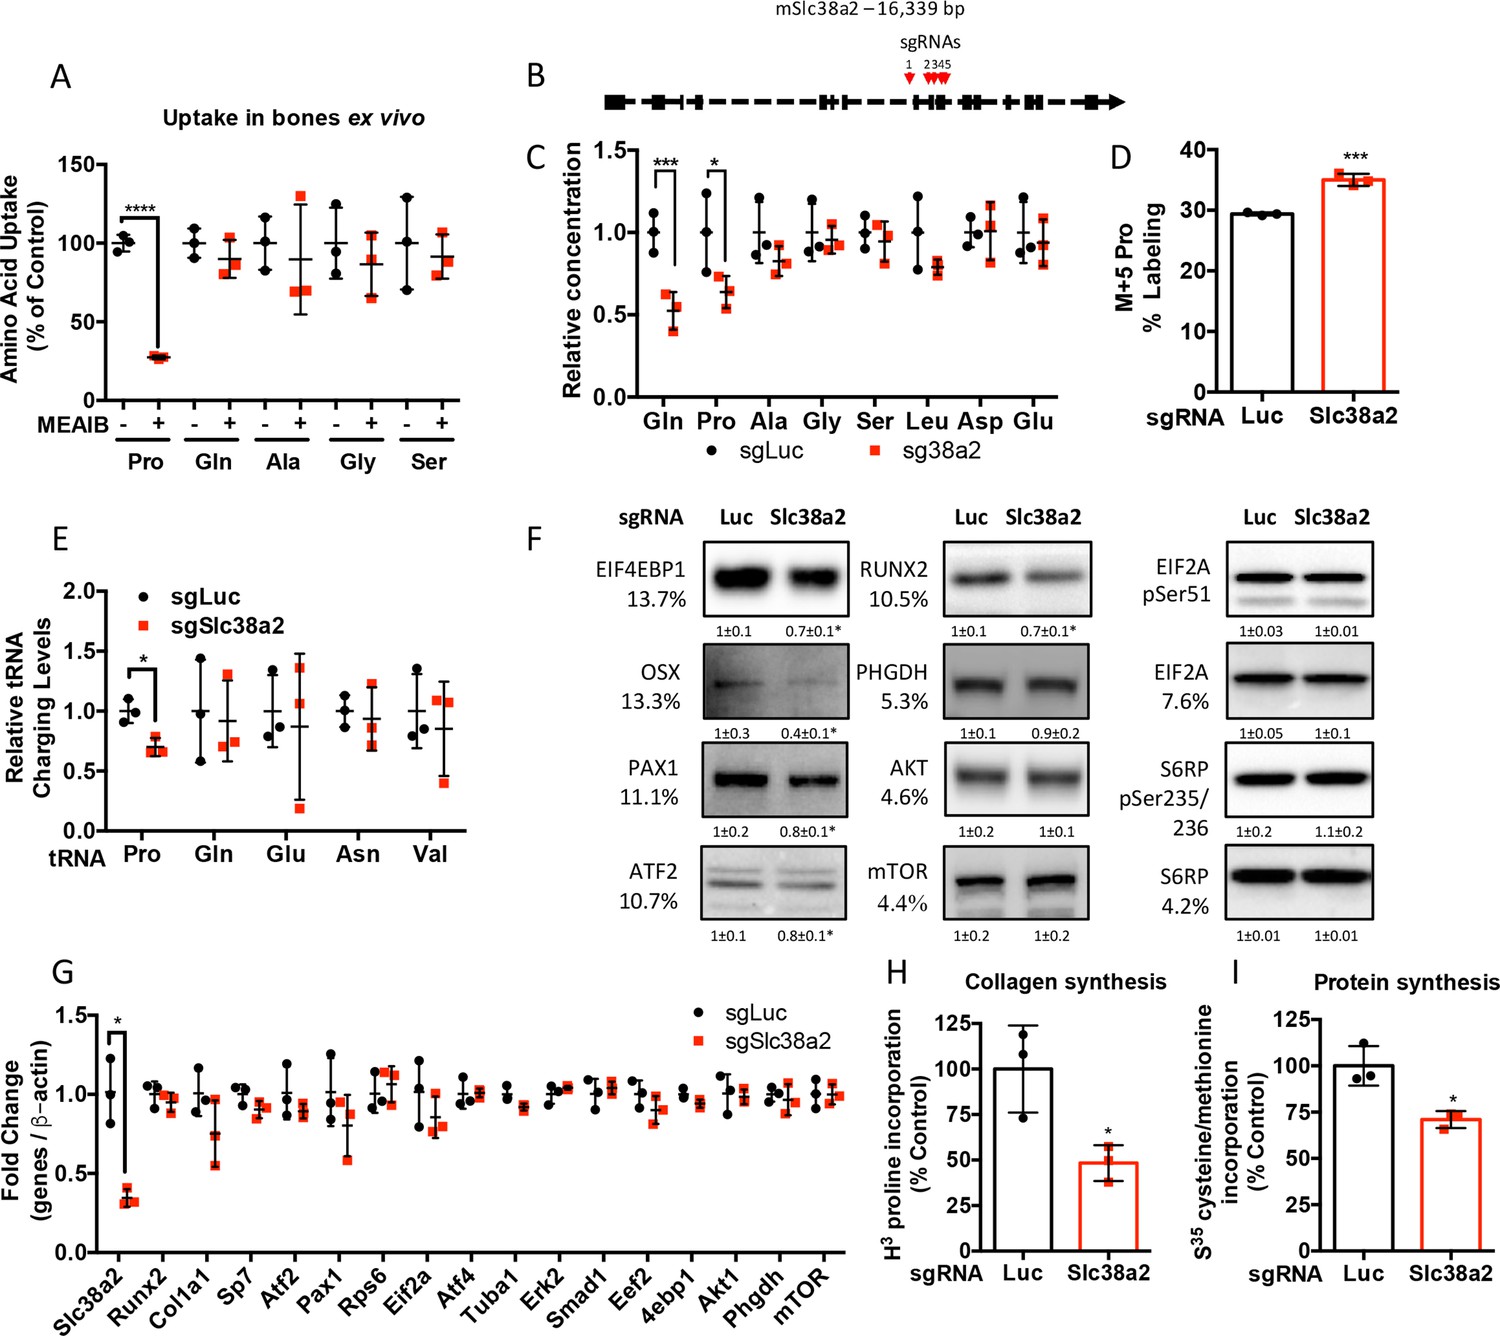
Slc38a2 provides proline critical for the synthesis of proline-rich proteins.
(A) Graphical depiction of the effects of 5 mM 2-(methylamino)-isobutyric acid (MeAIB) on amino acid uptake in bones isolated from P3 mice (n = 3). (B) Schematic depicting Slc38a2 Crispr targeting strategy. (C–I) Effect of Slc38a2 targeting on intracellular amino acid concentration measured by mass spectrometry (n = 3) (C), contribution of [U-13C]-glutamine to proline (n = 3) (D), tRNA aminoacylation (n = 3) (E), protein expression (n = 3) (F), mRNA expression (n = 3) (G), protein (n = 3) (H), or collagen synthesis (n = 3) (I). In all blots, the percent proline composition is noted under the protein name. Protein expression normalized to total protein. Phosphorylated proteins are normalized to the total protein. Fold change ± SD for three independent experiments. *p≤0.05, ****p≤0.00005 by unpaired two-tailed Student’s t-test. See numerical source data and uncropped Western blot images in Figure 4—figure supplement 1—source data 1.
-
Figure 4—figure supplement 1—source data 1
Numerical and uncropped western blot source data for Figure 4—figure supplement 1.
- https://cdn.elifesciences.org/articles/76963/elife-76963-fig4-figsupp1-data1-v3.zip
Figure 5 with 3 supplements
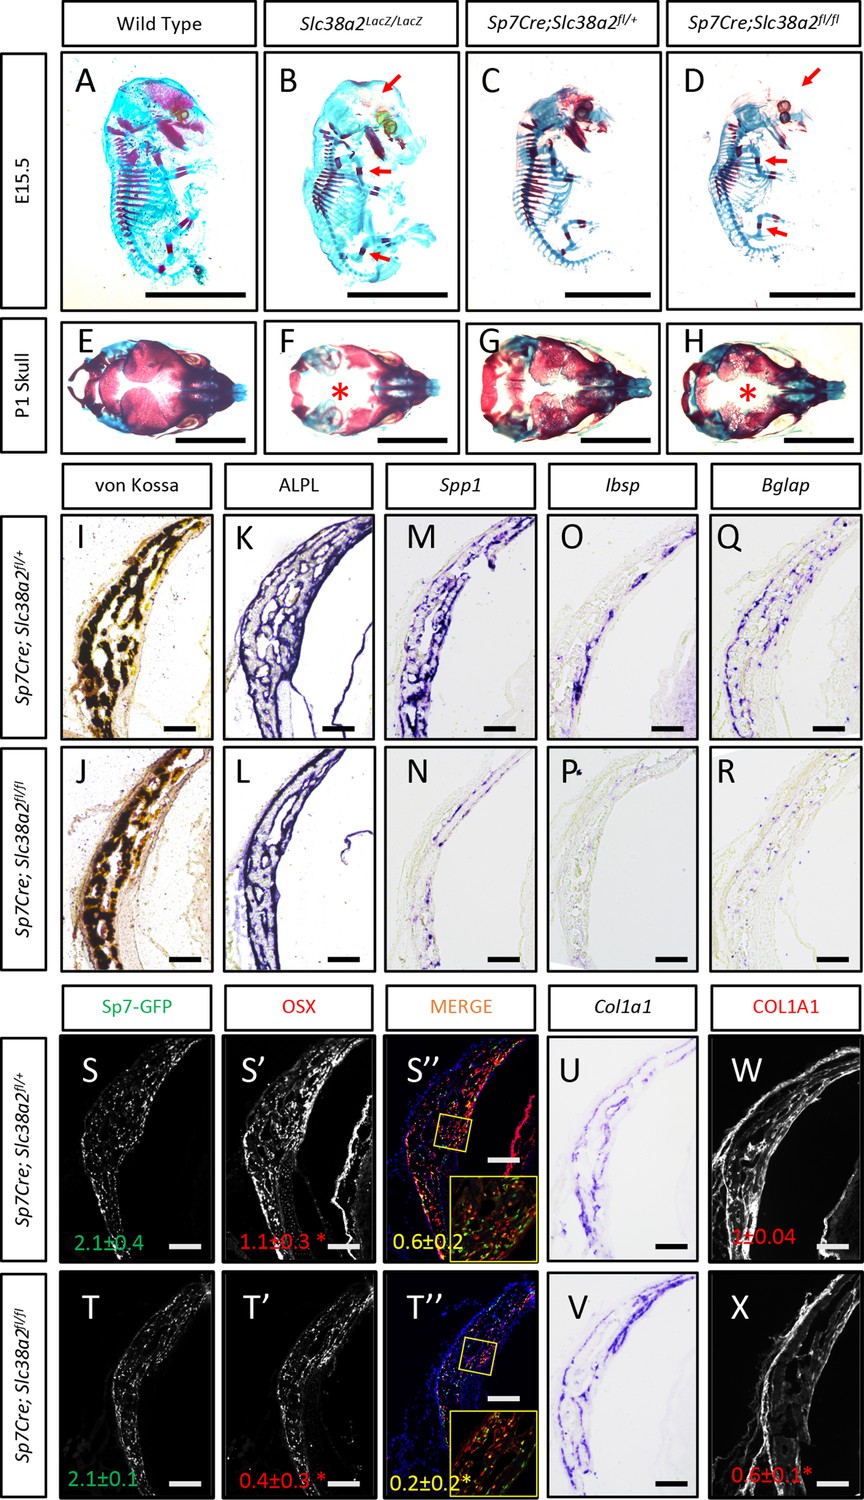
Slc38a2-dependent proline uptake is required for osteoblast differentiation during bone development.
(A–H) Skeletal preparations of Slc38a2LacZ/LacZ or wildtype controls (A, B, E, F) or Sp7Cre;Slc38a2fl/fl or Sp7Cre;Slc38a2fl/+ littermate controls (C, D, G, H) at embryonic day (E)15.5 (A–D) or P1 (E–H). Red arrow (A–D) or asterix (E–H) highlights reduced mineralization. A total of n = 7 or n = 5 Slc38a2LacZ/LacZ animals and n = 5 or n = 5 for Sp7Cre;Slc38a2fl/fl animals were analyzed at E15.5 or postnatal day (P)1, respectively. Scale bar = 5 mm. (I–R) Representative von Kossa staining (I, J), alkaline phosphatase (ALPL) staining (K, L) in situ hybridization for Spp1 (M, N), Ibsp (O, P), Bglap (Q, R), and Col1a1 (U, V), or immunofluorescent staining for OSX (S’, S”, T’, T”) and COL1A1 (W, X) on Sp7Cre;Slc38a2fl/fl (n = 4) (J, L, N, P, R, T, V, X) or Sp7Cre;Slc38a2fl/+ (n = 4) (I, K, M, O, Q, S, U, W) newborn calvariae. *p≤0.05 by paired two-tailed Student’s t-test. Scale bar = 100 μm.
Figure 5—figure supplement 1
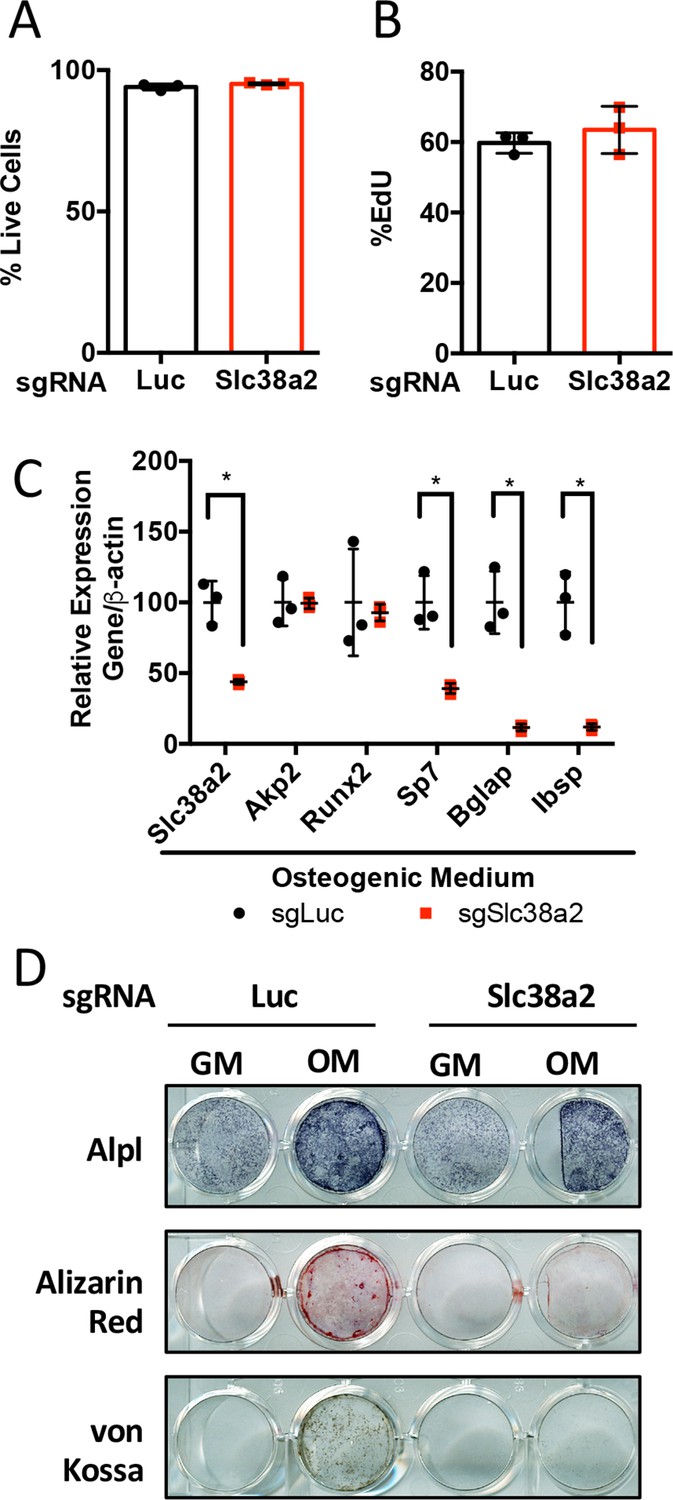
Slc38a2 is required for osteoblast differentiation in vitro.
(A–D) Effect of Slc38a2 targeting on cell viability (n = 3) (A), EdU incorporation (n = 3) (B), mRNA expression (n = 3) by qPCR analysis (C), or functional assays (D) in calvarial cells cultured in growth media (GM) or osteogenic medium (OM) for seven or 10 days (n = 3). Error bars depict SD.
*p≤0.05 by unpaired two-tailed Student’s t-test. See numerical source data in Figure 5—figure supplement 1—source data 1.
-
Figure 5—figure supplement 1—source data 1
Numerical source data for Figure 5—figure supplement 1.
- https://cdn.elifesciences.org/articles/76963/elife-76963-fig5-figsupp1-data1-v3.zip
Figure 5—figure supplement 2
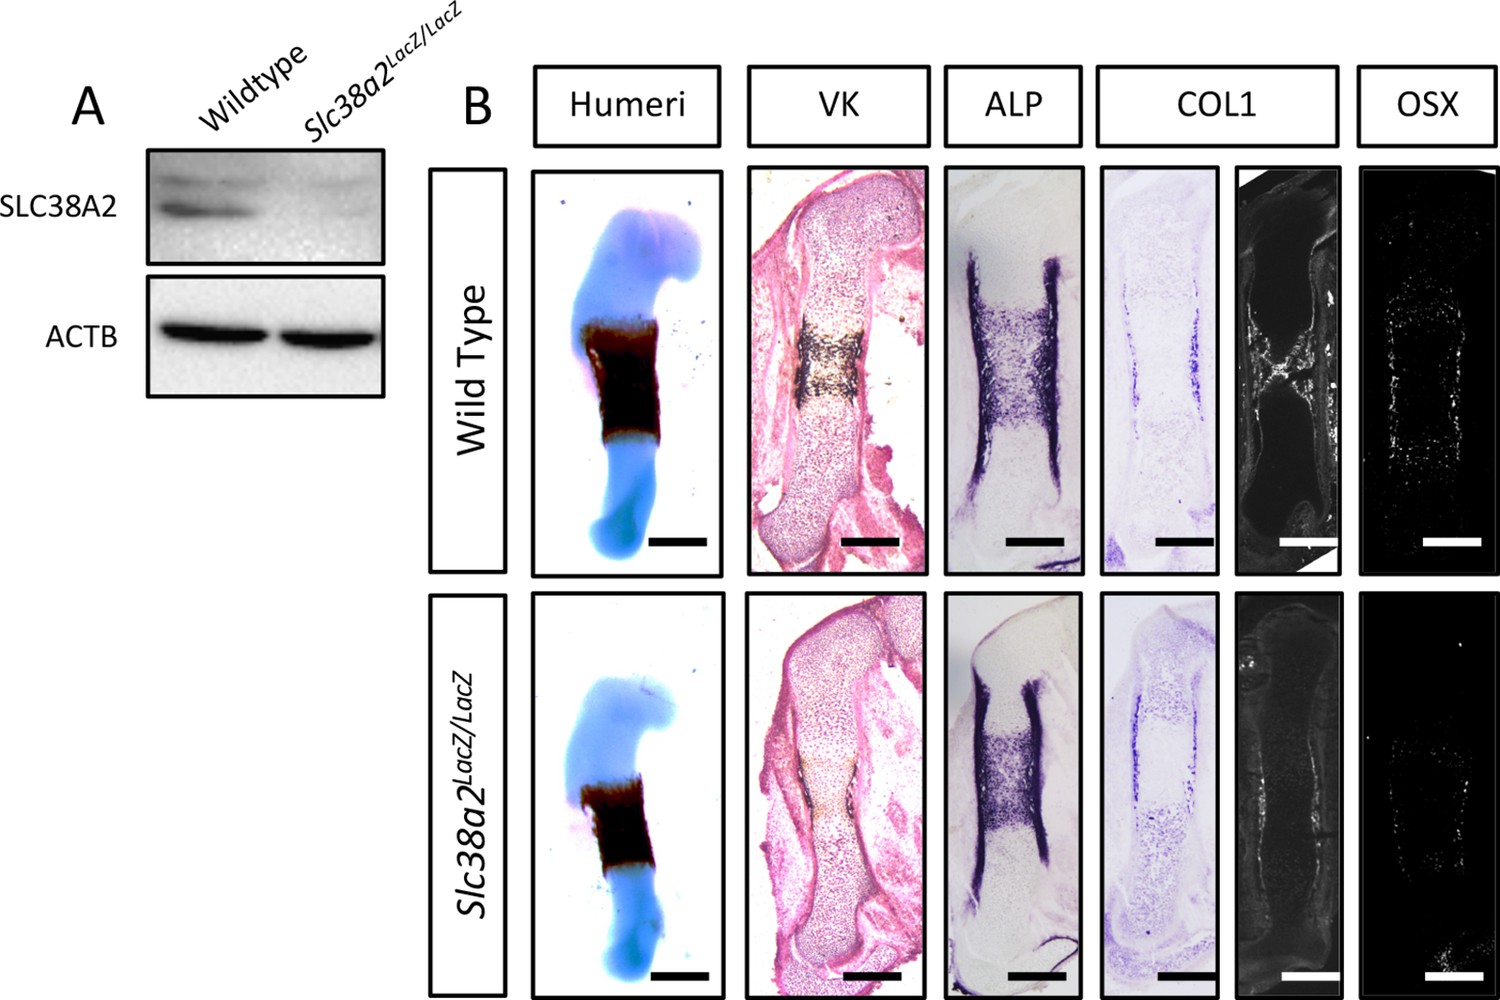
Slc38a2LacZ/LacZ mutants have impaired osteoblast differentiation during endochondral ossification.
(A) Western blot analysis of SNAT2 expression in femur bone shaft protein isolated from Slc38a2LacZ/LacZ or wildtype controls. (B) Representative images of humerus skeletal preparations, von Kossa staining, alkaline phosphatase (ALPL) staining, in situ hybridization for Col1a1, or immunofluorescence staining for OSX and COL1A1 on femur sections of embryonic day (E)15.5 Slc38a2LacZ/LacZ or wildtype controls littermate controls (n = 3 animals). Scale bar = 200 μm. See uncropped Western blot images in Figure 5—figure supplement 2—source data 1.
-
Figure 5—figure supplement 2—source data 1
Uncropped western blot source data for Figure 5—figure supplement 2.
- https://cdn.elifesciences.org/articles/76963/elife-76963-fig5-figsupp2-data1-v3.zip
Figure 5—figure supplement 3
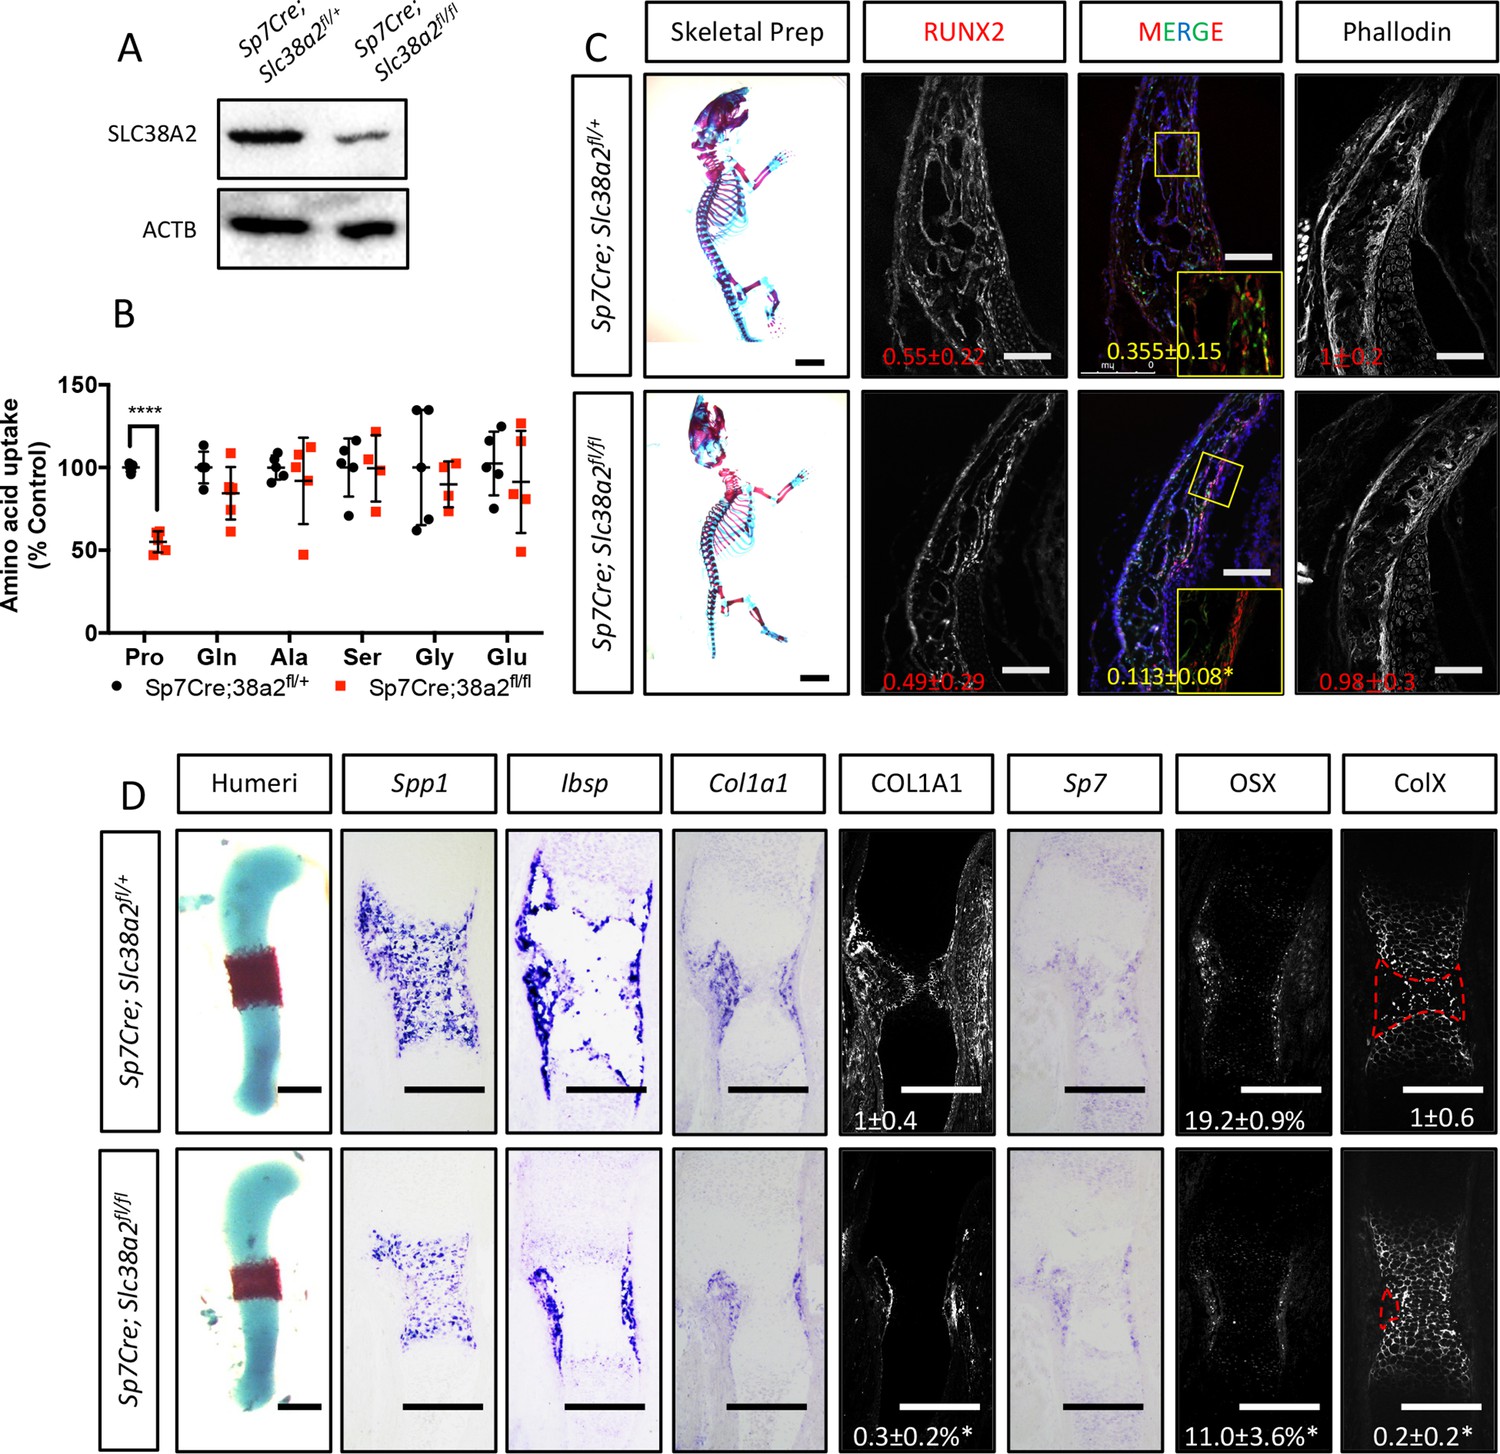
Sp7Cre;Slc38a2fl/fl have impaired osteoblast differentiation during endochondral ossification.
(A) Western blot analysis of SNAT2 expression in femur bone shaft protein isolated from Sp7Cre;Slc38a2fl/fl or Sp7Cre;Slc38a2fl/+ littermate controls (n = 3). (B) Evaluation of amino acid uptake in femurs isolated from newborn Sp7Cre;Slc38a2fl/fl or Sp7Cre;Slc38a2fl/+ littermate controls (n = 5). (C) Skeletal preparations of newborn Sp7Cre;Slc38a2fl/fl or Sp7Cre;Slc38a2fl/+ littermate controls (n = 5). Scale bar in skeletal prep = 5 mm. Phalloidin staining or immunofluorescence staining for RUNX2 on postnatal day (P)0 Sp7Cre;Slc38a2fl/fl or Sp7Cre;Slc38a2fl/+ calvariae (n = 4). Scale bar = 100 μm. Boxed region shown in inset image. (D) Representative images of in situ hybridization for Spp1, Ibsp, Col1a1, and Sp7, or immunofluorescence staining for OSX, COL1A1, and COLX on humerus sections from embryonic day (E)15.5 Sp7Cre;Slc38a2fl/fl or Sp7Cre;Slc38a2fl/+ littermate controls (n = 4 animals). Red dashed line denotes the remodeling area. Fold change ± SD. Error bar depicts SD. *p≤0.05, ****p≤0.00005 by paired two-tailed Student’s t-test. Scale bar = 200 μm. See numerical source data and uncropped Western blot images in Figure 5—figure supplement 3—source data 1.
-
Figure 5—figure supplement 3—source data 1
Numerical and uncropped western blot source data for Figure 5—figure supplement 3.
- https://cdn.elifesciences.org/articles/76963/elife-76963-fig5-figsupp3-data1-v3.zip
Tables
Table 1
Amino acid composition of classical osteoblast proteins.
| RUNX2 | OSX | COL1A1 | OCN | All proteins | ||
|---|---|---|---|---|---|---|
| Ala | 0.084 | 0.082 | 0.089 | 0.074 | 0.068 | |
| Cys | 0.012 | 0.026 | 0.012 | 0.032 | 0.023 | |
| Asp | 0.044 | 0.033 | 0.041 | 0.063 | 0.048 | |
| Glu | 0.021 | 0.044 | 0.052 | 0.063 | 0.069 | |
| Phe | 0.038 | 0.023 | 0.018 | 0.021 | 0.038 | |
| Gly | 0.053 | 0.138 | 0.268 | 0.053 | 0.063 | |
| His | 0.028 | 0.044 | 0.006 | 0.000 | 0.026 | |
| Ile | 0.021 | 0.012 | 0.017 | 0.042 | 0.045 | |
| Lys | 0.031 | 0.051 | 0.038 | 0.063 | 0.057 | |
| Leu | 0.059 | 0.084 | 0.035 | 0.147 | 0.100 | |
| Met | 0.023 | 0.012 | 0.010 | 0.021 | 0.023 | |
| Asn | 0.038 | 0.026 | 0.023 | 0.032 | 0.036 | |
| Pro | 0.105 | 0.133 | 0.190 | 0.074 | 0.061 | |
| Gln | 0.089 | 0.033 | 0.033 | 0.032 | 0.048 | |
| Arg | 0.056 | 0.040 | 0.047 | 0.063 | 0.056 | |
| Ser | 0.133 | 0.098 | 0.046 | 0.074 | 0.085 | |
| Thr | 0.069 | 0.056 | 0.030 | 0.074 | 0.054 | |
| Val | 0.054 | 0.021 | 0.029 | 0.032 | 0.061 | |
| Trp | 0.010 | 0.014 | 0.004 | 0.000 | 0.012 | |
| Tyr | 0.030 | 0.030 | 0.010 | 0.042 | 0.027 | |
Table 2
Relative amino acid composition of proteins associated with various differentiated cell types based on Gene Ontology (GO) terms.
| Osteoblast | Epithelial cell | Hematopoietic stem cell | Endothelial cell | Osteoclast | Neuron | Muscle cell | Cardiomyocyte | All | |
|---|---|---|---|---|---|---|---|---|---|
| GO term | 00001649 | 0030855 | 0030097 | 0045446 | 0030316 | 0030182 | 0042692 | 0055007 | |
| Ala | 0.0739 | 0.0731 | 0.0695 | 0.0709 | 0.0730 | 0.0728 | 0.0730 | 0.0731 | 0.0681 |
| Cys | 0.0301 | 0.0230 | 0.0234 | 0.0259 | 0.0292 | 0.0228 | 0.0233 | 0.0223 | 0.0227 |
| Asp | 0.0478 | 0.0483 | 0.0493 | 0.0467 | 0.0468 | 0.0502 | 0.0511 | 0.0490 | 0.0479 |
| Glu | 0.0639 | 0.0678 | 0.0671 | 0.0682 | 0.0614 | 0.0693 | 0.0727 | 0.0690 | 0.0694 |
| Phe | 0.0331 | 0.0331 | 0.0365 | 0.0342 | 0.0374 | 0.0347 | 0.0367 | 0.0373 | 0.0375 |
| Gly | 0.0686 | 0.0698 | 0.0672 | 0.0685 | 0.0656 | 0.0667 | 0.0666 | 0.0667 | 0.0629 |
| His | 0.0273 | 0.0256 | 0.0266 | 0.0239 | 0.0245 | 0.0254 | 0.0249 | 0.0256 | 0.0262 |
| Ile | 0.0362 | 0.0401 | 0.0409 | 0.0458 | 0.0407 | 0.0420 | 0.0429 | 0.0441 | 0.0445 |
| Lys | 0.0531 | 0.0557 | 0.0570 | 0.0531 | 0.0499 | 0.0560 | 0.0606 | 0.0627 | 0.0571 |
| Leu | 0.0946 | 0.0923 | 0.0957 | 0.0950 | 0.1040 | 0.0961 | 0.0930 | 0.0903 | 0.1004 |
| Met | 0.0220 | 0.0232 | 0.0229 | 0.0224 | 0.0210 | 0.0222 | 0.0222 | 0.0238 | 0.0228 |
| Asn | 0.0360 | 0.0361 | 0.0362 | 0.0382 | 0.0366 | 0.0374 | 0.0369 | 0.0363 | 0.0360 |
| Pro | 0.0711 | 0.0694 | 0.0659 | 0.0652 | 0.0650 | 0.0644 | 0.0627 | 0.0609 | 0.0612 |
| Gln | 0.0469 | 0.0472 | 0.0468 | 0.0458 | 0.0446 | 0.0459 | 0.0464 | 0.0482 | 0.0478 |
| Arg | 0.0607 | 0.0573 | 0.0563 | 0.0566 | 0.0539 | 0.0575 | 0.0561 | 0.0547 | 0.0559 |
| Ser | 0.0853 | 0.0874 | 0.0848 | 0.0807 | 0.0843 | 0.0835 | 0.0797 | 0.0848 | 0.0853 |
| Thr | 0.0527 | 0.0529 | 0.0537 | 0.0557 | 0.0563 | 0.0538 | 0.0528 | 0.0544 | 0.0543 |
| Val | 0.0568 | 0.0588 | 0.0599 | 0.0639 | 0.0623 | 0.0598 | 0.0599 | 0.0585 | 0.0610 |
| Trp | 0.0119 | 0.0110 | 0.0122 | 0.0119 | 0.0135 | 0.0117 | 0.0108 | 0.0105 | 0.0119 |
| Tyr | 0.0278 | 0.0279 | 0.0280 | 0.0275 | 0.0298 | 0.0279 | 0.0275 | 0.0278 | 0.0270 |
Table 3
mRNA expression of putative proline transporters.
| System | Alias | cOB | |
|---|---|---|---|
| FPKM | |||
| Slc38a2 | A | SNAT2 | 8823.1 |
| Slc1a4 | ASC | ASCT1 | 3030.7 |
| Slc36a4 | LYAAT | PAT4 | 1929 |
| Slc36a1 | LYAAT | PAT1 | 803.7 |
| Slc38a4 | A | SNAT4 | 267.9 |
| Slc36a2 | LYAAT | PAT2 | 1.1 |
| Slc6a15 | B0 | B0AT2 | 7.5 |
| Slc36a3 | LYAAT | PAT3 | 0 |
| Slc6a7 | IMINOB | PROT | 4.3 |
| Slc6a20a | IMINO | SIT2 | 0 |
| Slc6a20b | IMINO | SIT1 | 0 |
| Slc6a19 | B0 | B0AT1 | 0 |
Key resources table
| Reagent type (species) or resource | Designation | Source or reference | Identifiers | Additional information |
|---|---|---|---|---|
| Genetic reagent (Mus musculus) | C57Bl/6J | Jackson Laboratory | RRID:IMSR_JAX:000664 | |
| Genetic reagent (M. musculus) | Rosa26Cas9 | Jackson Laboratory | RRID:IMSR_JAX:024858 | |
| Genetic reagent (M. musculus) | Rosa26Flpe | Jackson Laboratory | RRID:IMSR_JAX:003946 | |
| Genetic reagent (M. musculus) | Sp7tTA;tetOeGFP/Cre | PMID:16854976 | RRID:IMSR_JAX:006361 | |
| Genetic reagent (M. musculus) | Slc38a2LacZ | European Mouse Mutant Archive | See ‘Mouse strains’ for more information | |
| Chemical compound, drug | Ascorbic acid | Sigma | Cat# A4544 | |
| Chemical compound, drug | β-Glycerophosphate | Sigma | Cat# G9422 | |
| Chemical compound, drug | One-step NBT/BCIP solution | Thermo Fisher | Cat# PI34042 | |
| Chemical compound, drug | EasyTag EXPRESS S35 | PerkinElmer | Cat# NEG772002MC | |
| Chemical compound, drug | L-(3,4-3H)-Glutamine | PerkinElmer | Cat# NET551250UC | |
| Chemical compound, drug | L-[1,2-14C]-Alanine | PerkinElmer | Cat# NEC266E050UC | |
| Chemical compound, drug | L-(2,3-3H)-Alanine | PerkinElmer | Cat# NET348250UC | |
| Chemical compound, drug | L-(2,3,4-3H)-Proline | PerkinElmer | Cat# NET323250UC | |
| Chemical compound, drug | L-[3H(G)]-Serine | PerkinElmer | Cat# NET248250UC | |
| Chemical compound, drug | L-[14C(U)]-Glycine | PerkinElmer | Cat# NEC276E050UC | |
| Chemical compound, drug | L-[3,4-3H]-Glutamate | PerkinElmer | Cat# NET490001MC | |
| Chemical compound, drug | Ultima Gold scintillation cocktail | PerkinElmer | Cat# 6013329 | |
| Chemical compound, drug | [U-13C]-Glutamine | Sigma | Cat# 605166 | Used at 2 mM final concentration |
| Chemical compound, drug | [U-13C]-Proline | Cambridge | Cat# 201740-83-2 | Used at 0.34 mM final concentration |
| Chemical compound, drug | [1,2-13C]-Glucose | Sigma | Cat# 453188 | Used at 5.6 mM final concentration |
| Chemical compound, drug | AP substrate BM purple | Roche | Cat# 11442074001 | |
| Chemical compound, drug | ECL substrate | Bio-Rad | Cat# 1705060 | |
| Chemical compound, drug | Super signal West Femto ECL | Thermo Fisher | Cat# 1705060 | |
| Antibody | Eif2α (rabbit monoclonal) | Cell Signaling | RRID:AB_10692650 | (1:1000) |
| Antibody | pSer51 Eif2α (rabbit monoclonal) | Cell Signaling | RRID:AB_2096481 | (1:1000) |
| Antibody | pSer240/244 S6rp (rabbit polyclonal) | Cell Signaling | RRID:AB_331682 | (1:1000) |
| Antibody | S6rp (rabbit monoclonal) | Cell Signaling | RRID:AB_331355 | (1:1000) |
| Antibody | α-Tubulin (rabbit monoclonal) | Cell Signaling | RRID:AB_2619646 | (1:1000) |
| Antibody | β-Actin (rabbit polyclonal) | Cell Signaling | RRID:AB_330288 | (1:1000) |
| Antibody | HRP goat anti-rabbit (goat polyclonal) | Cell Signaling | RRID:AB_2099233 | (1:2000) |
| Antibody | HRP anti-mouse (horse polyclonal) | Cell Signaling | RRID:AB_330924 | (1:2000) |
| Antibody | Runx2 (rabbit monoclonal) | Cell Signaling | RRID:AB_10949892 | (1:1000) |
| Antibody | Smad1 (rabbit polyclonal) | Cell Signaling | RRID:AB_2107780 | (1:1000) |
| Antibody | 4E-BP1 (rabbit monoclonal) | Cell Signaling | RRID:AB_2097841 | (1:1000) |
| Antibody | mTOR (rabbit monoclonal) | Cell Signaling | RRID:AB_2105622 | (1:1000) |
| Antibody | Erk (rabbit monoclonal) | Cell Signaling | RRID:AB_390779 | (1:1000) |
| Antibody | eEF2 (rabbit polyclonal) | Cell Signaling | RRID:AB_10693546 | (1:1000) |
| Antibody | Phgdh (rabbit polyclonal) | Cell Signaling | RRID:AB_2750870 | (1:1000) |
| Antibody | Akt (rabbit polyclonal) | Cell Signaling | RRID:AB_329827 | (1:1000) |
| Antibody | COL1A1 (mouse monoclonal) | Santa Cruz | RRID:AB_2797597 | (1:1000) WB(1:200) IF |
| Antibody | OSX (mouse monoclonal) | Santa Cruz | RRID:AB_2895257 | (1:1000) WB |
| Antibody | ATF4 (rabbit polyclonal) | Santa Cruz | RRID:AB_2058752 | (1:1000) |
| Antibody | ATF2 (mouse monoclonal) | Santa Cruz | RRID:AB_626708 | (1:1000) |
| Antibody | PAX1 (mouse monoclonal) | Millipore | Cat# MABE1115 | (1:1000) |
| Antibody | SNAT2 (rabbit polyclonal) | Abcam | RRID:AB_2050321 | (1:1000) |
| Antibody | OSX (rabbit polyclonal) | Abcam | RRID:AB_2194492 | (1:200) IF |
| Antibody | COLX (mouse monoclonal) | Quartett | Cat# 2031501217 | (1:200) |
| Antibody | Goat anti-mouse 568 (goat unknown clonality) | Thermo Fisher | RRID:AB_141359 | (1:200) |
| Antibody | Goat anti-rabbit 568 (goat polyclonal) | Thermo Fisher | RRID:AB_143157 | (1:200) |
| Commercial assay or kit | Alexa Fluor 647 Phalloidin | Thermo Fisher | Cat# 22287 | |
| Commercial assay or kit | Iscript Reverse transcription kit | Bio-Rad | Cat# 1708841 | |
| Commercial assay or kit | SYBR green | Bio-Rad | Cat# 1725275 | |
| Commercial assay or kit | Click-iT EdU Alexa Fluor 488 Flow Cytometry Assay Kit | Invitrogen | Cat# C10420 | |
| Commercial assay or kit | Apoptosis Assay Kit (Cat# 22837) | AAT BIO | Cat# 22837 | |
| Chemical compound, drug | AP substrate BM purple | Roche | Cat# 11442074001 | |
| Software, algorithm | GraphPad 6 | https://www.graphpad.com/ | ||
| Software, algorithm | R version 3.6.0 | https://www.r-project.org/ |
Additional files
-
Supplementary file 1
sgRNA protospacer sequence.
- https://cdn.elifesciences.org/articles/76963/elife-76963-supp1-v3.docx
-
Supplementary file 2
RT-PCR primer sequences for tRNA charging.
- https://cdn.elifesciences.org/articles/76963/elife-76963-supp2-v3.docx
-
Supplementary file 3
RT-PCR primer sequences.
- https://cdn.elifesciences.org/articles/76963/elife-76963-supp3-v3.docx
-
Transparent reporting form
- https://cdn.elifesciences.org/articles/76963/elife-76963-transrepform1-v3.docx
Download links
A two-part list of links to download the article, or parts of the article, in various formats.
Downloads (link to download the article as PDF)
Open citations (links to open the citations from this article in various online reference manager services)
Cite this article (links to download the citations from this article in formats compatible with various reference manager tools)
SLC38A2 provides proline to fulfill unique synthetic demands arising during osteoblast differentiation and bone formation
eLife 11:e76963.
https://doi.org/10.7554/eLife.76963


