The ACF chromatin-remodeling complex is essential for Polycomb repression
- Institute of Molecular Biology, University of Oregon, United States
Figures
Figure 1 with 1 supplement

Forward genetics identifies ISWI complex members required for repression of H3K27-methylated genes.
(A) Selection scheme with reporter genes inserted at H3K27 methylation-marked loci to select for genes required for silencing. (B) Schematic of protein domains in ISWI and ACF1 with the changes identified in our selection (L430P and D161fs, respectively; marked with asterisks). The conserved nature of the changed residue in ISWI is highlighted for the designated species. (C) Serial dilution spot-test silencing assay for the indicated strains, which all contain PNCU07152::nat-1 on media with or without nourseothricin (NTC). (D), Serial dilution spot-test silencing assay for the indicated strains, which contain PNCU07152::nat-1 and PNCU5173::hph, on media with or without nourseothricin (NTC) or hygromycin (HYG). For complementation tests, wild-type copies of each gene were inserted at the his-3 locus (indicated at left as +iswiWTor +acf1WT). All spot tests were imaged after 48 hr at 32°C and performed at least twice. The number of cells spotted is indicated beneath the images.
Figure 1—figure supplement 1
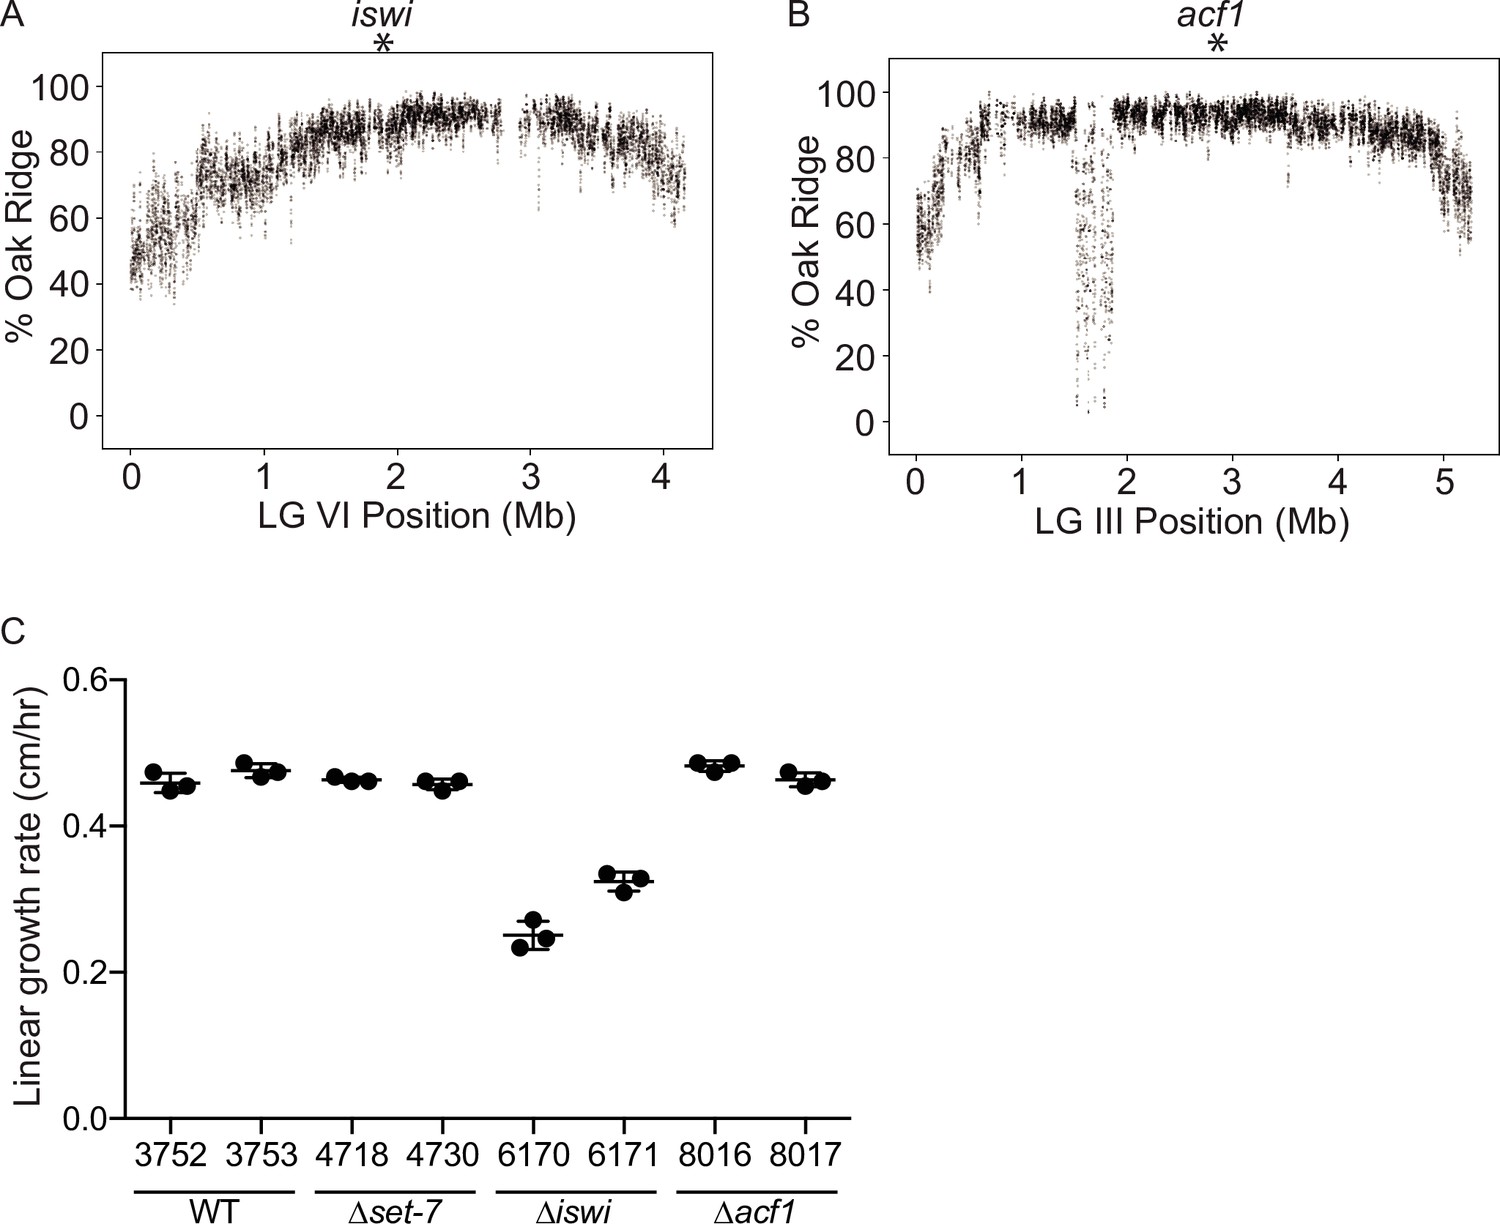
Genetic mapping and growth rate analysis of mutants identified in the selection.
(A) Whole-genome sequencing of pooled mutant genomic DNA identified a region near the middle of LG VI (indicated by asterisk) that is enriched for Oak Ridge single-nucleotide polymorphisms (SNPs) and contained a point mutation in iswi. Each point represents a running average (window size is 10 SNPs; step size is 1 SNP). (B) Whole-genome sequencing of pooled mutant genomic DNA identified a region near the middle of LG III (indicated by asterisk) that is enriched for Oak Ridge SNPs and contained a two base pair insertion in acf1. Each point represents a running average (window size is 10 SNPs; step size is 1 SNP). (C) Linear growth rates as measured using race tubes for strains with the indicated genotypes. Points represent technical replicates.
Figure 2 with 2 supplements
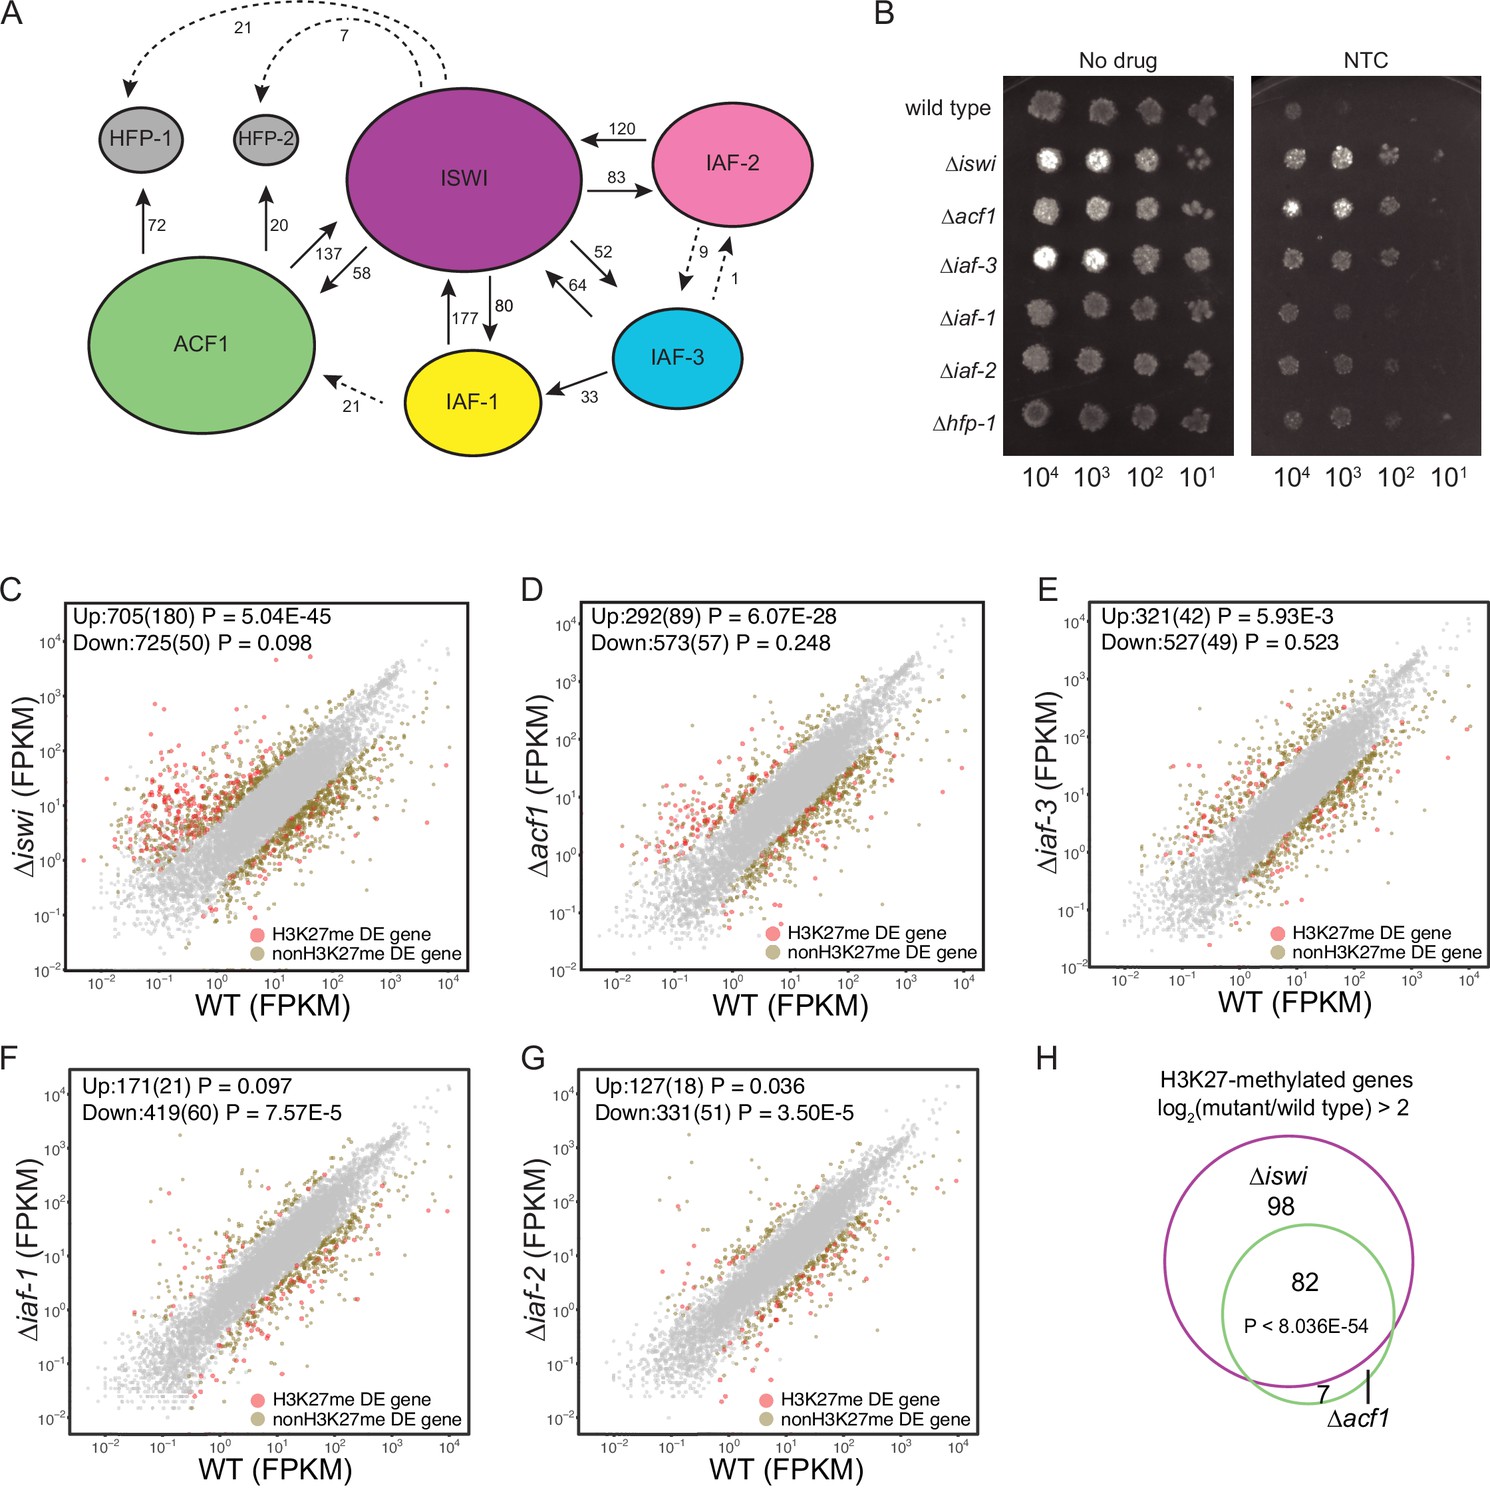
ISWI and ACF1 interact in Neurospora crassa and are required for repression of a subset of SET-7-repressed genes.
(A) Schematic representation of ISWI-interactions found by immunoprecipitation followed by mass spectrometry. Proteins (ISWI/NCU03875, ACF1/NCU00164, IAF-3/NCU02684, IAF-1/NCU00412, IAF-2/NCU09388, HFP-1/NCU03073, and HFP-2/NCU06623) are depicted to scale. Arrows are drawn from the protein used as the ‘bait’ to the protein partner identified, and unique peptide counts are indicated. Dotted arrows indicate the peptide count was below 0.4% of the total spectrum threshold. Proteins in gray (HFP-1 and HFP-2) were identified as interacting partners but were not used as ‘bait.’ (B) Serial dilution spot-test silencing assay for the indicated strains on media with or without nourseothricin (NTC). All strains have PNCU07152::nat-1. The number of cells spotted is indicated beneath the images, which were generated after incubation for 48 hr at 32°C. Spot test assays were repeated at least twice. (C–G) Expression level (FPKM) for each gene in the indicated mutant strain plotted against the expression level in wild type. Two biological replicates were used for each mutant. Two biological replicates were perfomed twice for wild type. Differentially expressed (DE) genes were defined using a significance cutoff of log2fold change>2 for upregulated genes and log2fold change<–2 for downregulated genes with a p value <0.05. Gray dots indicate genes that are not considered DE. Upper left corner shows the total number of significantly up- and downregulated genes with the number of H3K27-methylated genes in parentheses. Significance for enrichment of H3K27-methylated genes in each DE gene set was calculated by Fisher’s exact test (FPKM - fragments per kilobase per million reads). (H) Venn diagram showing overlap between H3K27-methylated genes that are upregulated (log2fold change>2; p value <0.05) in ∆iswi and ∆acf1 strains. Significant overlap (p<8.036E−54) determined by hypergeometric probability test.
-
Figure 2—source data 1
ISWI interactor comparison total spectra greater than 0.4 from mass spectrometry.
- https://cdn.elifesciences.org/articles/77595/elife-77595-fig2-data1-v3.xlsx
-
Figure 2—source data 2
All mass spectrometry data.
- https://cdn.elifesciences.org/articles/77595/elife-77595-fig2-data2-v3.xlsx
-
Figure 2—source data 3
mRNA-seq analysis.
- https://cdn.elifesciences.org/articles/77595/elife-77595-fig2-data3-v3.xlsx
Figure 2—figure supplement 1
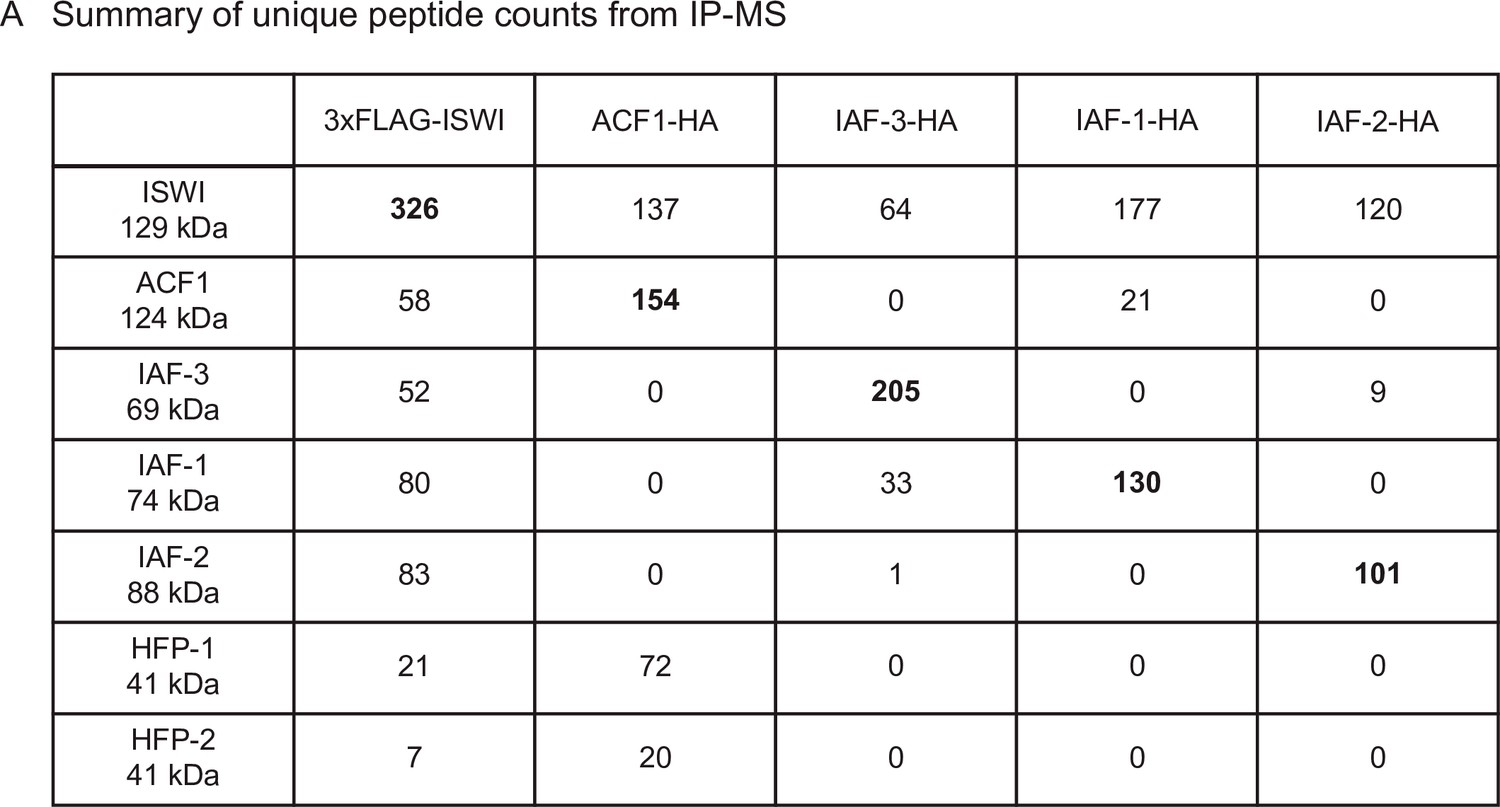
Summary of unique peptide counts from immunoprecipitation followed by mass spectrometry.
(A). Protein and affinity tag used as bait is listed at the top of the table and relevant interacting proteins (ISWI/NCU03875, ACF1/NCU00164, IAF-3/NCU02684, IAF-1/NCU00412, IAF-2/NCU09388, HFP-1/NCU03073, and HFP-2/NCU06623) are listed on the left side. Numbers indicate the unique peptide counts.
Figure 2—figure supplement 2
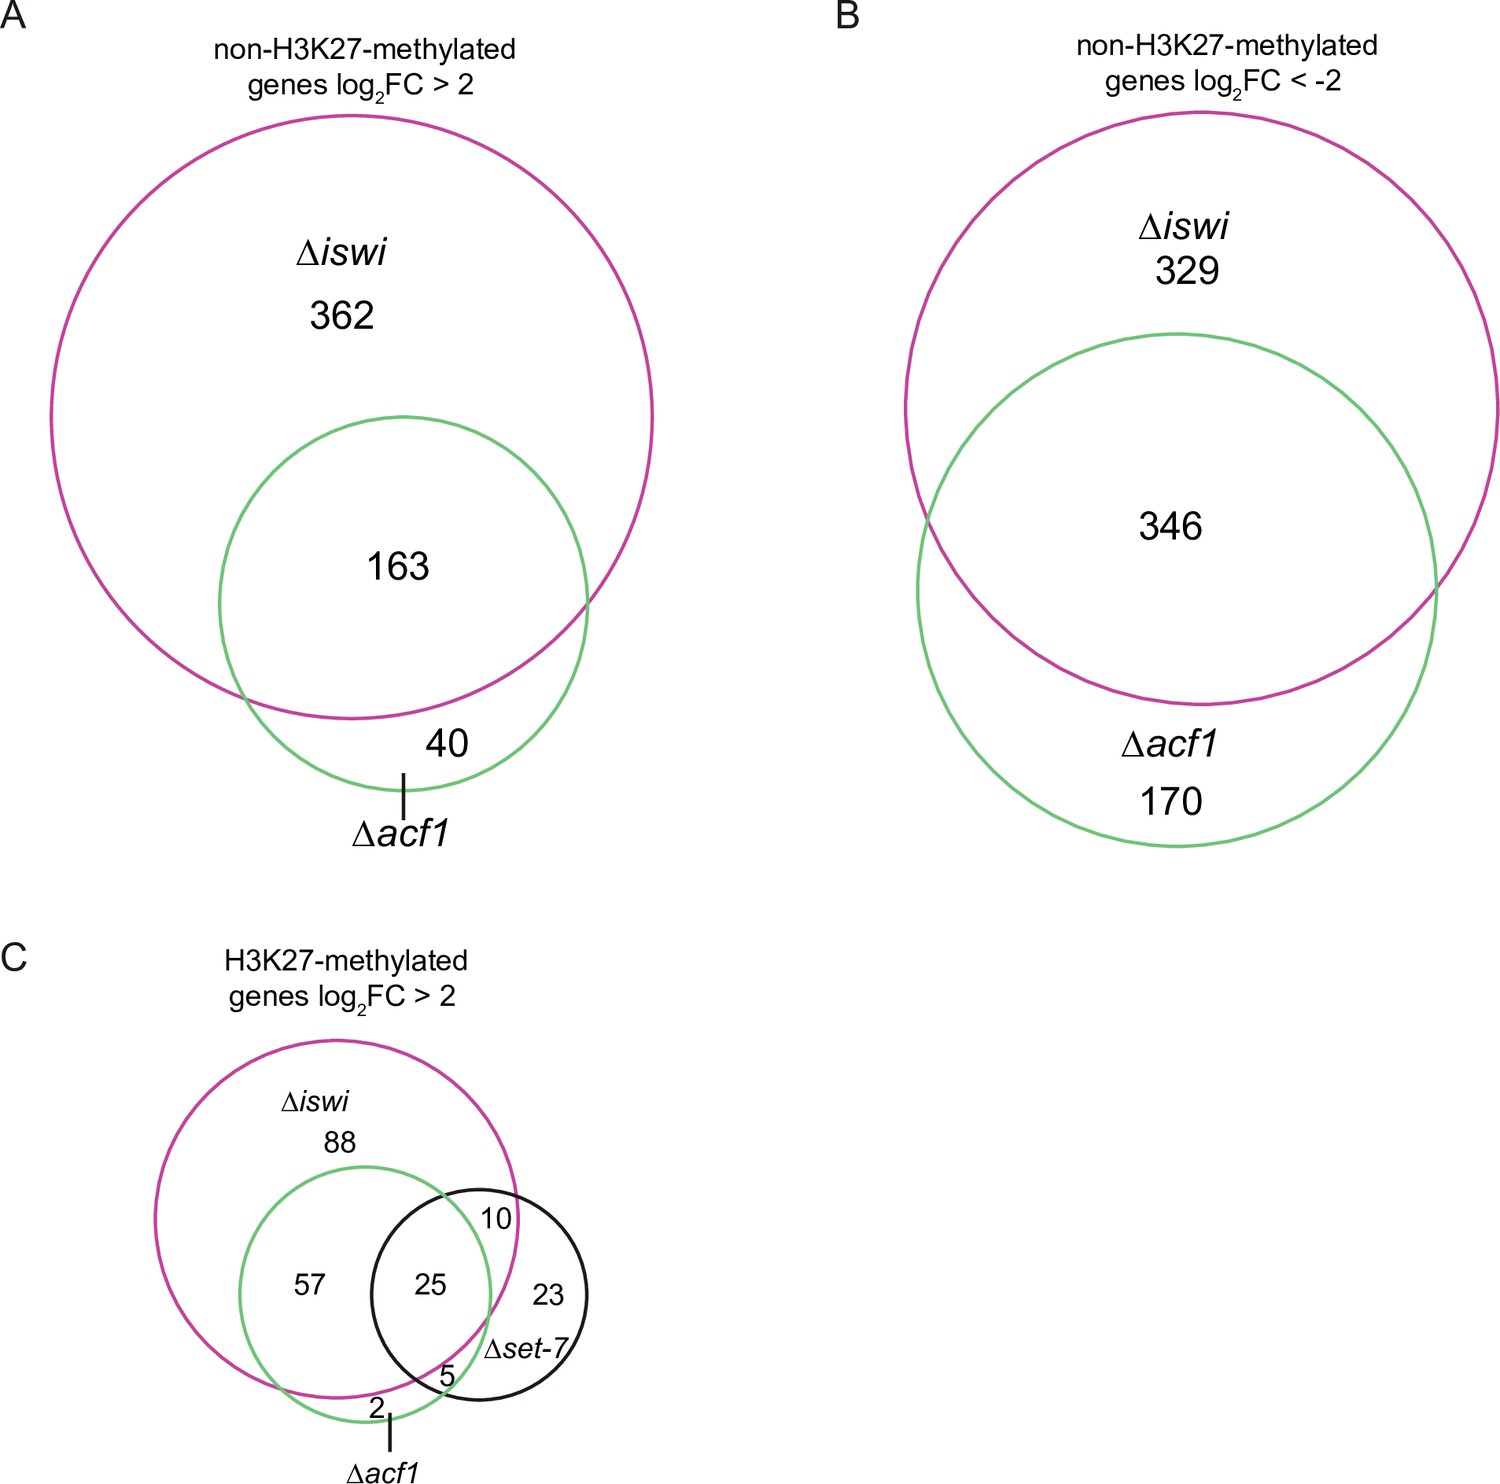
iswi and acf1 are required for regulation of non-H3K27-methylated genes.
(A) Venn diagram showing the overlap of non-H3K27-methylated genes upregulated (log2FC >2; p value <0.05) for the indicated genotypes. (B) Venn diagram showing the overlap of non-H3K27-methylated genes downregulated (log2FC<–2; p value <0.05) for the indicated genotypes. Venn diagrams are not scaled relative to each other. (C) Venn diagram showing the overlap of H3K27-methylated genes upregulated (log2FC >2; p value <0.05) for the indicated genotypes. FC, fold change.
Figure 3 with 2 supplements
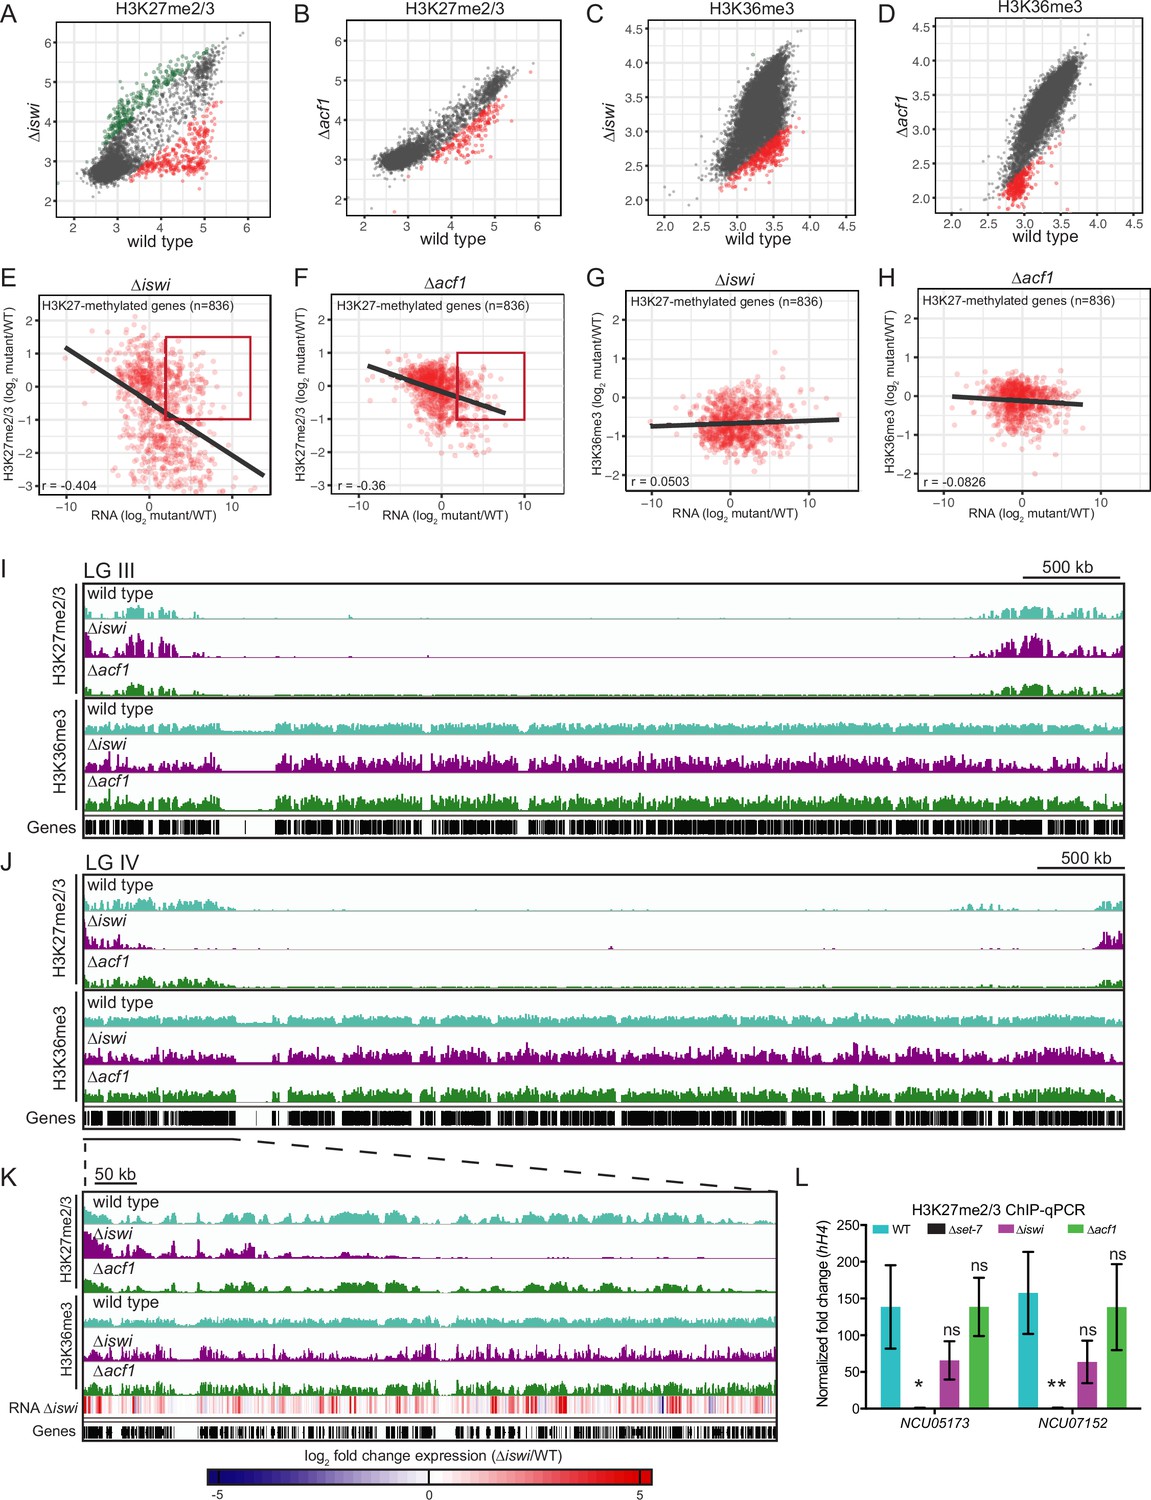
iswi and acf1 are required for wild-type H3K27me2/3 and H3K36me3 but loss of these methyl marks is not required for transcriptional upregulation.
(A, B) Scatter plots show the correlation of H3K27me2/3 at genes in wild type and ∆iswi or ∆acf1 based on biological replicates of ChIP-seq data. Green points (n=260 in ∆iswi and n=0 in ∆acf1) represent genes with increased H3K27me2/3 levels (at least twofold over wild type) and red points (n=341 in ∆iswi and n=193 in ∆acf1) represent genes with decreased H3K27me2/3 levels (at least twofold relative to wild type) in the indicated mutant. (C, D) Scatter plots show the correlation of H3K36me3 at genes in wild type and ∆iswi or ∆acf1 based on biological replicates of ChIP-seq data. Green points (n=1 in ∆iswi and n=0 in ∆acf1) represent genes with increased H3K36me3 levels (at least twofold over wild type) and red points (n=444 in ∆iswi and n=317 in ∆acf1) represent genes with decreased H3K36me3 levels (at least twofold relative to wild type) in the indicated mutant. (E, F) Scatter plots show the correlation between H3K27me2/3 and gene expression at H3K27-methylated genes (n=836) in the indicated mutants. Pearson correlation coefficient is reported. Red box indicates genes (n=92 in ∆iswi and n=66 in ∆acf1) that are significantly upregulated (log2 fold change>2) but show no significant loss of H3K27me2/3 (log2 fold change>–1). (G, H) Scatter plots show the correlation between H3K36me3 and gene expression at H3K27-methylated genes (n=836) in the indicated mutants. Pearson correlation coefficient is reported. (I) ChIP-seq tracks showing average level of H3K27me2/3 or H3K36me3 merged from two biological replicates for the indicated strains on LG III. Y-axis is 0–1000 RPKM for H3K27me2/3 tracks and 0–100 average read counts for H3K36me3 tracks. (J) Same as in (I), but for LG IV. (K) Enlarged ChIP-seq tracks showing the underlined region on LG IV from (J). Gene expression changes in ∆iswi are shown. (L) ChIP-qPCR data for H3K27me2/3 at the two genes used for the initial mutant selection (NCU05173 and NCU07152) in the indicated strains. Filled bars represent the mean of technical triplicates and error bars show standard deviation (** for p<0.01, * for p<0.05, and ns for not significant; all relative to wild type by unpaired t-test). Data are from one representative experiment that was performed three times.
-
Figure 3—source data 1
H3K27me2/3 ChIP-seq comparisons (∆iswi and ∆acf1).
- https://cdn.elifesciences.org/articles/77595/elife-77595-fig3-data1-v3.xlsx
-
Figure 3—source data 2
H3K36me3 ChIP-seq comparisons.
- https://cdn.elifesciences.org/articles/77595/elife-77595-fig3-data2-v3.xlsx
-
Figure 3—source data 3
Comparison of H3K27me2/3 ChIP-seq data and RNA-seq data in ∆iswi and ∆acf1.
- https://cdn.elifesciences.org/articles/77595/elife-77595-fig3-data3-v3.xlsx
Figure 3—figure supplement 1
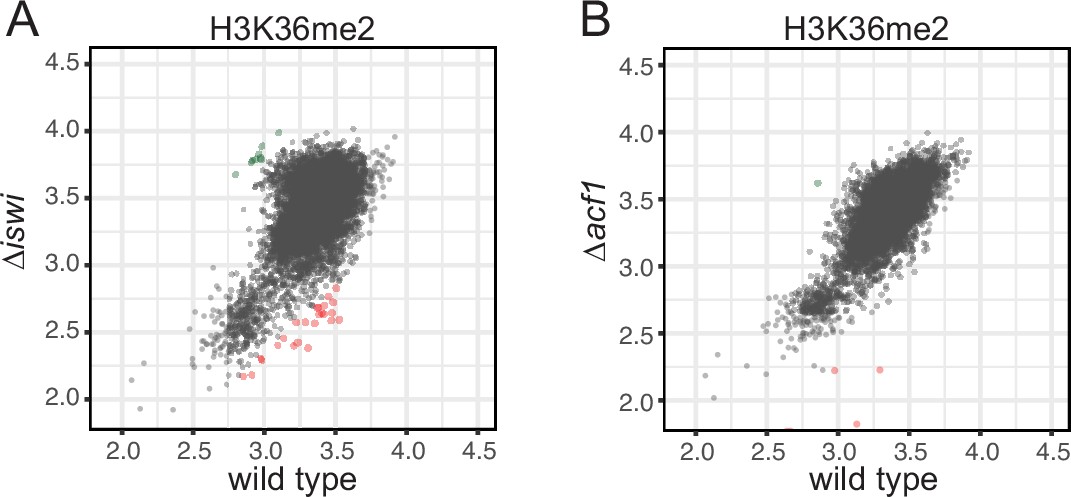
iswi and acf1 are not required for H3K36me2.
(A, B) Scatter plots show the correlation of H3K36me2 at genes in wild type and ∆iswi or ∆acf1 based on biological replicates of ChIP-seq data. Green points (n=9 in ∆iswi and n=1 in ∆acf1) represent genes with increased H3K36me2 levels (at least twofold over wild type) and red points (n=25 in ∆iswi and n=7 in ∆acf1) represent genes with decreased H3K36me2 levels (at least twofold relative to wild type) in the indicated mutant.
-
Figure 3—figure supplement 1—source data 1
H3K36me2 ChIP-seq comparisons.
- https://cdn.elifesciences.org/articles/77595/elife-77595-fig3-figsupp1-data1-v3.xlsx
Figure 3—figure supplement 2
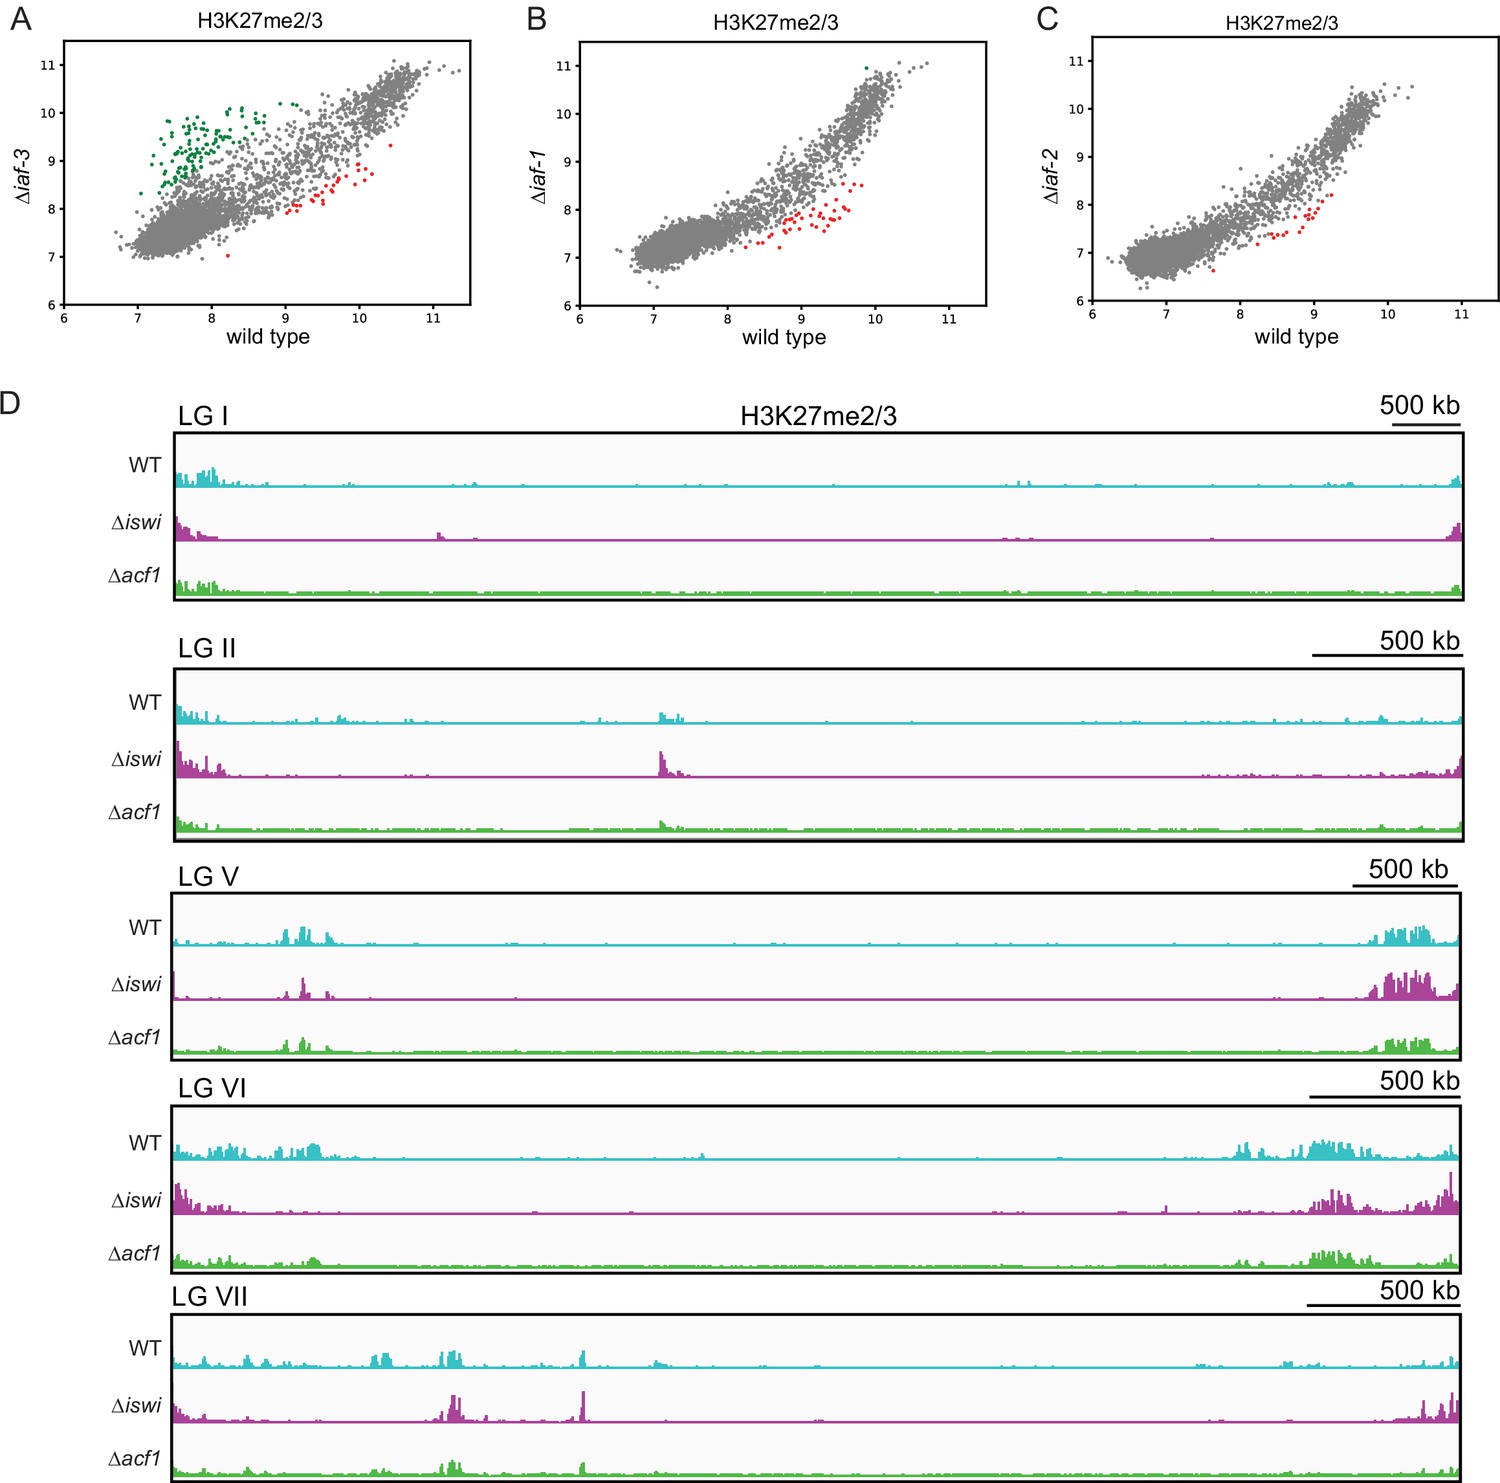
Loss of iaf-3, iaf-1, and iaf-2 results in minor changes in H3K27me2/3.
(A) Scatter plot showing the correlation of H3K27me2/3 at all genes in wild type and ∆iaf-3 based on biological replicates of ChIP-seq data. Green points represent genes with increased H3K27me2/3 (at least twofold over wild type) and red points represent genes with decreased H3K27me2/3 levels (at least twofold relative to wild type) in ∆iaf-3 strains. (B) Same as in (A), but for ∆iaf-1 strains. (C) Same as in (A), but for ∆iaf-2 strains. (D) ChIP-seq tracks showing average levels of H3K27me2/3 merged from two biological replicates for the indicated strains on the indicated chromosomes (linkage groups). Y-axis is 0–1000 RPKM for all tracks.
-
Figure 3—figure supplement 2—source data 1
H3K27me2/3 ChIP-seq comparisons (∆iswi, ∆acf1, ∆iaf-3, ∆iaf-1, and ∆iaf-2).
- https://cdn.elifesciences.org/articles/77595/elife-77595-fig3-figsupp2-data1-v3.xlsx
Figure 4 with 1 supplement
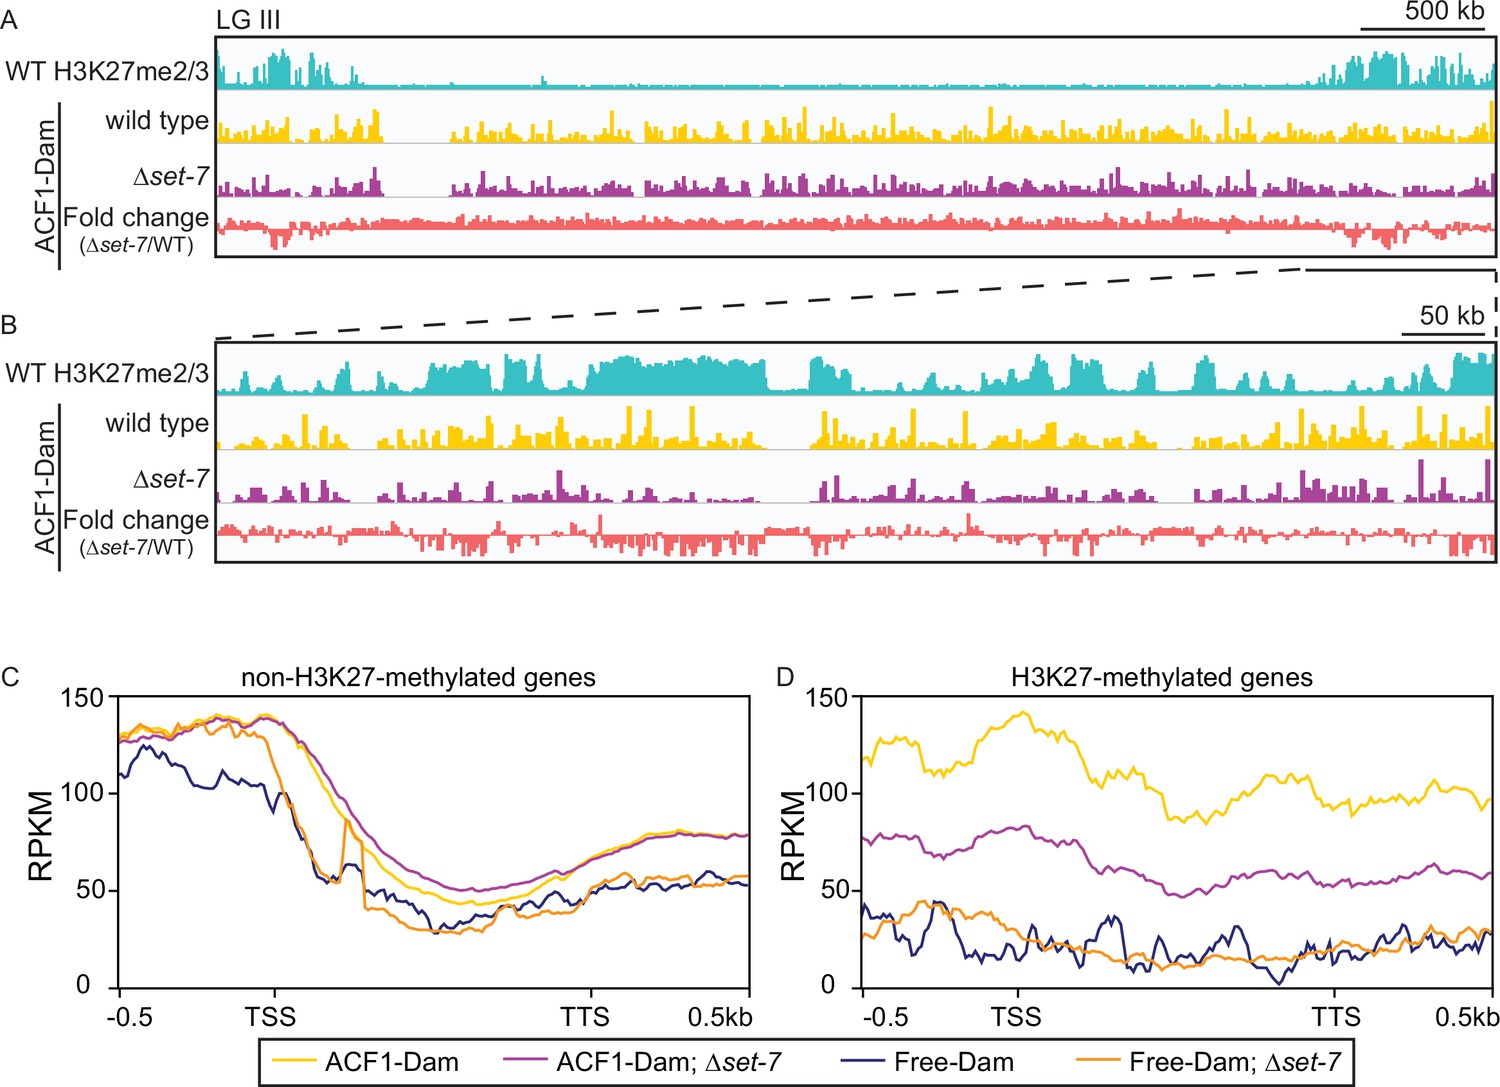
ACF1 localizes to H3K27me2/3-marked regions of the genome.
(A) Top track shows wild-type H3K27me2/3 levels based on ChIP-seq averaged from two biological replicates for one chromosome (LG III). Y-axis is 0–500 RPKM. Middle two tracks show DamID-seq average reads merged from two biological replicates for the indicated genotypes. Y-axis is 0–500 RPKM. Bottom track compares the DamID-seq reads from ∆set-7 strains to wild-type strains (shown above) displayed as the fold change between the two genotypes. Y-axis is –3–3. (B) Same as in (A), but showing an enlarged view of the right arm of LG III. Region shown is underlined in black in (A). (C) Average enrichment based on DamID-seq for each non-H3K27-methylated gene, scaled to 1 kb, ±500 base pairs, is plotted for the indicated strains. All lines represent average reads from two biological replicates except for Free-Dam which is from only one. TSS, transcription start site; TTS, transcription termination site. (D) Same as in (C), but for H3K27-methylated genes.
Figure 4—figure supplement 1
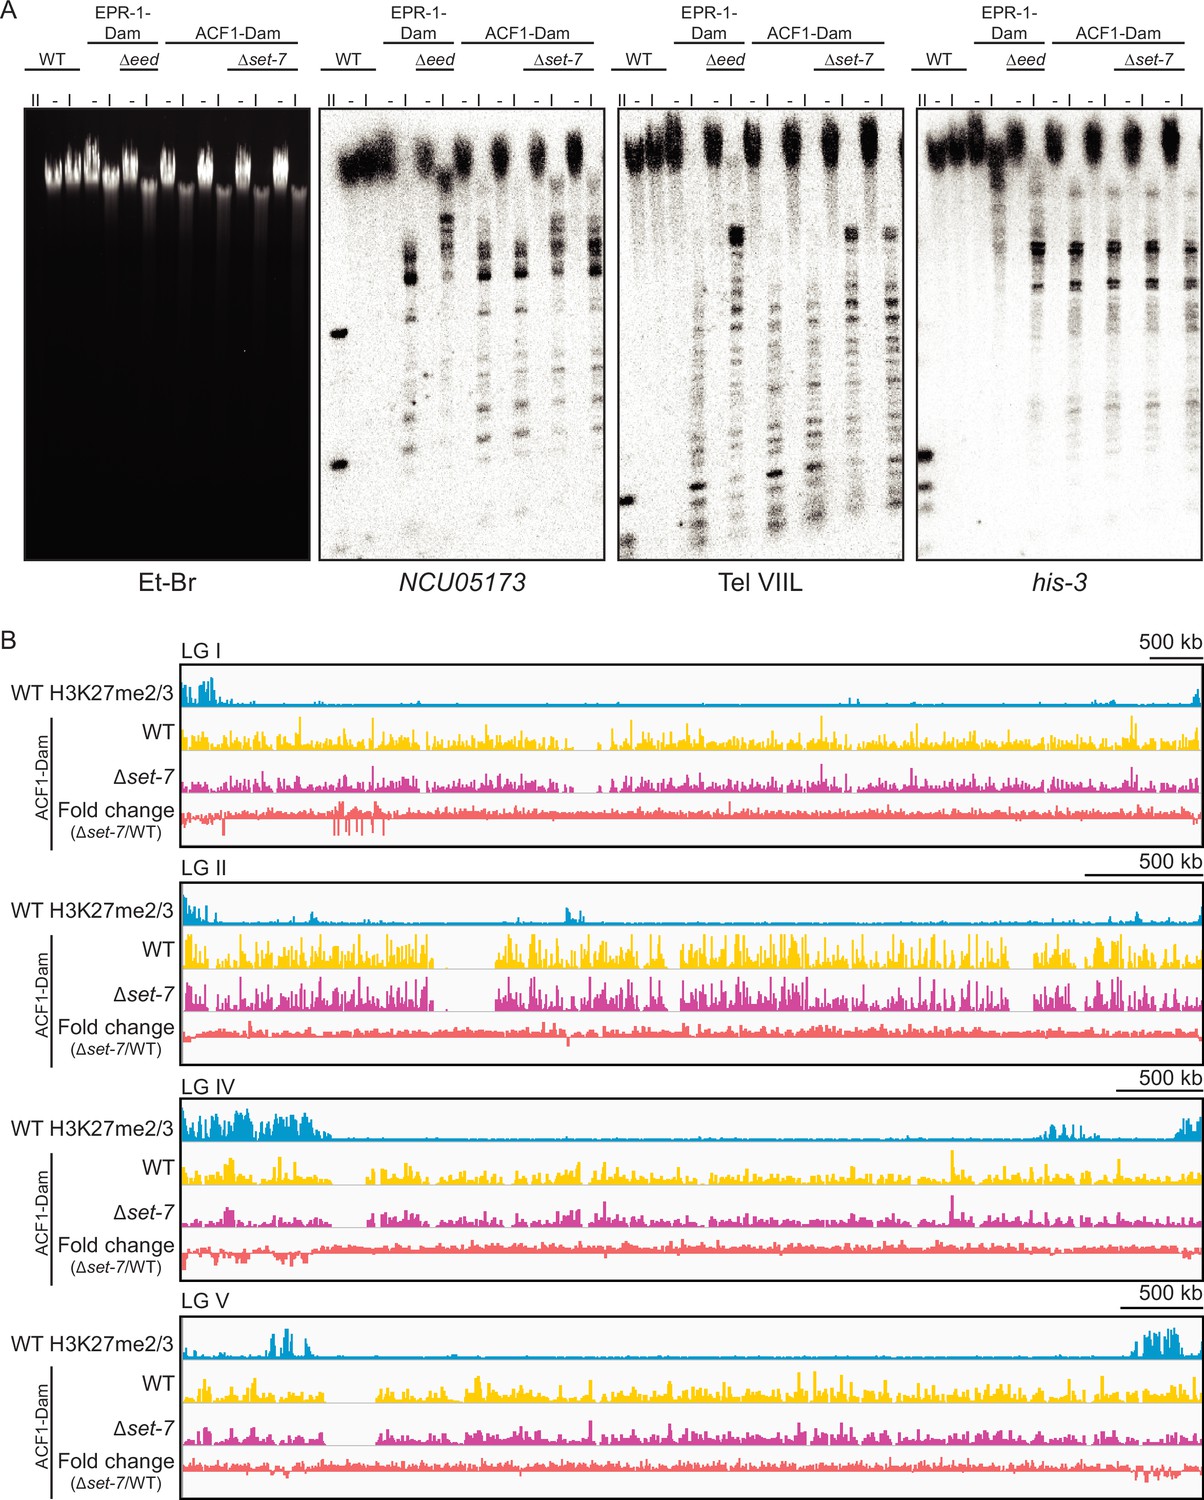
ACF1 localizes to H3K27me2/3-marked regions of the genome.
(A) DamID Southern blot with genomic DNA from the indicated strains digested with DpnI (I), DpnII (II), or left undigested (–). DpnII, which digests GATC sites without methylated adenines, shows the pattern of complete digestion in wild type. DpnI, which only digests GATC sites bearing adenine methylation, reveals the extent of methylation by Dam at probed regions (NCU05173 and Tel VIIL, H3K27-methylated; his-3, euchromatin). Ethidium bromide (Et-Br) shows total DNA. Biological replicates are shown for ACF1-Dam strains. EPR-1 is a presumptive H3K27 methyl-binding protein and was used as a positive control. EED and SET-7 are both members of the PRC2 complex and are required for H3K27 methylation. See source data for raw, uncropped images. (B) Top track shows wild-type H3K27me2/3 levels averaged from two biological replicates of ChIP on the indicated linkage group. Y-axis is 0–500 RPKM. Middle two tracks show DamID-seq average reads from two biological replicates for the indicated genotypes. Y-axis is 0–500 RPKM. Bottom track compares the DamID-seq reads from ∆set-7 to wild type (above) to show the fold change between the two genotypes. Y-axis is –3–3.
-
Figure 4—figure supplement 1—source data 1
Raw image for Et-Br gel.
- https://cdn.elifesciences.org/articles/77595/elife-77595-fig4-figsupp1-data1-v3.zip
-
Figure 4—figure supplement 1—source data 2
Raw image for Southern blot probed with NCU05173.
- https://cdn.elifesciences.org/articles/77595/elife-77595-fig4-figsupp1-data2-v3.pdf
-
Figure 4—figure supplement 1—source data 3
Raw image for Southern blot probed with Tel VIIL.
- https://cdn.elifesciences.org/articles/77595/elife-77595-fig4-figsupp1-data3-v3.pdf
-
Figure 4—figure supplement 1—source data 4
Raw image for Southern blot probed with his-3.
- https://cdn.elifesciences.org/articles/77595/elife-77595-fig4-figsupp1-data4-v3.pdf
-
Figure 4—figure supplement 1—source data 5
Raw, uncropped image for Et-Br gel with labels.
- https://cdn.elifesciences.org/articles/77595/elife-77595-fig4-figsupp1-data5-v3.pdf
-
Figure 4—figure supplement 1—source data 6
Raw, uncropped image for Southern blot probed with NCU05173 with labels.
- https://cdn.elifesciences.org/articles/77595/elife-77595-fig4-figsupp1-data6-v3.pdf
-
Figure 4—figure supplement 1—source data 7
Raw, uncropped image for Southern blot probed with Tel VIIL with labels.
- https://cdn.elifesciences.org/articles/77595/elife-77595-fig4-figsupp1-data7-v3.pdf
-
Figure 4—figure supplement 1—source data 8
Raw, uncropped image for Southern blot probed with his-3 with labels.
- https://cdn.elifesciences.org/articles/77595/elife-77595-fig4-figsupp1-data8-v3.pdf
Figure 5 with 2 supplements
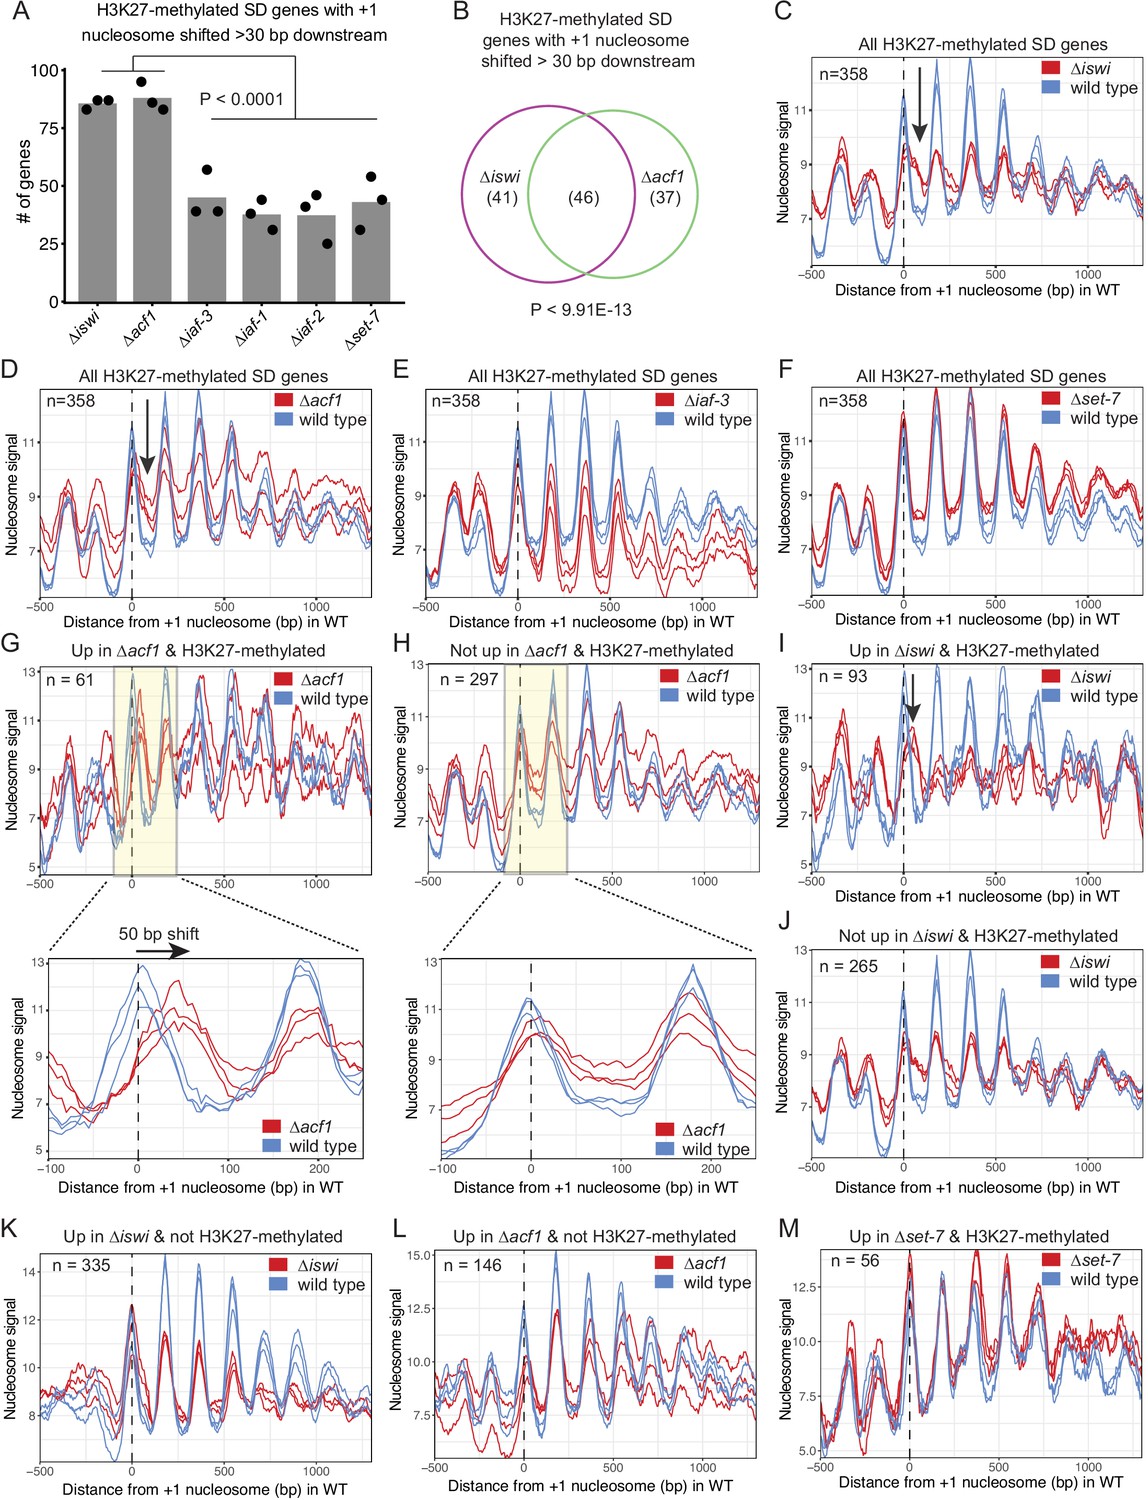
ISWI and ACF1 position the +1 nucleosome at H3K27-methylated, upregulated genes.
(A) Histogram of the number of H3K27-methylated SD genes (spectral density score for nucleosome order>2; n=358) that have the +1 nucleosome shifted downstream >30 base pairs when compared to wild type in the indicated mutant strains. Each point represents biological replicate 1, biological replicate 2, or analysis of the merged replicates and filled bar is the average of all three values. P values were determined with an unpaired t-test. (B) Venn diagram showing overlap of H3K27-methylated SD genes with a +1 nucleosome shifted downstream >30 bp when iswi or acf1 is deleted. P value was determined by hypergeometric probability test. (C–F) Average nucleosome signal at all H3K27-methylated SD genes plotted from MNase-seq data for the indicated mutants and wild type. The three colored lines represent biological replicate 1, biological replicate 2, and the average of the replicates for the strains indicated in the key. Arrows in (C) and (D) indicate the shifted +1 nucleosome. (G) Average nucleosome signal at SD genes that are upregulated (FDR <0.05) and marked by H3K27 methylation in ∆acf1 strains. The three colored lines represent biological replicate 1, biological replicate 2, and the average of the replicates. The boxed, shaded region is enlarged in the lower panel. (H) Same as panel (G), but for H3K27-methylated SD genes that are not upregulated in ∆acf1 strains. (I) Average nucleosome signal at SD genes that are upregulated (FDR <0.05) and marked by H3K27 methylation in ∆iswi strains. The three colored lines represent biological replicate 1, biological replicate 2, and the average of the replicates. Arrow indicates the shifted +1 nucleosome. (J) Same as (I), but for H3K27-methylated SD genes that are not upregulated in ∆iswi strains. (K, L) Average nucleosome signal at SD genes that are upregulated (FDR <0.05) and not marked by H3K27 methylation in ∆iswi (K) and ∆acf1 (L) strains. The three colored lines represent biological replicate 1, biological replicate 2, and the average of the replicates. (M) Same as (I), but for H3K27-methylated SD genes that are upregulated in ∆set-7.
-
Figure 5—source data 1
List of SD genes used for MNase-seq analysis.
- https://cdn.elifesciences.org/articles/77595/elife-77595-fig5-data1-v3.xlsx
Figure 5—figure supplement 1
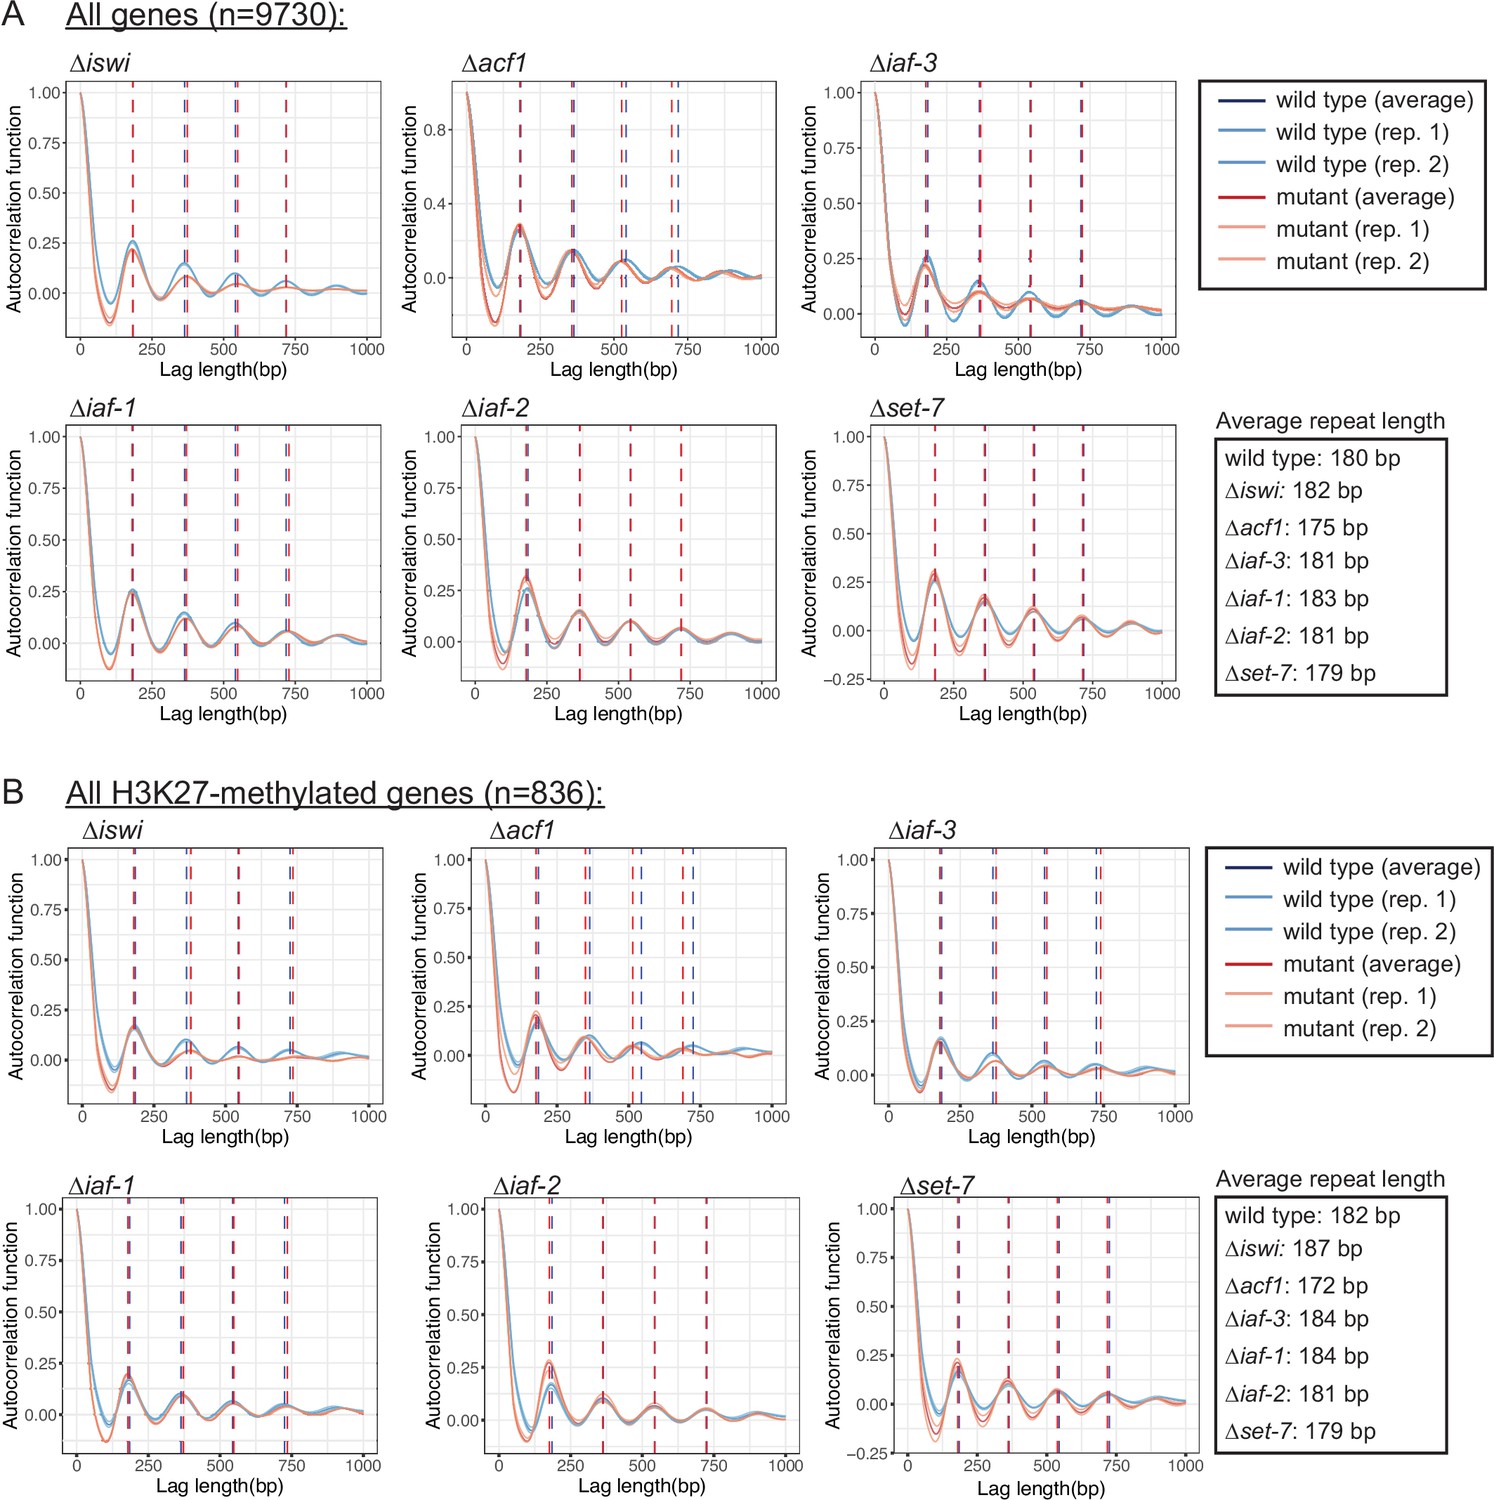
ISWI and its interacting partners have minor effects on nucleosome repeat length in Neurospora crassa.
(A) Autocorrelation function is plotted for all genes (n=9730) in the indicated strains. Biological replicates and the average of the two replicates are shown. The vertical dotted blue line indicates wild-type nucleosome position and the vertical dotted red line indicates mutant nucleosome position. Average repeat length for each strain is shown on the right. (B) Same as in (A), but for all H3K27-methylated genes (n=836).
Figure 5—figure supplement 2
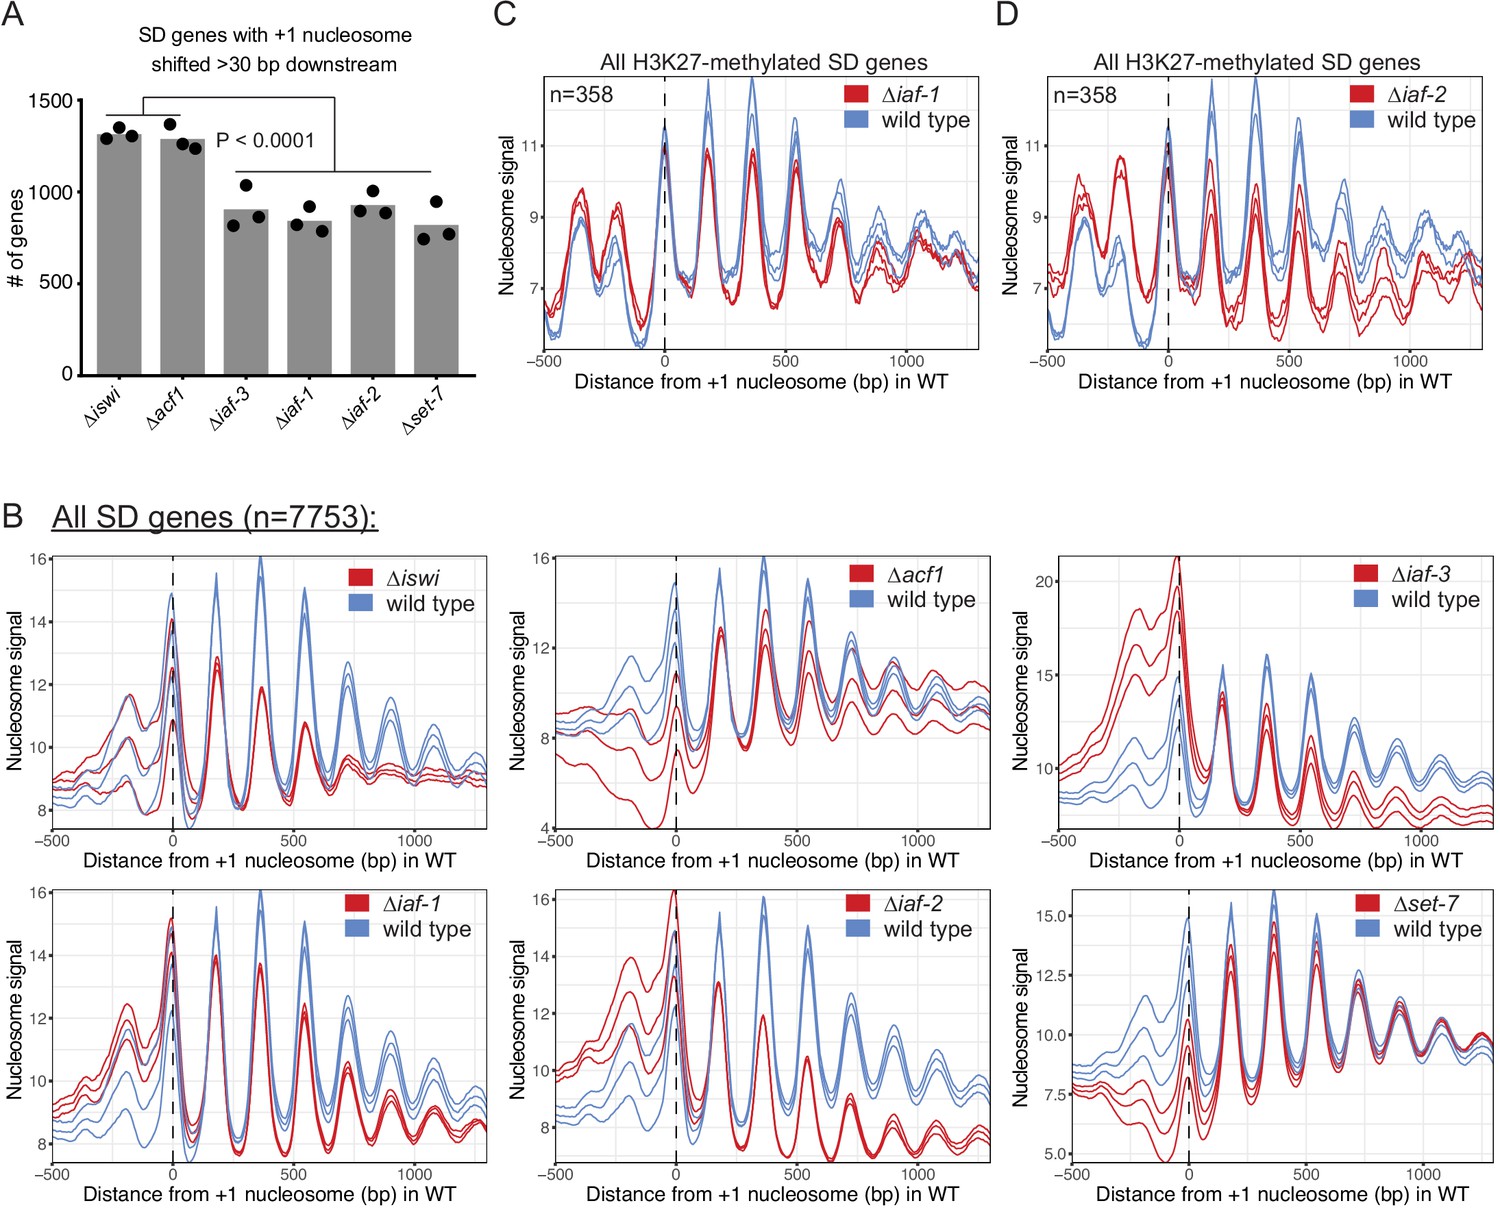
Nucleosome shifts are specific to genes that are H3K27-methylated and upregulated in ∆iswi and ∆acf1.
(A) Histogram of the number of SD genes (spectral density score for nucleosome order>2; n=7753) that have the +1 nucleosome shifted downstream >30 base pairs when compared to wild type in the indicated mutant strains. Each point represents biological replicate 1, biological replicate 2, or analysis of the merged replicates and filled bar is the average of all three values. P values were determined with an unpaired t-test. (B) Plot of the average nucleosome signal at all SD genes. The three colored lines represent biological replicate 1, biological replicate 2, and the average of the replicates for the indicated strain. (C, D) Average nucleosome signal at all H3K27-methylated SD genes plotted from MNase-seq data for the indicated mutants and wild type. The three colored lines represent biological replicate 1, biological replicate 2, and the average of the replicates for the strains indicated in the key.
Figure 6 with 1 supplement
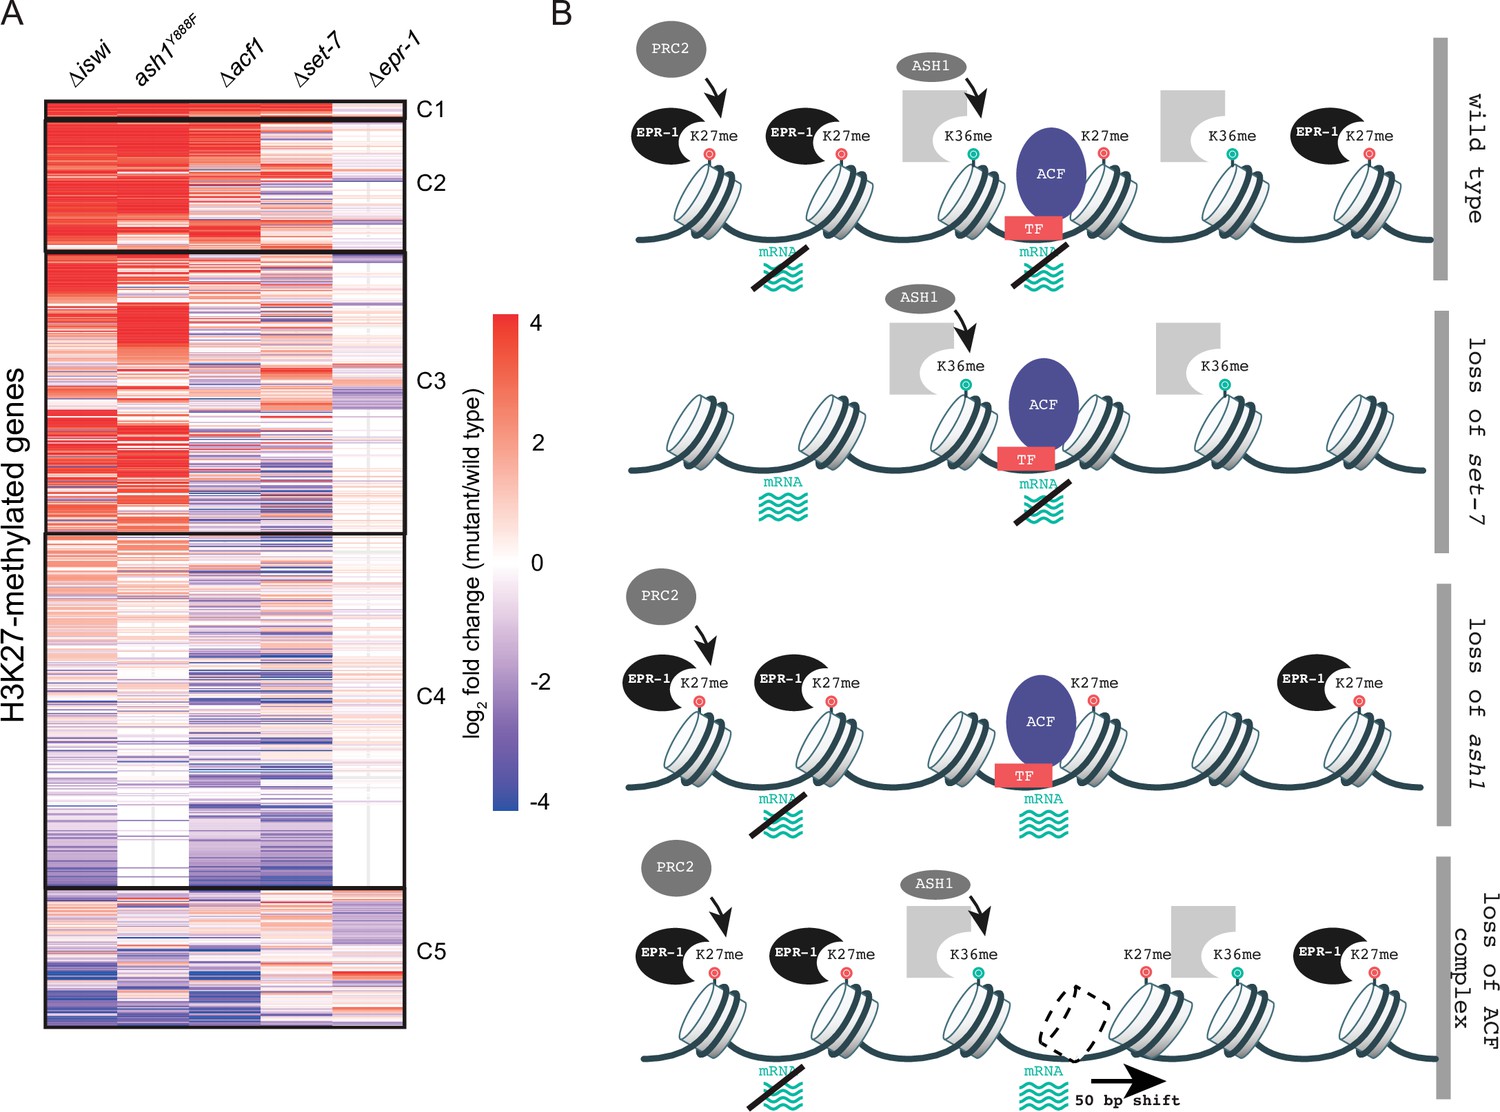
Multifaceted repression in facultative heterochromatin.
(A) Clustered heatmap made using mRNA-seq data for combined biological replicates of the indicated mutant strains. All H3K27-methylated genes that had reads in mRNA-seq data were included (n=821). Clusters (C1–C5) were determined by eye. (B) Model depicting our current framework of factors responsible for maintaining gene silencing in regions marked by H3K27 methylation. Loss of this methyl-mark itself is sufficient to activate a fraction of genes, in part because of loss of the H3K27 methyl-specific factor EPR-1. Repression of many other genes, in H3K27-methylated domains and elsewhere, depend on both H3K36 methylation by ASH1 and both components of the ACF complex (ISWI and ACF). Gray partial square represents an unknown H3K36 methyl binding protein. TF represents unknown transcription factor(s) that could recruit/direct the ACF complex.
-
Figure 6—source data 1
Heatmap clustering of mRNA-seq data.
- https://cdn.elifesciences.org/articles/77595/elife-77595-fig6-data1-v3.xlsx
Figure 6—figure supplement 1
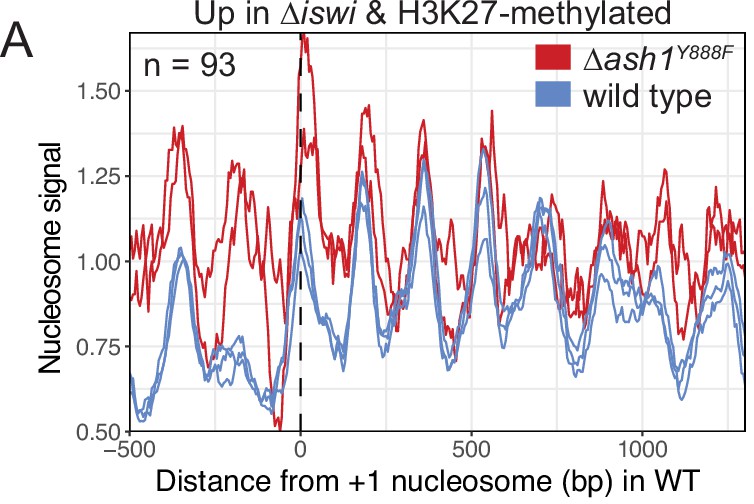
Loss of ash1 function does not result in a downstream nucleosome shift.
(A) Average nucleosome signal in ash1Y888Fand wild-type strains at SD genes that are upregulated (FDR <0.05) and marked by H3K27 methylation in ∆iswi strains. The three colored lines represent biological replicate 1, biological replicate 2, and the average of the replicates.
Tables
Key resources table
| Reagent type (species) or resource | Designation | Source or reference | Identifiers | Additional information |
|---|---|---|---|---|
| Strain, strain background (Neurospora crassa) | Mauriceville | FGSC 2225 | N51 | mat A; Mauriceville |
| Strain, strain background (N. crassa) | Wild type | FGSC 2489 | N3752 | mat A; Oak Ridge |
| Strain, strain background (N. crassa) | Wild type | FGSC 4200 | N3753 | mat a; Oak Ridge |
| Strain, strain background (N. crassa) | Sad-1; his-3 | Wiles et al., 2020 | N3756 | mat A; Sad-1; his-3 |
| Strain, strain background (N. crassa) | ∆set-7 | FGSC#11182 | N4718 | mat a; ∆set-7::hph |
| Strain, strain background (N. crassa) | ∆set-7 | Jamieson et al., 2018 | N4730 | mat A; ∆set-7::bar |
| Strain, strain background (N. crassa) | ash1Y888F | Bicocca et al., 2018 | N4878 | mat A; his-3; ash1Y888F::3xFLAG::hph |
| Strain, strain background (N. crassa) | pNCU07152::nat-1; ∆set-7 | Wiles et al., 2020 | N5807 | Mat A; pNCU07152::nat-1; ∆set-7::bar |
| Strain, strain background (N. crassa) | pNCU07152::nat-1 | Wiles et al., 2020 | N5808 | mat a; pNCU07152::nat-1 |
| Strain, strain background (N. crassa) | ∆iswi | FGSC 11780 | N6170 | mat A; ∆iswi::hph |
| Strain, strain background (N. crassa) | ∆iswi | This study | N6171 | mat a; ∆iswi::hph |
| Strain, strain background (N. crassa) | Mutant hunt strain | Wiles et al., 2020 | N6279 | mat a; pNCU05173::hph; pNCU07152::nat-1; his-3 |
| Strain, strain background (N. crassa) | iswiL430P original mutant | This study | N6606 | mat a; pNCU05173::hph; pNCU07152::nat-1; his-3; iswiL430P |
| Strain, strain background (N. crassa) | pNCU07152::nat-1; ∆iswi::hph | This study | N6727 | mat a; pNCU07152::nat-1; ∆iswi::hph |
| Strain, strain background (N. crassa) | ash1Y888F | This study | N6876 | mat a; ash1Y888F::3xFLAG::nat-1 |
| Strain, strain background (N. crassa) | ash1Y888F | This study | N6877 | mat a; ash1Y888F::3xFLAG::nat-1 |
| Strain, strain background (N. crassa) | EPR-1-Dam | Wiles et al., 2020 | N7525 | mat A; epr-1::10xGly::Dam::nat-1 |
| Strain, strain background (N. crassa) | EPR-1-Dam; ∆eed | Wiles et al., 2020 | N7538 | mat a; epr-1::10xGly::Dam::nat-1; ∆eed::hph |
| Strain, strain background (N. crassa) | Free-Dam; ∆set-7 | This study | N7476 | mat A; ∆set-7::hph;his-3+::NLS(SV40)::Dam::3xFLAG::nat-1 |
| Strain, strain background (N. crassa) | Free-Dam; ∆set-7 | This study | N7477 | mat a; ∆set-7::hph;his-3+::NLS(SV40)::Dam::3xFLAG::nat-1 |
| Strain, strain background (N. crassa) | Free-Dam | This study | N7802 | mat A; his-3+::NLS(SV40)::Dam::3xFLAG::nat-1 |
| Strain, strain background (N. crassa) | iswiL430P complement-ation strain | This study | N7810 | mat a; pNCU05173::hph; pNCU07152::nat-1; his-3+::Pccg-1::3xFLAG::iswiWT; iswiL430P |
| Strain, strain background (N. crassa) | pNCU07152::nat-1; ∆iaf-2 | This study | N7941 | mat a; pNCU07152::nat-1; ∆iaf-2::hph |
| Strain, strain background (N. crassa) | acf1D161fs original mutant | This study | N7953 | mat a; pNCU05173::hph; pNCU07152::nat-1; his-3; acf1D161fs |
| Strain, strain background (N. crassa) | pNCU07152::nat-1; ∆acf1 | This study | N7956 | mat a; pNCU07152::nat-1; ∆mus-52::bar ∆acf1::hph |
| Strain, strain background (N. crassa) | pNCU07152::nat-1; ∆iaf-3::hph | This study | N7960 | mat A; pNCU07152::nat-1; ∆iaf-3::hph |
| Strain, strain background (N. crassa) | pNCU07152::nat-1; ∆iaf-1:hph | This study | N7961 | mat a; pNCU07152::nat-1; ∆iaf-1:hph |
| Strain, strain background (N. crassa) | ∆iaf-3 | This study | N7966 | mat A; ∆iaf-3::hph |
| Strain, strain background (N. crassa) | ACF1-HA | This study | N7971 | mat a; ∆mus-52::bar acf1::HA::hph |
| Strain, strain background (N. crassa) | IAF-1-HA | This study | N7973 | mat A; ∆mus-52::bar; iaf-1::HA::hph |
| Strain, strain background (N. crassa) | ∆iaf-2 | This study | N7988 | mat a; ∆iaf-2::hph |
| Strain, strain background (N. crassa) | ∆iaf-2 | This study | N7989 | mat a; ∆iaf-2::hph |
| Strain, strain background (N. crassa) | ∆iaf-1 | FGSC 12715 | N7990 | mat a; ∆iaf-1::hph |
| Strain, strain background (N. crassa) | ∆iaf-1 | This study | N7992 | mat a; ∆iaf-1::hph |
| Strain, strain background (N. crassa) | ∆acf1 | This study | N8016 | mat a; ∆acf1::hph |
| Strain, strain background (N. crassa) | ∆acf1 | This study | N8017 | mat a; ∆acf1::hph |
| Strain, strain background (N. crassa) | ∆iaf-3 | This study | N8018 | mat A; ∆iaf-3::hph |
| Strain, strain background (N. crassa) | IAF-3-HA | This study | N8071 | mat A; pNCU07152::nat-1; iaf-3::HA::hph |
| Strain, strain background (N. crassa) | IAF-2-HA | This study | N8075 | mat a; pNCU07152::nat-1; iaf-2::HA::hph |
| Strain, strain background (N. crassa) | ACF1-Dam; ∆set-7 | This study | N8113 | mat A; ∆set-7::hph; ∆mus-52::bar acf1::Dam::nat-1 |
| Strain, strain background (N. crassa) | ACF1-Dam; ∆set-7 | This study | N8114 | mat a; ∆set-7::hph; ∆mus-52::bar acf1::Dam::nat-1 |
| Strain, strain background (N. crassa) | ACF1-Dam | This study | N8115 | mat A; ∆mus-52:bar acf1::Dam::nat-1 |
| Strain, strain background (N. crassa) | acf1D161fscomplement-ation strain | This study | N8142 | mat a; pNCU05173::hph; pNCU07152::nat-1; his-3+::Pccg-1::acf1WT::mCherry; acf1D161fs |
| Strain, strain background (N. crassa) | ACF1-Dam | This study | N8146 | mat a; ∆mus-52::bar acf1::Dam::nat-1 |
| Strain, strain background (N. crassa) | pNCU07152::nat-1; ∆hfp-1 | This study | N8197 | mat a; pNCU07152::nat-1; ∆hfp-1::hph |
| Sequence-based reagent | hH4_qPCR_FP(4082) | Jamieson et al., 2013 | ChIP-qPCR primer | CATCAAGGGGTCATTCAC |
| Sequence-based reagent | hH4_qPCR_RP (4083) | Jamieson et al., 2013 | ChIP-qPCR primer | TTTGGAATCACCCTCCAG |
| Sequence-based reagent | NCU07152_promoter_FP(6565) | Wiles et al., 2020 | ChIP-qPCR primer | CGGTTCCAAAACTGCCCCTGTG |
| Sequence-based reagent | NCU07152_promoter_RP(6645) | Wiles et al., 2020 | ChIP-qPCR primer | CTCAGCGGGGTATATCAACGGC |
| Sequence-based reagent | NCU05173_promoter_FP(6567) | Wiles et al., 2020 | ChIP-qPCR primer | GCATTACCCTCGACAGGGTCTG |
| Sequence-based reagent | NCU05173_promoter_RP(6646) | Wiles et al., 2020 | ChIP-qPCR primer | GCTACCACCATGTGAAGCTCTGG |
| Sequence-based reagent | his-3_FP(1665) | Klocko et al., 2019 | Southern probe primers | GACGGGGTAGCTTGGCCCTAATTAACC |
| Sequence-based reagent | his-3_RP(3128) | Klocko et al., 2019 | Southern probe primers | CGATTTAGGTGACACTATAG |
| Sequence-based reagent | Tel_VIIL_FP(5271) | Wiles et al., 2020 | Southern probe primers | GGCATCCGTGGGTGTCCCAG |
| Sequence-based reagent | Tel_VIIL_RP(5272) | Wiles et al., 2020 | Southern probe primers | TTCCCGTCCCTACCAGGCAT |
| Sequence-based reagent | NCU05173_FP(6567) | Wiles et al., 2020 | Southern probe primers | GCATTACCCTCGACAGGGTCTG |
| Sequence-based reagent | NCU05173_RP(6568) | Wiles et al., 2020 | Southern probe primers | CCTGTTCGAGTTATCGGTGTTG |
| Antibody | α-H3K27me2/3 (mouse monoclonal) | Active Motif | Cat. #39536 | Chromatin immunoprecipitation(2 µl ChIP-seq; 3 µl ChIP-qPCR) |
| Antibody | α-H3K36me2(rabbit polyclonal) | Abcam | Cat. #ab9049 | Chromatin immunoprecipitation(2 µl) |
| Antibody | α-H3K36me3(rabbit polyclonal) | Abcam | Cat. #ab9050 | Chromatin immunoprecipitation(2 µl) |
| Antibody | α-HA(mouse monoclonal) | MBL | Cat. #180-3 | Immunoprecipitation(20 µl) |
| Antibody | α−FLAG M2 affinity gel (mouse monoclonal) | Sigma-Aldrich | Cat. #A2220 | Immunoprecipitation(400 µl) |
| Peptide, recombinant protein | HA peptide | Thermo Fisher Scientific | Cat. #26184 | Elution |
| Peptide, recombinant protein | 3× Flag peptide | APExBIO | Cat. #A6001 | Elution |
Additional files
Download links
A two-part list of links to download the article, or parts of the article, in various formats.
Downloads (link to download the article as PDF)
Open citations (links to open the citations from this article in various online reference manager services)
Cite this article (links to download the citations from this article in formats compatible with various reference manager tools)
The ACF chromatin-remodeling complex is essential for Polycomb repression
eLife 11:e77595.
https://doi.org/10.7554/eLife.77595


