Phosphoregulation of DSB-1 mediates control of meiotic double-strand break activity
- Graduate School of Biostudies, Kyoto University, Yoshidakonoe, Sakyo, Japan
- Department of Molecular and Cell Biology, University of California, United States
- Howard Hughes Medical Institute, United States
- California Institute for Quantitative Biosciences, United States
- Division of Biological Systems and Engineering, Lawrence Berkeley National Laboratory, United States
- Department of Science, Kyoto University, Japan
- Institute of Evolutionary Biology, Ashworth Laboratories, School of Biological Sciences, University of Edinburgh, United Kingdom
- Radiation Biology Center, Kyoto University, Japan
- Institute for Integrated Cell‐Material Sciences (iCeMS), Kyoto University, Japan
Figures
Figure 1 with 2 supplements

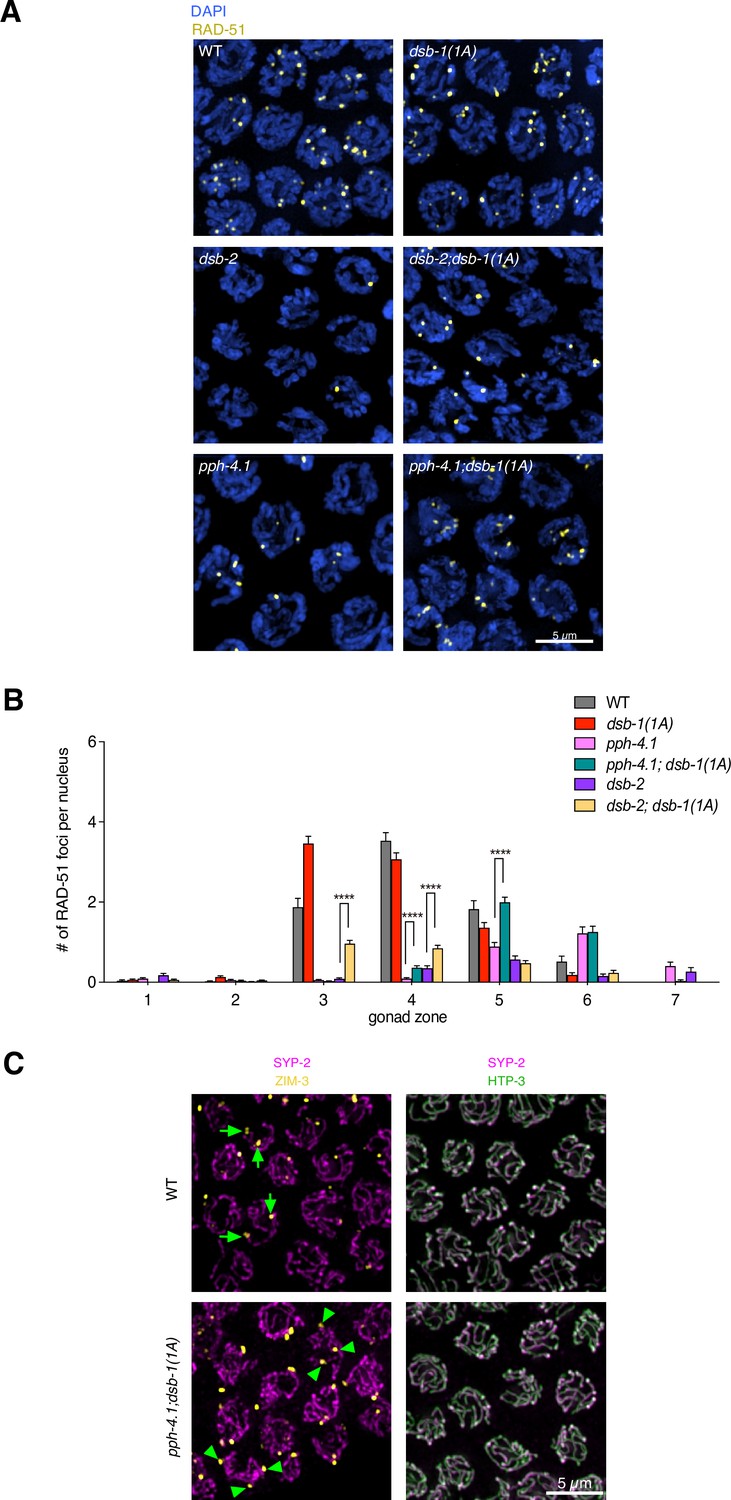
DSB-1 is phosphoregulated in a PPH-4.1PP4- and ATL-1ATR -dependent manner and ATL-1ATR kinase antagonizes PPH-4.1PP4 phosphatase.
(A) Left: Western blot of GFP-fused DSB-1 probed with α-GFP. GFP-DSB-1 detected in extracts from wild-type and gfp-dsb-1 worms (24 hr post-L4 stage) with either control RNAi or pph-4.1 RNAi treatment. A total protein amount of 97 µg was loaded in each lane. Arrowheads indicate two specific bands in the blot. Loading controls (α-actin) are shown at bottom. Right: Quantified band intensity ratio of phos-GFP-DSB-1 to non-phos-GFP-DSB-1 in each genotype. Mean (bar) and data points are from six biological replicates. Significance was assessed via two-tailed t test. (Figure 1—source data 1, Figure 1—source data 2). (B) Blot of GFP-DSB-1 worm lysate from young (1 day post-L4 stage) adult pph-4.1 RNAi-treated worms with or without λ-phosphatase treatment. (Figure 1—source data 3). (C, D, E) Western blots of endogenous DSB-1 probed with α-DSB-1 antibodies in wild type (N2), dsb-1(tm5034), atm-1(gk186), atl-1(tm853), or atm-1(gk186); atl-1(tm853) with combination of γ-irradiation (10 Gy in panel E, and 10 or 100 Gy in panel D as indicated). Lysate of 50 worms at 24 hr post-L4 stage was loaded in each lane. Asterisks show non-specific bands, and arrowheads indicate two specific bands. (Figure 1—source data 4, Figure 1—source data 5, Figure 1—source data 6). (F) Schematic showing a hermaphrodite gonad divided into seven equally sized zones for RAD-51 focus scoring. (G) Immunofluorescence images of RAD-51 foci in mid-pachytene nuclei (zone 5) of the indicated genotypes. Scale bar, 5 μm. (H) Quantification of RAD-51 foci in the germlines of the genotypes indicated in (G). Data are presented as mean ± SEM from at least three biological replicates. Seven gonads were scored for wild type and pph-4.1(tm1598), three gonads were scored for atl-1(tm853)/nT1, atl-1AID, controlAID as well as pph-4.1(tm1598); atl-1(tm853)/nT1 double mutants, and four gonads were scored in atm-1(gk186); pph-4.1(tm1598). The numbers of nuclei scored in zones 1–7 were as follows: for wild type, 420, 453, 377, 375, 345, 271, 296; for pph-4.1(tm1598), 433, 423, 422, 413, 355, 322, 208; for atl-1(tm853)/nT1, 103, 137, 145, 115, 97, 75, 40; for atl-1AID, 161, 193, 180, 241, 204, 117, 37; for controlAID, 143, 188, 233, 223, 192, 109, 28; for pph-4.1(tm1598); atl-1(tm853)/nT1, 126, 121, 98, 100, 94, 86, 49; for atm-1(gk186);pph-4.1(tm1598), 123, 153, 167, 140, 161, 156, 123. Significance was assessed via two-tailed t test, **p<0.01, ****p<0.0001 (Figure 1—source data 7).
-
Figure 1—source data 1
Intensity of phos-GFP-DSB-1 and non-phos-GFP band in Figure 1A.
Related to Figure 1A.
- https://cdn.elifesciences.org/articles/77956/elife-77956-fig1-data1-v2.xlsx
-
Figure 1—source data 2
Western blotting raw images in Figure 1A.
Related to Figure 1A.
- https://cdn.elifesciences.org/articles/77956/elife-77956-fig1-data2-v2.zip
-
Figure 1—source data 3
Western blotting raw images in Figure 1B.
Related to Figure 1B.
- https://cdn.elifesciences.org/articles/77956/elife-77956-fig1-data3-v2.zip
-
Figure 1—source data 4
Western blotting raw images in Figure 1C.
Related to Figure 1C.
- https://cdn.elifesciences.org/articles/77956/elife-77956-fig1-data4-v2.zip
-
Figure 1—source data 5
Western blotting raw images in Figure 1D.
Related to Figure 1D.
- https://cdn.elifesciences.org/articles/77956/elife-77956-fig1-data5-v2.zip
-
Figure 1—source data 6
Western blotting raw images in Figure 1E.
Related to Figure 1E.
- https://cdn.elifesciences.org/articles/77956/elife-77956-fig1-data6-v2.zip
-
Figure 1—source data 7
RAD-51 foci numbers graphed in Figure 1H.
Related to Figure 1H.
- https://cdn.elifesciences.org/articles/77956/elife-77956-fig1-data7-v2.xlsx
Figure 1—figure supplement 1
Validation of effectiveness of pph-4 RNAi and western blots of DSB-1.
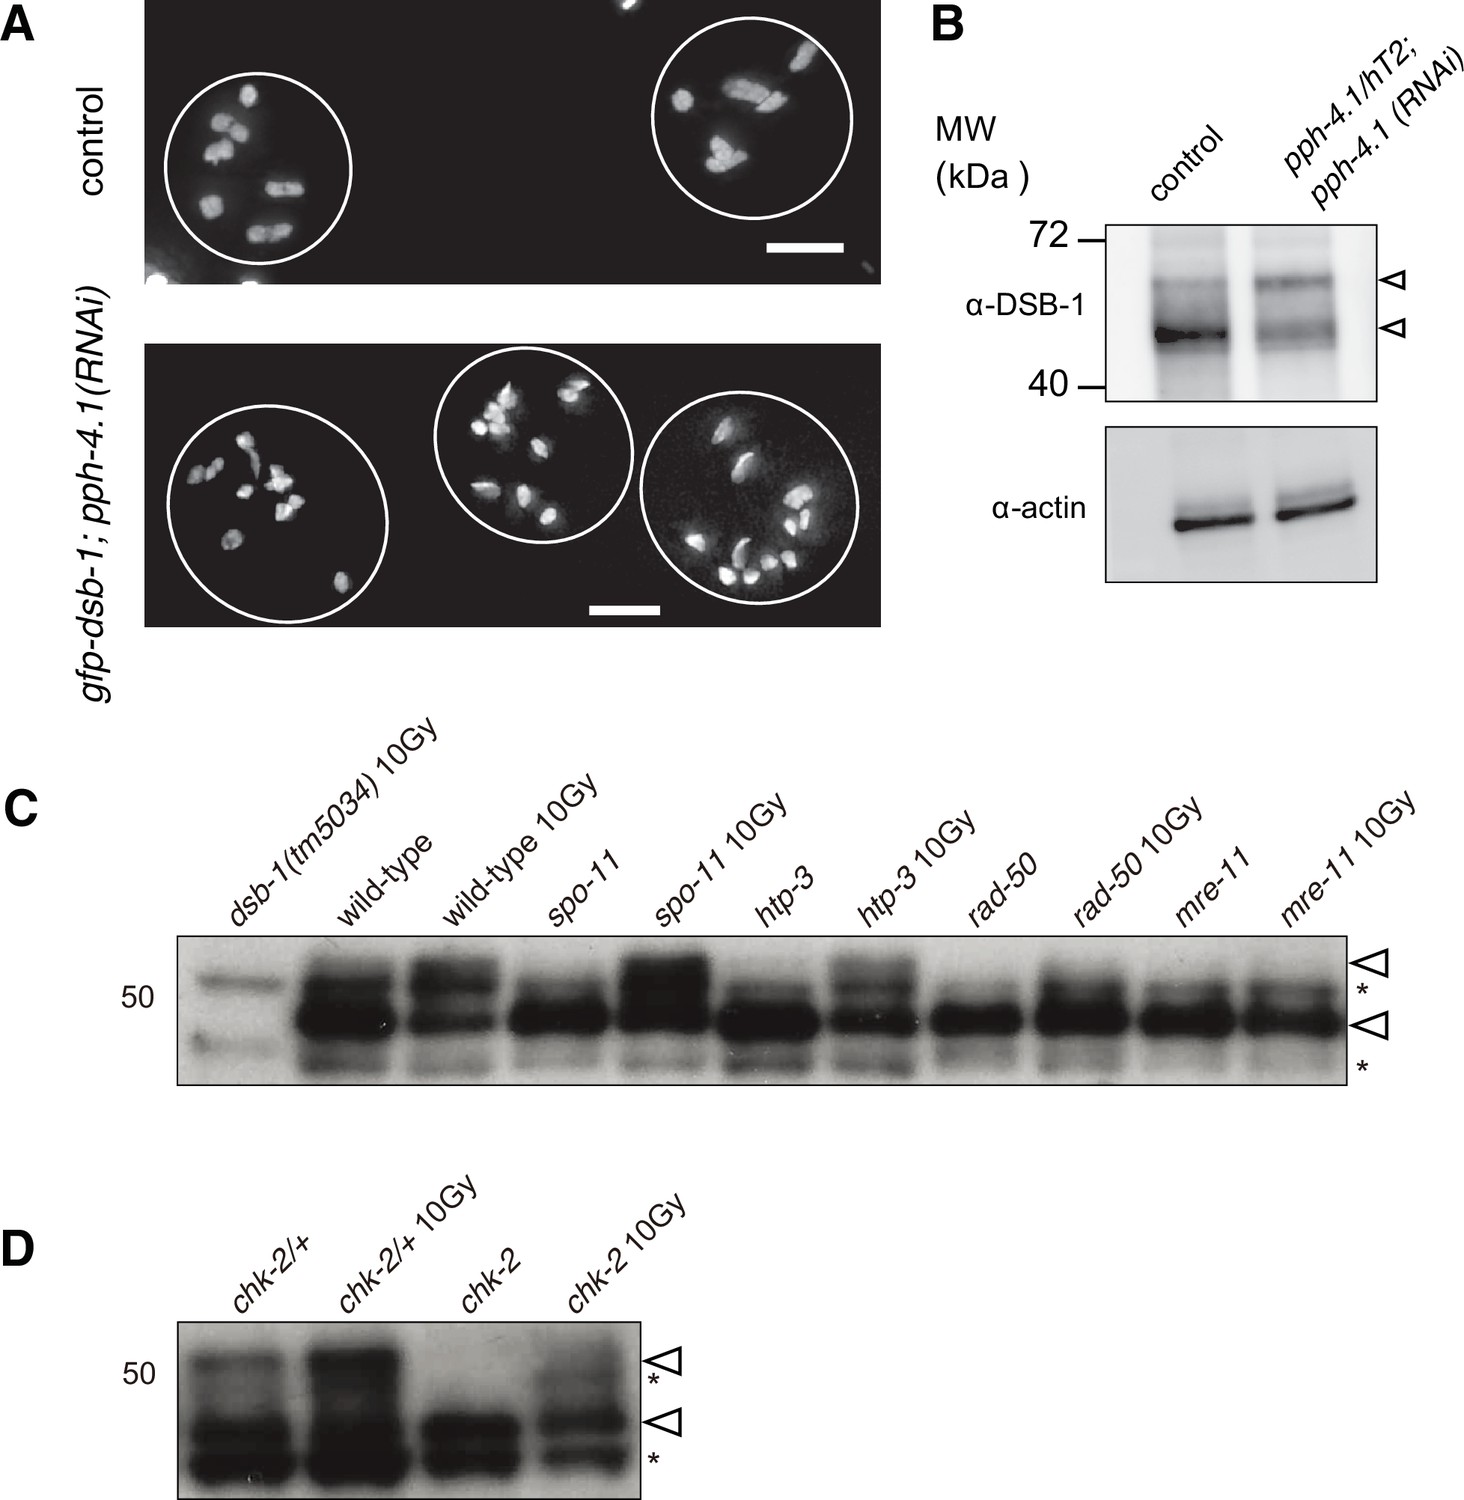
(A) Images of DAPI-stained diakinesis nuclei of control (N2) or gfp-dsb-1 treated with pph-4 RNAi. The control nuclei contained six bivalents while the majority of nuclei contained univalents in gfp-dsb-1; pph-4 (RNAi) animals. Scale bar, 5 μm. (B) Western blot of endogenous DSB-1. Extracts of young adults (24 hr post-L4 stage), from wild-type controls (left) or a mixed population of pph-4.1(tm1598) balanced heterozygous and homozygous mutants further treated with pph-4.1 RNAi (right), probed with α-DSB-1. A total protein of 100 µg was loaded in each lane. Loading controls (α-actin) are shown at bottom. Arrowheads indicate two bands in the blot (Figure 1—figure supplement 1—source data 1). (C, D) Western blots of endogenous DSB-1 in wild type (N2), spo-11(me44), htp-3(tm3655), rad-50(ok197), mre-11(ok179), or chk-2(me64) mutants in combination with 10 Gy γ-irradiation as indicated. Lysate from 50 animals at 24 hr post-L4 stage was loaded in each lane. Asterisks show two non-specific bands while arrowheads show two specific bands (Figure 1—figure supplement 1—source data 2, Figure 1—figure supplement 1—source data 3).
-
Figure 1—figure supplement 1—source data 1
Western blotting raw images in Figure 1—figure supplement 1B.
Related to Figure 1—figure supplement 1B.
- https://cdn.elifesciences.org/articles/77956/elife-77956-fig1-figsupp1-data1-v2.zip
-
Figure 1—figure supplement 1—source data 2
Western blotting raw images in Figure 1—figure supplement 1C.
Related to Figure 1—figure supplement 1C.
- https://cdn.elifesciences.org/articles/77956/elife-77956-fig1-figsupp1-data2-v2.zip
-
Figure 1—figure supplement 1—source data 3
Western blotting raw images in Figure 1—figure supplement 1D.
Related to Figure 1—figure supplement 1D.
- https://cdn.elifesciences.org/articles/77956/elife-77956-fig1-figsupp1-data3-v2.zip
Figure 1—figure supplement 2
Double-strand break (DSB) formation in atl-1 and atm-1 mutants.
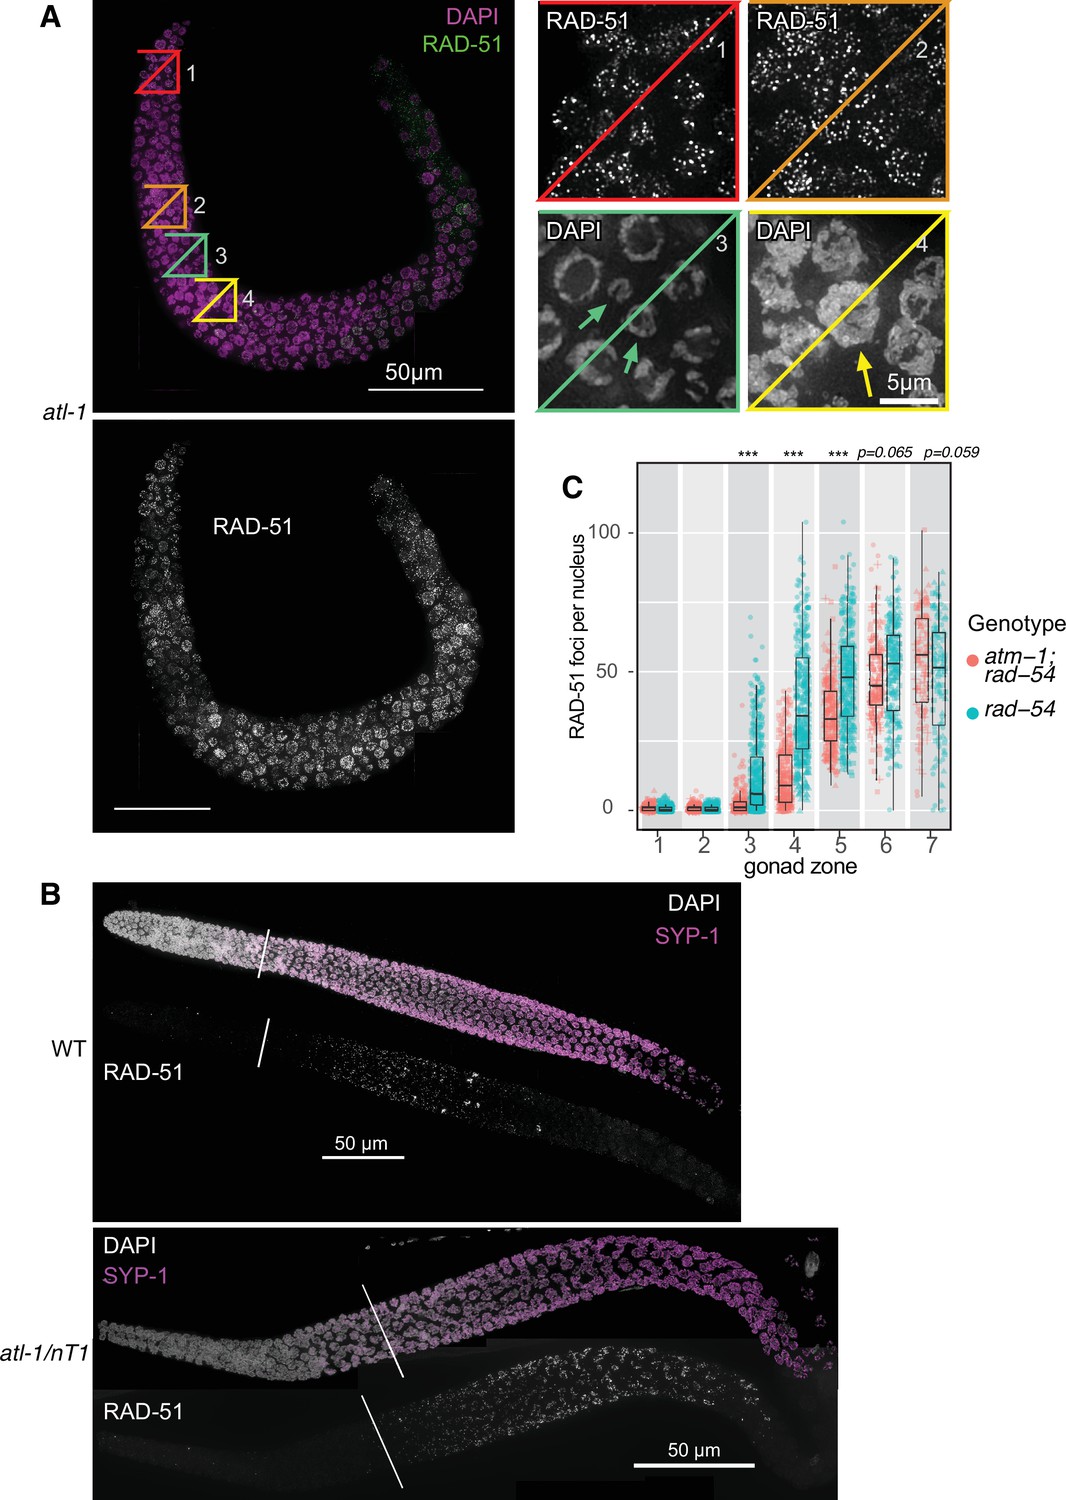
(A) Maximum-intensity projection of an entire gonad arm from an atl-1(tm853) mutant. Top left panel shows DAPI staining in magenta and RAD-51 staining in green. Bottom left panel shows RAD-51 foci in grayscale. Scale bar, 50 μm. Boxed insets on the top right show magnifications of the indicated color-matched regions highlighted on the left, which show numerous RAD-51 foci in both premeiotic and meiotic regions. Arrows indicate micronuclei resulting from improper mitotic division in box 3, and a large polyploid nucleus in box 4. Scale bar, 5 μm. (B) Top: Maximum-intensity projection of a wild-type gonad. Above, DAPI staining is shown in grayscale and SYP-1, a component of the synaptonemal complex, is shown in magenta. Below, RAD-51 is shown in grayscale. Diagonal line indicates the beginning of pachytene, before which few or no RAD-51 foci are seen. Bottom: Similar projection of a gonad from an atl-1(tm853)/nT1 mutant. Scale bar, 50 μm. (C) Quantitation of RAD-51 foci in each of seven zones, compared between rad-54 single mutants and atm-1(tm853); rad-54 double mutants. Data are presented as mean ± SEM. Four gonads were scored in atm-1(tm853); rad-54 and three gonads were scored in rad-54; the numbers of nuclei scored in zones 1–7 were as follows: for atm-1(tm853); rad-54, 149, 218, 247, 281, 248, 181, 115; for rad-54, 253, 314, 444, 398, 312, 237, 112. Significance was assessed via two-tailed t test, ***p<0.001 (Figure 1—figure supplement 2—source data 1).
-
Figure 1—figure supplement 2—source data 1
RAD-51 foci numbers graphed in Figure 1—figure supplement 2C.
Related to Figure 1—figure supplement 2C.
- https://cdn.elifesciences.org/articles/77956/elife-77956-fig1-figsupp2-data1-v2.xlsx
Figure 2 with 2 supplements

The dsb-1(5A) mutation rescues double-strand break (DSB) defect and viability loss of pph-4.1 mutants.
(A) A schematic diagram of the DSB-1 protein sequence. Green regions indicate intrinsically disordered regions from the D2P2 database (Oates et al., 2013). Five serines which were mutated into alanines in dsb-1(5A) within the SQ sites are shown in magenta, and sites conserved in 10 or more of the 11 Caenorhabditis in the elegans group (see Figure 2—figure supplement 1) are indicated with a star. (B) Immunofluorescence images of RAD-51 foci in mid-pachytene nuclei of indicated genotypes. Scale bar, 5 μm. (C) Quantification of RAD-51 foci in the gonads of indicated genotypes in (B). Data are presented as mean ± SEM; four gonads were scored in each genotype; the numbers of nuclei scored in zones 1–7 were as follows: for wild type, 162, 201, 204, 230, 209, 155, 105; for pph-4.1(tm1598), 145, 174, 201, 188, 167, 149, 74; for dsb-1(5A), 175, 220, 197, 163, 143, 116, 90; for pph-4.1(tm1598); dsb-1(5A), 171, 152, 121, 180, 185, 137, 85. Significance were assessed via the two-tailed t tests, **p<0.01, ****p<0.0001 (Figure 2—source data 1). (D) Left: Male progeny percentage indicating the rate of X chromosome nondisjunction during meiosis in wild type, pph-4.1(tm1598) and pph-4.1(tm1598); dsb-1(5A) mutants; circle size corresponds to total number of adult animals scored. Right: Embryonic viability percentage of the indicated genotypes; circle size corresponds to total number of eggs laid. The center indicates the median, the box denotes the 1st and 3rd quartiles, and the vertical line shows the 95% confidence interval (Figure 2—source data 2).
-
Figure 2—source data 1
RAD-51 foci numbers graphed in Figure 2C.
Related to Figure 2C.
- https://cdn.elifesciences.org/articles/77956/elife-77956-fig2-data1-v2.xlsx
-
Figure 2—source data 2
Brood size and number of viable progeny in the genotypes indicated in Figure 2D.
Related to Figure 2D.
- https://cdn.elifesciences.org/articles/77956/elife-77956-fig2-data2-v2.xlsx
Figure 2—figure supplement 1
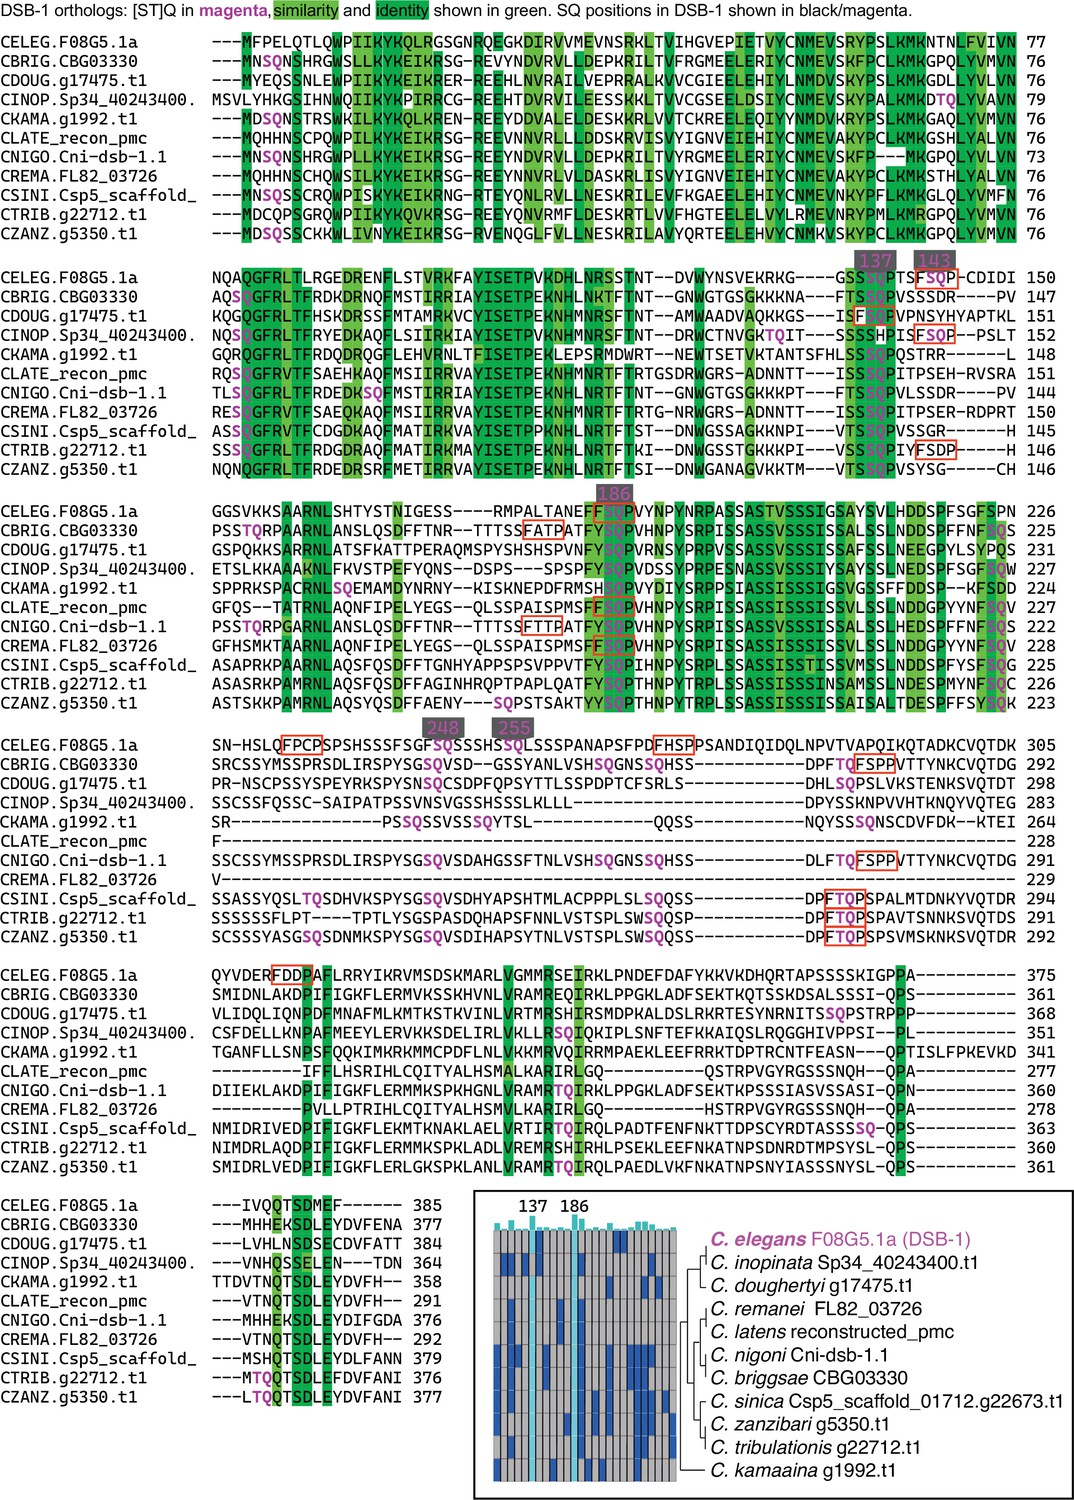
Sequence alignment of DSB-1 orthologs.
Multiple sequence alignment (MSA) of DSB-1 orthologs in 11 Caenorhabditis. [ST]Q sites are depicted in magenta. FXXP sites are boxed in red. The region of all proteins scored as intrinsically disordered is highlighted in orange. Similarity and identity are shown in shades of green. The five SQ sites of DSB-1 in Caenorhabditis elegans are highlighted in black. Right bottom: All [ST]Q sites in the 11 species shown as a grid: sorted by their position from left to right in the alignment, dark blue indicates presence of an [ST]Q site shared by up to 9 species; cyan indicates a site shared by 10 or 11 species. Species and protein names are shown at right, along with an unrooted, unscaled phylogenetic tree to show relatedness of each species (Stevens et al., 2019).
Figure 2—figure supplement 2
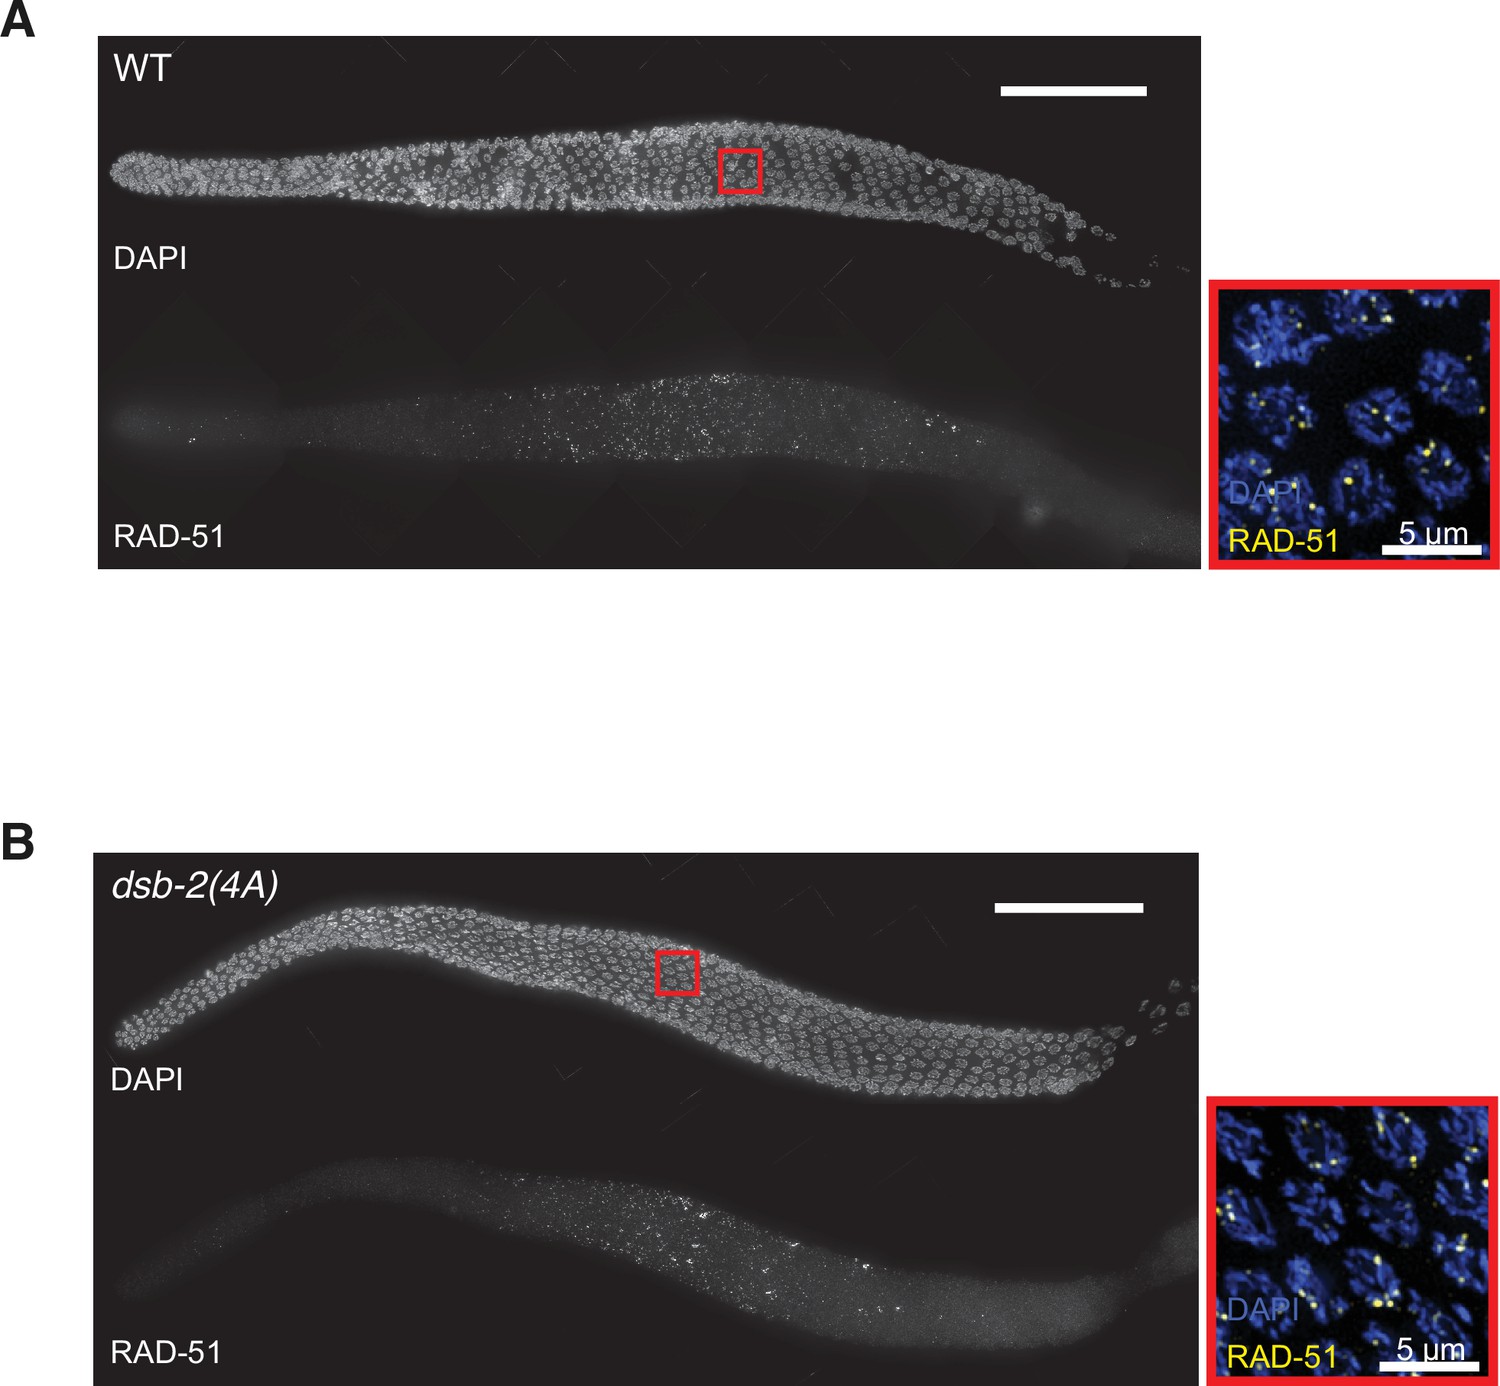
Double-strand break (DSB) formation in dsb-2 non-phosphorylatable mutant.
(A) A maximum-intensity projection of an entire gonad from wild type with the DAPI staining on the top and RAD-51 staining at the bottom in grayscale. Scale bar, 50 μm. Boxed inset on the right shows the magnifications of the nuclei with DAPI (blue) and RAD-51 (yellow) staining in the indicated region highlighted on the left. Scale bar, 5 μm. (B) Similar projection of a gonad from a dsb-2(4A) mutant.
Figure 3 with 1 supplement
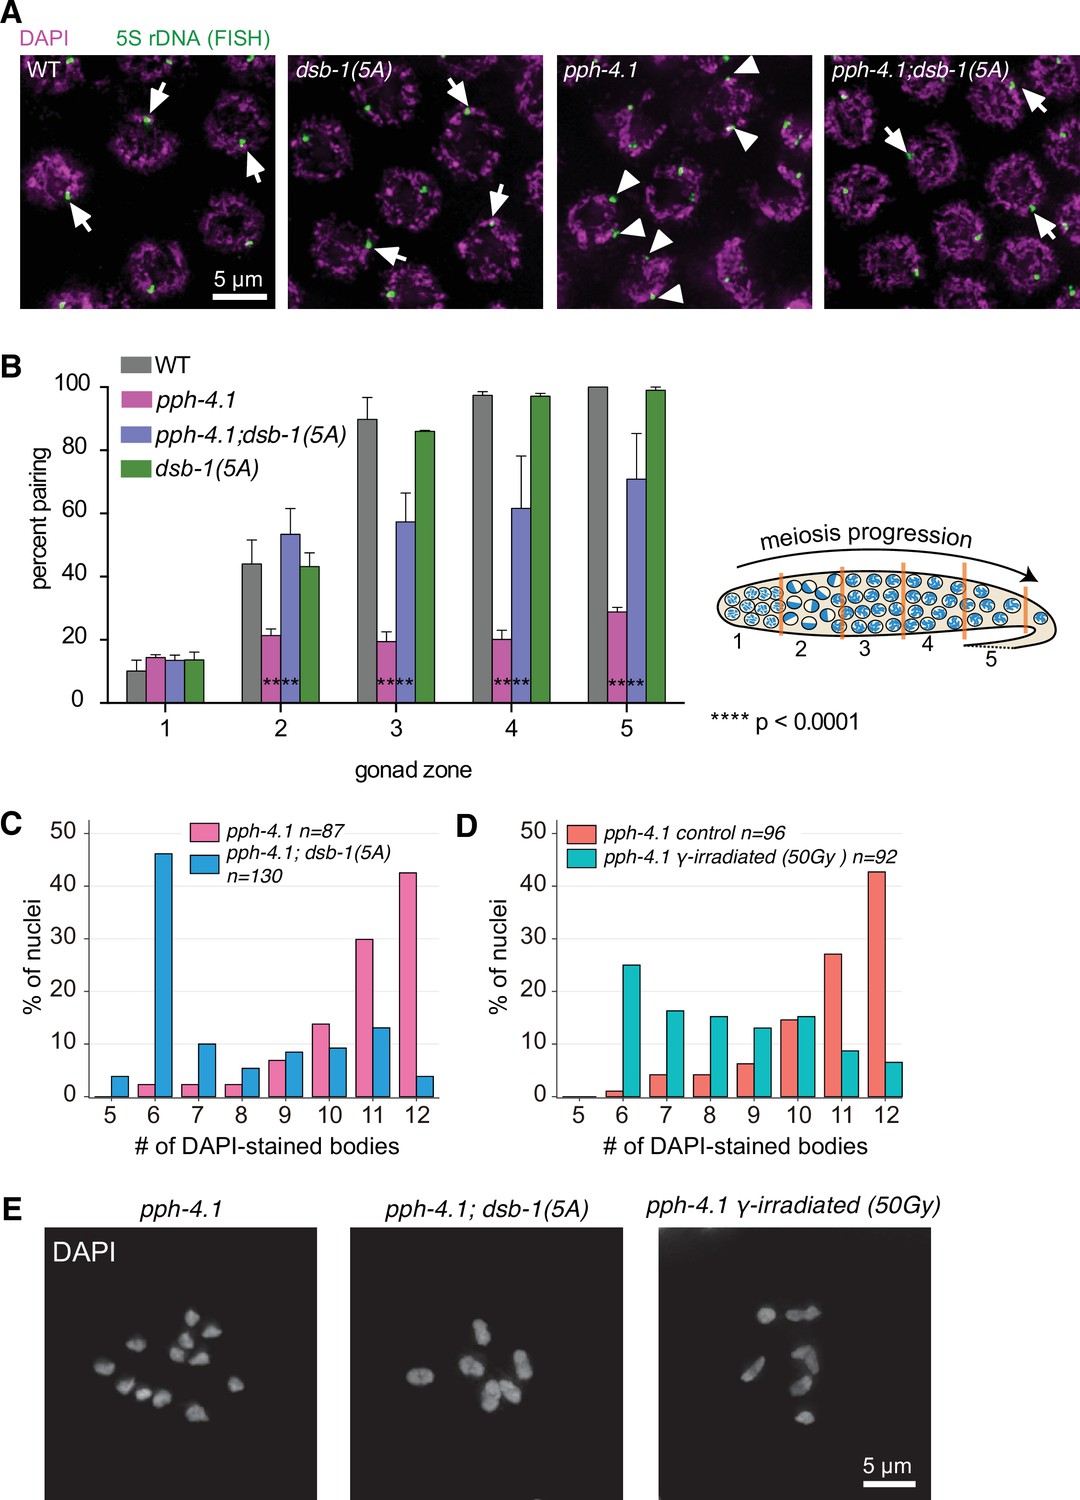
Chiasma formation and homologous pairing defects are partially rescued by the dsb-1(5A) allele in pph-4.1 mutants.
(A) FISH images show paired 5S rDNA sites in wild type, dsb-1(5A) and pph-4.1(tm1598); dsb-1(5A) worms (arrows indicate paired foci), and unpaired sites in pph-4.1(tm1598) mutants (arrowheads indicate unpaired foci) at pachytene. Scale bar, 5 μm. (B) Left: Quantification of pairing for chromosome V shown as the percent of nuclei with paired signals in each zone. Data are presented as mean ± SEM, two gonads were scored for wild type; three gonads were scored for dsb-1(5A); four gonads were scored for pph-4.1(tm1598) and pph-4.1(tm1598); dsb-1(5A). The total number of nuclei scored for zones 1–5 respectively was as follows: for wild type, 111, 150, 125, 95, 32; for dsb-1(5A), 181, 228, 222, 143, 59; for pph-4.1(tm1598), 300, 283, 257, 219, 124; for pph-4.1(tm1598); dsb-1(5A), 335, 318, 266, 224, 137. Significance was assessed by chi-squared test for independence, ****p<0.0001. Right: Schematic showing a hermaphrodite gonad divided into five equally sized zones for FISH focus scoring (Figure 3—source data 1). (C) The number of DAPI-stained bodies shown as percentages of the indicated number of diakinesis oocyte nuclei scored for pph-4.1(tm1598) and pph-4.1(tm1598); dsb-1(5A) mutants. The numbers of nuclei scored for each genotype were: 87 for pph-4.1(tm1598), 130 for pph-4.1(tm1598); dsb-1(5A) (Figure 3—source data 2). (D) The number of DAPI-stained bodies shown as percentages of the indicated number of diakinesis oocyte nuclei scored in pph-4.1(tm1598) mutants with or without 50 Gy γ-irradiation. The numbers of nuclei scored for each genotype were: 96 for pph-4.1(tm1598) control, 92 for pph-4.1(tm1598) γ-irradiated (Figure 3—source data 3). (E) Images of DAPI-stained diakinesis nuclei in a pph-4.1(tm1598) mutant and a pph-4.1(tm1598); dsb-1(5A) double mutant, as well as a pph-4.1(tm1598) mutant exposed to 50 Gy of γ-irradiation. Scale bar, 5 μm.
-
Figure 3—source data 1
Number of paired and unpaired nuclei in the genotypes indicated in Figure 3B.
Related to Figure 3B.
- https://cdn.elifesciences.org/articles/77956/elife-77956-fig3-data1-v2.xlsx
-
Figure 3—source data 2
Number of nuclei with indicated DAPI body numbers of each genotype in Figure 3C.
Related to Figure 3C.
- https://cdn.elifesciences.org/articles/77956/elife-77956-fig3-data2-v2.xlsx
-
Figure 3—source data 3
Number of nuclei with indicated DAPI body numbers of each genotype in Figure 3D.
Related to Figure 3D.
- https://cdn.elifesciences.org/articles/77956/elife-77956-fig3-data3-v2.xlsx
Figure 3—figure supplement 1
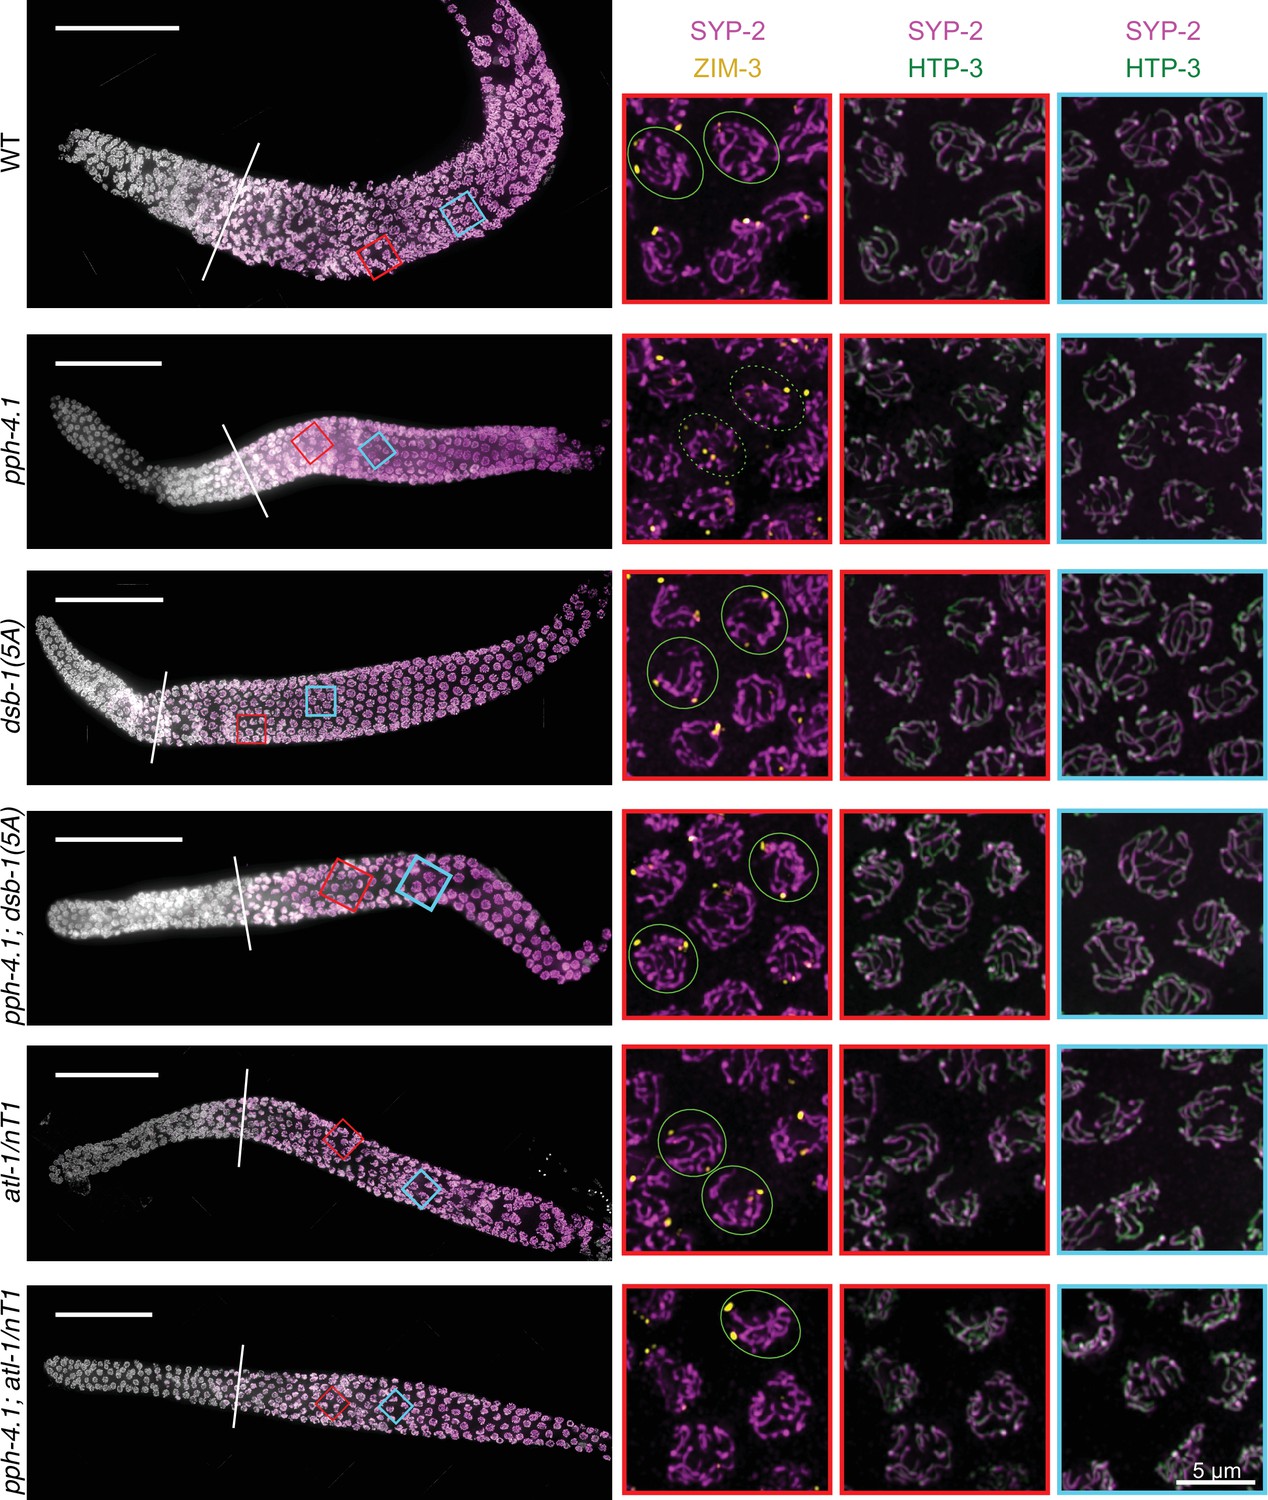
Synapsis in pph-4.1; dsb-1(5A) and pph-4.1; atl-1/nT1 mutants.
Immunofluorescence images of wild-type, pph-4.1 (tm1598), dsb-1(5A), pph-4.1(tm1598); dsb-1(5A), atl-1/nT1 and pph-4.1(tm1598); atl-1/nT1 mutants. Left panel shows the maximum-intensity projection of a gonad arm from the premeiotic region to late pachytene of each indicated genotype. DAPI staining is shown in grayscale and SYP-2, a central element of the synaptonemal complex, is shown in magenta. Diagonal line indicates the leptotene/zygotene transition zone where synapsis begins. Scale bar, 50 μm. Boxed insets on the right show the magnifications of the nuclei in the indicated color-matched regions highlighted on the left. ZIM-3 staining, detecting the pairing centers of chromosome I (right end) and IV (left end), is shown in yellow; HTP-3, an axial element protein is shown in green and SYP-2 staining is shown in magenta. After homologous pairing and synapsis, two ZIM-3 foci per nucleus are expected to be seen. Green circles show examples of three ZIM-3 foci per nucleus, each connected to SYP-2 stretches, in pph-4.1(tm1598) single mutants, indicating non-homologous synapsis; while double mutants of pph-4.1(tm1598); dsb-1(5A) show increased number of homologously paired ZIM-3 foci (two foci per nucleus, shown in green circle), indicating rescued homologous synapsis. Complete colocalization of HTP-3 and SYP-2 indicates the fully synapsed chromosomes in each genotype. Scale bar, 5 μm.
Figure 4
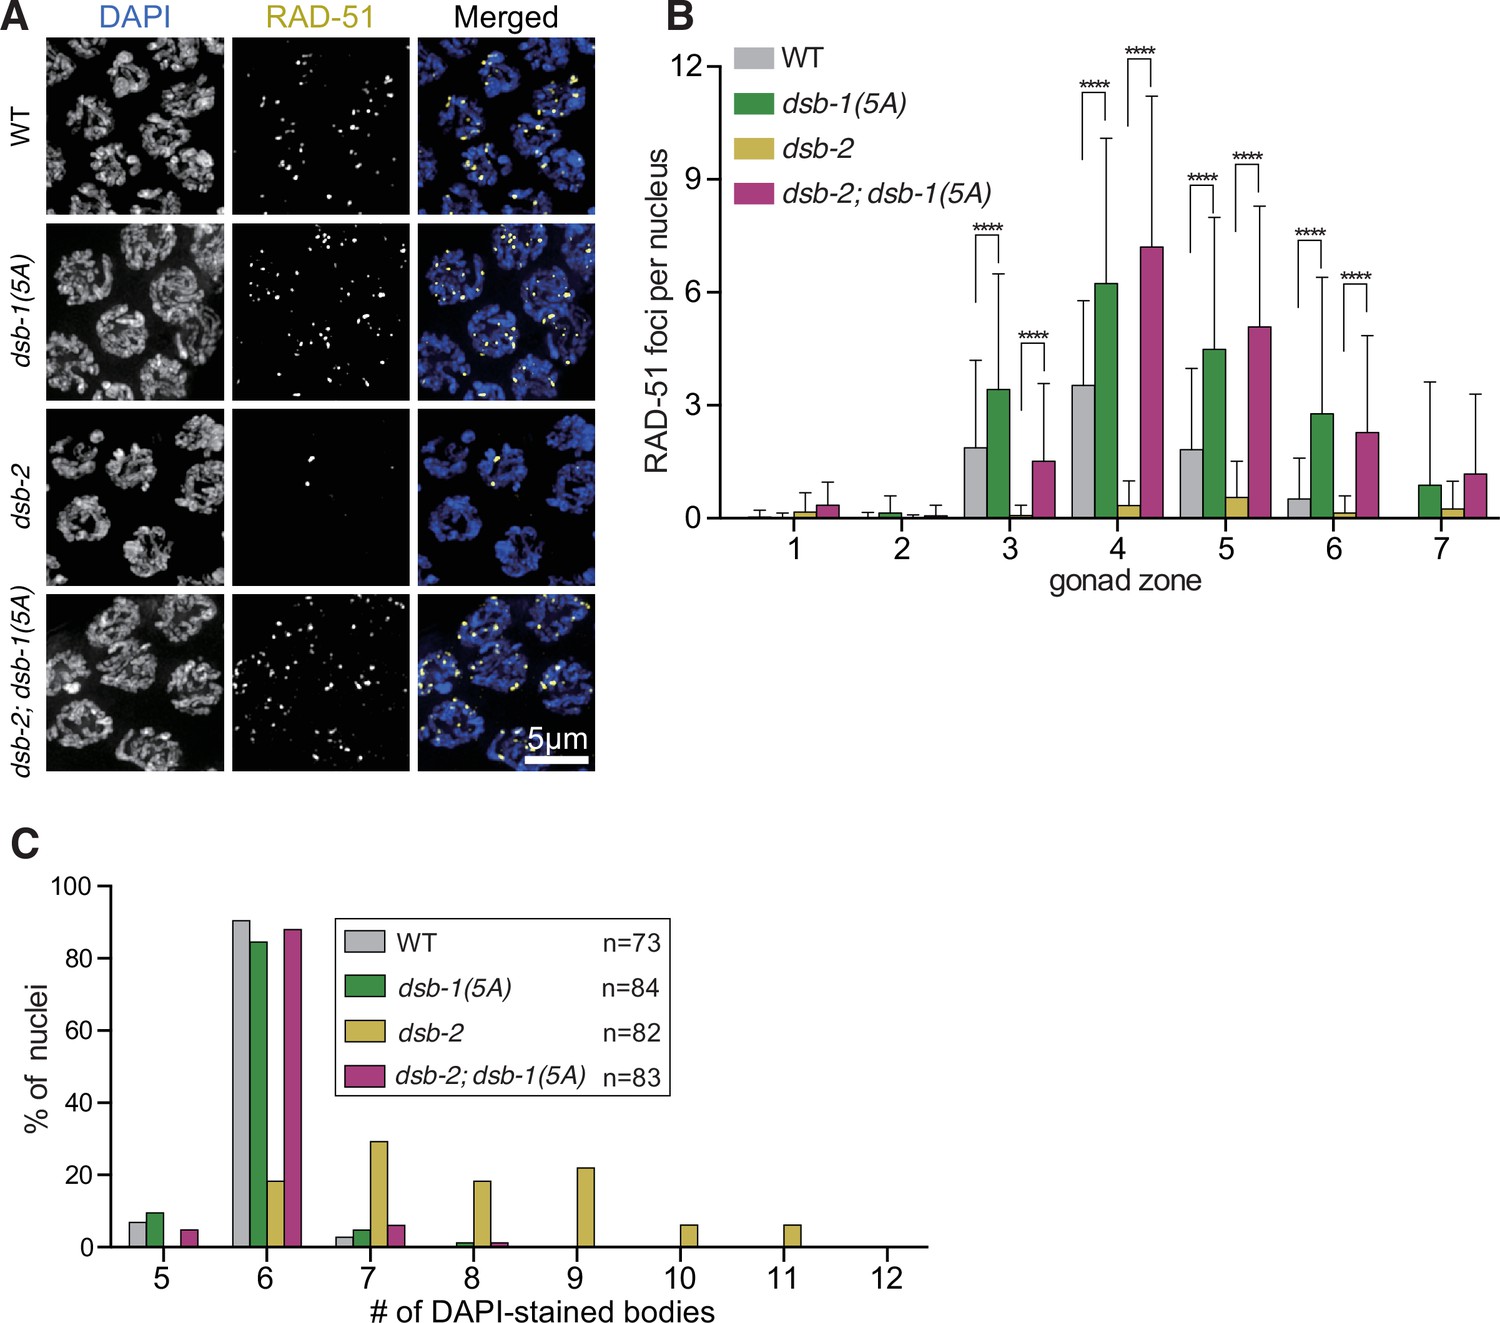
The dsb-1(5A) mutation rescues double-strand break (DSB) and crossover formation in dsb-2 mutants.
(A) Immunofluorescence images of RAD-51 foci in mid-pachytene nuclei of the indicated genotypes. Scale bar, 5 μm. (B) Quantification of RAD-51 foci in the gonads of the genotypes indicated in (A). Data are presented as mean ± SEM; three gonads were scored in dsb-2(me96), dsb1(5A), and dsb-2(me96); dsb-1(5A), respectively, and two gonads were scored in wild type; the numbers of nuclei scored in zones 1–7 were as follows: for wild type, 57, 99, 112, 123, 109, 62, 27; for dsb-2(me96), 124, 105, 108, 114, 108, 84, 53; for dsb-1(5A), 126, 119, 103, 118, 116, 101, 79; for dsb-2(me96); dsb-1(5A), 94, 131, 118, 91, 93, 96, 71. Significance was assessed via two-tailed t test, ****p<0.0001 (Figure 4—source data 1). (C) The number of DAPI-stained bodies shown as percentages of the indicated number of diakinesis oocyte nuclei scored for each genotype. The numbers of nuclei scored for each genotype were: 73 for wild type, 84 for dsb-1(5A), 82 for dsb-2(me96), 83 for dsb-2(me96); dsb-1(5A) (Figure 4—source data 2).
-
Figure 4—source data 1
RAD-51 foci numbers graphed in Figure 4B.
Related to Figure 4B.
- https://cdn.elifesciences.org/articles/77956/elife-77956-fig4-data1-v2.xlsx
-
Figure 4—source data 2
Number of nuclei with indicated DAPI body numbers of each genotype in Figure 4C.
Related to Figure 4C.
- https://cdn.elifesciences.org/articles/77956/elife-77956-fig4-data2-v2.xlsx
Figure 5 with 2 supplements
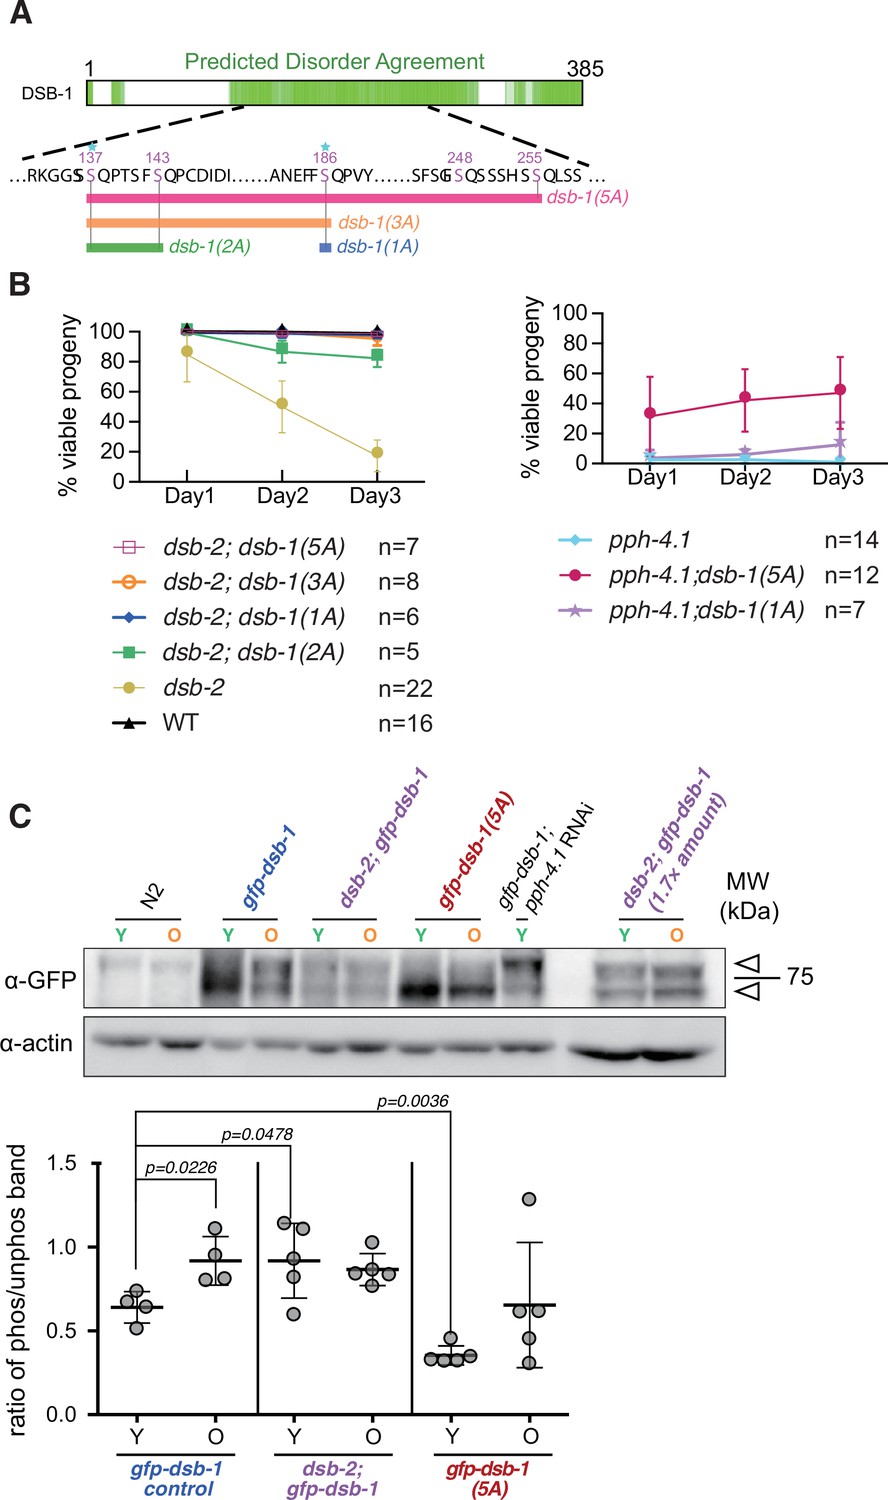
Alanine substitution of serine 186 in DSB-1 suffices to rescue the dsb-2 mutation.
(A) Diagram depicting a series of dsb-1 phospho mutants: dsb-1(1A) is dsb-1(S186A); dsb-1(2A) is dsb-1(S137A; S143A); dsb-1(3A) is dsb-1(S137A; S143A; S186A) and dsb-1(5A) is dsb-1(S137A; S143A; S186A; S248A; S255A). (B) The frequency of viable embryos from eggs laid by hermaphrodites of the indicated genotypes during the indicated time interval after the L4 larval stage. Data are presented as mean ± SEM from at least five biological replicates (Figure 5—source data 1). (C) Top: Western blots of GFP-fused DSB-1 from young adults (Y, 24 hr post-L4 larval stage) and old adults (O, 72 hr post-L4 larval stage) of the indicated genotypes, probed with α-GFP; arrowheads indicate the two GFP-DSB-1- specific bands in the blot. A total protein amount of 97 µg was loaded in each lane except for the two lanes of dsb-2; gfp-dsb-1 double mutants on the right, in which 162 µg protein was loaded in each lane. Loading controls (α-actin) are shown at bottom. Bottom: Quantified band intensity ratio of phos-GFP-DSB-1 to non-phos-GFP-DSB-1 in the indicated genotypes. Data are presented as mean ± SD from at least two biological replicates. Significance was assessed via two-tailed t test with Welch’s correction (Figure 5—source data 2, Figure 5—source data 2).
-
Figure 5—source data 1
Number of daily laid viable progeny of the indicated genotypes in Figure 5B.
Related to Figure 5B.
- https://cdn.elifesciences.org/articles/77956/elife-77956-fig5-data1-v2.xlsx
-
Figure 5—source data 2
Intensity of phos-GFP-DSB-1 and non-phos-GFP band in Figure 5C.
Related to Figure 5C.
- https://cdn.elifesciences.org/articles/77956/elife-77956-fig5-data2-v2.xlsx
-
Figure 5—source data 3
Western blotting raw images in Figure 5C.
Related to Figure 5C.
- https://cdn.elifesciences.org/articles/77956/elife-77956-fig5-data3-v2.zip
Figure 5—figure supplement 1
Double-strand break (DSB) formation in a series of dsb-1 non-phosphorylatable mutants.
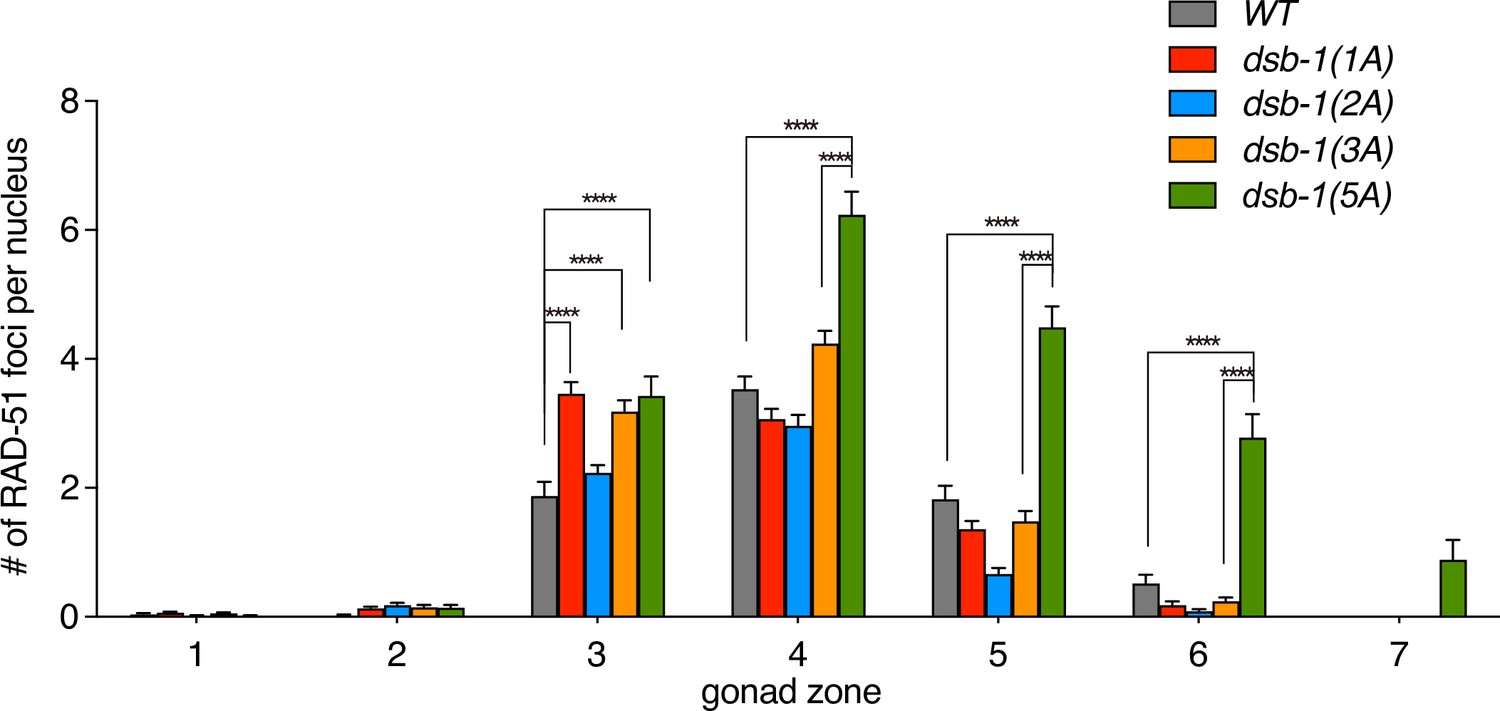
Quantification of RAD-51 foci in the gonads of the indicated genotypes (data of wild type and dsb-1(5A) were duplicated from Figure 4B). Data are presented as mean ± SEM, three gonads were scored for dsb-1(1A), dsb-1(2A), and dsb-1(3A); the numbers of nuclei scored in zones 1–7 were as follows: for dsb-1(1A), 147, 183, 191, 169, 133, 84, 22; for dsb-1(2A), 151, 174, 206, 194, 138, 82, 24; for dsb-1(3A), 190, 192, 164, 157, 103, 67, 27. Significance was assessed via two-tailed t test; ****P<0.0001. (Figure 5—figure supplement 1—source data 1).
-
Figure 5—figure supplement 1—source data 1
RAD-51 foci numbers graphed in Figure 5—figure supplement 1.
Related to Figure 5—figure supplement 1.
- https://cdn.elifesciences.org/articles/77956/elife-77956-fig5-figsupp1-data1-v2.xlsx
Figure 5—figure supplement 2
Double-strand break (DSB) formation and synapsis in pph-4.1; dsb-1(1A) and dsb-2; dsb-1(1A) mutants.
(A) Immunofluorescence images of wild type, dsb-1(1A), dsb-2(me96), dsb-2(me96); dsb-1(1A), pph-4.1(tm1598), and pph-4.1(tm1598); dsb-1(1A) mutants. Maximum-intensity projections of nuclei at mid-pachytene are shown with DAPI staining in blue and RAD-51 staining in yellow. Scale bar, 5 μm. (B) Quantification of RAD-51 foci in the gonads of the genotypes indicated in (A) (data of wild type and dsb-2(me96) were duplicated from Figure 4B, data of pph-4.1(tm1598) was duplicated from Figure 2C, data of dsb-1(1A) was duplicated from Figure 5—figure supplement 1). Data are presented as mean ± SEM from at least three biological replicates, three gonads were scored for dsb-2(me96); dsb-1(1A) and pph-4.1(tm1598); dsb-1(1A). The numbers of nuclei scored in zones 1–7 were as follows: for dsb-2(me96); dsb-1(1A), 174, 189, 181, 187, 145, 89, 27; for pph-4.1(tm1598); dsb-1(1A), 166, 177, 199, 234, 205, 130, 34. Significance was assessed via two-tailed t test; ****P<0.0001. (Figure 5—figure supplement 2—source data 1). (C) Immunofluorescence images showing the synapsis in wild type and pph-4.1(tm1598); dsb-1(1A). Staining of ZIM-3 (yellow) and SYP-2 (magenta) was used to detect homologous synapsis, arrows in wild type point to examples of two homologously synapsed foci per nucleus, while arrowheads in pph-4.1(tm1598); dsb-1(1A) mutant show three synapsed foci, indicating non-homologous synapsis. Full colocalization of HTP-3 (green) and SYP-2 (magenta) in pph-4.1(tm1598); dsb-1(1A) mutant as well as wild type indicates the fully synapsed chromosomes. Scale bar, 5 μm.
-
Figure 5—figure supplement 2—source data 1
RAD-51 foci numbers graphed in Figure 5—figure supplement 2B.
Related to Figure 5—figure supplement 2B.
- https://cdn.elifesciences.org/articles/77956/elife-77956-fig5-figsupp2-data1-v2.xlsx
Figure 6 with 1 supplement
Structural prediction of double-strand break (DSB) factors and their interaction.
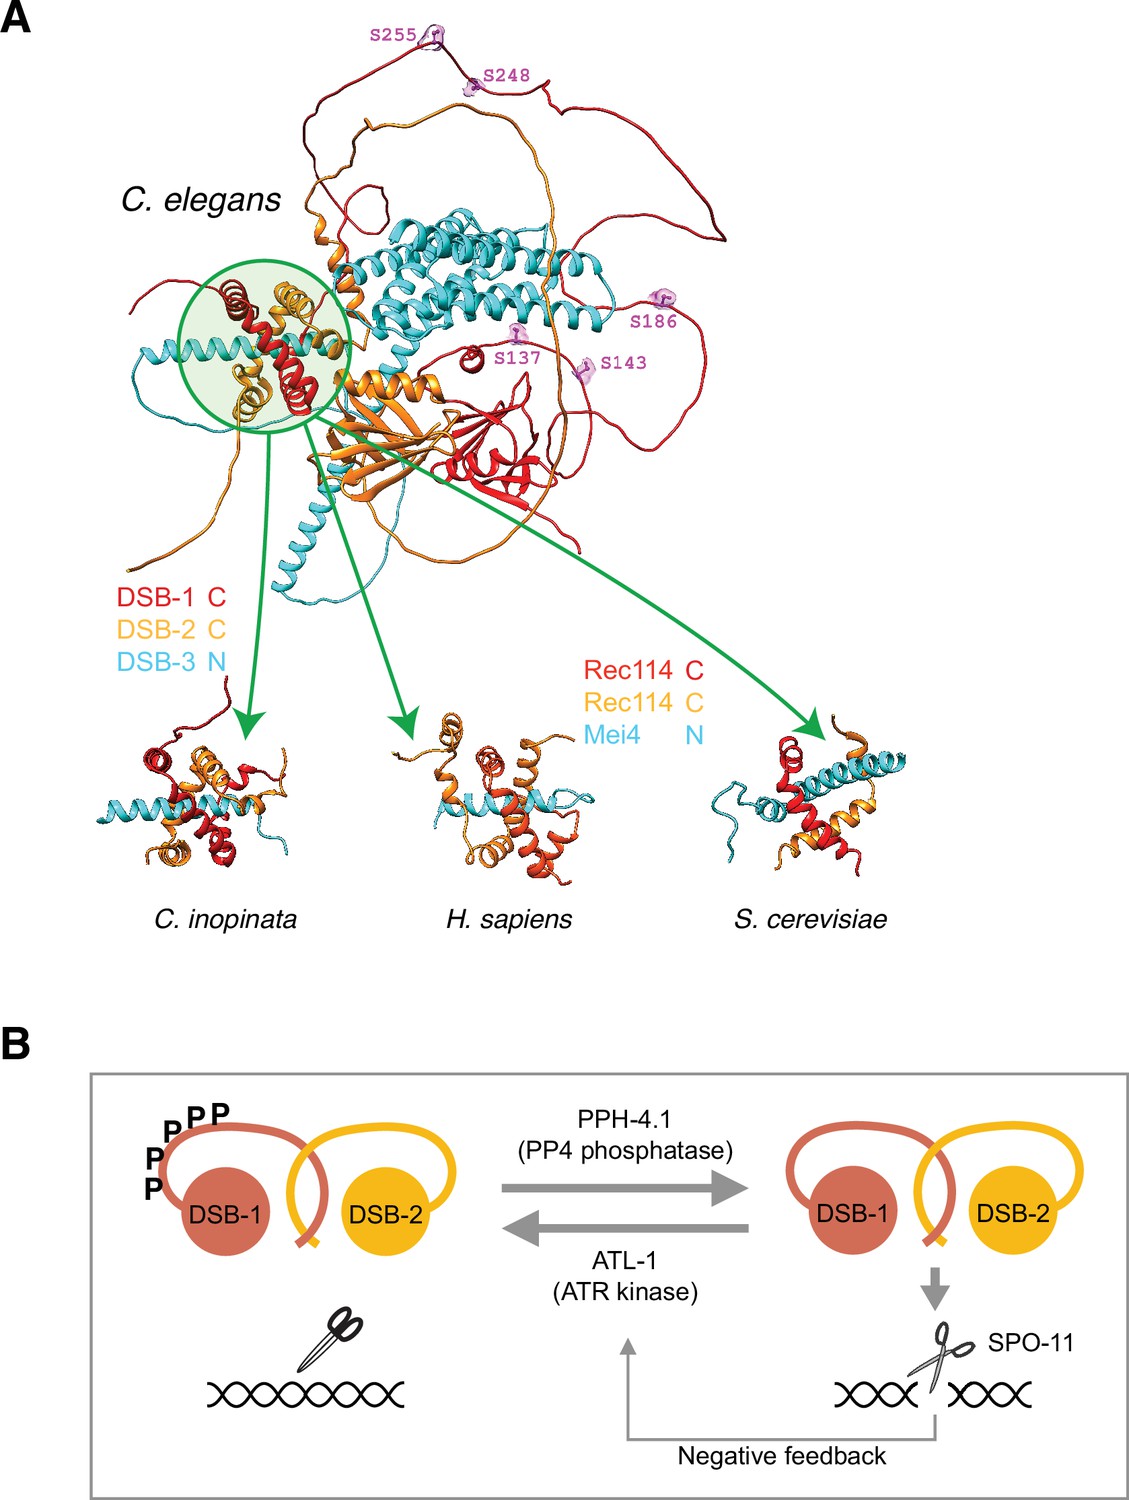
(A) A representative structure of the DSB-1, DSB-2, and DSB-3 heterotrimer predicted by the AlphaFold structure prediction pipeline (Jumper et al., 2021; Mirdita et al., 2021) is shown at top. Green circle highlights the region predicted to be the trimerization interface containing the C-termini of DSB-1 and -2, and the N-terminus of DSB-3. ATM/ATR kinase phosphorylation consensus sites in the predicted disordered loop of DSB-1 are shown in magenta and labeled. Sub-regions of similar structures predicted for orthologs of DSB-1, DSB-2, and DSB-3 in the Caenorhabditis elegans sister species Caenorhabditis inopinata, as well as the putative Rec114/Rec114/Mei4 heterotrimer in human and budding yeast, are shown below. In all cases a predicted N-terminal alpha-helix of the Mei4 ortholog (DSB-3) transfixes a channel formed by the predicted C-terminal helices of the Rec114 orthologs wrapping around each other (Figure 6—source data 1). (B) A model showing antagonistic action of ATL-1 and PPH-4.1 in DSB-1 regulation.
-
Figure 6—source data 1
AlphaFold prediction files and settings (ZIP).
Related to Figure 6A.
- https://cdn.elifesciences.org/articles/77956/elife-77956-fig6-data1-v2.zip
Figure 6—figure supplement 1
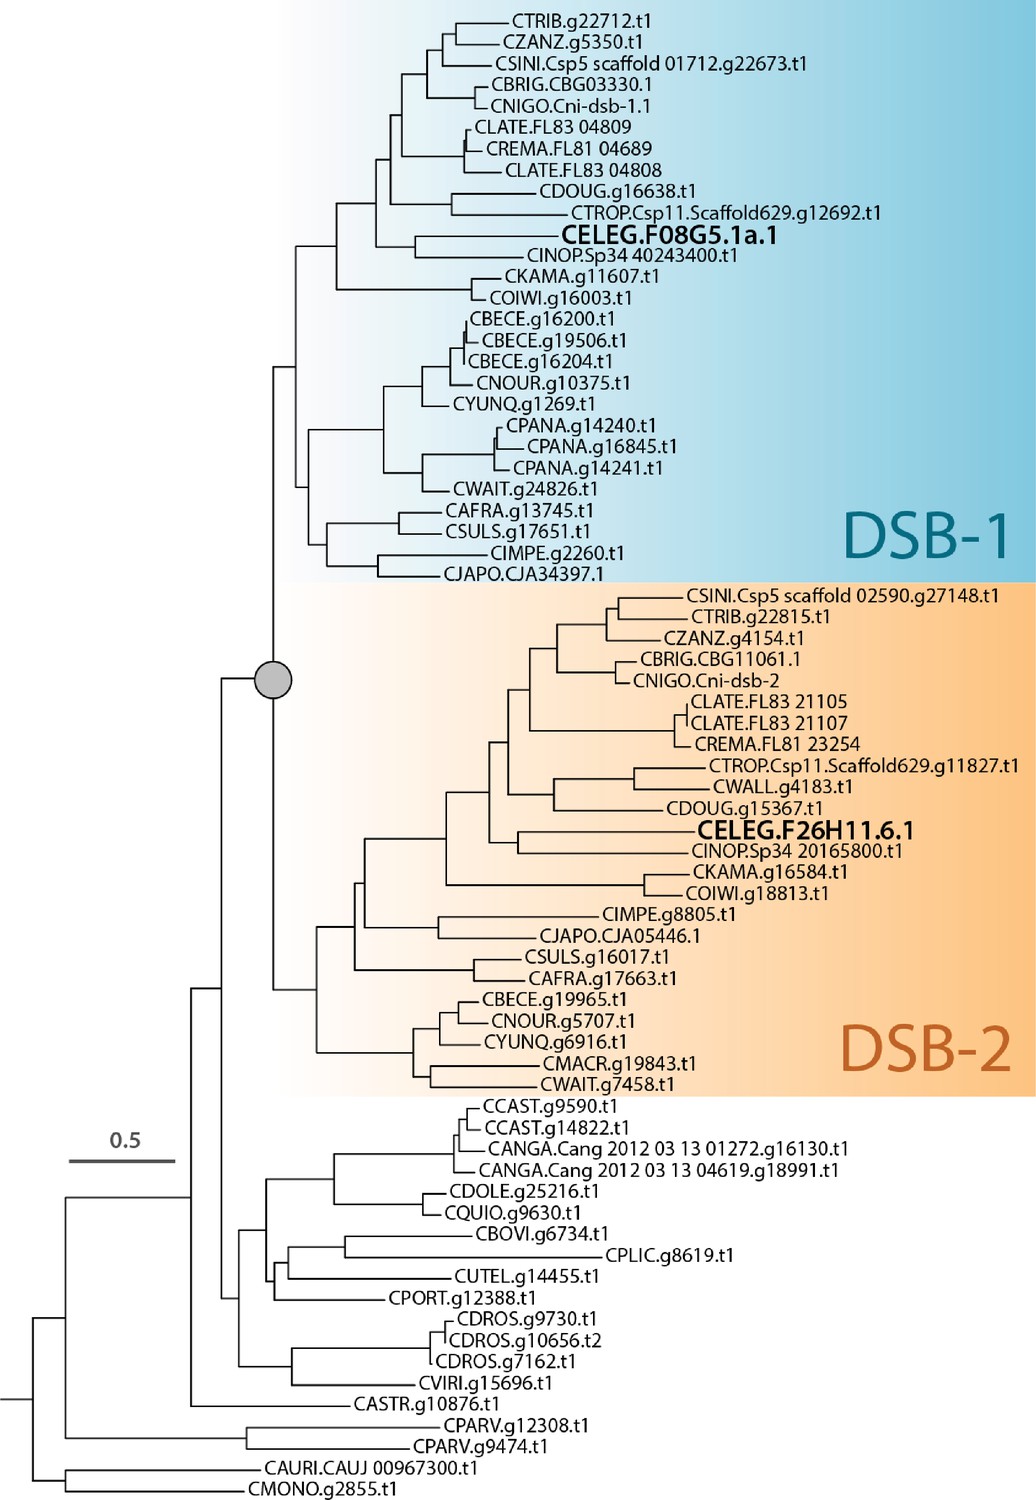
Phylogenetic prediction of double-strand break (DSB) factors.
Maximum likelihood gene tree of DSB-1/2 homologs in the genus Caenorhabditis.
Tables
Table 1
Embryonic viability, male progeny percentage indicating the rate of X chromosome nondisjunction, and total number of scored embryos is shown for hermaphrodite self-progeny of the indicated genotypes (Table 1—source data 1).
| Genotype | Embryonic viability (%) | Male percentage (%) | Total # eggs scored |
|---|---|---|---|
| WT | 99.28 | 0.04 | 1990 |
| gfp-dsb-1 | 99.10 | 0.19 | 2578 |
| dsb-1(1A) | 98.47 | 0.15 | 3427 |
| dsb-1(2A) | 98.25 | 0.00 | 1347 |
| dsb-1(3A) | 99.29 | 0.19 | 2056 |
| dsb-1(5A) | 99.22 | 0.00 | 2546 |
| pph-4.1(tm1598) | 2.00 | 45.60 | 1424 |
| dsb-2(me96) | 39.55 | 13.85 | 3413 |
| dsb-2(me96); dsb-1(1A) | 93.96 | 1.40 | 3370 |
| dsb-2(me96); dsb-1(2A) | 83.12 | 3.31 | 2413 |
| dsb-2(me96); dsb-1(3A) | 97.56 | 0.64 | 2395 |
| dsb-2(me96); dsb-1(5A) | 98.64 | 0.04 | 1596 |
| pph-4.1(tm1598); dsb-1(1A) | 7.39 | 32.21 | 496 |
| pph-4.1(tm1598); dsb-1(5A) | 40.89 | 7.89 | 1273 |
-
Table 1—source data 1
Brood size and number of viable progeny of the genotypes indicated in Table 1.
Related to Table 1.
- https://cdn.elifesciences.org/articles/77956/elife-77956-table1-data1-v2.xlsx
Key resources table
| Reagent type (species) or resource | Designation | Source or reference | Identifiers | Additional information |
|---|---|---|---|---|
| Gene (Caenorhabditis elegans) | dsb-1 | WormBase/Stamper et al., 2013 PMID:23990794 | WormBase ID:WBGene00008580 | |
| Gene (Caenorhabditis elegans) | pph-4.1 | WormBase/Sato-Carlton et al., 2014 PMID:25340746 | WormBase ID:WBGene00004085 | |
| Gene (Caenorhabditis elegans) | atl-1 | WormBase | WormBase ID:WBGene00000226 | |
| Gene (Caenorhabditis elegans) | atm-1 | WormBase | WormBase ID:WBGene00000227 | |
| Gene (Caenorhabditis elegans) | dsb-2 | WormBase/Rosu et al., 2013 PMID:23950729 | WormBase ID:WBGene00194892 | |
| Strain, strain background (Escherichia coli) | pph-4.1 RNAi-L4440 in HT115 | Sato-Carlton et al., 2014 PMID:25340746 | ||
| Strain, strain background (Escherichia coli) | L4440 in HT115 | Ahringer Lab RNAi library (Source Biosciences) | ||
| Strain, strain background (Caenorhabditis elegans) | For C. elegans allele and strain information, see Supplementary file 1 | This paper | N/A | See Supplementary file 1 |
| Genetic reagent (Caenorhabditis elegans) | For CRISPR/Cas9 reagents, see sequence-based reagent and peptide, recombinant protein. | This paper | N/A | Purchased from IDT |
| Antibody | Anti-GFP (mouse monoclonal) | Santa Cruz | Cat#sc-9996 | WB (1:1000) |
| Antibody | Anti-Actin (rabbit polyclonal) | Santa Cruz | Cat#sc-1615 | WB (1:3000) |
| Antibody | Anti-RAD-51(rabbit polyclonal) | SDIX/Novus Biologicals | Cat#29480002 lot#G3048-009A02 | IF (1:10,000) |
| Antibody | Anti-DSB-1 (guinea pig polyclonal) | Stamper et al., 2013 PMID:23990794 | N/A | WB (1:75) |
| Antibody | Anti-ZIM-3 (rabbit polyclonal) | Phillips and Dernburg, 2006 PMID:17141157 | N/A | IF (1:2000) |
| Antibody | Anti-SYP-1 (guinea pig polyclonal) | Sato-Carlton et al., 2020 PMID:33175901 | N/A | IF (1:100) |
| Antibody | Anti-SYP-2 (rat polyclonal) | Sato-Carlton et al., 2020 PMID:33175901 | N/A | IF (1:200) |
| Antibody | Anti-HTP-3 (guinea pig polyclonal) | MacQueen et al., 2005 PMID:16360034 | N/A | IF (1:500) |
| Antibody | Alexa488-anti-rabbit (donkey polyclonal) | Jackson ImmunoResearch | Cat#711-545-152, lot#109880 | IF (1:500) |
| Antibody | DyLight649-anti-guinea pig (donkey polyclonal) | Jackson ImmunoResearch | Cat#706-495-148, lot#95544 | IF (1:500) |
| Antibody | DyLight594-anti-guinea pig (donkey polyclonal) | Jackson ImmunoResearch | Cat#706-515-148, lot#94259 | IF (1:500) |
| Antibody | DyLight649-anti-rat (donkey polyclonal) | Jackson ImmunoResearch | Cat#712-495-153, lot#94218 | IF (1:500) |
| Antibody | HRP-conjugated anti-mouse (sheep polyclonal) | GE Healthcare BioSciences | Cat#NIF825 | WB (1:10,000) |
| Antibody | HRP-conjugated anti-rabbit (goat polyclonal) | Abcam | Cat#ab97051 | WB (1:10,000) |
| Antibody | HRP-conjugated anti-guinea pig (goat polyclonal) | Beckman Coulter | Cat#732868 | WB (1:10,000) |
| Sequence-based reagent | FISH probe to the right arm of Chromosome V (5S rDNA) | Dernburg et al., 1998 PMID:9708740 | N/A | |
| Sequence-based reagent | Alt-R CRISPR-Cas9 tracrRNA | IDT | Cat# 1072532 | |
| Sequence-based reagent | dpy-10 crRNA: 5’-GCTACCATAGGCACCACGAG-3’ | https://www.ncbi.nlm.nih.gov/pubmed/25161212 | N/A | |
| Sequence-based reagent | dpy-10(cn64) homology template for CRISPR 5'-cacttgaacttcaatacggcaagatgagaatgactggaaaccgta ccgcATgCggtgcctatggtagcggagcttcacatggcttcagaccaacagcct-3’ | https://www.ncbi.nlm.nih.gov/pubmed/25161212 | N/A | |
| Sequence-based reagent | For crRNAs, repair templates and genotyping primers, see Supplementary file 2 | This paper | N/A | Purchased from IDT |
| Peptide, recombinant protein | Recombinant Cas9 protein | UC Berkeley QB3 Macrolab | https://macrolab.qb3.berkeley.edu/cas9-nls-purified-protein/ | |
| Commercial assay or kit | Pierce BCA Protein Assay Kit | ThermoFisher Scientific | Cat#23227 | |
| Chemical compound, drug | DAPI (4',6-Diamidino-2-phenylindole dihydrochloride) | Nacalai Inc | Cat#11034–56 | |
| Chemical compound, drug | Nuclease-free Duplex Buffer | IDT | Cat#11-01-03-01 | |
| Chemical compound, drug | GFP-Trap magnetic beads | ChromoTek | Cat#gtma-20 | |
| Chemical compound, drug | Lambda Protein Phosphatase | BioLabs | Cat#P0753S | |
| Chemical compound, drug | Chemilumi-one super | Nacalai Inc | Cat#02230–30 | |
| Chemical compound, drug | Chemilumi-one ultra | Nacalai Inc | Cat#11644–24 | |
| Chemical compound, drug | skim milk | Nacalai Inc | Cat#31149–75 | |
| Chemical compound, drug | SuperSep (TM) Ace, 5%–12%, 13well | Wako | Cat#199–15191 | |
| Chemical compound, drug | NuPAGE 4% to 12%, Bis-Tris, 1.0 mm, Mini Protein Gel, 12-well | Invitrogen | Cat#NP0322BOX | |
| Software, algorithm | softWoRx suite | Applied Precision/GE Healthcare | N/A | |
| Software, algorithm | OMERO | Burel et al., 2015 PMID:26223880 | https://www.openmicroscopy.org/omero/ | |
| Software, algorithm | Priism | Chen et al., 1996 PMID:8742723 | https://msg.ucsf.edu | |
| Software, algorithm | Prism6 | GraphPad | https://www.graphpad.dom/scientific-software/prism | |
| Software, algorithm | Mafft v7.487 | Katoh and Standley, 2013 PMID:23329690 | https://mafft.cbrc.jp/alignment/software/ | |
| Software, algorithm | Fiji | Schindelin et al., 2012 PMID:22743772 | https://fiji.sc | |
| Software, algorithm | AGAT v0.4.0 | Dainat et al., 2020 doi:10.5281/ZENODO.3552717 | https://github.com/NBISweden/AGAT | |
| Software, algorithm | OrthoFinder v2.5.4 | Emms and Kelly, 2019, Emms, 2022 PMID:31727128 | https://github.com/davidemms/OrthoFinder | |
| Software, algorithm | FSA v1.15.9 | Bradley et al., 2009 PMID:19478997 | http://fsa.sourceforge.net/ | |
| Software, algorithm | IQ-TREE v2.2.0-beta | Nguyen et al., 2015 PMID:25371430 | http://www.iqtree.org/ | |
| Software, algorithm | ETE3 Python module | Huerta-Cepas et al., 2016 PMID:26921390 | http://etetoolkit.org/ |
Additional files
-
Supplementary file 1
Table listing strains used in this study.
- https://cdn.elifesciences.org/articles/77956/elife-77956-supp1-v2.docx
-
Supplementary file 2
Table listing crRNAs, repair templates, and genotyping primers for transgenes generated in this study.
- https://cdn.elifesciences.org/articles/77956/elife-77956-supp2-v2.docx
-
Transparent reporting form
- https://cdn.elifesciences.org/articles/77956/elife-77956-transrepform1-v2.docx
Download links
A two-part list of links to download the article, or parts of the article, in various formats.
Downloads (link to download the article as PDF)
Open citations (links to open the citations from this article in various online reference manager services)
Cite this article (links to download the citations from this article in formats compatible with various reference manager tools)
Phosphoregulation of DSB-1 mediates control of meiotic double-strand break activity
eLife 11:e77956.
https://doi.org/10.7554/eLife.77956


