Mir204 and Mir211 suppress synovial inflammation and proliferation in rheumatoid arthritis by targeting Ssrp1
- Department of Pharmacy, Shanghai Ninth People’s Hospital, Shanghai Jiao Tong University School of Medicine, China
- Faculty of Pharmaceutical Sciences, Shenzhen Institute of Advanced Technology, Chinese Academy of Sciences, China
Figures
Figure 1 with 1 supplement
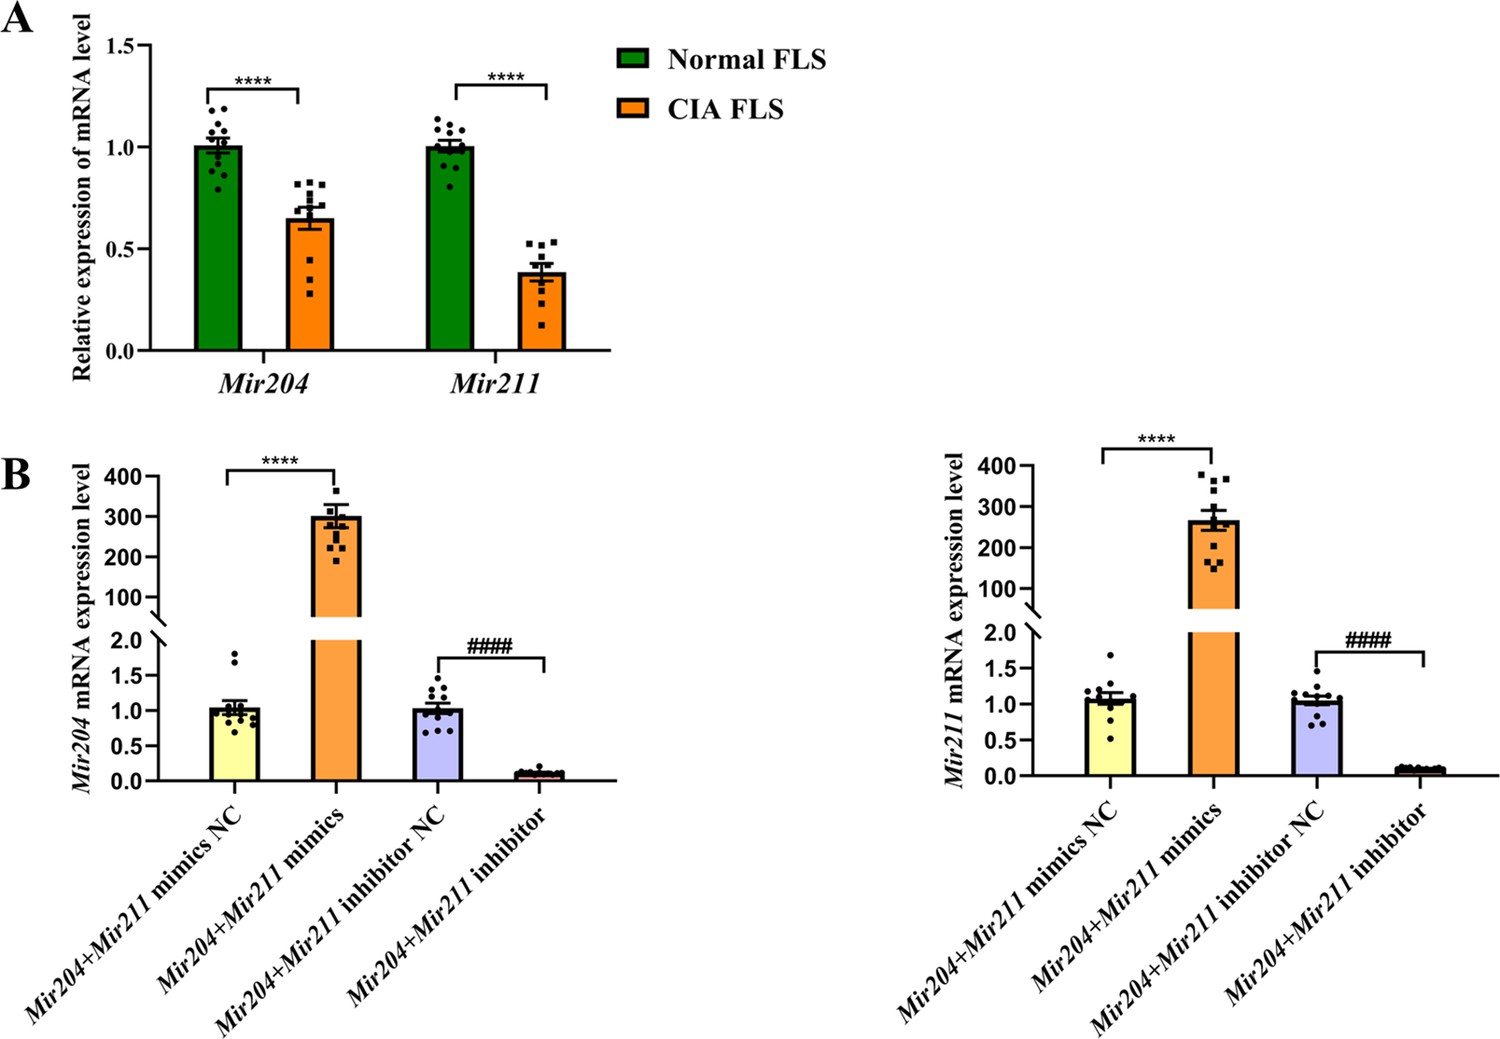
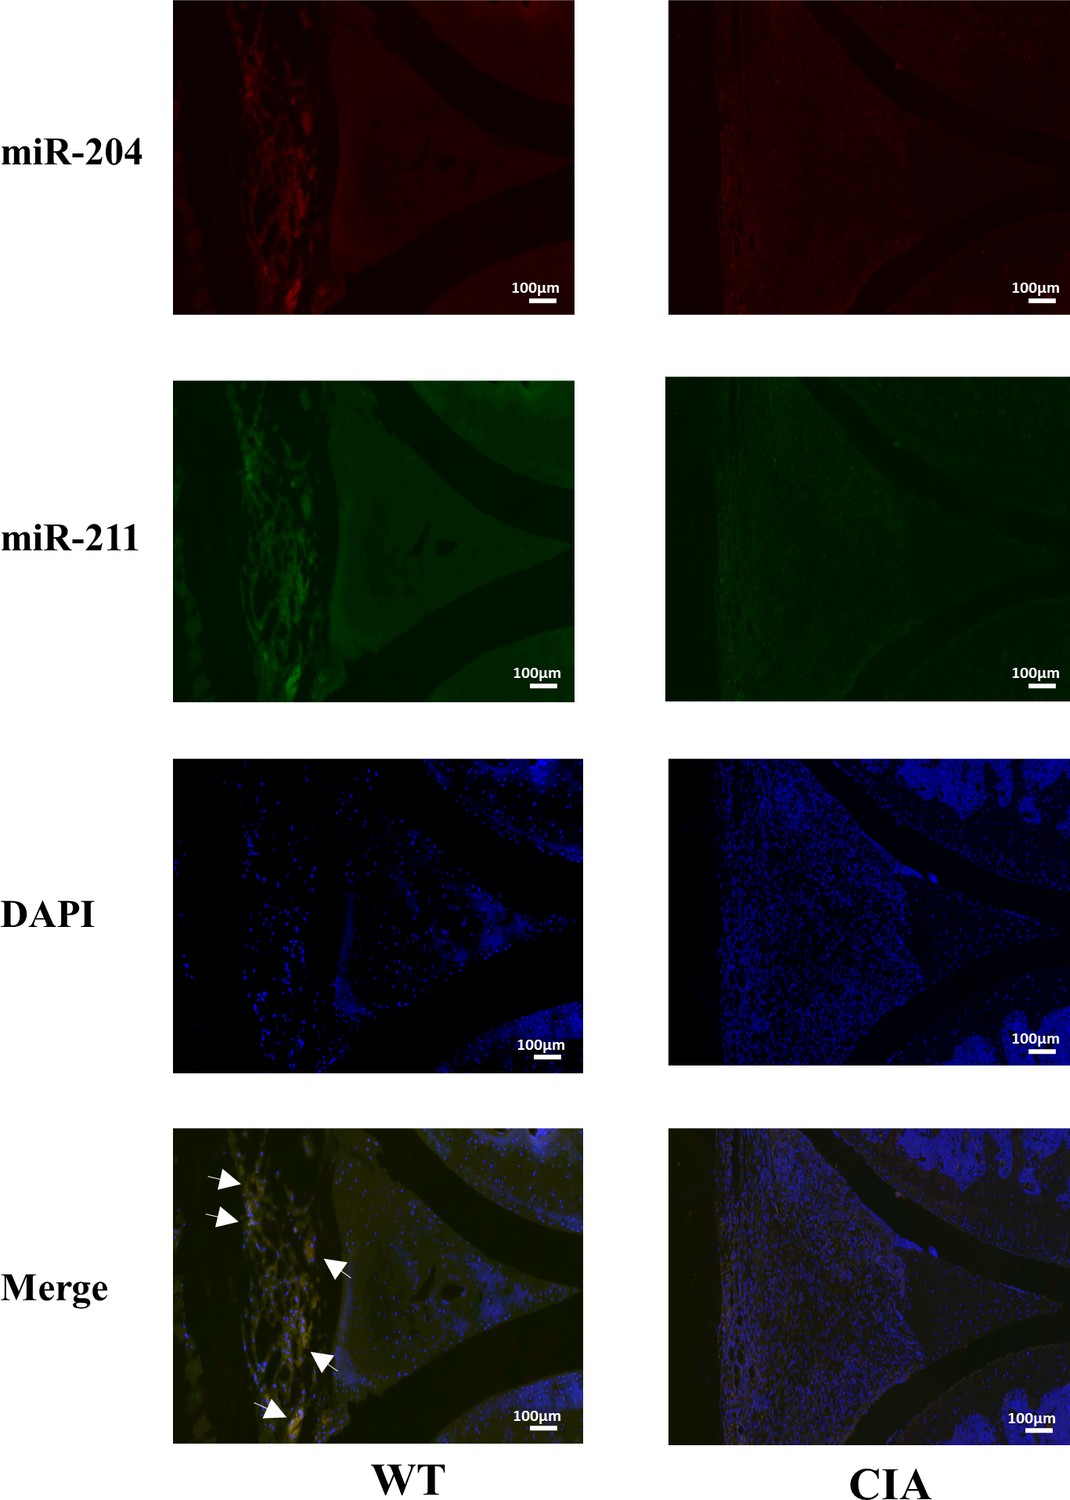
Mir204/Mir211 downregulate in fibroblast-like synoviocyte (FLS) of collagen-induced arthritis (CIA) mice.
(A) Low expression levels of Mir204/Mir211 in FLS of CIA mice. (B) qRT-PCR analysis of the relative Mir204/Mir211 expression in CIA FLS 48 hr after transfection. Please see Figure 1—source data 1. Data are pooled from at least three independent experiments and are presented as mean ± SEM. Data are analyzed using unpaired two-tailed Student t test (A) and one-way ANOVA (B). *p<0.05, **p<0.01, ***p<0.001, ****p<0.0001; and #p<0.05; ##p<0.01, ###p<0.001, ####p<0.0001.
-
Figure 1—source data 1
Numerical data obtained during experiments represent in Figure 1.
- https://cdn.elifesciences.org/articles/78085/elife-78085-fig1-data1-v1.xlsx
Figure 1—figure supplement 1
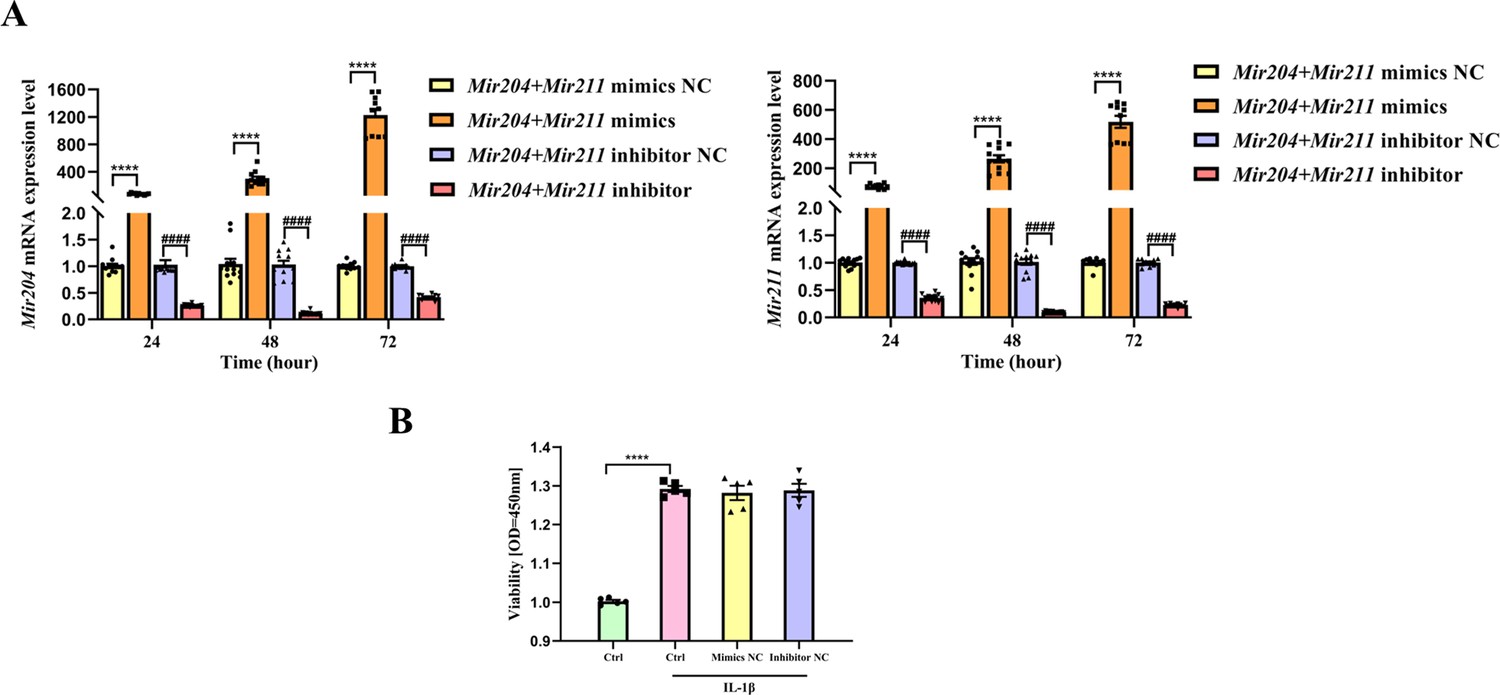
Transfection efficiency of Mir204/Mir211 in CIA FLS and viability of CIA FLS with different treatments.
(A) Transfection efficiency of Mir204/Mir211 in collagen-induced arthritis (CIA) fibroblast-like synoviocyte (FLS) at different time points. To determine transfection efficiency, Mir204/Mir211 expression is analyzed by RT-PCR at different time points (24, 48, and 72hr). (B) Viability of CIA FLS with different treatments. We divide CIA FLS into four groups, including Ctrl (CIA FLS), Ctrl + IL-1β, Mimics NC, and Inhibitor NC groups. CIA FLSs treated with 10ng/mL IL-1β for 24hr are considered as Ctrl+ IL-1β group. 48 hr after mimics NC or inhibitor NC transfection, CIA FLSs treated with 10ng/mL IL-1β for another 24hr are used as Mimics NC group or Inhibitor NC group.Data are pooled from at least three independent experiments and are presented as mean ± SEM. Data were analyzed using one-way ANOVA. *p<0.05, **p<0.01, ***p<0.001, ****p<0.0001; and #p<0.05; ##p<0.01, ###p<0.001, ####p<0.0001.
Figure 2
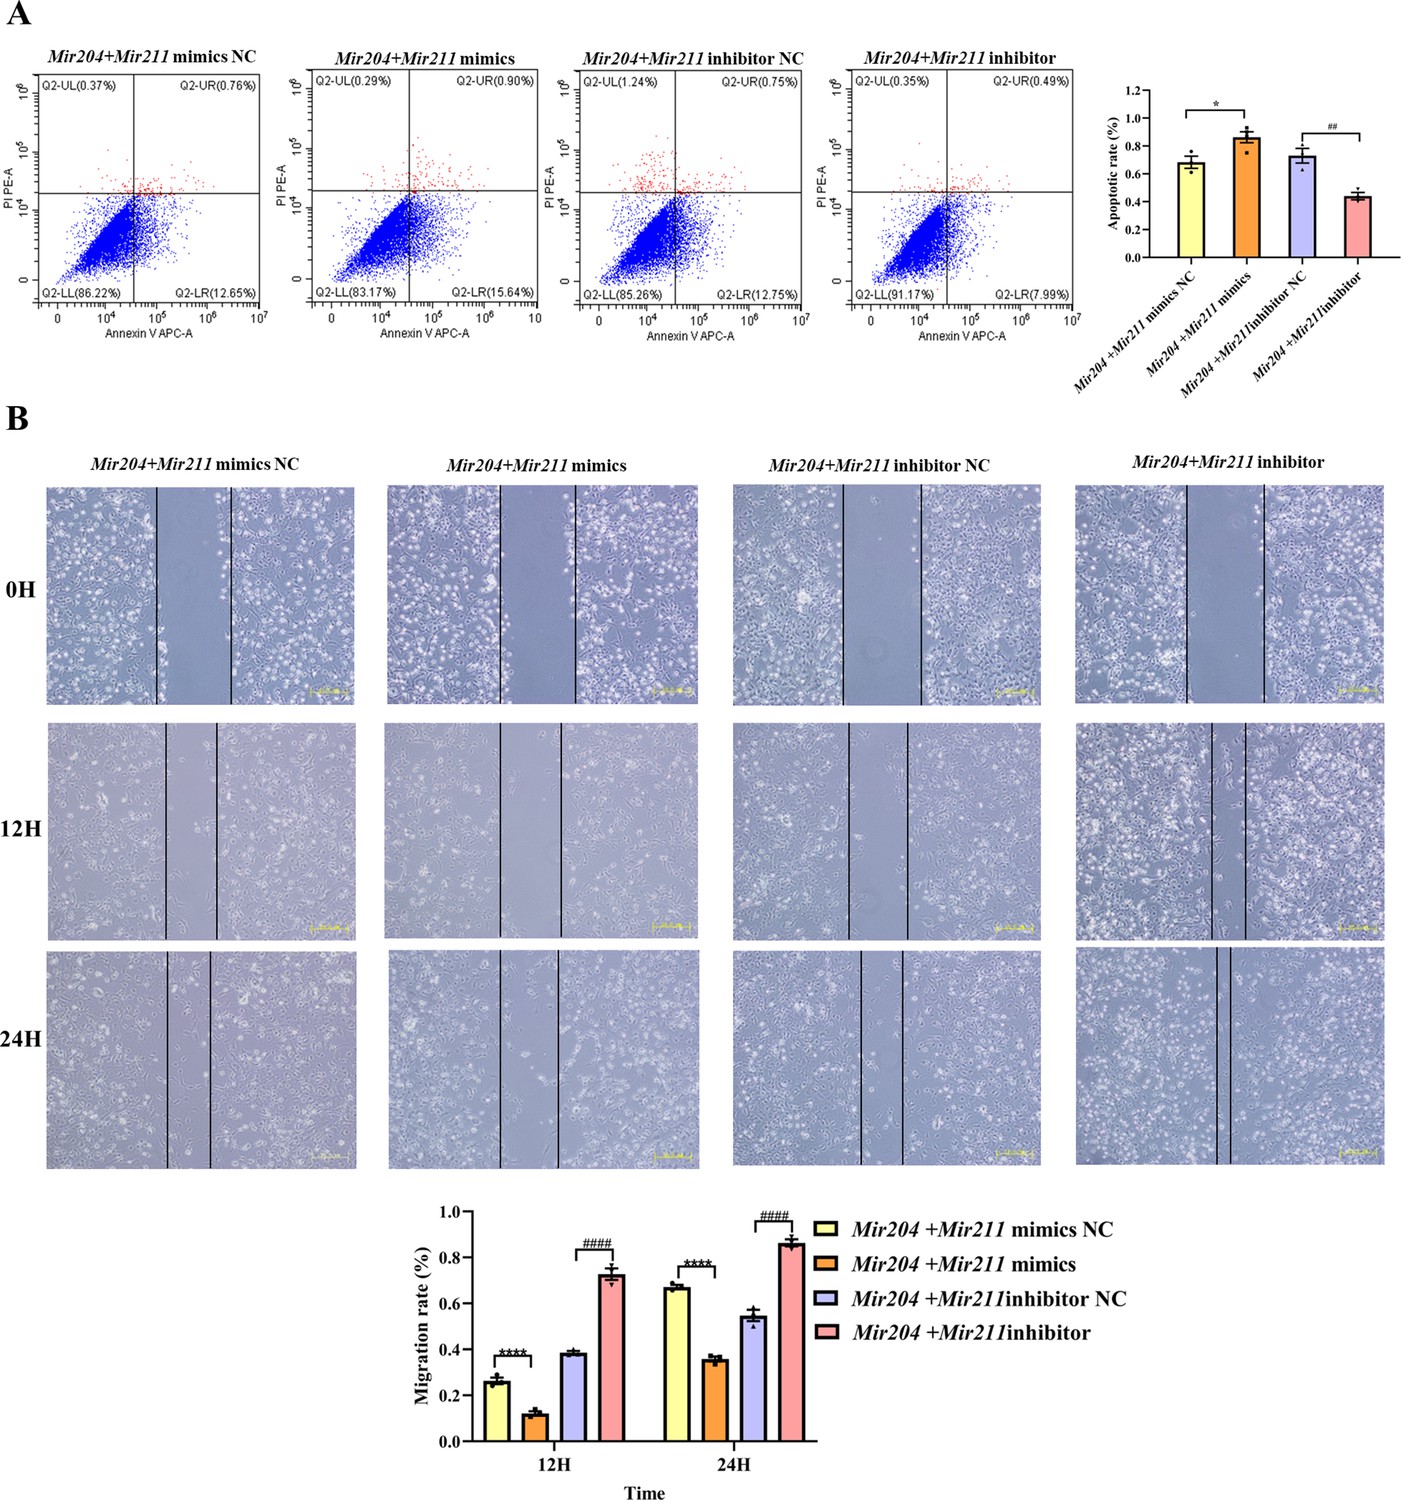
Effects of Mir204/Mir211 on apoptosis and cell migration ability of collagen-induced arthritis (CIA) fibroblast-like synoviocyte (FLS).
(A) Effects of Mir204/Mir211 on apoptosis of CIA FLS. (B) Effects of Mir204/Mir211 on cell migration ability of CIA FLS. Representative photomicrographs show a wound scratch assay at specific time points (0, 12, and 24 hr). Please see Figure 2—source data 1. Data are pooled from three independent experiments and are presented as mean ± SEM. Data are analyzed using one-way ANOVA. *p<0.05, **p<0.01, ***p<0.001, ****p<0.0001; and #p<0.05; ##p<0.01, ###p<0.001, ####p<0.0001.
-
Figure 2—source data 1
Numerical data obtained during experiments represent in Figure 2.
- https://cdn.elifesciences.org/articles/78085/elife-78085-fig2-data1-v1.xlsx
Figure 3
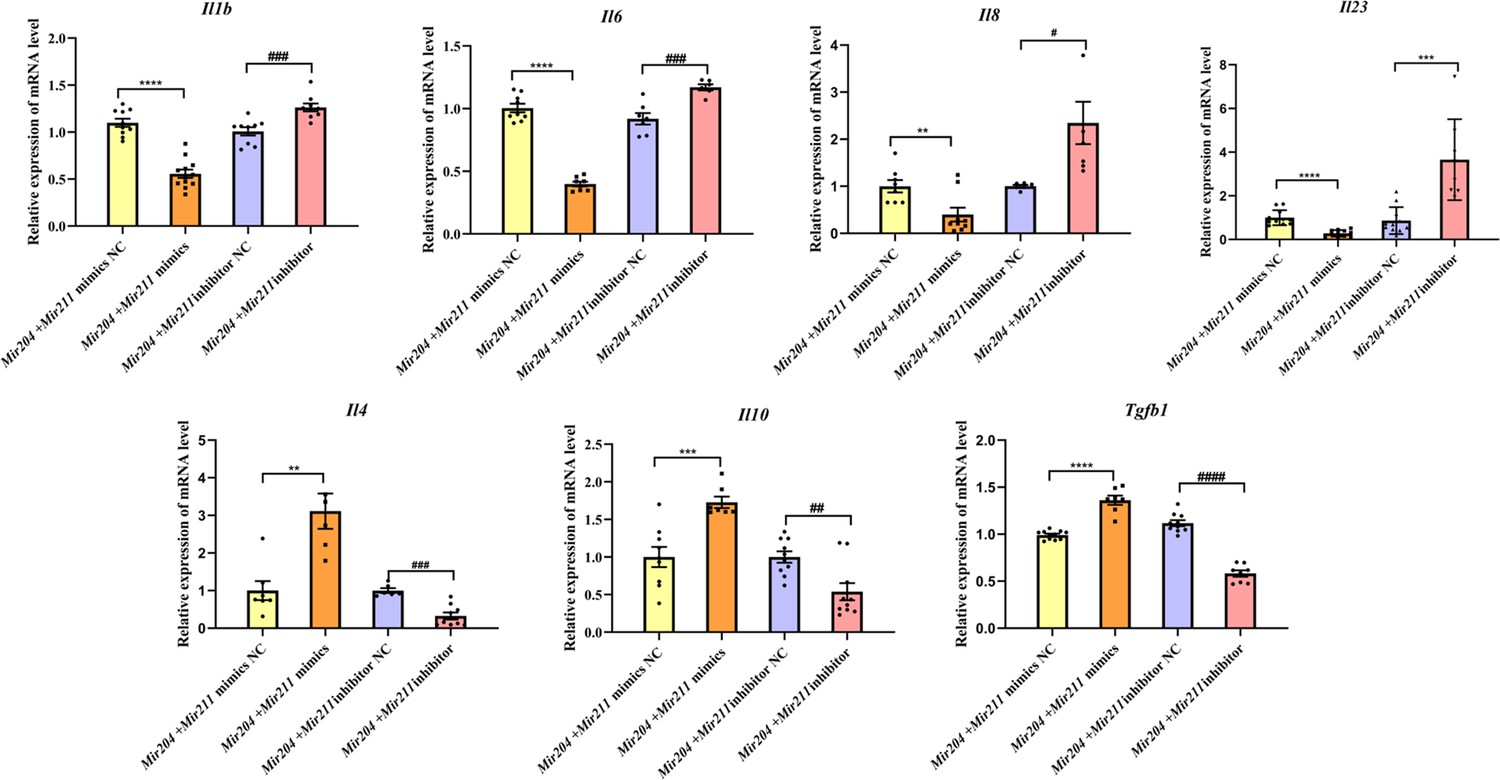
Effects of Mir204/Mir211 on the inflammatory responses of collagen-induced arthritis fibroblast-like synoviocyte.
All data are displayed as a value relative to those in the NC group. Please see Figure 3—source data 1. Data are pooled from at least three independent experiments and are presented as mean ± SEM. Data are analyzed using one-way ANOVA. *p<0.05, **p<0.01, ***p<0.001, ****p<0.0001; and #p<0.05; ##p<0.01, ###p<0.001, ####p<0.0001.
-
Figure 3—source data 1
Numerical data obtained during experiments represent in Figure 3.
- https://cdn.elifesciences.org/articles/78085/elife-78085-fig3-data1-v1.xlsx
Figure 4
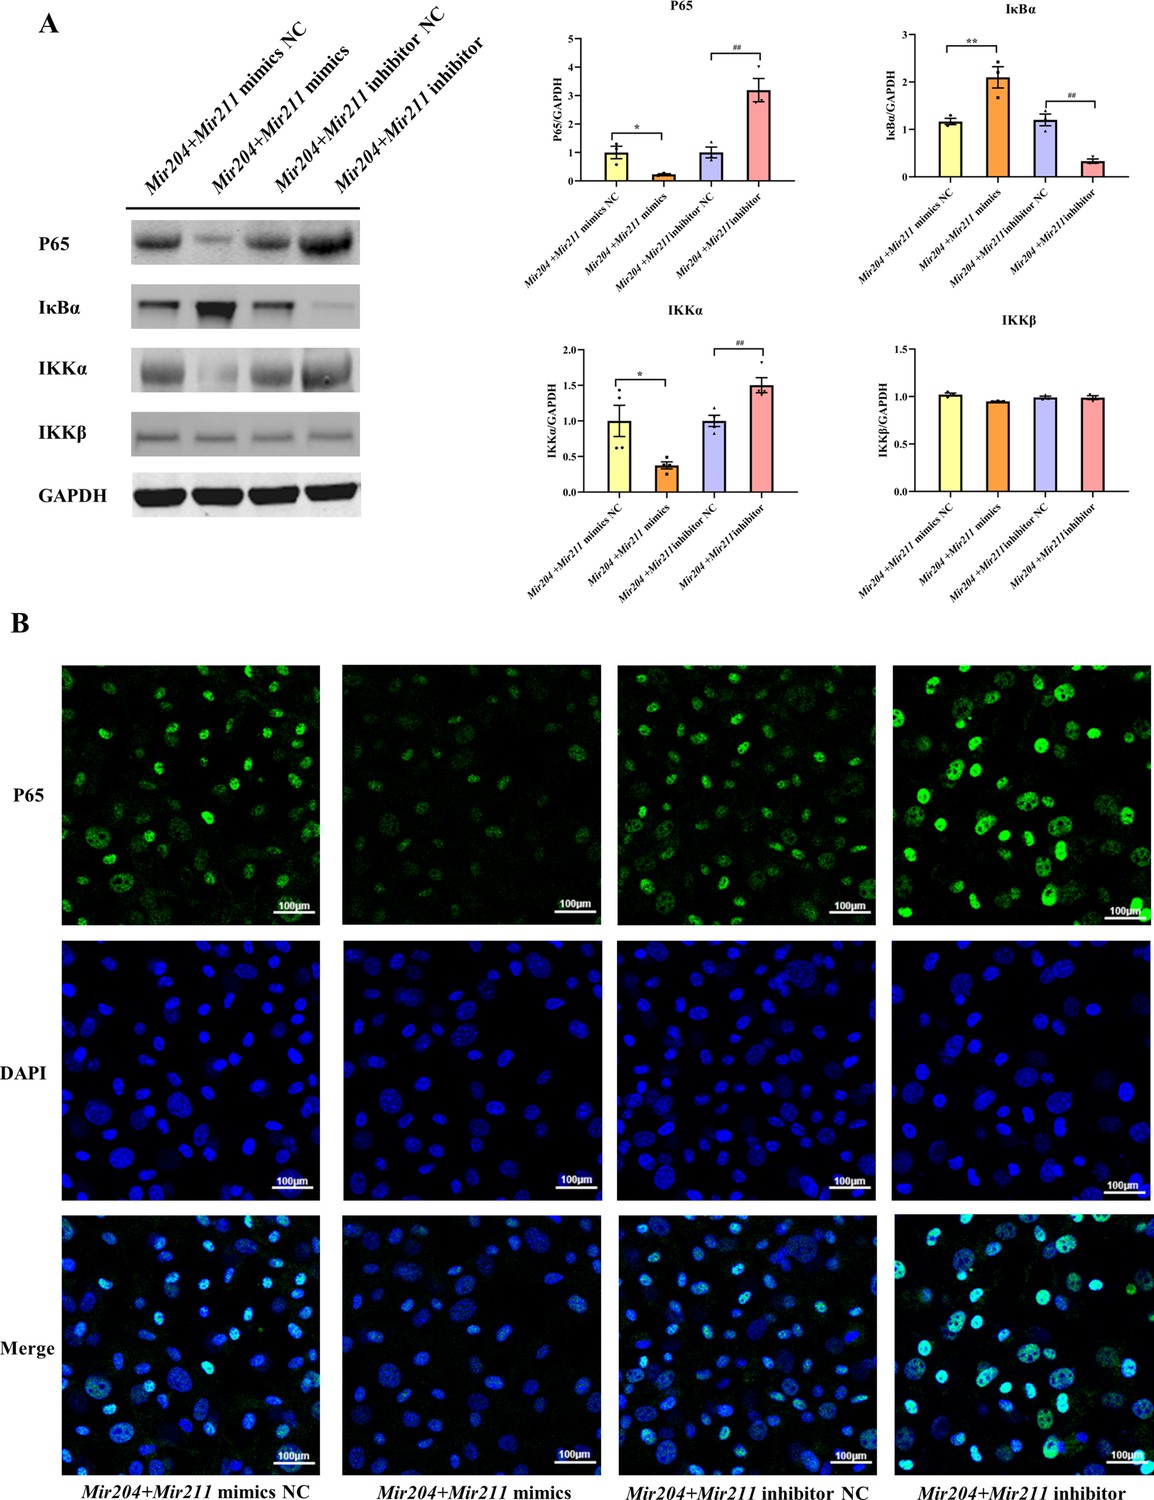
Effects of Mir204/Mir211 on NF-κB signaling pathway.
(A) Western blot assays of the NF-κB pathway in transfected collagen-induced arthritis (CIA) fibroblast-like synoviocyte (FLS). (B) Immunofluorescence staining of p65 nuclear translocation in transfected CIA FLS. Please see Figure 4—source data 1. Data are pooled from at least three independent experiments and are presented as mean ± SEM. Data are analyzed using one-way ANOVA. *p<0.05, **p<0.01, ***p<0.001, ****p<0.0001; and #p<0.05, ##p<0.01, ###p<0.001, ####p<0.0001.
-
Figure 4—source data 1
Numerical data obtained during experiments represent in Figure 4.
- https://cdn.elifesciences.org/articles/78085/elife-78085-fig4-data1-v1.xlsx
-
Figure 4—source data 2
Original western blot files for Figure 4.
- https://cdn.elifesciences.org/articles/78085/elife-78085-fig4-data2-v1.pptx
Figure 5 with 1 supplement
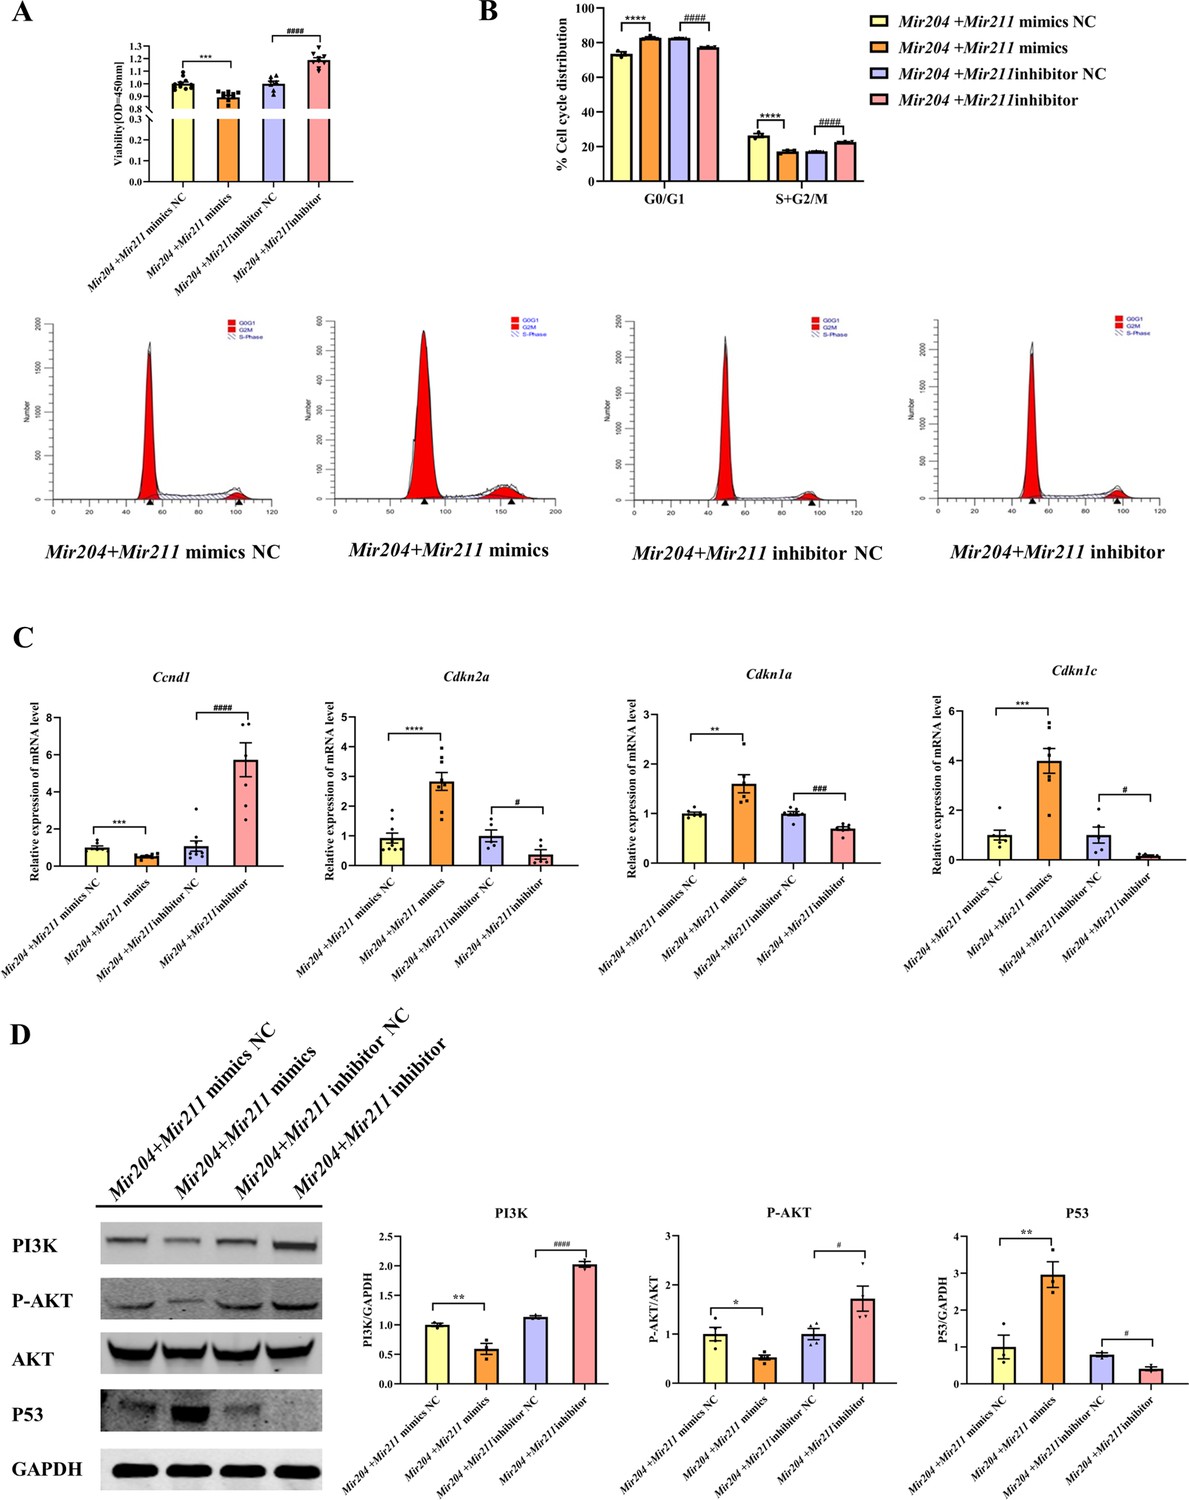
Effects of Mir204/Mir211 on proliferation of collagen-induced arthritis (CIA) fibroblast-like synoviocyte (FLS).
(A) CCK-8 analysis in four groups of transfected CIA FLS. (B) Mir204/Mir211 induce G0/G1 phase arrest of CIA FLS. (C) Expression levels of cell cycle regulatory molecule in transfected CIA FLS. (D) Western blot assays of the PI3K/AKT pathway in transfected CIA FLS. Please see Figure 5—source data 1. Data are pooled from at least three independent experiments and are presented as mean ± SEM. Data are analyzed using one-way ANOVA. *p<0.05, **p<0.01, ***p<0.001, ****p<0.0001; and #p<0.05; ##p<0.01, ###p<0.001, ####p<0.0001.
-
Figure 5—source data 1
Numerical data obtained during experiments represent in Figure 5.
- https://cdn.elifesciences.org/articles/78085/elife-78085-fig5-data1-v1.xlsx
-
Figure 5—source data 2
Original western blot files for Figure 5.
- https://cdn.elifesciences.org/articles/78085/elife-78085-fig5-data2-v1.pptx
Figure 5—figure supplement 1

Representative images of β-galactosidase staining of primary wild-type (WT) fibroblast-like synoviocyte (FLS) and double knockout (dKO) FLS.
Primary FLSs are isolated from male WT and dKO C57 mice. FLSs are seeded in six-well plates at the density of 5×10⁵, and β-galactosidase staining is performed.
Figure 6
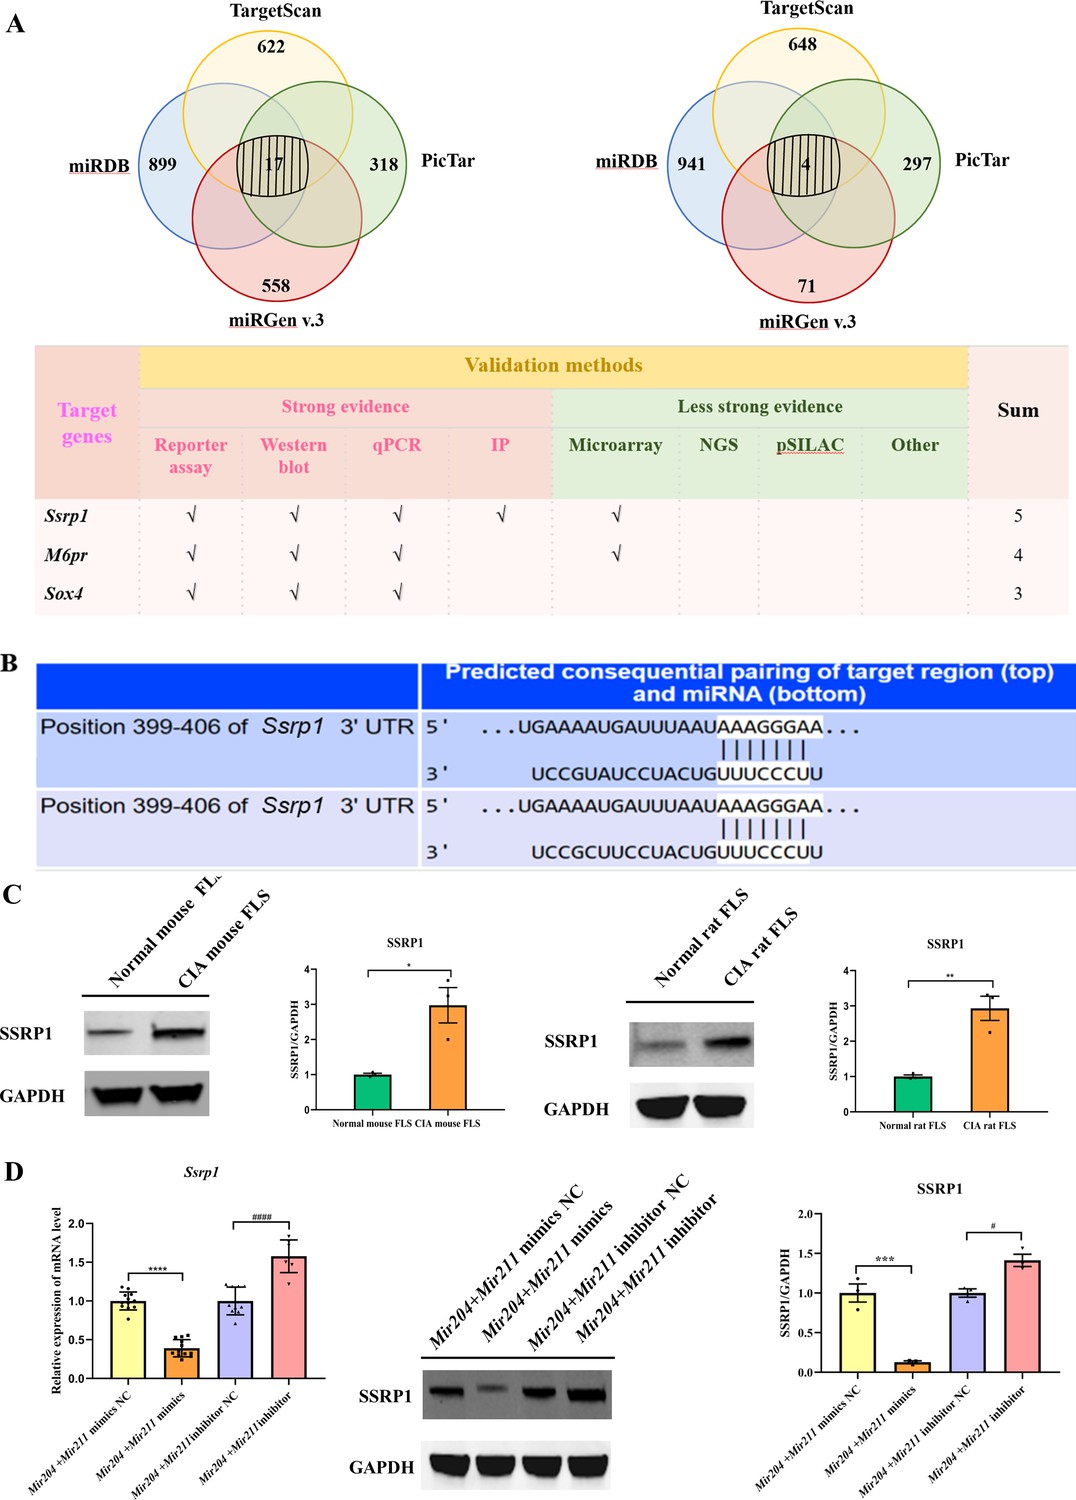
Mir204/Mir211 target structure-specific recognition protein 1 (Ssrp1) in collagen-induced arthritis (CIA) fibroblast-like synoviocyte (FLS).
(A) Diagrams describing the process of predicting target genes of Mir204/Mir211 (B) Diagram of putative Mir204/Mir211 binding sequence in Ssrp1 3’ untranslated region (UTR) from TargetScan. (C) High expression levels of SSRP1 in CIA mice and CIA rats. (D) Gene and protein expressions of SSRP1 in four groups of transfected CIA FLS. Please see Figure 6—source data 1. Data are pooled from at least three independent experiments and are presented as mean ± SEM. Data are analyzed using unpaired two-tailed Student t test (C) and one-way ANOVA (D). *p<0.05, **p<0.01, ***p<0.001, ****p<0.0001; and #p<0.05; ##p<0.01, ###p<0.001, ####p<0.0001.
-
Figure 6—source data 1
Numerical data obtained during experiments represent in Figure 6.
- https://cdn.elifesciences.org/articles/78085/elife-78085-fig6-data1-v1.xlsx
-
Figure 6—source data 2
Original western blot files for Figure 6.
- https://cdn.elifesciences.org/articles/78085/elife-78085-fig6-data2-v1.pptx
Figure 7 with 1 supplement

Effects of Mir204/Mir211 on cell proliferation by targeting structure-specific recognition protein 1 (Ssrp1).
(A) Overexpression of Mir204/Mir211 decreases SSRP1 expression. (B) Mir204/Mir211 decrease Ki-67 levels by targeting Ssrp1. Please see Figure 7—source data 1. Data are pooled from four independent experiments and are presented as mean ± SEM. Data are analyzed using one-way ANOVA. *p<0.05, **p<0.01, ***p<0.001, ****p<0.0001; and #p<0.05, ##p<0.01, ###p<0.001, ####p<0.0001.
-
Figure 7—source data 1
Numerical data obtained during experiments represent in Figure 7.
- https://cdn.elifesciences.org/articles/78085/elife-78085-fig7-data1-v1.xlsx
-
Figure 7—source data 2
Original western blot files for Figure 7.
- https://cdn.elifesciences.org/articles/78085/elife-78085-fig7-data2-v1.pptx
Figure 7—figure supplement 1

Overexpression of structure-specific recognition protein 1 (SSRP1) in 293T cells.
293T cells are divided into Ctrl group (untransfected), SSRP1 group (transfected with pcDNA3.1 - Ssrp1 plasmid), and negative control group (transfected with empty vector). 293T cells are transfected with Lipofectamine 3000 according to the instruction. After 72 hr, total proteins of 293T cells in the three groups are extracted.Data were pooled from at least three independent experiments and are presented as mean ± SEM. Data were analyzed using one-way ANOVA (B). *p<0.05, **p<0.01, ***p<0.001, ****p<0.0001; and #p<0.05; ##p<0.01, ###p<0.001, ####p<0.0001.
Figure 8 with 1 supplement
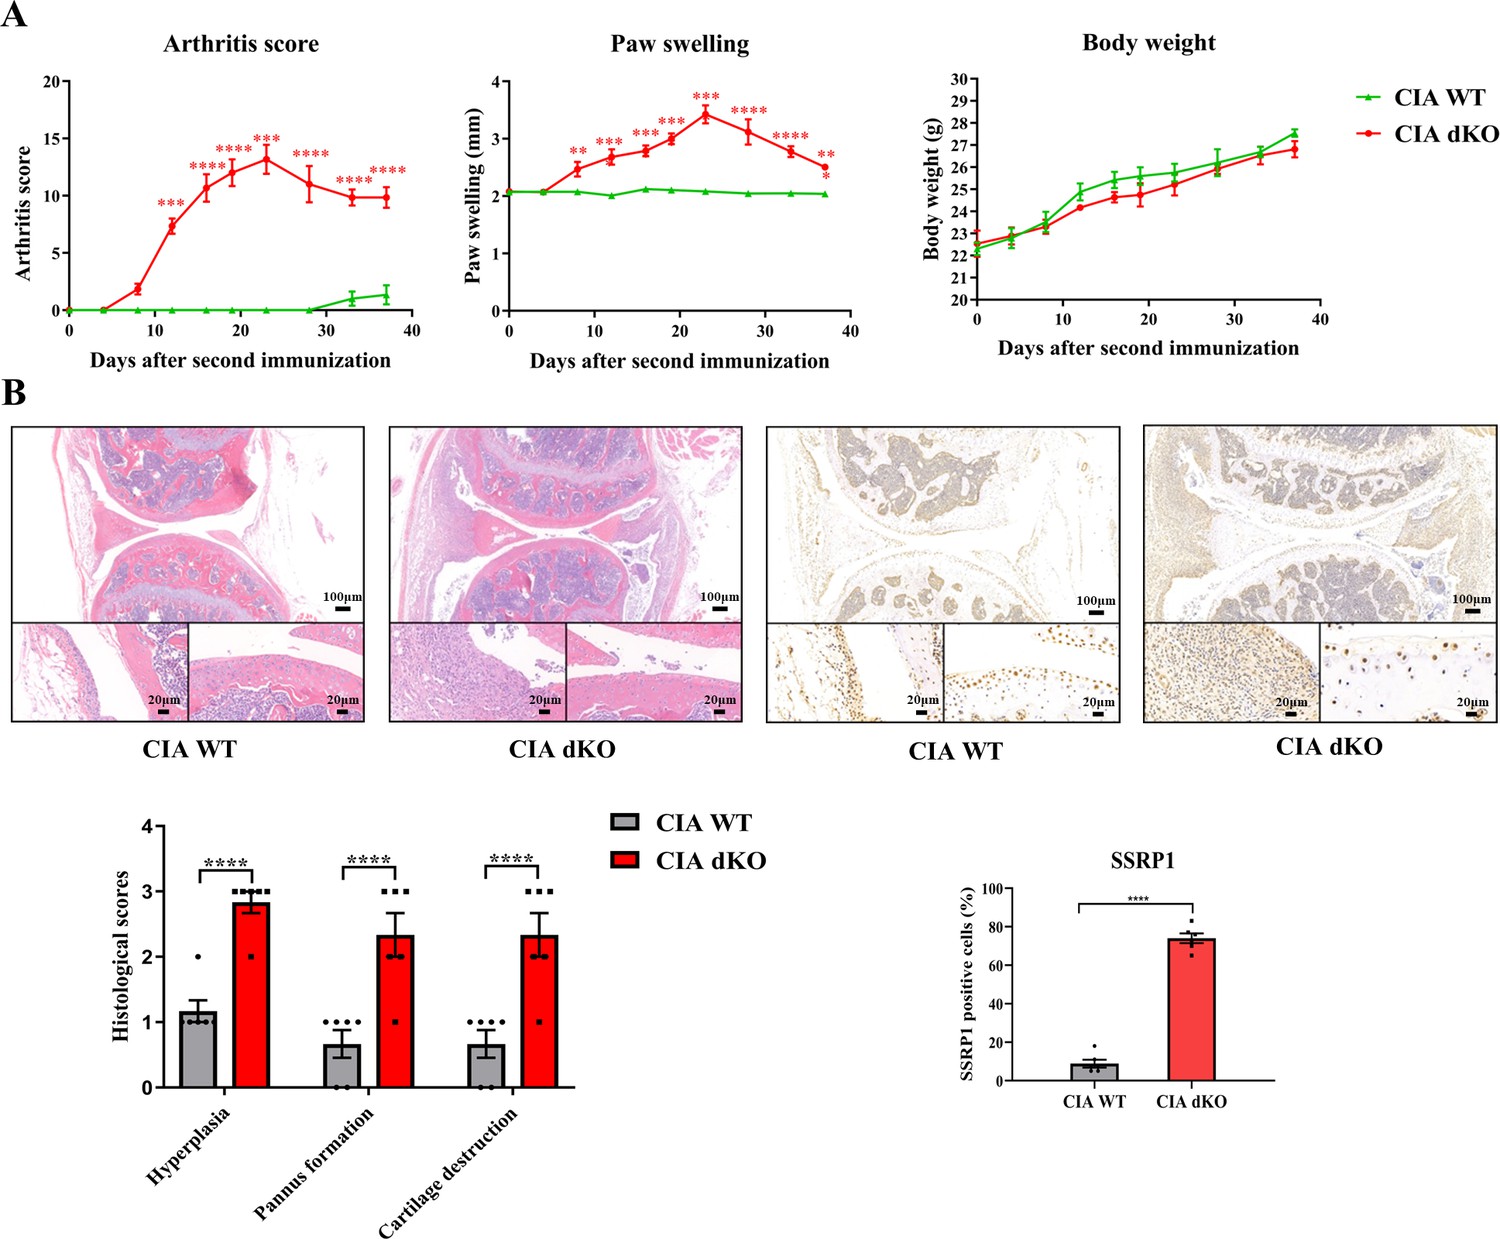
High expression level of structure-specific recognition protein 1 (SSRP1) in collagen-induced arthritis (CIA) Mir204/Mir211 double knockout (dKO) mice.
(A) Severity of arthritis in CIA wild-type (WT) and CIA dKO mice. The arthritis scores, paw swelling, and body weight are documented by two independent blinded observers since the day of the second booster twice a week (n=6). At 37 days after the second immunization, all mice are sacrificed. Knee joints of all mice are collected for the following experiments. (B) Hematoxylin and eosin (H&E) and immunohistochemistry (IHC) analyses of knee joints in CIA WT and CIA dKO mice. Representative photomicrographs of knee joint sections in synovium and cartilage stained with H&E and IHC (SSRP1) are displayed (n=6). Please see Figure 8—source data 1. Data are presented as mean ± SEMand analyzed using one-way ANOVA (A) and unpaired two-tailed Student t test (B). *p<0.05, **p<0.01, ***p<0.001, ****p<0.0001; and #p<0.05; ##p<0.01, ###p<0.001, ####p<0.0001.
-
Figure 8—source data 1
Numerical data obtained during experiments represent in Figure 8.
- https://cdn.elifesciences.org/articles/78085/elife-78085-fig8-data1-v1.xlsx
Figure 8—figure supplement 1
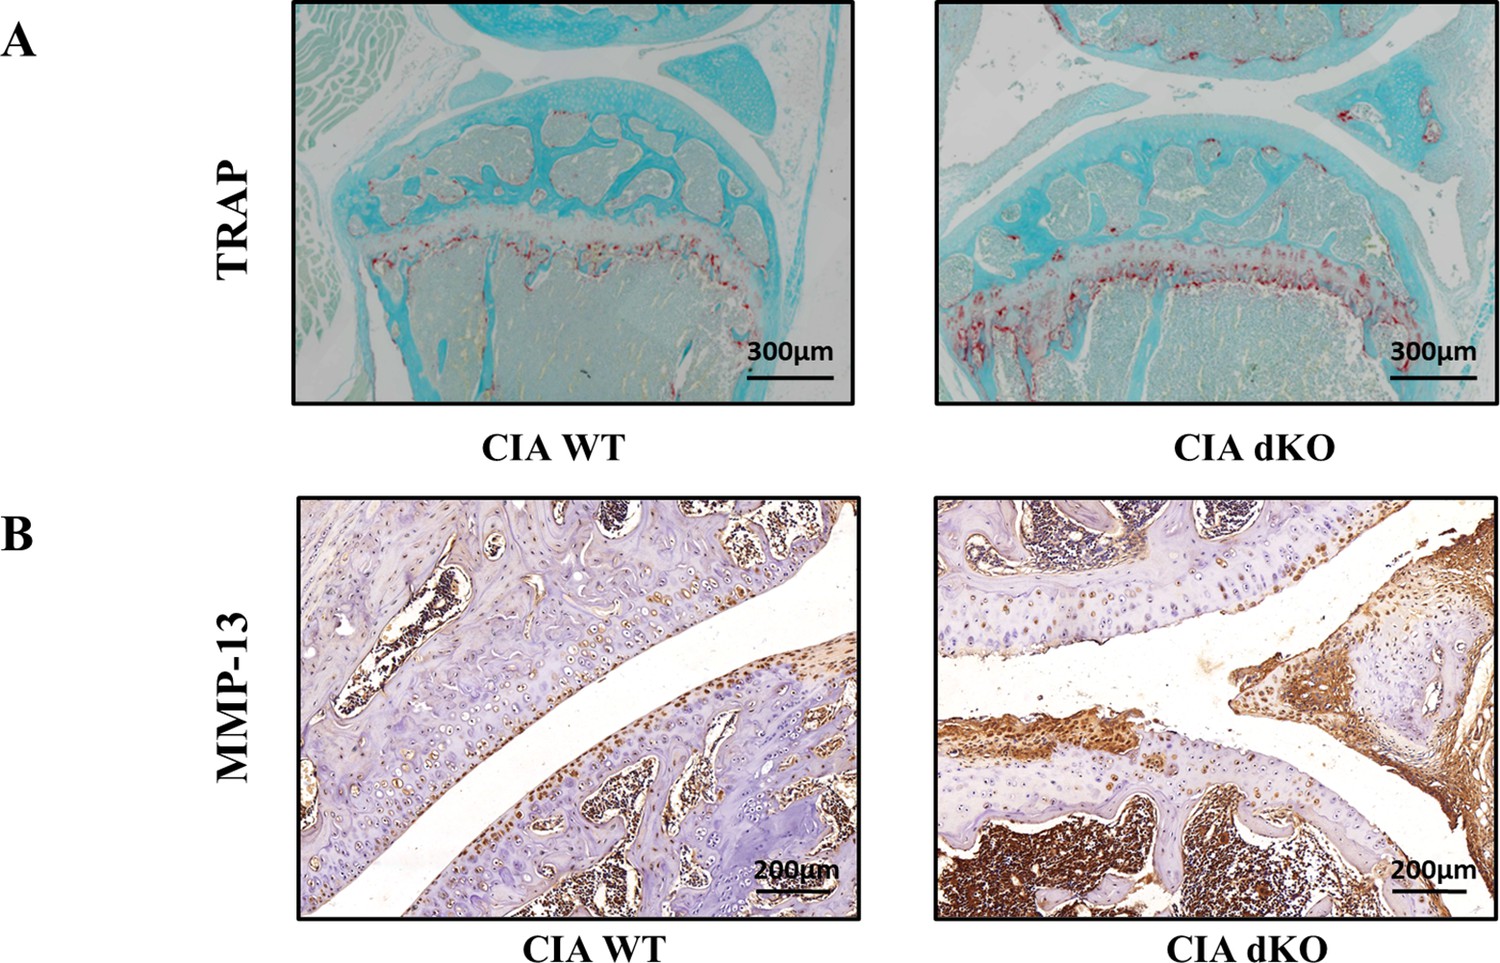
Representative images of tartrate resistant acid phosphatase (TRAP) and immunohistochemistry (IHC) staining of knee joints in collagen-induced arthritis (CIA) wild-type (WT) and CIA double knockout (dKO) mice.
Representative photographs of mouse knee joints with TRAP staining and IHC staining for matrix metalloproteinase (MMP)-13 are shown.
Figure 9 with 1 supplement
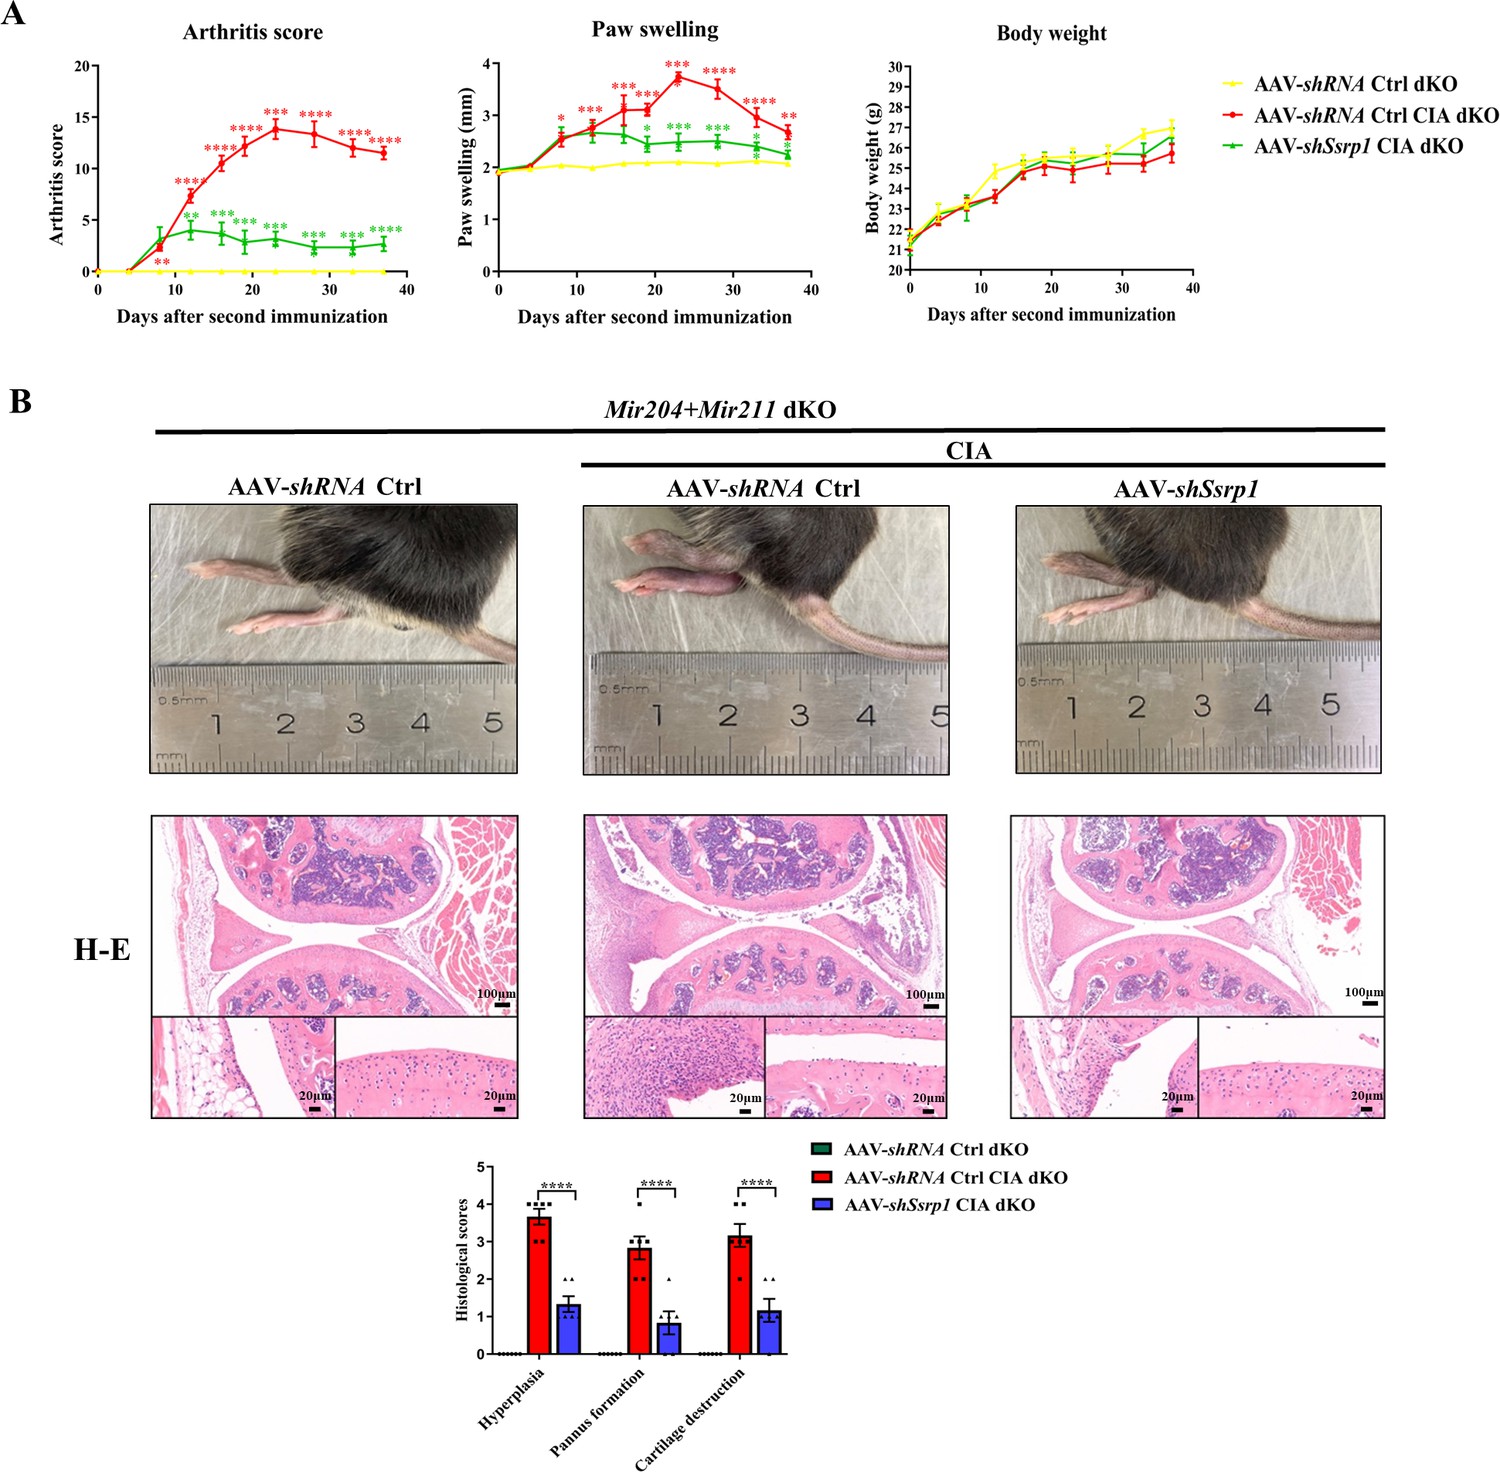
Structure-specific recognition protein 1 (Ssrp1) knockdown exerts anti-arthritis effect in collagen-induced arthritis (CIA) Mir204/Mir211 double knockout (dKO) mice.
(A) Ssrp1 knockdown ameliorates swelling degrees of hind paws in CIA Mir204/Mir211 dKO mice. Representative photomicrographs of knee joint sections in synovium and cartilage stained with hematoxylin and eosin (H&E) are displayed (n=6). (B) H&E staining of knee joints in Mir204/Mir211 dKO mice (n=6). Please see Figure 9—source data 1. Data are presented as mean ± SEM and are analyzed using one-way ANOVA. *p<0.05, **p<0.01, ***p<0.001, ****p<0.0001; and #p<0.05; ##p<0.01, ###p<0.001, ####p<0.0001.
-
Figure 9—source data 1
Numerical data obtained during experiments represent in Figure 9.
- https://cdn.elifesciences.org/articles/78085/elife-78085-fig9-data1-v1.xlsx
Figure 9—figure supplement 1
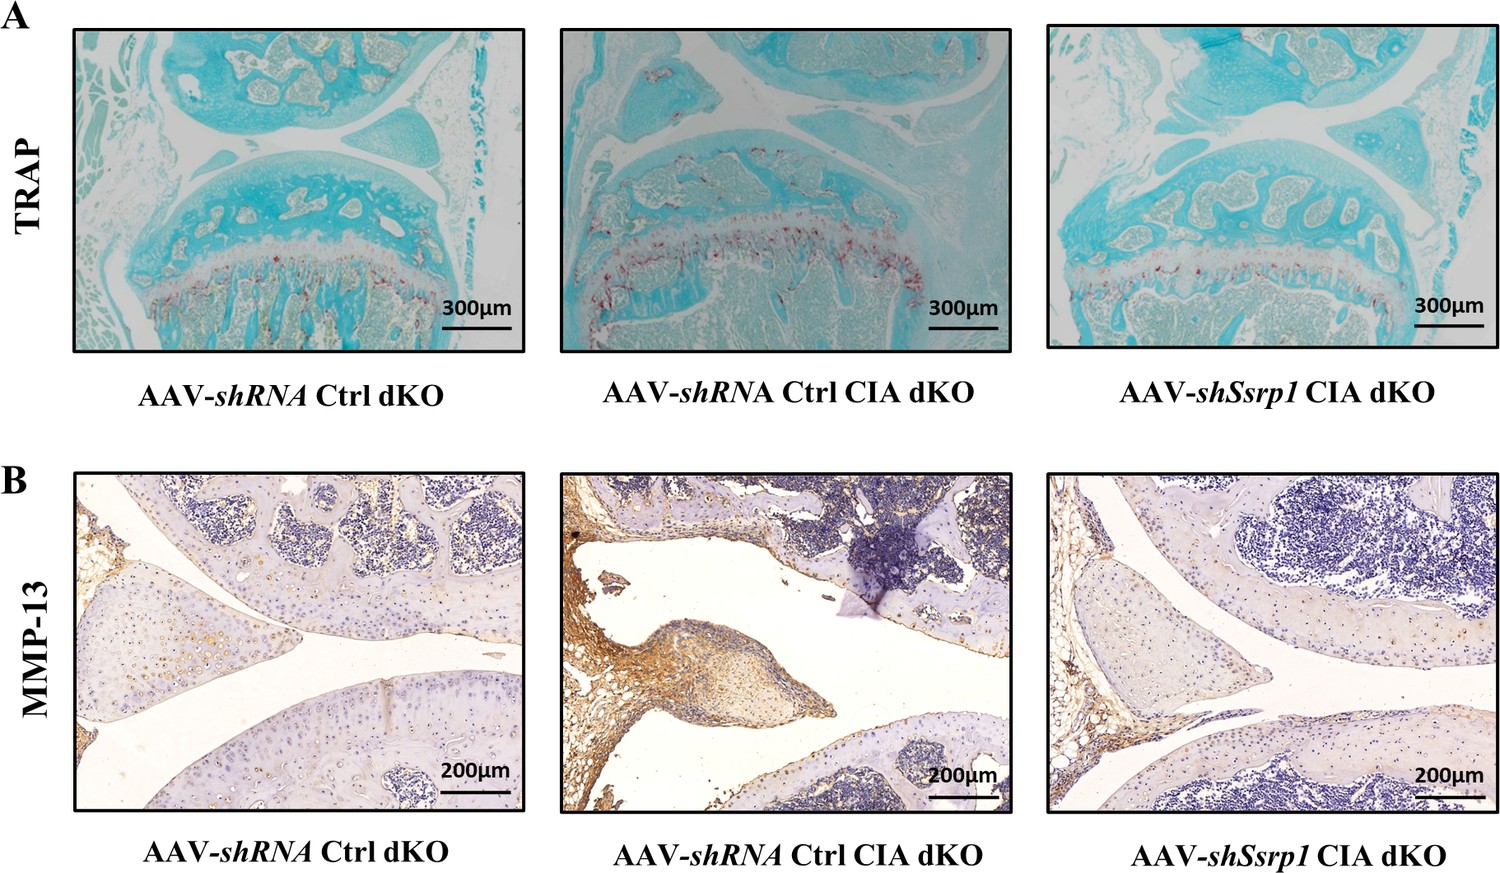
Representative images of tartrate resistant acid phosphatase (TRAP) and immunohistochemistry (IHC) staining of knee joints in three groups of mice.
Representative photographs of mouse knee joints with TRAP and IHC staining for matrix metalloproteinase (MMP)-13 are shown.
Figure 10
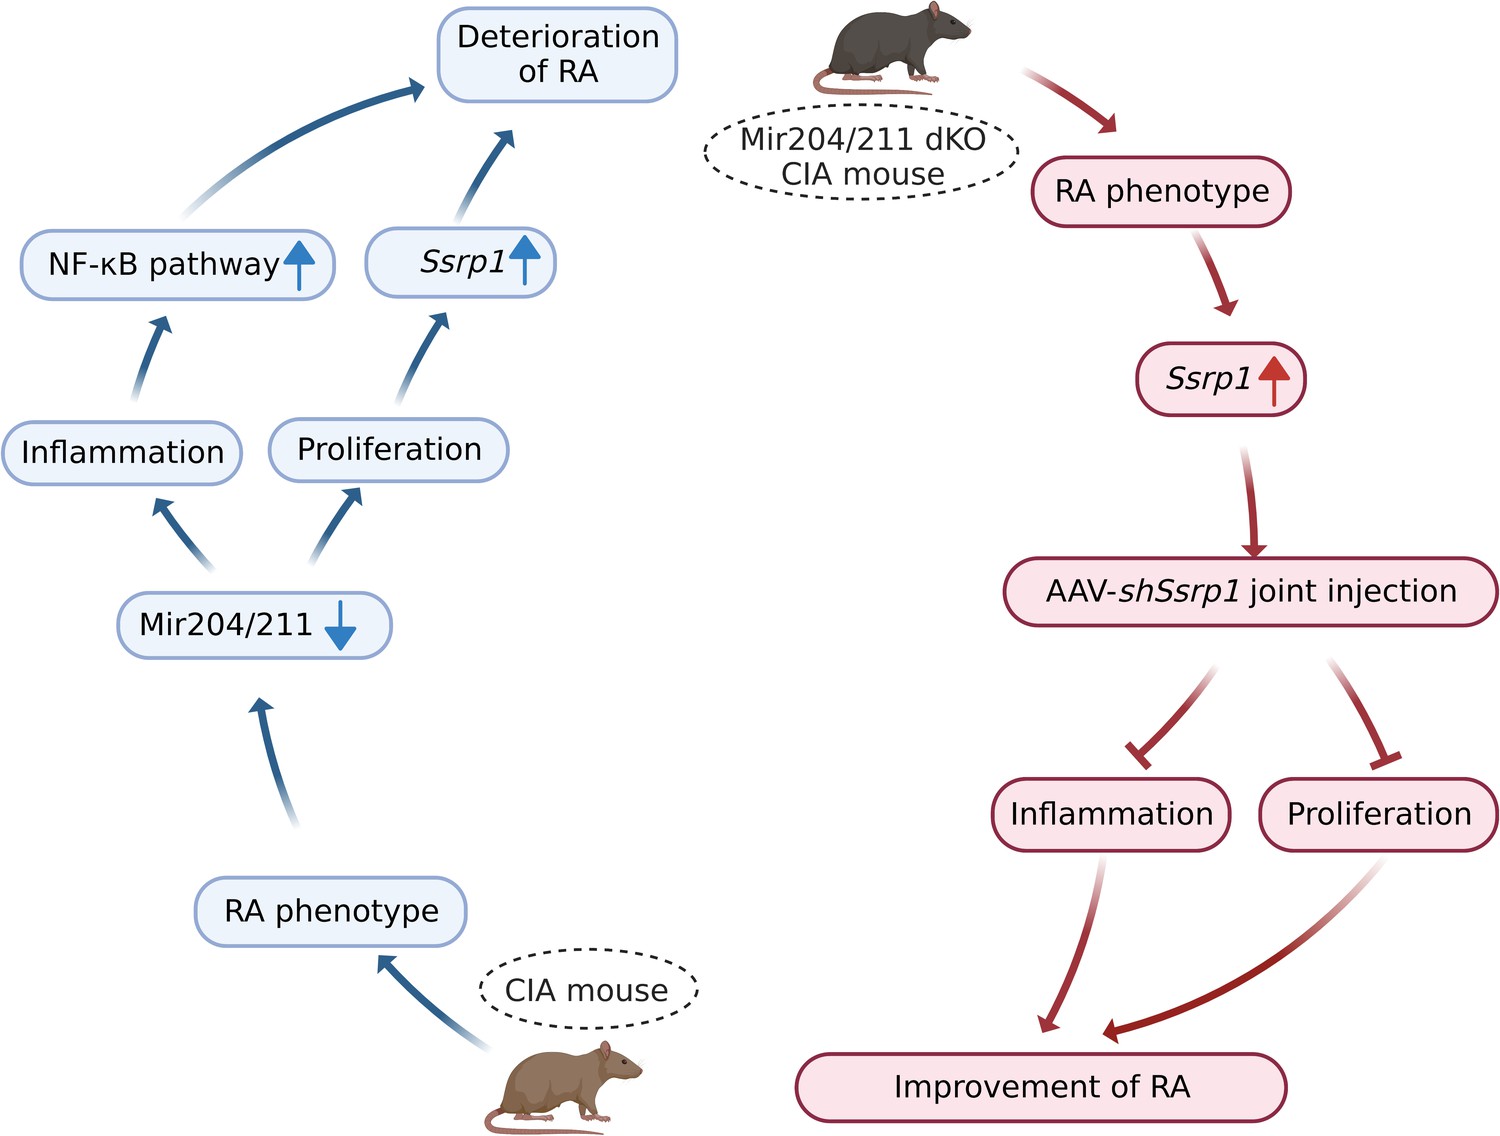
Graphical summary of how Mir204/211 suppresses synovial inflammation and proliferation in rheumatoid arthritis (RA) by targeting structure-specific recognition protein 1 (Ssrp1).
Primary fibroblast-like synoviocytes (FLSs) derived from collagen-induced arthritis (CIA) mice display decreased expression of Mir204/211. On the one hand, upon being challenged by IL-1β, FLS from CIA mice with Mir204/211 overexpression inhibits the production of inflammatory cytokines and promotes the production of large amounts of anti-inflammatory factors by regulating NF-κB pathway. On the other hand, Mir204/211 overexpression induces declined cell proliferation by targeting Ssrp1. Moreover, Mir204/211 dKO CIA mice displays RA phenotype and increased SSRP1 expression whereas AAV-shSsrp1 joint injection significantly reverses this phenomenon from the aspects of inflammation and proliferation. Consequently, we assume that Mir204/211 may influence cell proliferation and inflammation in RA by regulating downstream target gene Ssrp1.
Author response image 1
Tables
Table 1
PCR primer sequences.
| Gene | Primer sequences |
|---|---|
| mmu-Mir204 forward primer | 5 '- GGGCTTCCCTTTGTCATCCTAT –3' |
| mmu-Mir211 forward primer | 5 ' - GGGCTTCCCTTTGTCATCCTT –3' |
| Universal U6 Forward primer | 5 ' - GCAAATTCGTGAAGCGTTCCATA –3' |
| Universal PCR reverse primer | 5 ' - AACGAGACGACGACAGAC –3' |
Table 2
PCR primer sequences.
| Name | Gene | Forward primer sequence | Reverse primer sequence |
|---|---|---|---|
| β-Actin | Actb | 5'-GTGACGTTGACATCCGTAAAGA-3' | 5'-GCCGGACTCATCGTACTCC-3' |
| IL-1β | Il1b | 5'-GAAATGCCACCTTTTGACAGTG-3' | 5'-TGGATGCTCTCATCAGGACAG-3' |
| IL-4 | Il4 | 5'-GGTCTCAACCCCCAGCTAGT-3' | 5'-GCCGATGATCTCTCTCAAGTGAT-3' |
| IL-6 | Il6 | 5'-CTGCAAGAGACTTCCATCCAG-3' | 5'-AGTGGTATAGACAGGTCTGTTGG-3' |
| IL-8 | Il8 | 5'-TCGAGACCATTTACTGCAACAG-3' | 5'-CATTGCCGGTGGAAATTCCTT-3' |
| IL-10 | Il10 | 5'-GCTGGACAACATACTGCTAACC-3' | 5'-ATTTCCGATAAGGCTTGGCAA-3' |
| IL-23 | Il23 | 5'-CAGCAGCTCTCTCGGAATCTC-3' | 5'-TGGATACGGGGCACATTATTTTT-3' |
| TGF-β1 | Tgfb1 | 5'-CCACCTGCAAGACCATCGAC-3' | 5'-CTGGCGAGCCTTAGTTTGGAC-3' |
| Cyclin D1 | Ccnd1 | 5'-GCGTACCCTGACACCAATCTC-3' | 5'-ACTTGAAGTAAGATACGGAGGGC-3' |
| p16 | Cdkn2a | 5'-CGCAGGTTCTTGGTCACTGT-3' | 5'-TGTTCACGAAAGCCAGAGCG-3' |
| p21 | Cdkn1a | 5'-CCTGGTGATGTCCGACCTG-3' | 5'-CCATGAGCGCATCGCAATC-3' |
| p57 | Cdkn1c | 5'-GCAGGACGAGAATCAAGAGCA-3' | 5'-GCTTGGCGAAGAAGTCGTT-3' |
| SSRP1 | Ssrp1 | 5'-CAGAGACATTGGAGTTCAACGA-3' | 5'-GACGGCTCAATCGAAGCCTC-3' |
Table 3
Target proteins detected by western blotting.
| Gene | Protein | Company | Molecular weight (kDa) | Dilution ratio |
|---|---|---|---|---|
| Rela | NF-κB p65 | Cell Signaling Technology | 65 | 1:1000 |
| Nfkbia | I-κBα | Cell Signaling Technology | 39 | 1:1000 |
| Chuk | IKKα | Cell Signaling Technology | 85 | 1:1000 |
| Ikbkb | IKKβ | Cell Signaling Technology | 87 | 1:1000 |
| Pik3r1 | PI3K | Cell Signaling Technology | 85 | 1:1000 |
| Akt1 | P-AKT | Cell Signaling Technology | 60 | 1:1000 |
| Akt1 | AKT | Cell Signaling Technology | 60 | 1:1000 |
| Trp53 | P53 | Cell Signaling Technology | 53 | 1:1000 |
| Ssrp1 | SSRP1 | Cell Signaling Technology | 81 | 1:1000 |
| Gapdh | GAPDH | Cell Signaling Technology | 37 | 1:1000 |
Additional files
Download links
A two-part list of links to download the article, or parts of the article, in various formats.
Downloads (link to download the article as PDF)
Open citations (links to open the citations from this article in various online reference manager services)
Cite this article (links to download the citations from this article in formats compatible with various reference manager tools)
Mir204 and Mir211 suppress synovial inflammation and proliferation in rheumatoid arthritis by targeting Ssrp1
eLife 11:e78085.
https://doi.org/10.7554/eLife.78085


