CCL28 modulates neutrophil responses during infection with mucosal pathogens
- Division of Host-Microbe Systems & Therapeutics, Department of Pediatrics, University of California, San Diego, United States
- Department of Microbiology and Molecular Genetics, University of California Irvine, United States
- Biomedicine Research Unit, Facultad de Estudios Superiores Iztacala, Universidad Nacional Autónoma de México, Mexico
- Department of Biological Sciences, University of Texas at Dallas, United States
- School of Life Sciences, ZIEL - Institute for Food and Health, Freising-Weihenstephan, Technical University of Munich, Germany
- School of Pharmaceutical Sciences, São Paulo State University (UNESP), Araraquara, Brazil
- Red de Apoyo a la Investigación, Universidad Nacional Autónoma de México and Instituto Nacional de Ciencias Médicas y Nutrición Salvador Zubirán, Mexico
- Departamento de Biomedicina Molecular, Centro de Investigación y de Estudios Avanzados del Instituto Politécnico Nacional, Mexico
- Facultad de Medicina, Universidad Nacional Autónoma de México, Mexico
- Department of Microbiology and Immunology, Louisiana State University Health Sciences Center at Shreveport, United States
- Skaggs School of Pharmacy and Pharmaceutical Sciences, University of California San Diego, United States
- Center for Microbiome Innovation, University of California San Diego, United States
- Chiba University-UC San Diego Center for Mucosal Immunology, Allergy, and Vaccines (CU-UCSDcMAV), United States
Figures
Figure 1 with 6 supplements
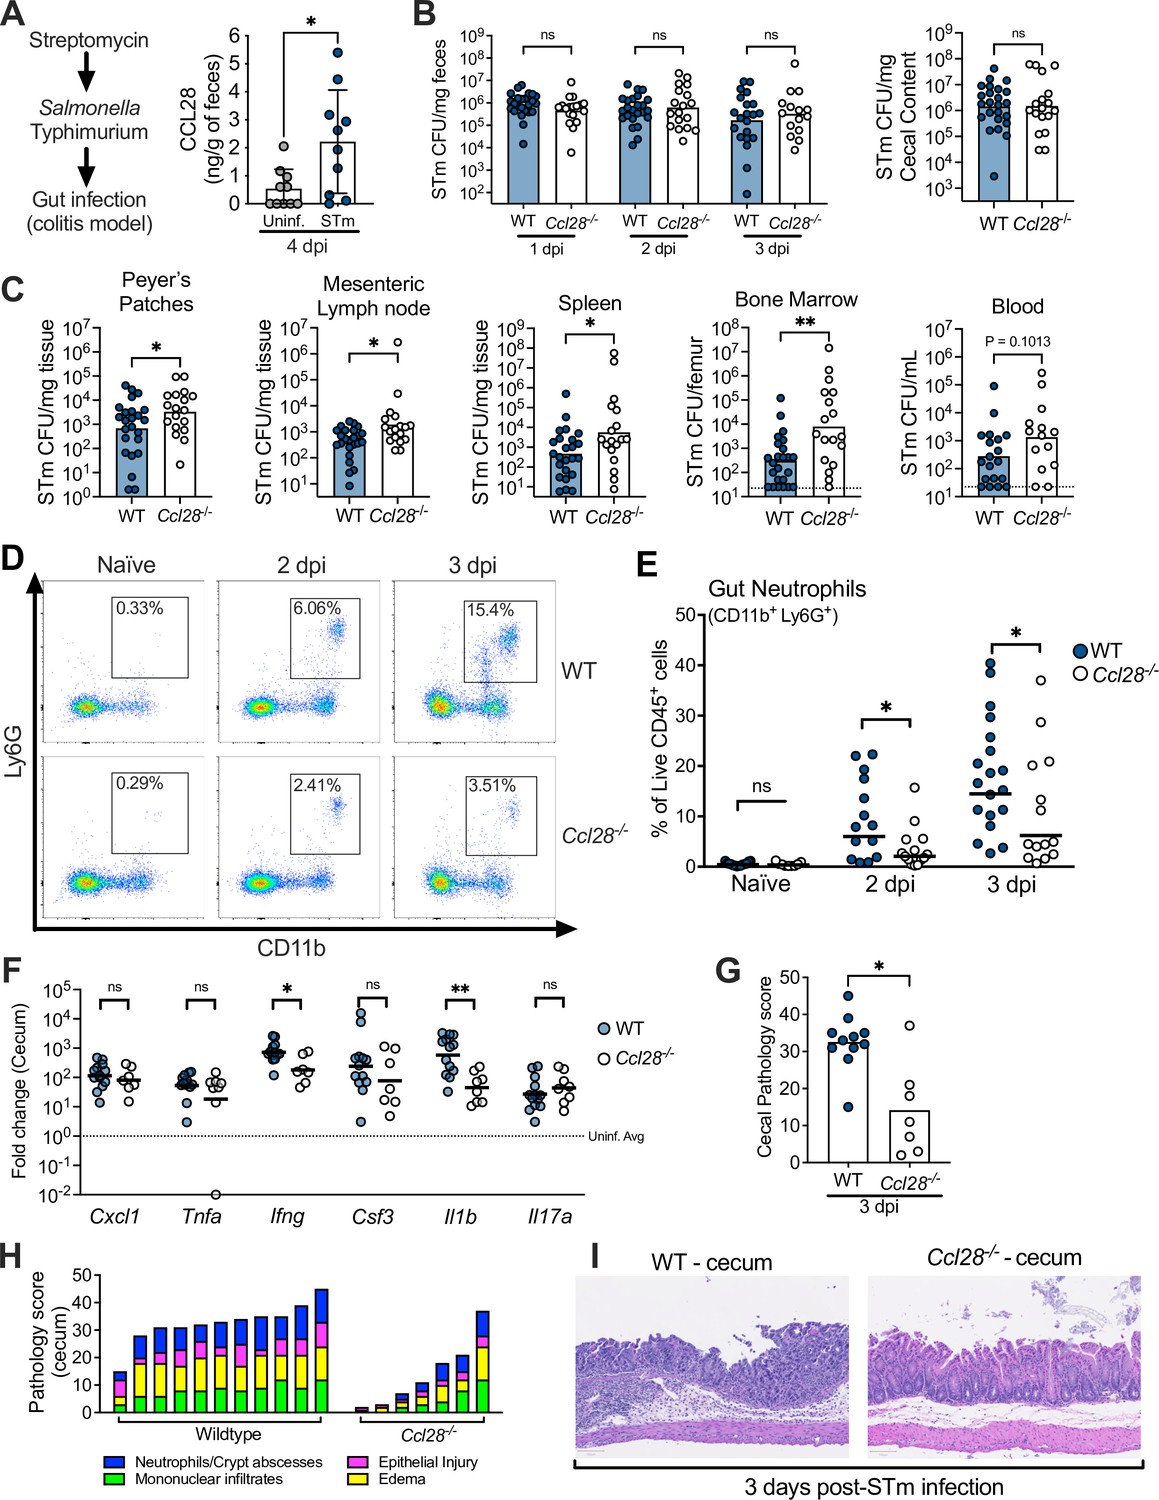
CCL28 confers protection during Salmonella colitis and promotes neutrophil accumulation in the gut.
(A) For the colitis model, wild-type (WT) mice were gavaged with streptomycin 24 hr prior to oral infection with approximately 1 × 10⁹ CFU S. enterica serovar Typhimurium (STm). At 4 days post-infection (dpi), CCL28 in feces was quantified by ELISA. Data shown comprise two independent experiments (uninfected, n = 10; STm, n = 10). Bars represent the mean ± standard deviation (SD). (B) STm CFU in the fecal content collected 1–3 dpi, and in the cecal content 3 dpi from WT (filled circles) and Ccl28−/− (white circles) littermate mice. (C) CFU recovered from the Peyer’s patches, mesenteric lymph nodes, spleen, bone marrow, and blood at 3 dpi. Data shown comprise eight independent experiments (WT, n = 24; Ccl28−/−, n = 18). Some of the spleen data points were published as a preliminary characterization in Burkhardt et al., 2019 and are combined with the new dataset. Bars represent the geometric mean, dotted lines represent the limit of detection. (D) Representative pseudocolor dot plots of neutrophils (CD11b+ Ly6G+ cells; gated on live, CD45+ cells) obtained from the gut tissues of uninfected (Naive) and STm-infected WT or Ccl28−/− mice 2 or 3 dpi, as determined by flow cytometry. (E) Frequency of neutrophils in the live CD45+ cells obtained from the gut mucosa of WT (filled circles) or Ccl28−/− mice (white circles). Naive mouse data shown comprise four independent experiments (WT, n = 14; Ccl28−/−, n = 9); 2 dpi data comprise four independent experiments (WT, n = 14; Ccl28−/−, n = 14); 3 dpi data comprise eight independent experiments (WT, n = 24; Ccl28−/−, n = 18). Bars represent the geometric mean. (F) Relative expression levels (qPCR) of Cxcl1 (CXCL1), Tnfa (TNFα), Ifng (IFNγ), Csf3 (G-CSF), Il1b (IL-1β), and Il17a (IL-17A) in the cecal tissue of STm-infected WT (filled circles, n = 13) or Ccl28−/− mice (white circles, n = 8), 3 dpi, relative to uninfected control mice. Bars represent the geometric mean. Data shown comprise four independent experiments. (G–I) Histopathological analysis of the cecum collected from STm-infected WT or Ccl28−/− mice, 3 dpi (WT, n = 11; Ccl28−/−, n = 7). Scale bars indicate 100 µm. (G) Sum of the total histopathology score (bars represent the mean; symbols represent individual mice), (H) histopathology scores showing the individual analyzed parameters of each mouse (stacked bar height represents the overall score), and (I) hematoxylin and eosin (H&E)-stained sections from one representative animal for each group (×200 magnification). For (B) and (C), CFU data were log-normalized before statistical analysis by Welch’s t test. Mann–Whitney U was used for all other datasets where statistical analysis was performed. A significant difference relative to WT controls is indicated by *p ≤ 0.05, **p ≤ 0.01; ns, not significant.
Figure 1—figure supplement 1
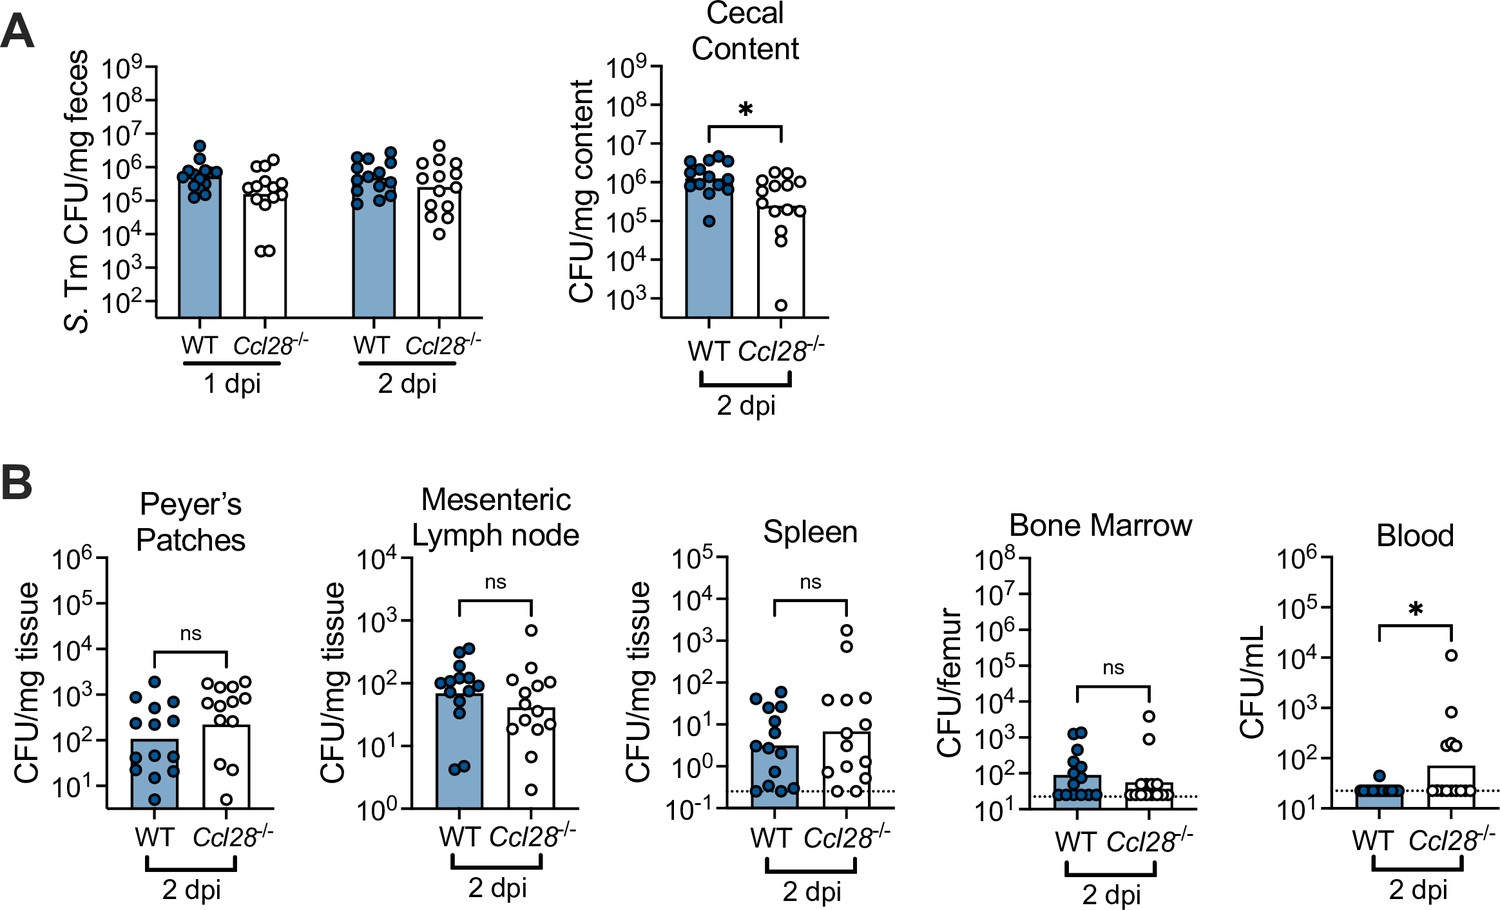
Salmonella gut colonization and extraintestinal levels 2 days post-infection.
(A) STm CFU in the fecal content collected 1 and 2 dpi, and in the cecal content 2 dpi from wild-type (WT, filled circles) and Ccl28−/− (white circles) littermate mice. (B) STm CFU recovered from the Peyer’s patches, mesenteric lymph nodes, spleen, bone marrow, and blood at 2 dpi. Data shown comprise four independent experiments (WT, n = 14; Ccl28−/−, n = 13). Bars represent the geometric mean; dotted lines represent the limit of detection. CFU data were log-normalized before statistical analysis by Welch’s t test. A significant difference relative to WT controls is indicated by *p ≤ 0.05, ns, not significant.
Figure 1—figure supplement 2
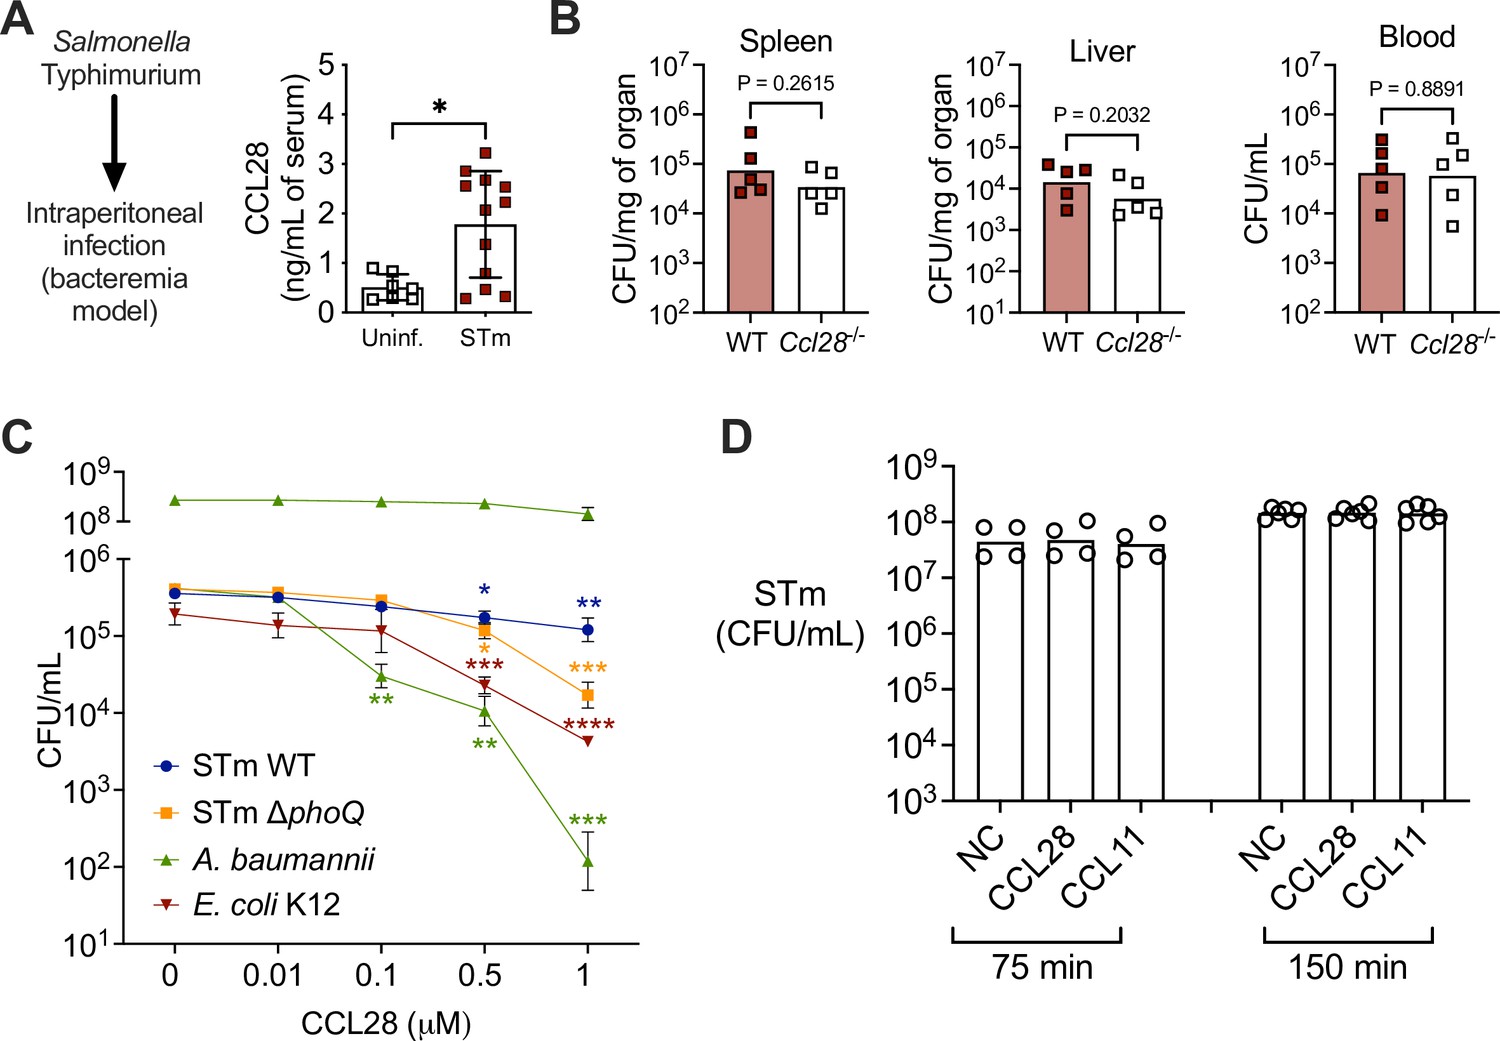
CCL28 does not confer protection in a Salmonella bacteremia model, and lacks direct antimicrobial activity against Salmonella.
(A, B) For the bacteremia model, mice were infected by intraperitoneal injection with S. Typhimurium (STm, 1 × 10³ CFU) or sterile PBS (uninfected control). (A) At 4 days post-infection, CCL28 in serum was quantified by ELISA of wild-type (WT) mice (uninfected, n = 7; STm, n = 12). Data shown comprise two independent experiments. Bars represent the mean ± standard deviation (SD). (B) STm CFU was determined in the spleen, liver, and blood of WT mice (black squares) and Ccl28−/− mice (white squares) 4 days after intraperitoneal infection with STm (1 × 10³ CFU). Data shown comprise two independent experiments (WT, n = 5; Ccl28−/−, n = 5). Bars represent the geometric mean. (C, D) In vitro antimicrobial activity of CCL28 against STm WT, STm ΔphoQ, E. coli K12, and A. baumannii. (C) 5 × 10⁵ CFU/ml of each strain (A. baumannii additionally at 5 × 10⁸ CFU/ml) was incubated with recombinant murine CCL28 at the indicated concentrations (n = 4 per group), and CFU were enumerated after 2 hr. (D) STm WT (1 × 10⁷ CFU/ml) was incubated with recombinant murine CCL28 (50 nM) or CCL11 (25 nM) and CFU were enumerated at 75 min (n = 4 per group) and 150 min (n = 6 per group). Bars represent the geometric mean. (A) Data were analyzed by Mann–Whitney U relative to uninfected controls. (B) CFU data were log-normalized before statistical analysis by Welch’s t test. (C) Log-transformed data were analyzed by non-parametric one-way analysis of variance (ANOVA) (Kruskal–Wallis) for independent samples. Dunn’s multiple comparison test was performed to compare bacterial CFU at each time point relative to time zero (control group). Significant changes are indicated by *p ≤ 0.05, **p ≤ 0.01, ***p ≤ 0.001, ****p ≤ 0.0001.
Figure 1—figure supplement 3
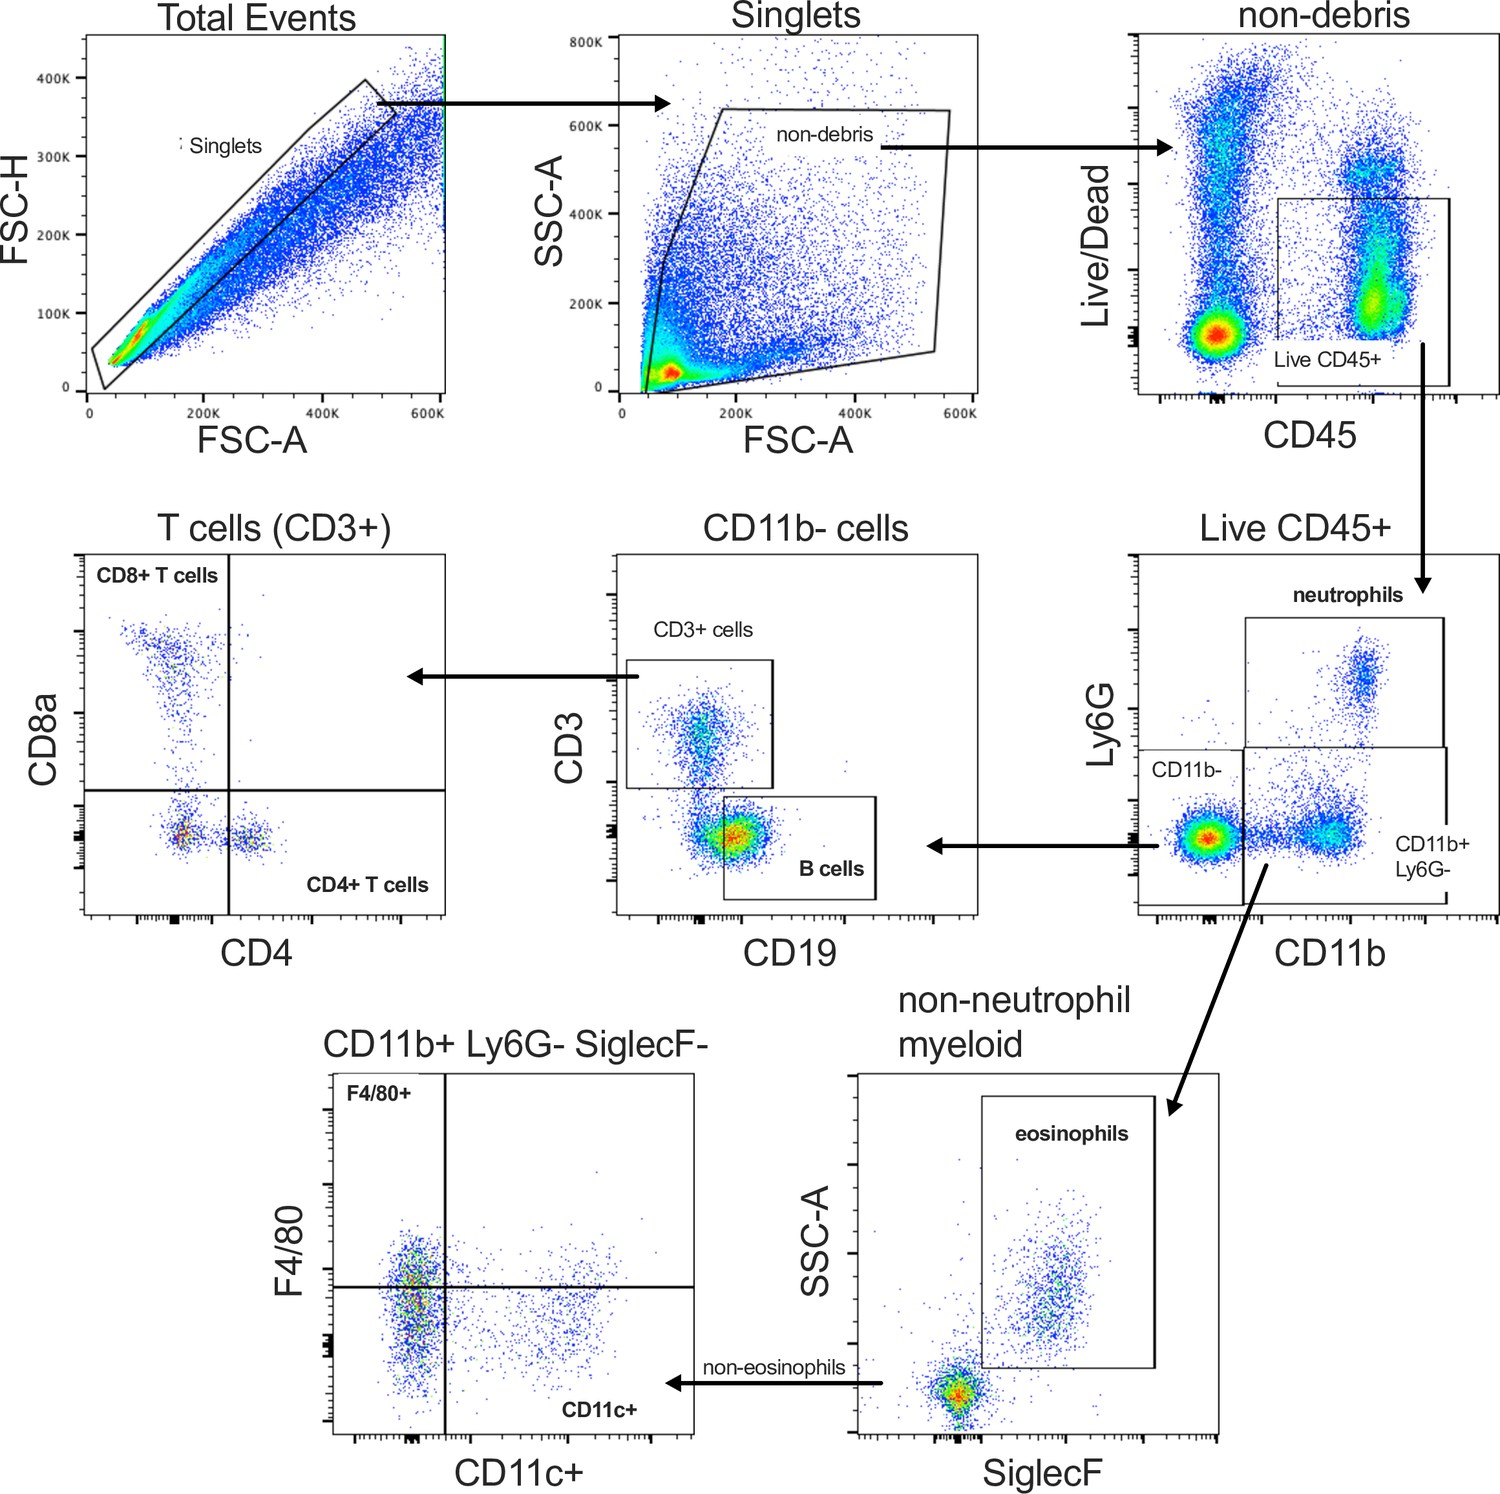
Flow cytometry gating strategy for the identification and classification of major immune cell populations in the tissues of STm-infected mice.
An equivalent strategy was also used to immunophenotype cells from uninfected and Acinetobacter baumannii-infected tissues. Representative cytometry data were collected using a Sony SA3800 Spectral Analyzer and gated/analyzed based on FMO controls in FlowJo ver. 10.8.1.
Figure 1—figure supplement 4
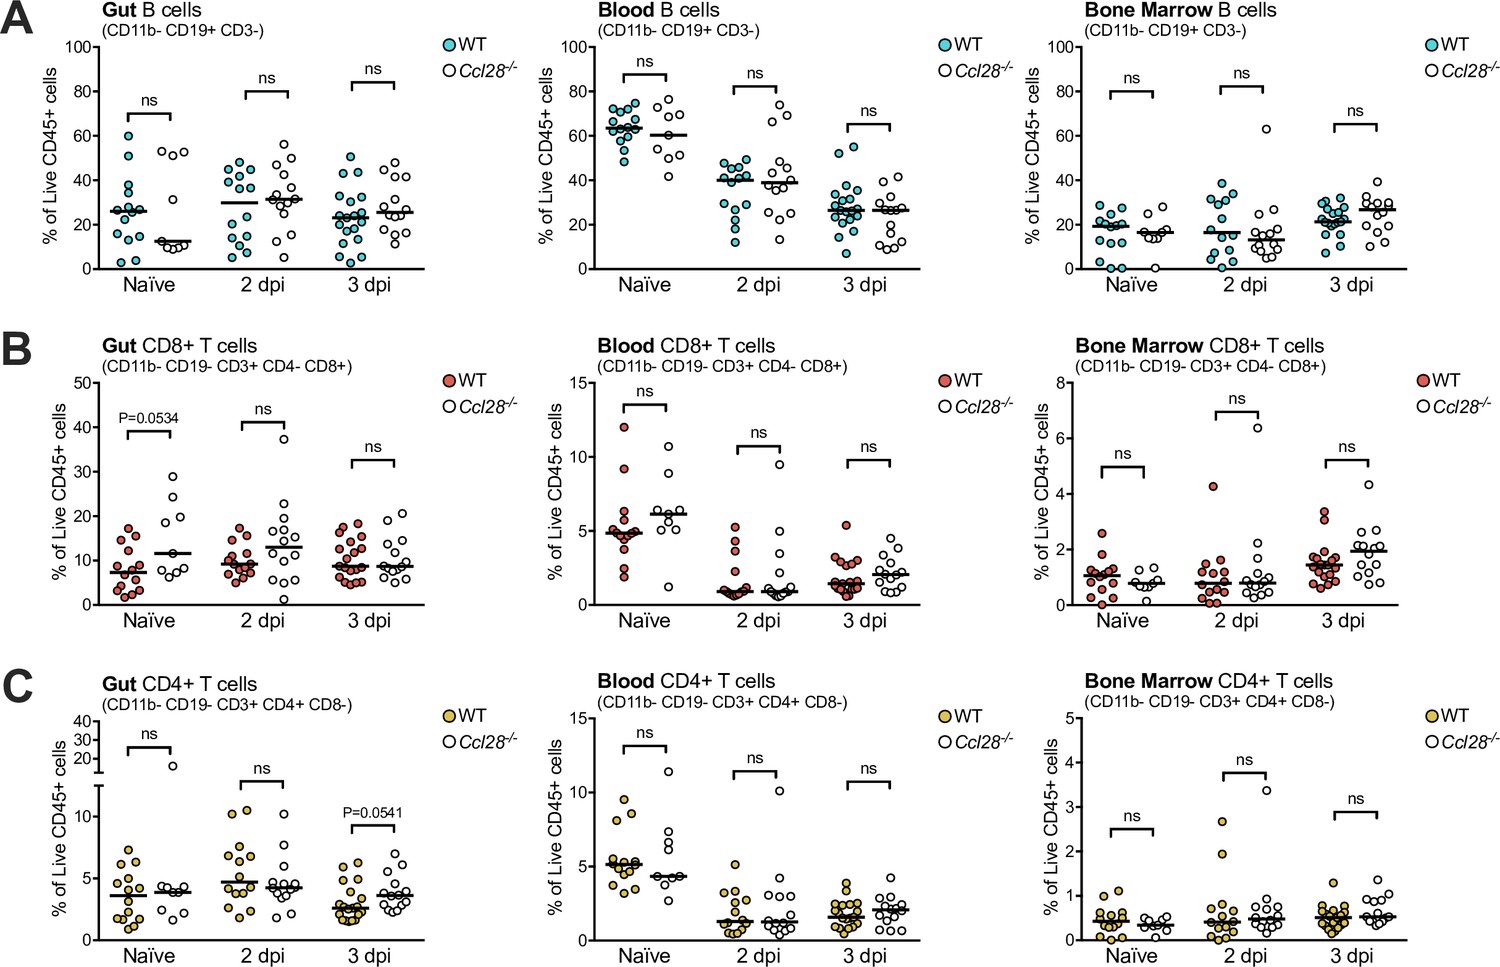
Wild-type (WT) and Ccl28−/− mice exhibit similar numbers of B and T cells in the gut, blood, and bone marrow.
Flow cytometry quantification of live, CD45+ CD11b− immune cells recovered from WT and Ccl28−/− mouse gut, blood, and bone marrow, before (Naive) and during STm infection (2 and 3 dpi). Data indicate the relative abundance of B cells (A), CD11b− CD3− CD19+, CD8+ T cells (B), CD11b− CD19− CD3+ CD8+ CD4−, and CD4+ T cells (C), CD11b− CD19− CD3+ CD4+ CD8− as a proportion of total live CD45+ cells profiled from each tissue. Each data point represents measurements from one mouse, with filled points from WT and empty points from Ccl28−/− mice. Data are derived from the same set of pooled experiments presented in Figure 1D, E. Bars represent the median. Comparisons between WT and Ccl28−/− mice were made by Mann–Whitney test on unnormalized data. p-values <0.06 indicated; ns, not significant.
Figure 1—figure supplement 5
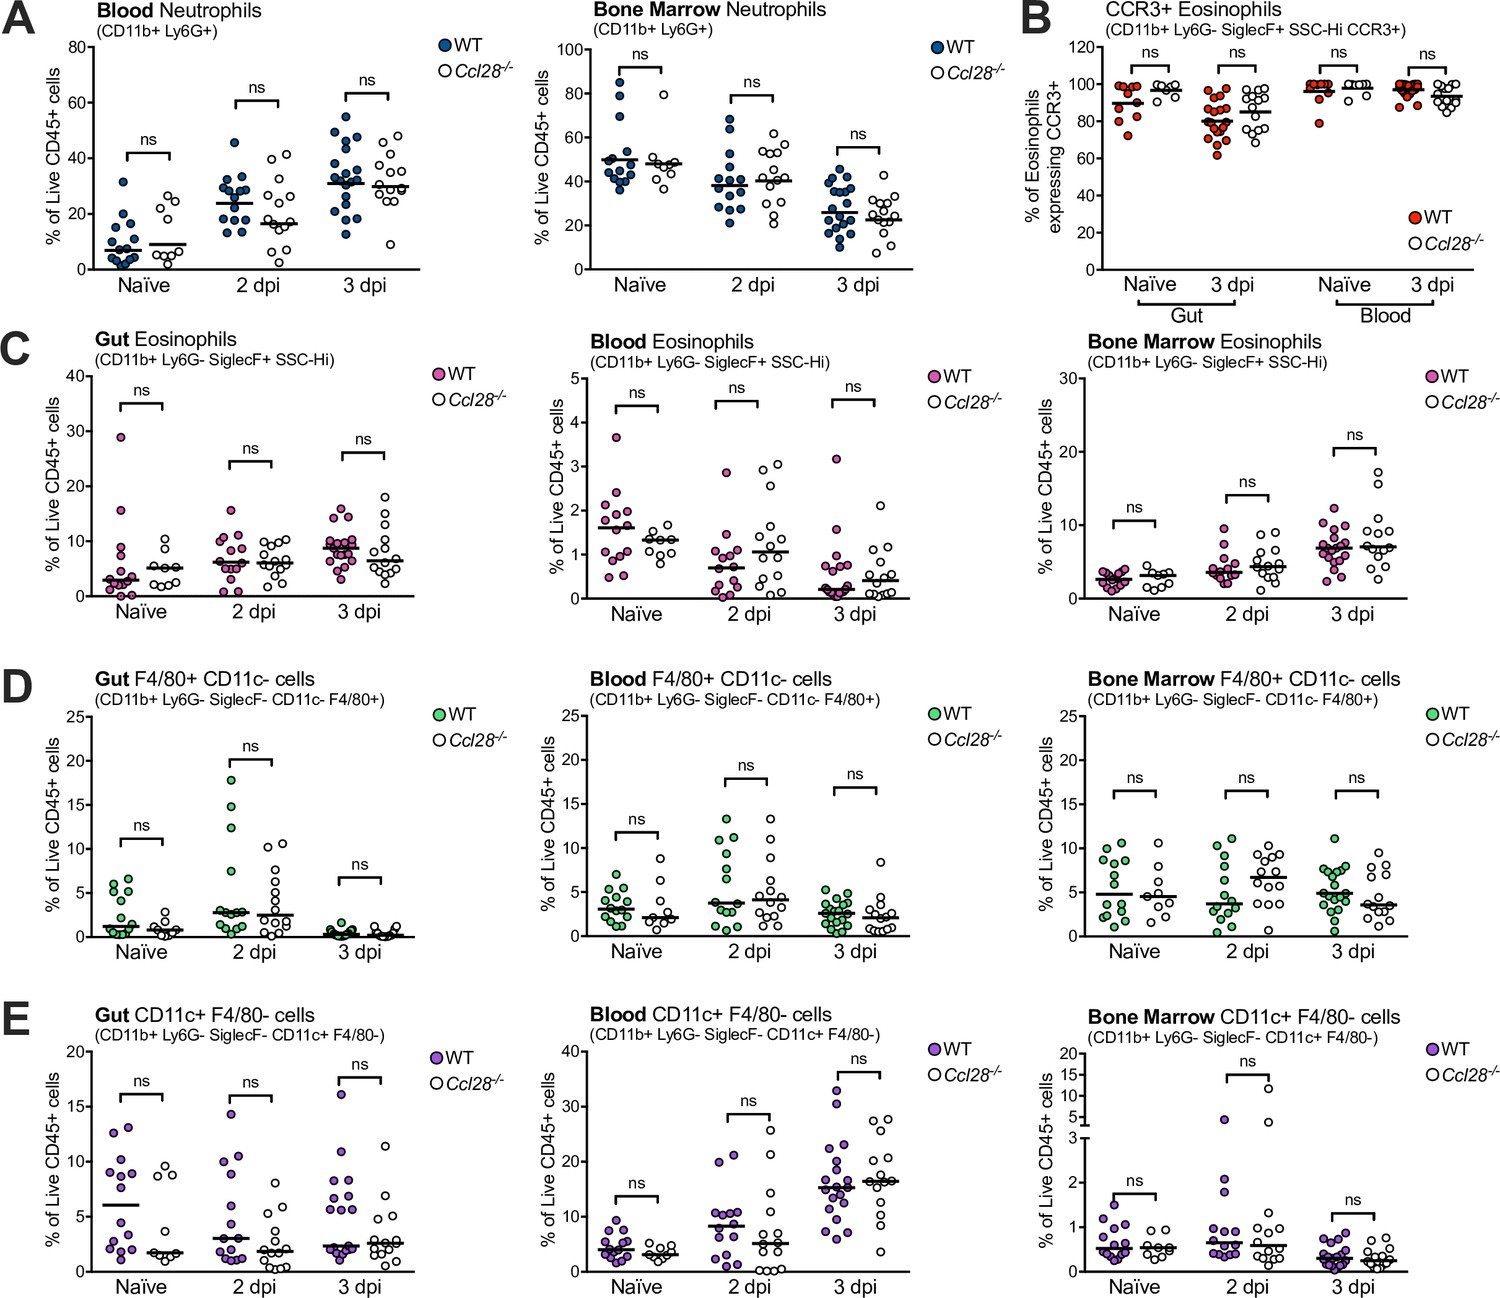
Profiling granulocyte and APC-like cell abundance in wild-type (WT) and Ccl28−/− mouse tissues during STm infection.
Flow cytometry quantification of live, CD45+ CD11b+ immune cells recovered from WT and Ccl28−/− mouse gut, blood, and bone marrow, before (Naive) and during STm infection (2 and 3 dpi). (A) Data indicate the relative abundance of neutrophils (CD11b+ Ly6G+) in the blood and bone marrow, as a proportion of total live CD45+ cells profiled. (B) Expression of CCR3 by eosinophils isolated from the gut and blood compartments of Naive and STm-infected (3 dpi) mice. The relative abundance of eosinophils (C, CD11b+ Ly6G− SiglecF+ side scatterhigh), macrophage-like F4/80+ CD11c− cells (D, CD11b+ Ly6G− SiglecF− F4/80+ CD11c−), and conventional dendritic cell-like CD11c+ F4/80 cells (E, CD11b+ Ly6G− SiglecF− CD11c+ F4/80−), as a proportion of total live CD45+ cells profiled from each tissue. Each data point represents measurements from one mouse, with filled points from WT and empty points from Ccl28−/− mice. Data are derived from the same set of pooled experiments presented in Figure 1D, E. Bars represent the median. Comparisons between WT and Ccl28−/− mice were made by Mann–Whitney test on unnormalized data. ns, not significant.
Figure 1—figure supplement 6
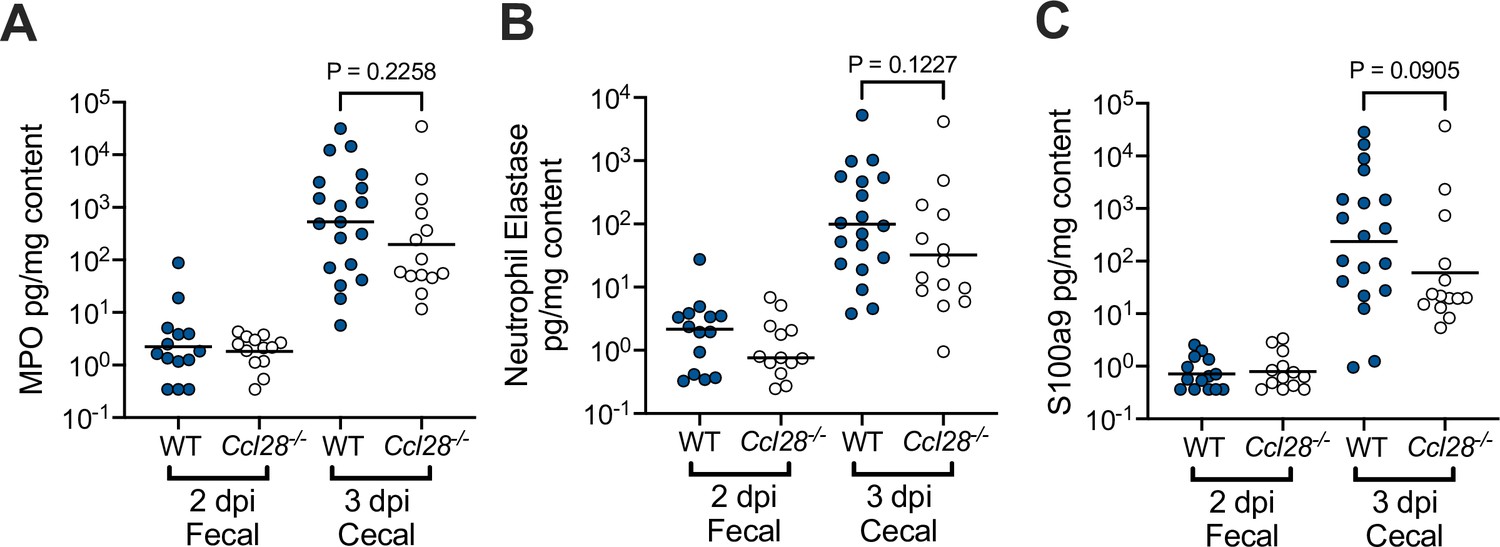
Neutrophil-associated antimicrobial protein levels during intestinal STm infection of wild-type (WT) and Ccl28−/− mice.
The levels of myeloperoxidase (MPO; A) neutrophil elastase (B), and S100A9 (a component of the antimicrobial calcium-binding protein calprotectin; C), were measured by ELISA from the fecal and cecal supernatant of STm-infected WT and Ccl28−/− littermate mice. Statistical comparisons on data from WT and Ccl28−/− mice were made by Mann–Whitney test on unnormalized data, with p-values indicated.
Figure 2 with 3 supplements
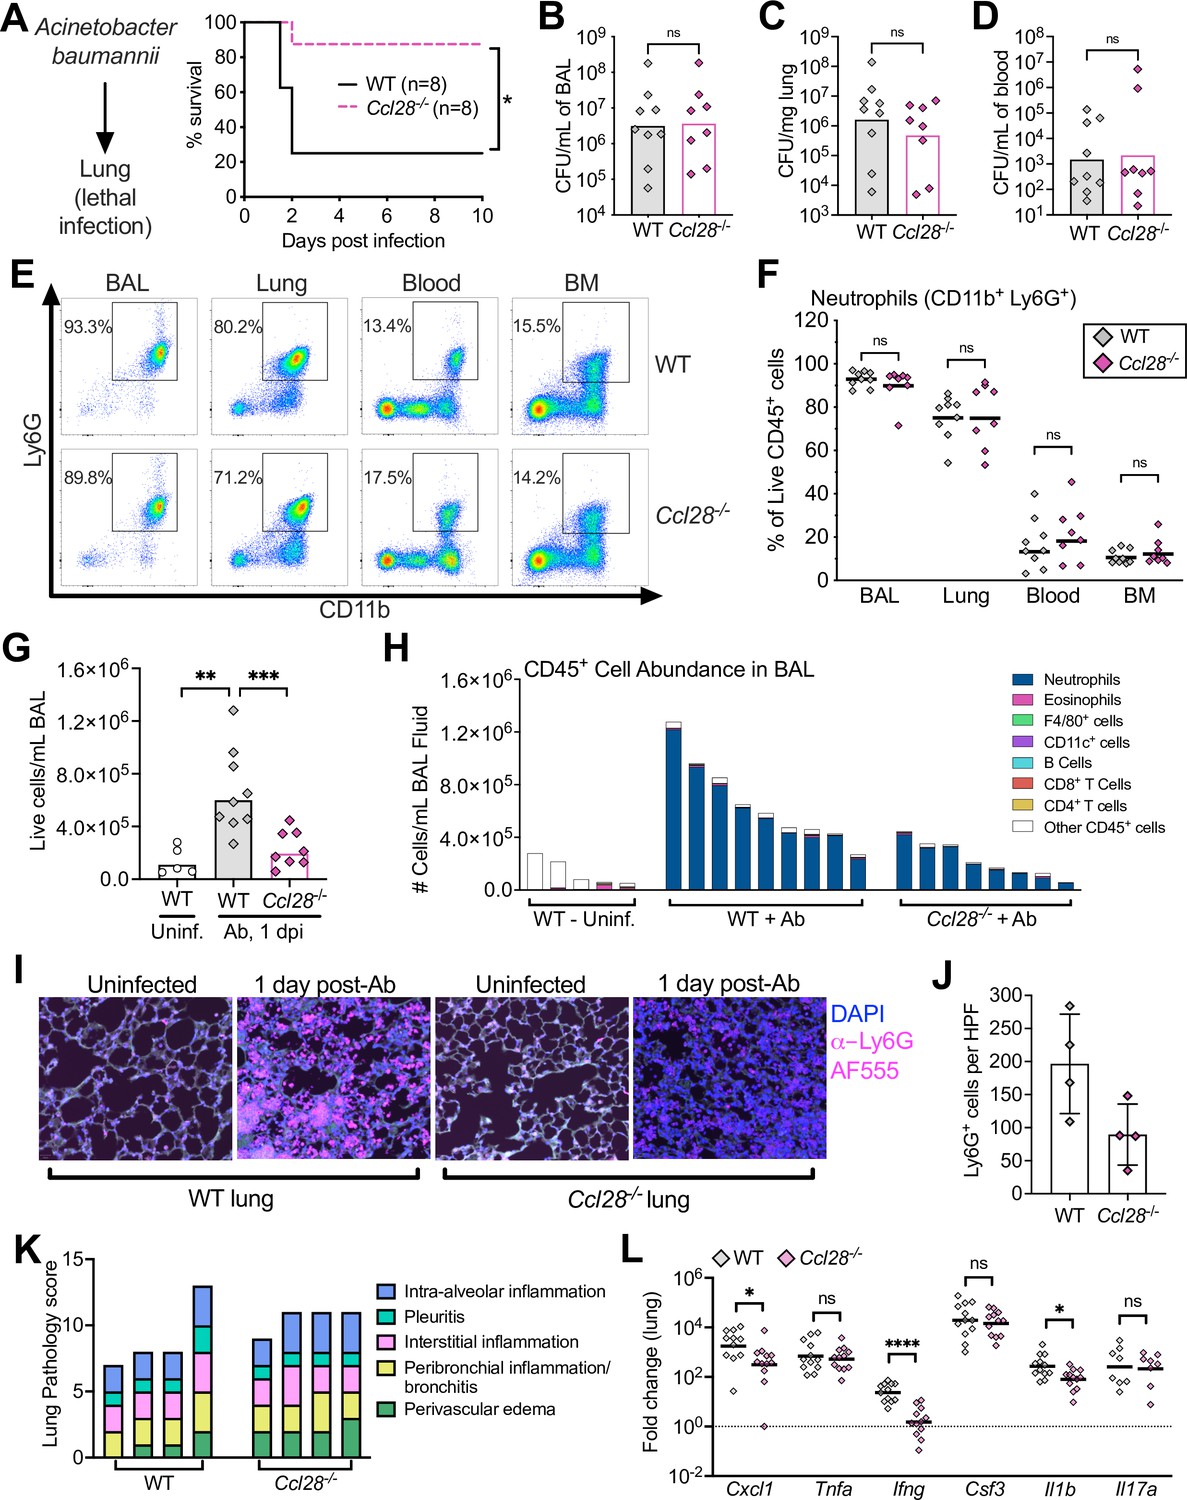
Absence of CCL28 confers protection in a lethal Acinetobacter pneumonia model.
(A) Wild-type (WT) mice (solid black line) and Ccl28−/− mice (dashed magenta line) were intratracheally infected with approximately 1 × 10⁸ CFU Acinetobacter baumannii (Ab) and their survival was determined for 10 days. Data shown comprise two independent experiments (WT, n = 8; Ccl28−/−, n = 8). (B–H) WT mice (n = 9) and Ccl28−/− mice (n = 8) were intratracheally infected with Ab and sacrificed 1 day post-infection (dpi). Data shown comprise three independent experiments. Symbols represent data from individual mice. (B–D) Ab CFU were quantified from the BAL (bronchoalveolar lavage) fluid, (C) lung tissue, and (D) blood in WT (gray symbols) and Ccl28−/− mice (magenta symbols). Bars represent the geometric mean. (E) Representative pseudocolor dot plots of neutrophils (CD11b+ Ly6G+ cells; gated on live, CD45+ cells) and (F) frequency of neutrophils obtained from the BAL, lung, blood, and bone marrow of Ab-infected WT or Ccl28−/− mice, as determined by flow cytometry. Lines represent the geometric mean. (G) The number of live host cells per mL of BAL, determined using an automated cell counter with Trypan Blue counterstain to assess viability, from uninfected WT (Uninf., n = 5), and Ab-infected WT (n = 9); and Ccl28−/− mice (n = 8). Bars represent the geometric mean. (H) Relative abundance of different leukocyte populations as a proportion of the live CD45+ cell population was assessed in the BAL. Each bar represents data from one mouse. (I) Representative immunofluorescence image of lungs from WT and Ccl28−/− mice, uninfected or infected with Ab, stained for the neutrophil marker Ly6G (magenta). 4′,6-diamidino-2-phenylindole (DAPI, blue) was used to label nuclei. Scale bars indicate 20 µm. (J) Quantification of Ly6G+ cells per high-power field (HPF) from immunofluorescence images of lungs from WT mice (n = 4) and Ccl28−/− mice (n = 4). Bars represent the mean ± standard deviation (SD). (K) Histopathological analysis of lungs from WT and Ccl28−/− mice infected with Ab at 1 dpi. Each bar represents an individual mouse. (L) Relative expression levels (qPCR) of Cxcl1 (CXCL1), Tnfa (TNFα), Ifng (IFNγ), Csf3 (G-CSF), Il1b (IL-1β), and Il17a (IL-17A) in the lung of WT (n = 11) or Ccl28−/− mice (n = 12) infected with Ab (1 dpi). Bars represent the geometric mean. Data shown comprise three independent experiments. For (A), survival curves were statistically compared using a log-rank (Mantel–Cox) test. For (B–D), CFU data were log-normalized before analysis by Welch’s t test. For (F), (G), and (L), Mann–Whitney U was used to compare groups with unknown distribution. A significant difference between groups is indicated by *p ≤ 0.05, **p ≤ 0.01, ***p ≤ 0.001, ****p ≤ 0.0001. ns, not significant.
Figure 2—figure supplement 1
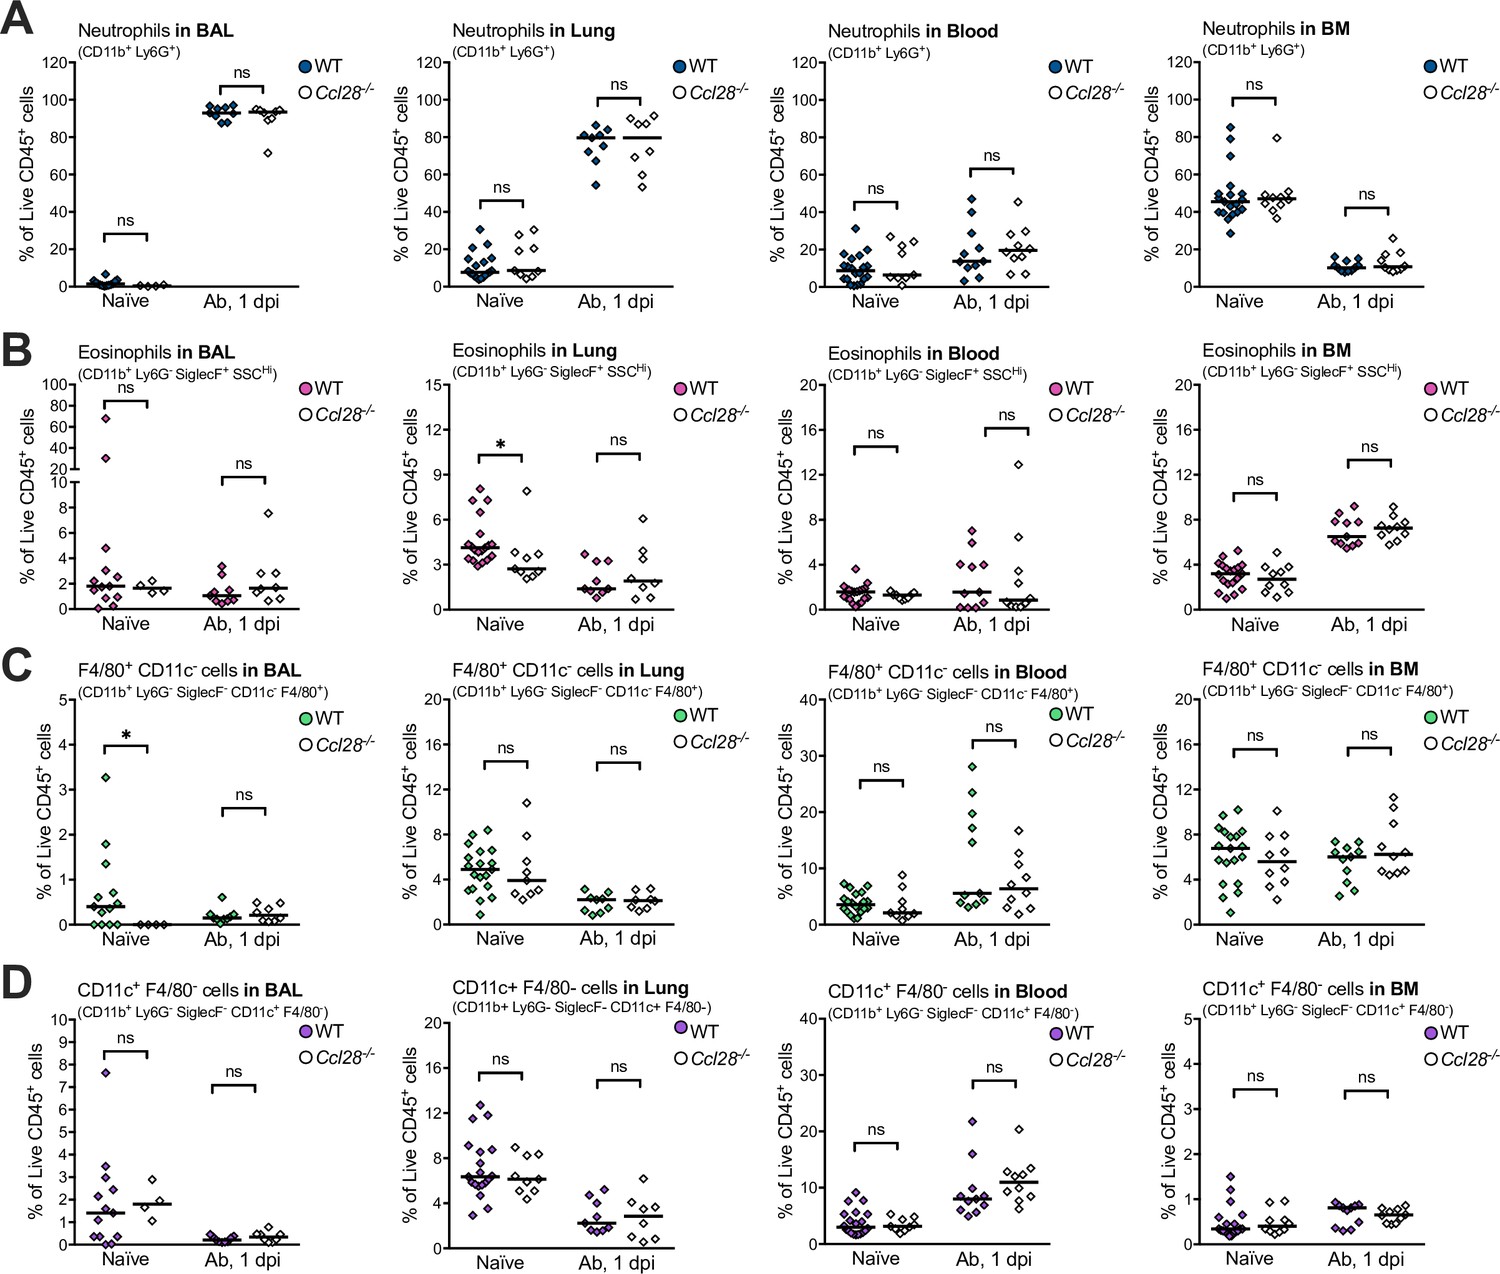
Immunophenotyping of CD11b+ immune cells recovered from wild-type (WT) and Ccl28−/− mice during A. baumannii infection.
Data indicate the relative abundance of neutrophils (A, CD11b+ Ly6G+), eosinophils (B, CD11b+ Ly6G− SiglecF+ side scatterhigh), macrophage-like F4/80+ CD11c− cells (C), CD11b+ Ly6G− SiglecF− F4/80+ CD11c−, and conventional dendritic cell-like CD11c+ F4/80 cells (D), CD11b+ Ly6G− SiglecF− CD11c+ F4/80− as proportions of total live CD45+ cells in the bronchoalveolar lavage (BAL), lungs, blood, and bone marrow, from uninfected (naive) and 1 day post-inoculation with A. baumannii (Ab), profiled by flow cytometry. Each data point is a quantification from one mouse, with filled points representing WT and empty points as Ccl28−/− mice. Data are derived from the same pool of repeated experiments presented in Figure 2I, J, with additional data from naive mice (blood and BM measurements from naive mice are repeated from Figure 1—figure supplement 5 and included to ease comparison to Ab infection). Comparisons between WT and Ccl28−/− mice were made by Mann–Whitney test on unnormalized data. *p ≤ 0.05; ns, not significant.
Figure 2—figure supplement 2
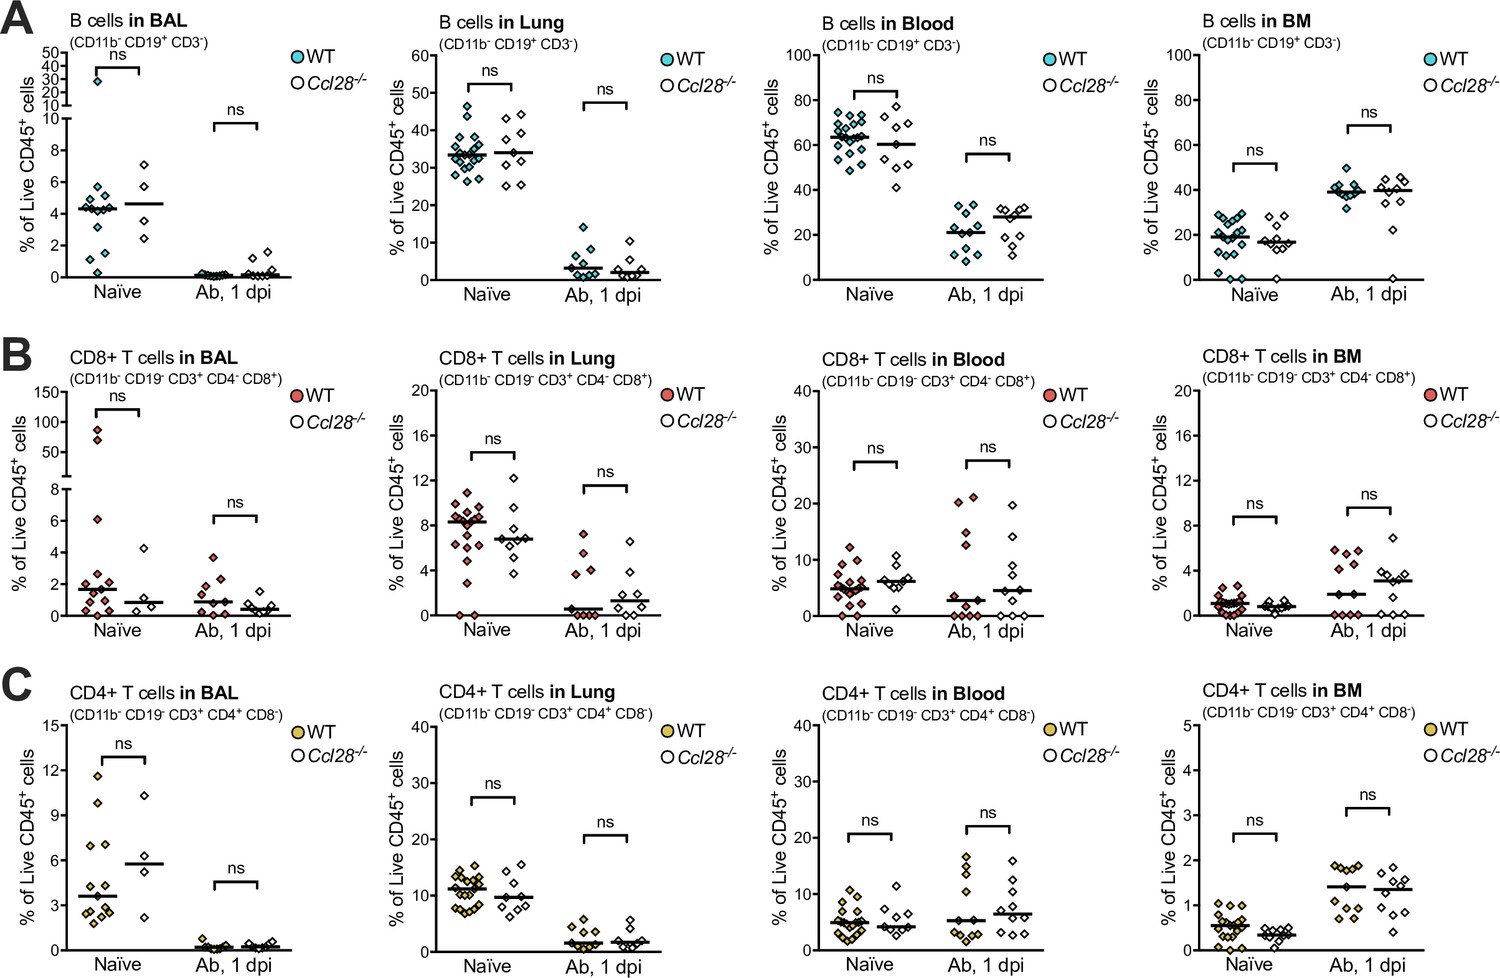
Immunophenotyping of lymphocytes recovered from wild-type (WT) and Ccl28−/− mice during A. baumannii infection.
Data indicate the relative abundance of B cells (A, CD11b− CD3− CD19+), CD8+ T cells (B, CD11b− CD19− CD3+ CD4− CD8+), and CD4+ T cells (C), CD11b− CD19− CD3+ CD4+ CD8−, as proportions of total live CD45+ cells in the bronchoalveolar lavage (BAL), lungs, blood, and bone marrow, from uninfected (naive) and 1 dpi with A. baumannii (Ab), profiled by flow cytometry. Each data point is a quantification from one mouse, with filled points representing WT and empty points as Ccl28−/− mice. Data are derived from the same pool of repeated experiments presented in Figure 2I, J, with additional data from naive mice (blood and BM measurements from naive mice are repeated from Figure 1—figure supplement 4 and included to ease comparison to Ab infection). Comparisons between WT and Ccl28−/− mice were made by Mann–Whitney test on unnormalized data. ns, not significant.
Figure 2—figure supplement 3
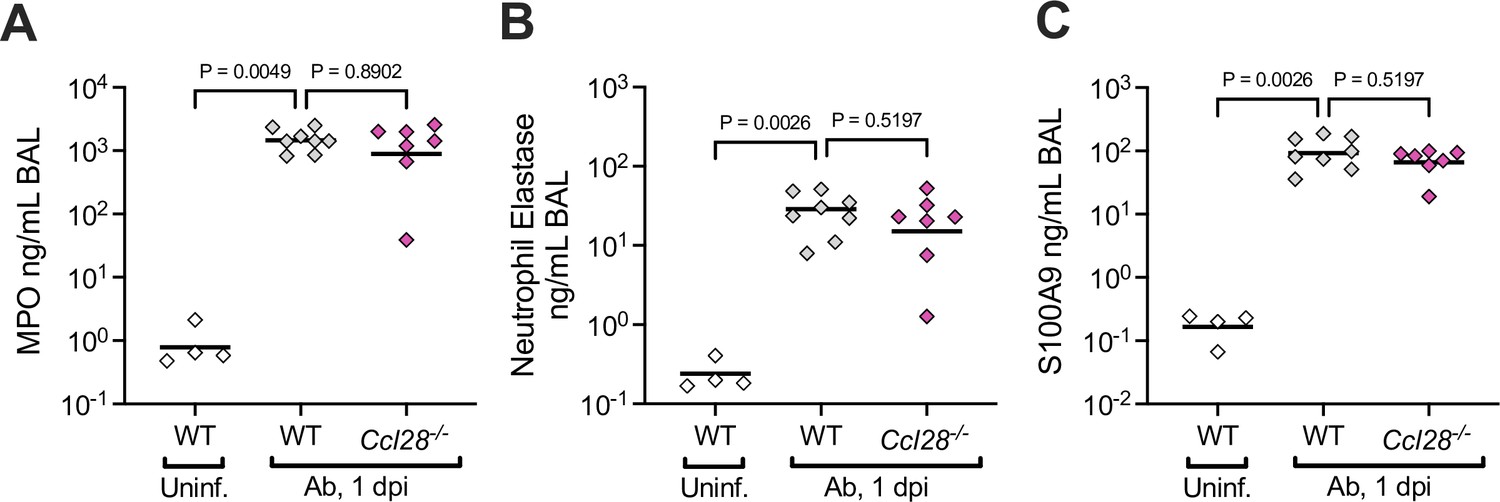
Neutrophil-associated antimicrobial protein levels during lung Ab infection of wild-type (WT) and Ccl28−/− mice.
The levels of myeloperoxidase (MPO; A) neutrophil elastase (B), and S100A9 (C), were measured by ELISA from the supernatant of the bronchoalveolar lavage fluid (BAL) from uninfected WT and Ab-infected WT and Ccl28−/− littermates. Statistical comparisons on data from WT and Ccl28−/− mice were made by Mann–Whitney test on unnormalized data, with p-values indicated.
Figure 3 with 1 supplement
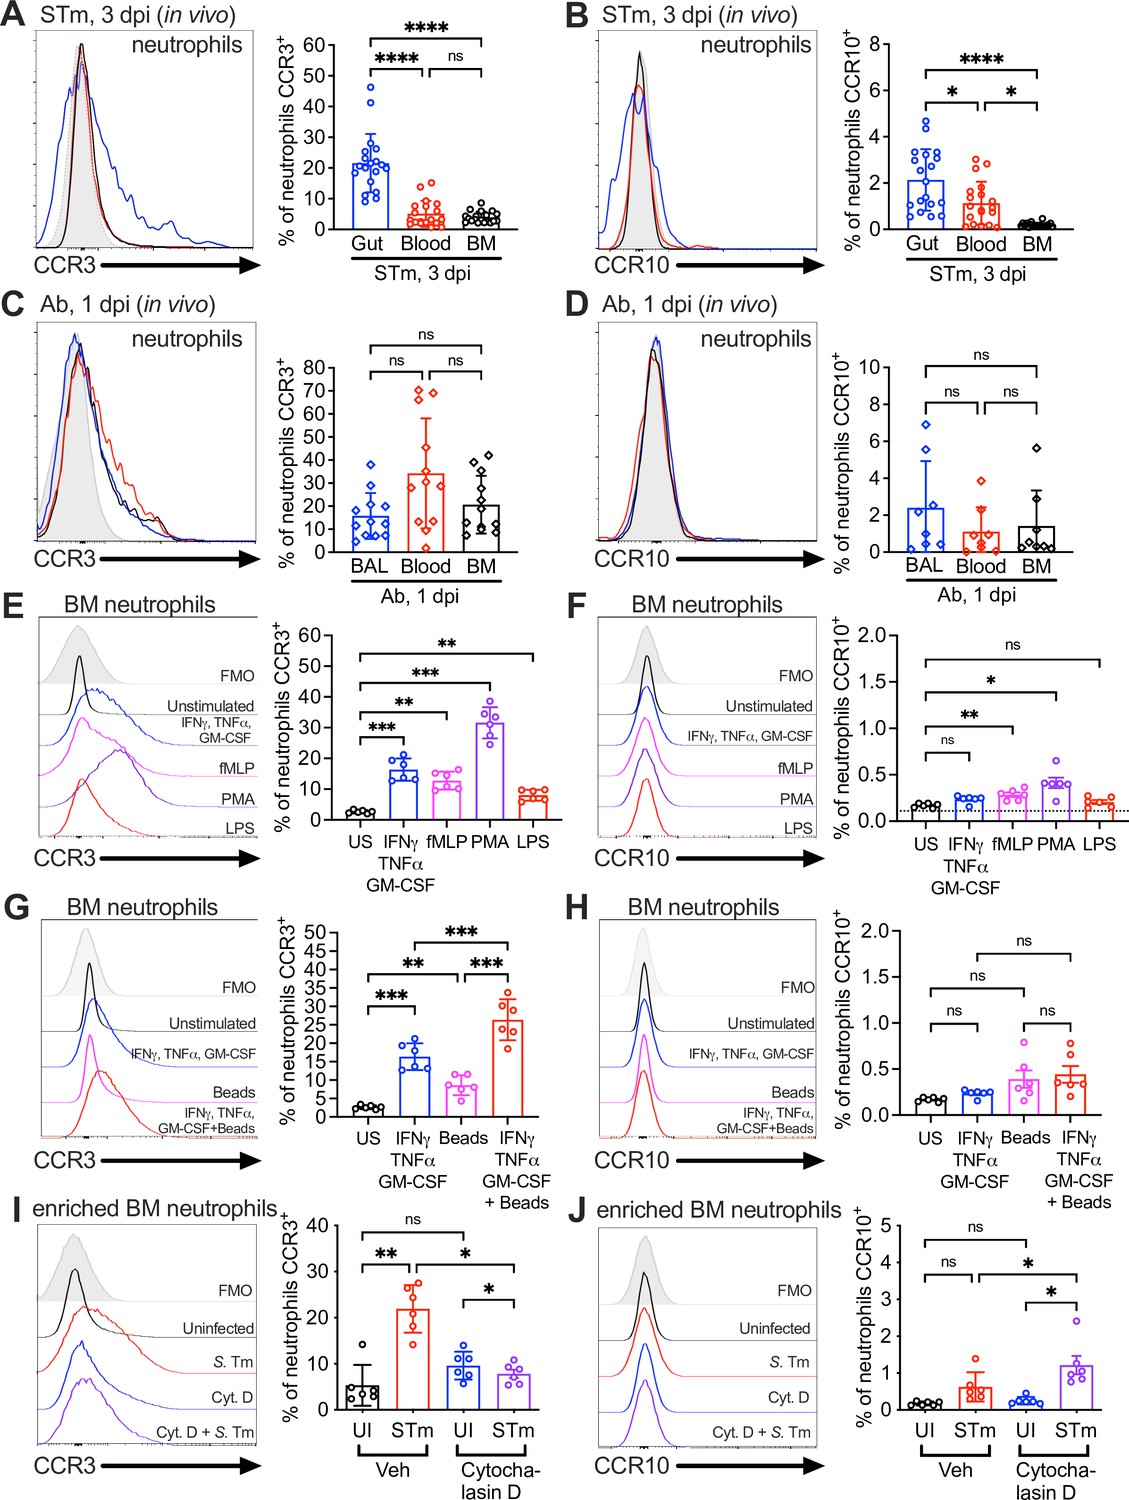
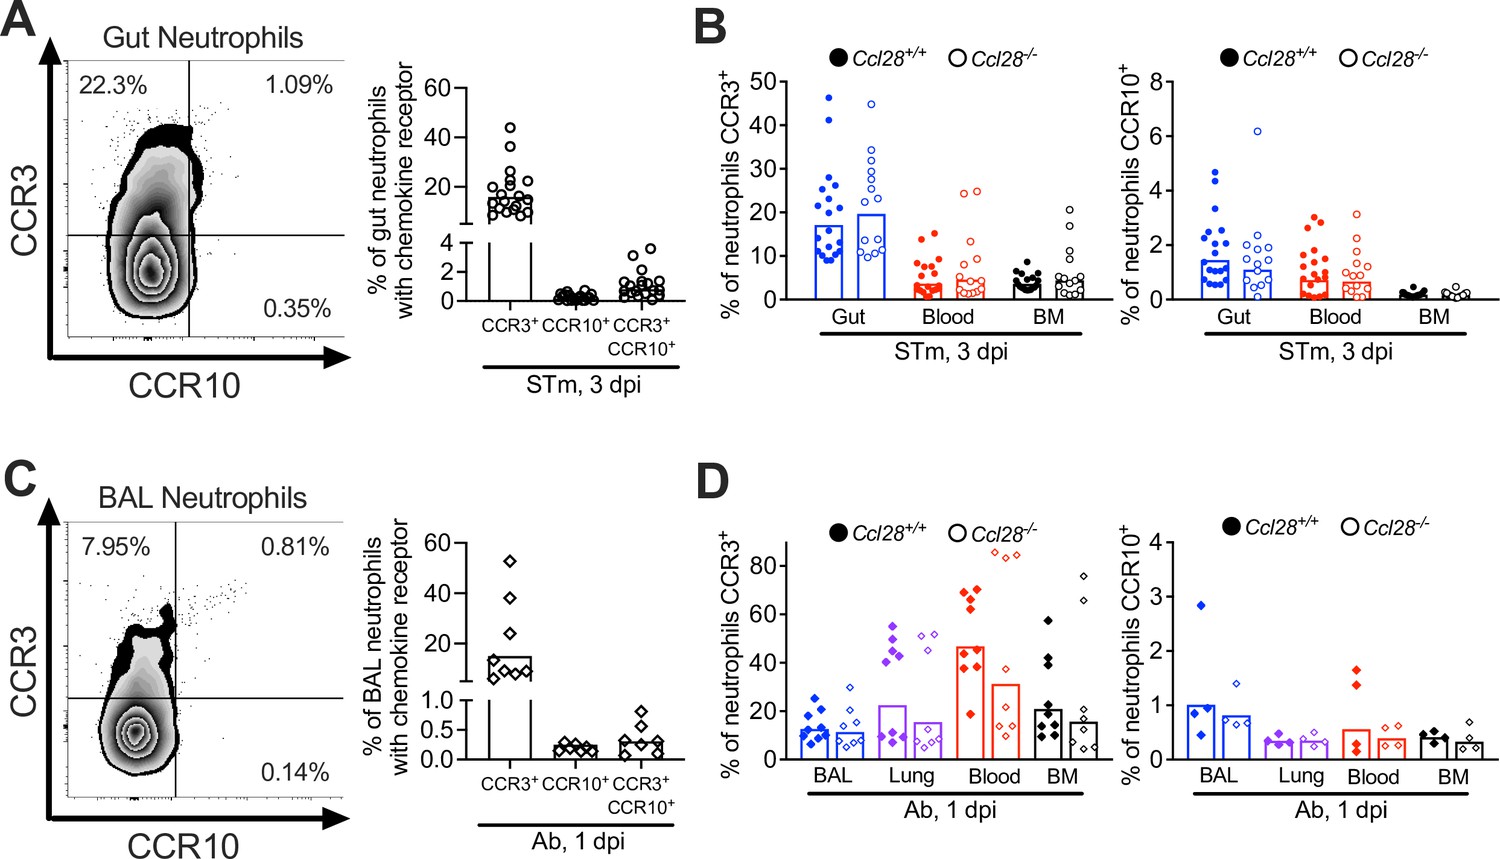
Surface expression of the CCL28 receptors CCR3 and CCR10 on neutrophils from infected tissue, and upon stimulation with proinflammatory stimuli and phagocytosis.
Surface expression of (A, C) CCR3 or (B, D) CCR10 on murine neutrophils obtained from (A, B) the gut, blood, and bone marrow (BM) 3 dpi with STm, or (C, D) the bronchoalveolar lavage (BAL), blood, and bone marrow 1 dpi with Ab, analyzed by flow cytometry. Left panels show representative histograms of (A, C) CCR3 or (B, D) CCR10 expression on the surface of neutrophils (gated on live, CD45+ CD11b+ Ly6G+ cells) from (A, B) the gut (blue), blood (red), and bone marrow (BM; black) or (C, D) BAL (blue), blood (red), and bone marrow (BM; black). Right panels show the percentage of (A, C) CCR3+ or (B, D) CCR10+ neutrophils obtained from (A, B) gut, blood, and BM or (C, D) BAL, blood, and BM. Data are from six independent experiments. (E–H) Uninfected bone marrow neutrophils were unstimulated or treated with the indicated stimuli for 4 hr. Surface expression of (E, G) CCR3 and (F, H) CCR10 on neutrophils was determined by flow cytometry. Left panels show representative histograms of (E, G) CCR3 or (F, H) CCR10 surface expression after stimulation with: (E, F) cytokines IFNγ + TNFɑ + GM-CSF (blue); fMLP (magenta); phorbol 12-myristate 13-acetate (PMA) (purple); lipopolysaccharide (LPS) (red); (G, H) cytokines IFNγ + TNFɑ + Granulocyte-macrophage colony stimulating factor (GM-CSF, blue); beads alone (magenta); cytokines plus beads (red). Right panels show the percentage of (E, G) CCR3+ or (F, H) CCR10+ neutrophils following stimulation with the indicated stimuli. US = unstimulated. Data shown are pooled from two independent experiments. (I, J) Bone marrow cells enriched for neutrophils were infected with opsonized STm at a multiplicity of infection (MOI) = 10 for 1 hr with (violet) or without (red) pretreatment with cytochalasin D for 30 min before infection. Surface expression of (I) CCR3 or (J) CCR10 was determined by flow cytometry. Data are from two independent experiments. Left panels show representative histograms of surface receptor staining on neutrophils, and right panels show the percentages. (A–J, right panels) Bars represent the mean ± standard deviation (SD). (A–D) Data were analyzed by one-way analysis of variance (ANOVA) for paired samples (non-parametric Friedman test), assuming non-normal distribution and non-equal SD given the differences in the variance among the groups, followed by Dunn’s multiple comparisons test. (E–J) Data were analyzed by one-way ANOVA for paired samples, applying the Greenhouse–Geisser correction given the differences in variance among the groups; Bonferroni’s multiple comparison test was performed to compare between relevant stimulation conditions. Significant changes are indicated by *p ≤ 0.05, **p ≤ 0.01, ***p ≤ 0.001, ****p ≤ 0.0001; ns, not significant.
Figure 3—figure supplement 1
Expression of CCR3 and CCR10 in neutrophils isolated from the gut and lung mucosa in infected wild-type (WT) and Ccl28−/− mice.
(A) Surface expression of CCR3 and CCR10 on neutrophils obtained from the gut of WT mice (n = 19, pooled from six independent experiments) infected with STm for 3 days, analyzed by flow cytometry. (B) Percentage of CCR3+ and CCR10+ neutrophils obtained from the gut, blood, and bone marrow of Ccl28+/+ (n = 19) and Ccl28−/− mice (n = 14) infected with STm for 3 days, analyzed by flow cytometry. (C) Surface expression of CCR3 and CCR10 on neutrophils obtained from the bronchoalveolar lavage (BAL) of WT mice (n = 8, pooled from two independent experiments) infected with Ab for 1 day, analyzed by flow cytometry. (D) Percentage of CCR3+ neutrophils (WT n = 9; Ccl28−/− n = 8) and CCR10+ neutrophils (WT n = 4; Ccl28−/− n = 4) obtained from the BAL, lung, blood, and bone marrow of WT and Ccl28−/− littermates infected with Ab for 1 day, analyzed by flow cytometry. (A, C) Left panels show representative contour plots, and right panels show the percentages of neutrophils expressing the indicated receptor on their surface. Symbols represent data from individual mice, bars represent the geometric means.
Figure 4 with 1 supplement
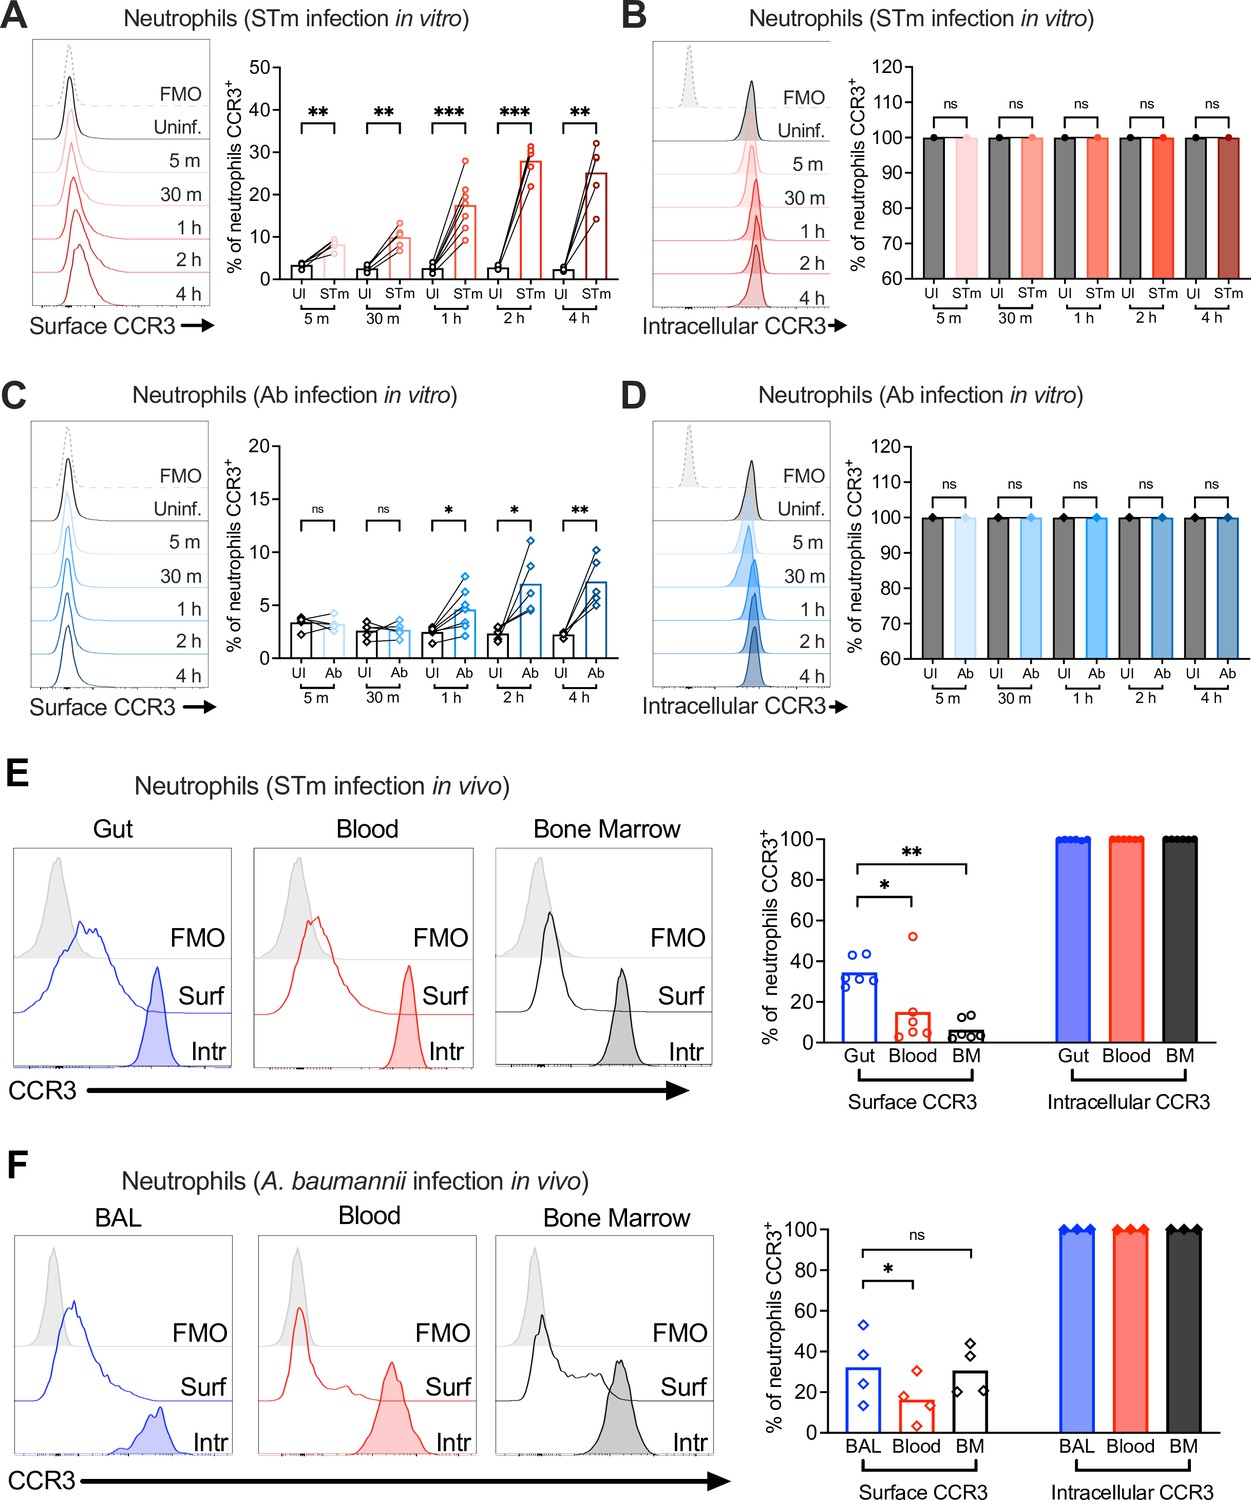
Neutrophil CCR3 is stored in intracellular compartments and rapidly mobilizes to the cell surface during infection.
Neutrophils enriched from wild-type mouse bone marrow were infected at multiplicity of infection (MOI) = 10 for 5 min to 4 hr with (A, B) opsonized Salmonella enterica serovar Typhimurium (STm) or (C, D) Acinetobacter baumannii (Ab). (A, C) Surface CCR3 or (B, D) intracellular CCR3 staining was detected by flow cytometry. Connected symbols represent data from neutrophils collected from the same mouse under different stimulation conditions. Neutrophils were obtained from (E) the gut, blood, and bone marrow 3 dpi with STm or (F) bronchoalveolar lavage (BAL), blood, and bone marrow 1 dpi with Ab. Surface (clear histograms) or intracellular (filled histograms) CCR3 expression was analyzed by flow cytometry. (A–F) Left panels show representative histograms, and right panels show the percentage of neutrophils expressing CCR3 on their surface (clear bars) or intracellularly (filled bars). Bars represent the mean. Data were analyzed by paired t test (A–D) or one-way analysis of variance (ANOVA) followed by Tukey’s multiple comparison test (E, F) on log-transformed data. Significant changes are indicated by *p ≤ 0.05, **p ≤ 0.01, ***p ≤ 0.001; ns, not significant.
Figure 4—figure supplement 1
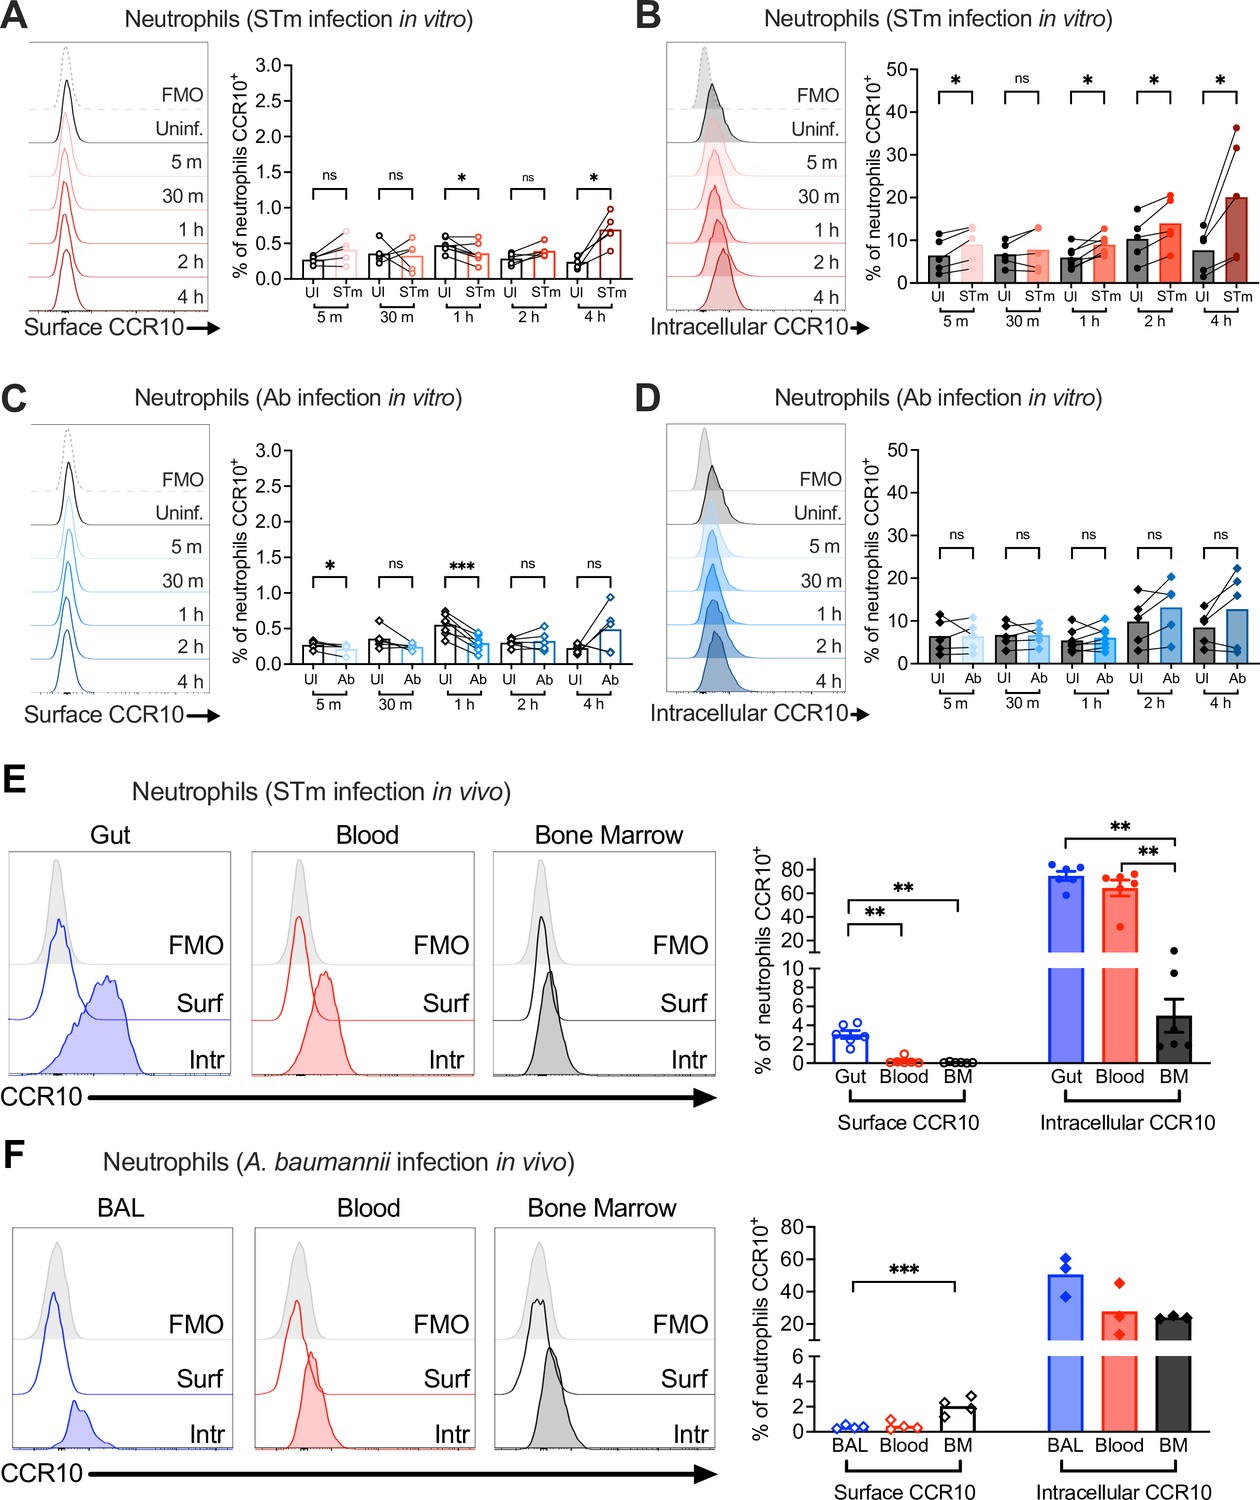
Expression kinetics of neutrophil CCR10.
Neutrophils enriched from wild-type mouse bone marrow were infected at multiplicity of infection (MOI) = for 5 min to 4 hr with (A, B) opsonized Salmonella enterica serovar Typhimurium (STm) or (C, D) Acinetobacter baumannii (Ab). (A, C) Surface CCR10 or (B, D) intracellular CCR10 staining was detected by flow cytometry. Neutrophils were obtained from (E) the gut, blood, and bone marrow 3 dpi with STm or (F) bronchoalveolar lavage (BAL), blood, and bone marrow 1 dpi with Ab. Surface (clear histograms) and intracellular (filled histograms) CCR10 expression was analyzed by flow cytometry. (A–F) Left panels show representative histograms, and right panels show the percentage of neutrophils expressing CCR10 on their surface (clear bars) or intracellularly (filled bars). Bars represent the mean. Data were analyzed by paired t test (A–D) or one-way analysis of variance (ANOVA) followed by Tukey’s multiple comparison test (E, F) on log-transformed data. Significant changes are indicated by *p ≤ 0.05, **p ≤ 0.01, ***p ≤ 0.001; ns, not significant.
Figure 5 with 1 supplement
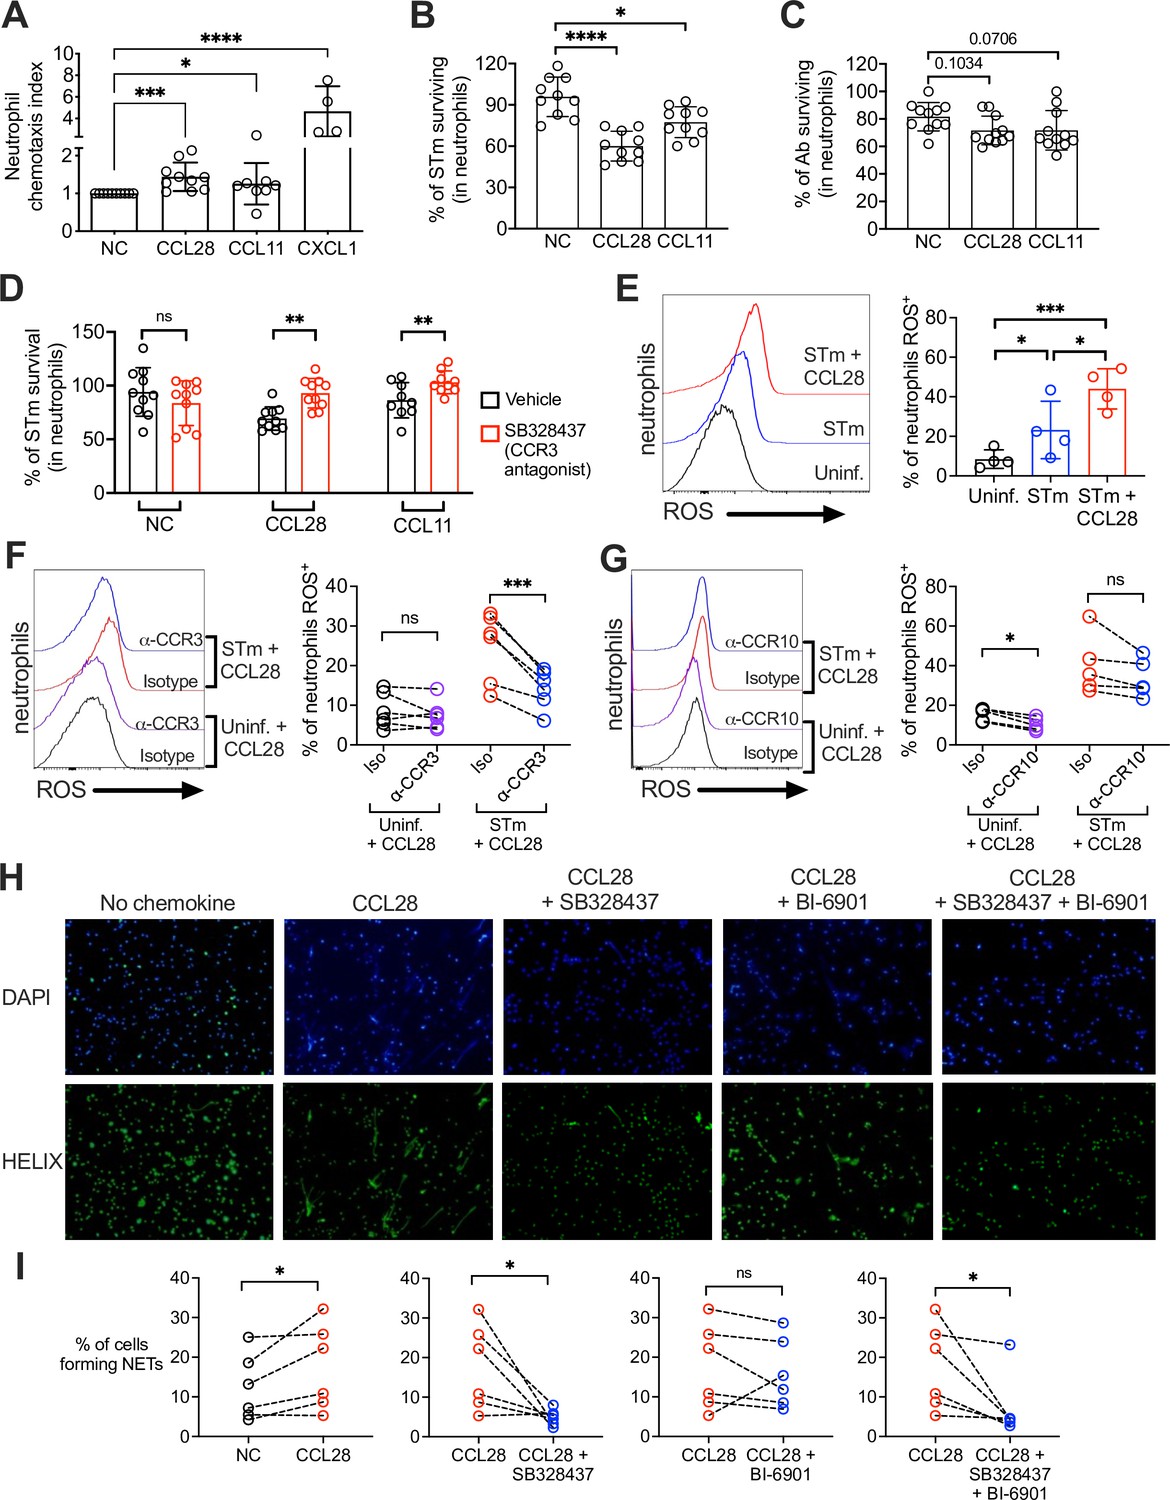
CCL28 enhances neutrophil antimicrobial activity.
(A) Murine bone marrow neutrophils were stimulated with IFNγ + TNFɑ + GM-CSF for 4 hr before adding 1 × 10⁶ cells to the upper compartment of a transwell chamber for chemotaxis assays. Each of the chemokines (CCL28, CCL11, or CXCL1), or no chemokine (NC), was placed in separate lower compartments. The transwell plate was incubated for 2 hr at 37°C. Cells that migrated to the lower compartment were enumerated by flow cytometry. Neutrophil chemotaxis index was calculated by taking the number of cells that migrated in response to a chemokine and dividing it by the number of cells that migrated in the absence of a chemokine. Data are from four independent experiments. (B, C) Infection of bone marrow neutrophils. (B) Opsonized STm (1 × 10⁷ CFU) or (C) opsonized Ab (1 × 10⁷ CFU) were cultured alone, or added to bone marrow neutrophils (1 × 10⁶ cells) stimulated with CCL28, CCL11, or no chemokine, for 2.5 hr (STm) or 4.5 hr (Ab) at 37°C. Neutrophils were lysed with 1% Triton-X and surviving bacteria were enumerated by plating serial dilutions. Percentage of bacterial survival was calculated for each condition by taking the CFU from bacteria incubated with neutrophils and dividing it by the CFU from bacteria incubated without neutrophils, multiplied by 100. Data shown for each infection comprise three independent experiments. Bars represent the mean ± standard deviation (SD). (D) The effect of the CCR3 antagonist SB328437 on neutrophil-mediated STm killing was evaluated by performing the experiment as described in panel (B), with or without the antagonist. Data shown comprise three independent experiments. (E–G) Reactive oxygen species (ROS) production (2′,7′-dichlorodihydrofluorescein diacetate [H2DCFDA] conversion to fluorescent DCF) detected by flow cytometry in bone marrow neutrophils infected with STm as described in panel (B). In (F, G), cells were stimulated with CCL28 in the presence of an anti-CCR3 antibody, an anti-CCR10 antibody, or isotype controls. Left panels show representative histograms, and right panels show the percentage of ROS+ neutrophils in the indicated treatment groups. (H, I) Neutrophil extracellular trap (NET) formation detected by fluorescence microscopy using Helix dye in human neutrophils activated with platelets. Cells were unstimulated (no chemokine, NC), stimulated with CCL28 alone, or with CCL28 and the CCR3 agonist SB328737 and/or the CCR10 agonist BI-6901, as indicated. (H) Representative images of fluorescence microscopy with DAPI (blue) and Helix (green). (I) Quantification of NETs represented as percentage of cells forming NETs based on observed morphology. Connected circles represent NET abundance in cell populations from the same donor following different indicated treatments. (A–E) Bars represent the mean ± SD. (A–C) Data were analyzed by non-parametric analysis of variance (ANOVA) (Kruskal–Wallis’s test), assuming non-equal SD given the differences in the variance among the groups, followed by Dunn’s multiple comparisons test. (D, I) Data were analyzed by ratio paired t test. (E–G) Log-transformed data were analyzed by one-way ANOVA for paired samples. Greenhouse–Geisser correction was applied in F and G given the differences in variance among the groups. Tukey’s multiple comparison test was performed to compare all conditions to each other. (I) Ratio paired t tests were used to compare NET levels in samples from the same donor. Significant changes are indicated by *p ≤ 0.05, **p ≤ 0.01, ***p ≤ 0.001, ****p ≤ 0.0001; ns, not significant.
Figure 5—figure supplement 1
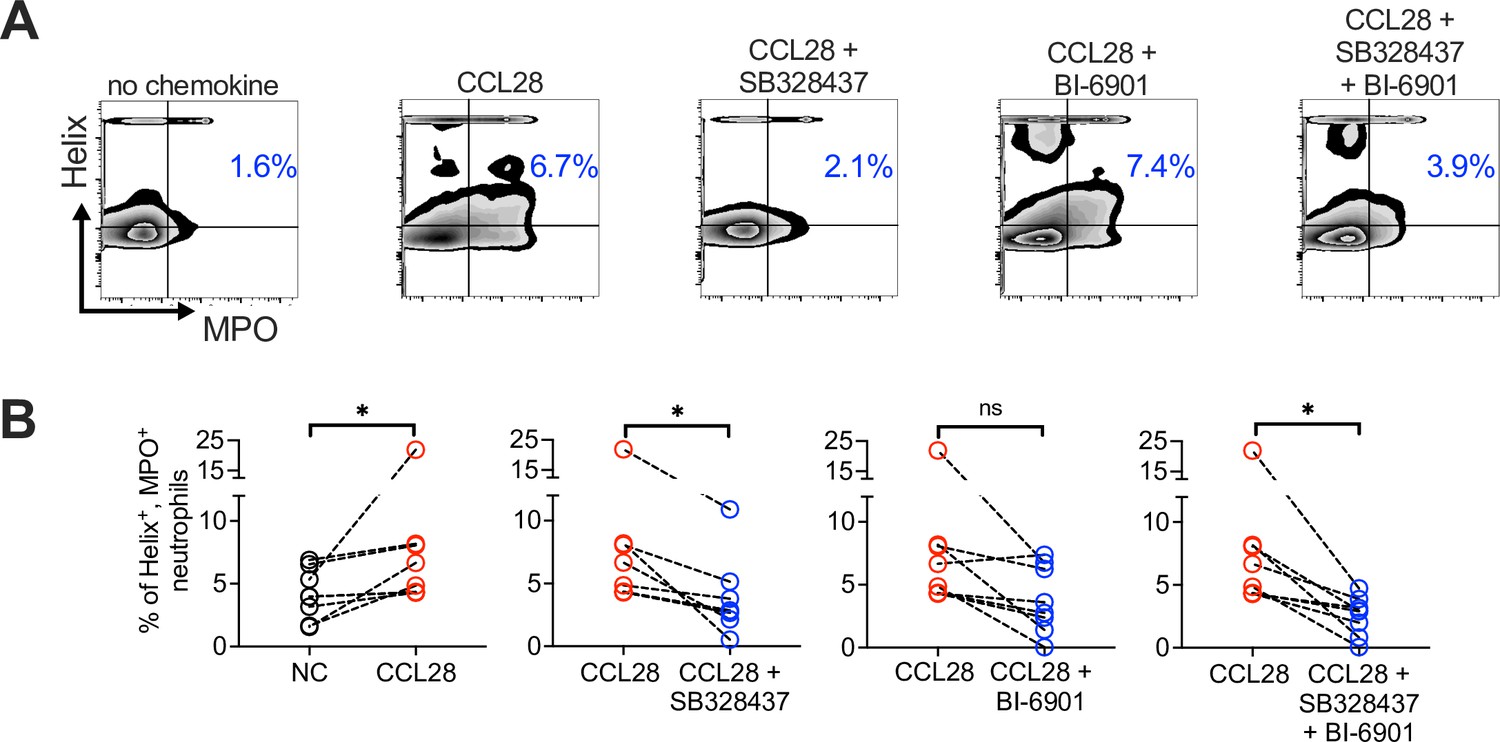
Neutrophil extracellular trap (NET) formation (Helix+ MPO+ neutrophils) detected by flow cytometry in human neutrophils activated with platelets.
As indicated, cells were unstimulated (NC), stimulated with CCL28 alone, or with CCL28 and the CCR3 antagonist SB328437 and/or the CCR10 antagonist BI-6901 (as in Figure 5H, I). (A) Representative contour plots, and (B) percentage of Helix+ MPO+ neutrophils in the indicated treatment groups. Connected circles represent NET abundance in cell populations from the same donor following different indicated treatments. Ratio paired t tests were used to compare NET levels in samples from the same donor. Significant changes are indicated by *p ≤ 0.05; ns, not significant.
Author response image 1

Ccr3 and Ccr10 expression is induced in neutrophils by STm in vivo.
Enriched bone marrow neutrophils (1x10⁶ cells/well) were infected in vitro with NMS-opsonized STm (MOI=10) or mock-infected with vehicle (DPBS+10%NMS) for 1 hr. Cells were then resuspended in Tri-Reagent, total RNA was extracted, and reverse-transcribed into cDNA. qRT-PCR was performed for the expression of Ccr3 and Ccr10, normalized to the expression of Actb. Change in expression in STm-infected cells was normalized to relative expression in the uninfected control cells. Symbols represent data from bone marrow cells extracted from individual mice, lines represent the mean.
Author response image 2
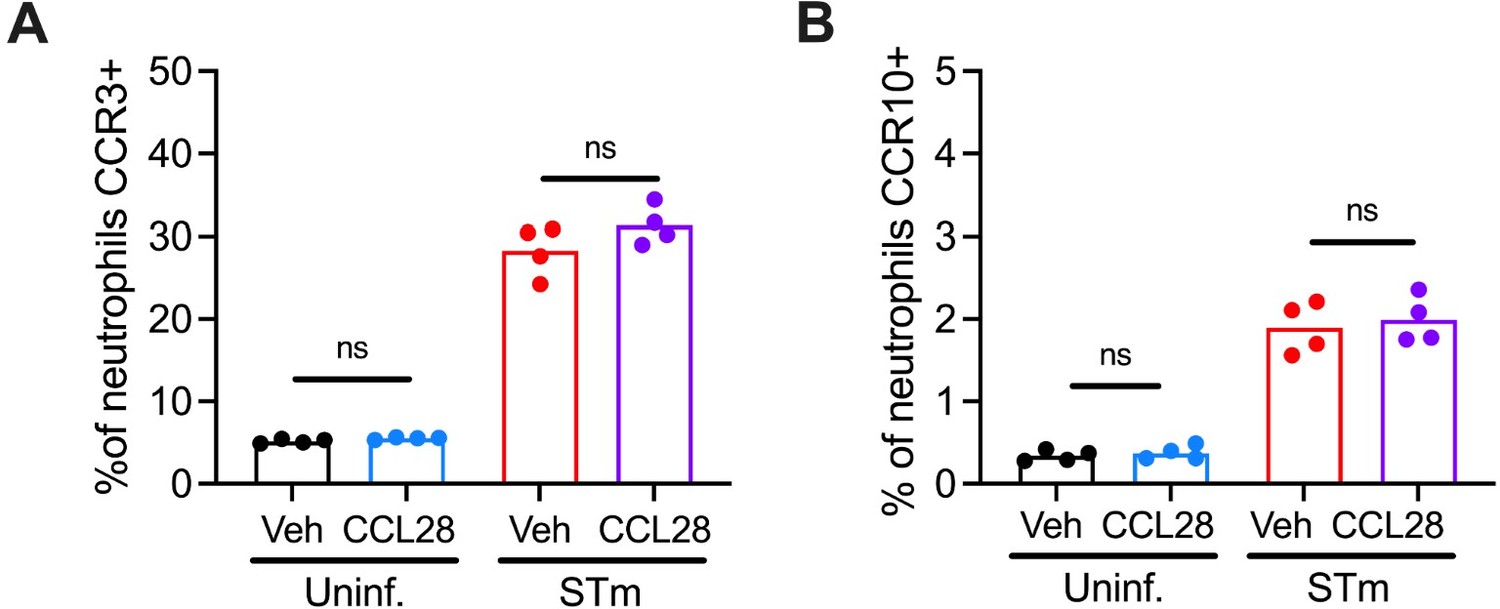
CCL28 exposure does not alter surface expression of CCR3 or CCR10 by neutrophils.
Enriched bone marrow neutrophils (1x10⁶ cells/well) were infected in vitro with NMSopsonized STm (MOI=10) or mock-infected with vehicle (DPBS+10%NMS), with or without coincubation with recombinant mouse CCL28 (50 nM) for 1 hr. Cells were then stained and profiled by flow cytometry for CCR3 and CCR10 expression by live neutrophils. Connected symbols represent data from bone marrow cells extracted from the same mouse +/- CCL28 exposure, bars represent the mean.
Tables
Key resources table
| Reagent type (species) or resource | Designation | Source or reference | Identifiers | Additional information |
|---|---|---|---|---|
| Strain, strain background (Salmonella enterica) | S. enterica serovar Typhimurium strain IR715 | Lab stock; PMID:7868611 | Nalidixic acid-resistant derivative of strain ATCC 14028s | |
| Strain, strain background (Salmonella enterica) | S. Typhimurium IR715 ΔphoQ | Lab stock; from Michael McClelland PMID:19578432 | PhoQ coding sequence disrupted by a kanamycin cassette | |
| Strain, strain background (Escherichia coli) | E. coli K12 strain MG1655 | Lab Stock | ATCC Cat#700926 | |
| Strain, strain background (Acinetobacter baumannii) | A. baumannii strain AB5075 | Walter Reed Medical Center; PMID:24865555 | ||
| Genetic reagent (Mus musculus) | C57BL/6 Ccl28::Neor | Deltagen; PMID:30855201 | Obtained from Albert Zlotnik (UC Irvine); Allelic exchange into Ccl28 | |
| Genetic reagent (Mus musculus) | C57BL/6 Ccl28−/− (C57BL/6JCya-Ccl28em1/Cya) | Cyagen Biosciences | Product Number: S-KO-17095; RRID:MGI:1861731 | Generated by CRISPR/Cas9-mediated deletion of exons 1–3 |
| Biological sample (Homo sapiens) | Primary human blood neutrophils | Human volunteers, UNAM | Freshly isolated from human volunteers | |
| Biological sample (Mus musculus) | Primary bone marrow cells | C57BL/6 Ccl28+/+ mice, UC San Diego | Freshly isolated from wild-type mice of the Ccl28 colony | |
| Antibody | Anti-mouse CD16/CD32 (Rat monoclonal; unconjugated Fc Block) | BioLegend | Clone: 93; Cat#101302; RRID:AB_312801 | FC (1:50) |
| Antibody | Anti-mouse CD45 (Rat monoclonal; Pacific Blue) | BioLegend | Clone: 30-F11; Cat#103126; RRID:AB_493535 | Sony SA3800 FC (1:800); FACSCantoII FC (1:400) |
| Antibody | Anti-mouse/human CD11b (Rat monoclonal; Spark Blue 550) | BioLegend | Clone: M1/70; Cat#101290; RRID:AB_2922452 | FC (1:400) |
| Antibody | Anti-mouse Ly6G (Rat monoclonal; Brilliant Violet 421) | BioLegend | Clone: 1A8; Cat#127628; RRID:AB_2562567 | FC (1:1600) |
| Antibody | Anti-mouse CD170 (SiglecF) (Rat monoclonal; PE/Dazzle 594) | BioLegend | Clone: S17007L; Cat#155530; RRID:AB_2890716 | FC (1:400) |
| Antibody | Anti-mouse CCR3 (Rat monoclonal; PE) | R&D Biosystems | Clone: 83103; Cat#FAB729P; RRID:AB_2074151 | FC (1:100) |
| Antibody | Anti-mouse CCR10 (Rat monoclonal; APC) | R&D Biosystems | Clone: 248918; Cat#FAB2815; RRID:AB_1151964 | FC (1:100) |
| Antibody | Anti-mouse CD11c (Armenian Hamster monoclonal; Brilliant Violet 421) | BioLegend | Clone: N418; Cat#117343; RRID:AB_2563099 | FC (1:400) |
| Antibody | Anti-mouse Ly6G (Rat monoclonal; FITC) | BioLegend | Clone: 1A8; Cat#127606; RRID:AB_1236494 | FC (1:400) |
| Antibody | Anti-mouse CD170 (SiglecF) (Rat monoclonal; FITC) | BioLegend | Clone: S17007L; Cat#155503; RRID:AB_2750232 | FC (1:400) |
| Antibody | Anti-mouse F4/80 (Rat monoclonal; PE/Dazzle 594) | BioLegend | Clone: BM8; Cat#123146; RRID:AB_2564133 | FC (1:400) |
| Antibody | Anti-mouse CD8a (Rat monoclonal; Brilliant Violet 421) | BioLegend | Clone: 53-6.7; Cat#100737; RRID:AB_10897101 | FC (1:1600) |
| Antibody | Anti-mouse CD3 (Rat monoclonal; FITC) | BioLegend | Clone: 17A2; Cat#100204; RRID:AB_312661 | FC (1:400) |
| Antibody | Anti-mouse CD4 (Rat monoclonal; PerCP/Cyanine5.5) | BioLegend | Clone: RM4-5; Cat#100539; RRID:AB_893332 | FC (1:800) |
| Antibody | Anti-mouse CD8a (Rat monoclonal; PE) | BioLegend | Clone: 53-6.7; Cat#100708; RRID:AB_312747 | FC (1:1600) |
| Antibody | Anti-mouse CD19 (Rat monoclonal; Alexa Fluor 700) | BioLegend | Clone: 6D5; Cat#115528; RRID:AB_493735 | FC (1:400) |
| Antibody | Anti-mouse/human CD11b (Rat monoclonal; APC) | BioLegend | Clone: M1/70; Cat#101212; RRID:AB_312795 | FC (1:800) |
| Antibody | Anti-mouse/human CD11b (Rat monoclonal; Brilliant Violet 510) | BioLegend | Clone: M1/70; Cat#101245; RRID:AB_2561390 | FC (1:400) |
| Antibody | Anti-mouse F4/80 (Rat monoclonal; FITC) | BioLegend | Clone: BM8; Cat#123108; RRID:AB_893502 | FC (1:200) |
| Antibody | Anti-mouse Ly6G (Rat monoclonal; PerCP) | BioLegend | Clone: 1A8; Cat#127654; RRID:AB_2616999 | FC (1:400) |
| Antibody | Anti-mouse CD170 (SiglecF) (Rat monoclonal; APC) | BioLegend | Clone: S17007L; Cat#155508; RRID:AB_2750237 | FC (1:400) |
| Antibody | Anti-mouse CD11c (Armenian Hamster monoclonal; PE/Cyanine7) | BioLegend | Clone: N418; Cat#117317; RRID:AB_493569 | FC (1:400) |
| Antibody | Anti-mouse CD19 (Rat monoclonal; PE/Cyanine7) | BioLegend | Clone: 6D5; Cat#115520; RRID:AB_313655 | FC (1:400) |
| Antibody | Anti-mouse CCR3 (Rat monoclonal; unconjugated) | R&D Systems | Clone: 83103; Cat#MAB1551; RRID:AB_2074150 | In vitro signaling blockade (5 µg/100 µl) |
| Antibody | Anti-mouse CCR10 (Rat monoclonal; unconjugated) | R&D Systems | Clone: 248918; Cat#MAB2815; RRID:AB_2074258 | In vitro signaling blockade (5 µg/100 µl) |
| Antibody | Rat IgG2A Isotype Control Antibody (Rat monoclonal; unconjugated) | R&D Systems | Clone: 54447; Cat#MAB006; RRID:AB_357349 | In vitro signaling blockade (5 µg/100 µl) |
| Antibody | Anti-mouse Ly6G (Rat monoclonal; unconjugated) | BioLegend | Clone: 1A8; Cat#127601; RRID:AB_1089179 | Lung neutrophil IF (1:100) |
| Antibody | Goat Anti-rat IgG (H+L) Cross-Adsorbed Secondary Antibody (Goat polyclonal; Alexa Fluor 555) | Invitrogen | Cat#A-21434; RRID:AB_2535855 | Lung neutrophil IF: (1:400) |
| Antibody | Human TruStain FcX (Human monoclonal mix; unconjugated Fc Receptor blocking solution) | BioLegend | Cat#422302; RRID:AB_2818986 | FC (1:100) |
| Antibody | Anti-human CD45 (Mouse monoclonal; PerCP/Cyanine5.5) | BioLegend | Clone: HI30; Cat#304028; RRID:AB_893338 | FC (1:300) |
| Antibody | Anti-mouse/human CD11b (Rat monoclonal; Pacific Blue) | BioLegend | Clone: M1/70; Cat#101224; RRID:AB_755986 | FC (1:200) |
| Antibody | Anti-human CD62L (Mouse monoclonal; FITC) | BioLegend | Clone: DREG-56; Cat#304838; RRID:AB_2564162 | FC (1:300) |
| Antibody | Anti-human CCR3 (Rat monoclonal; PE) | R&D Systems | Clone: 61828; Cat#FAB155P; RRID:AB_2074157 | FC (1:100) |
| Antibody | Anti-human CCR10 (Rat monoclonal; APC) | R&D Systems | Clone: 314305; Cat#FAB3478A; RRID:AB_573043 | FC (1:100) |
| Antibody | Anti-human myeloperoxidase (Mouse monoclonal; Biotin-conjugated) | Novus Biologicals | Clone MPO421-8B2; Cat#NBP2-41406B | FC (1:50) |
| Sequence-based reagent | Mouse Actb qPCR primers | IDT | Forward: GGCTGTATTCCCCTCCATCG; Reverse: CCAGTTGGTAACAATGCCATGT | |
| Sequence-based reagent | Mouse Cxcl1 qPCR primers | IDT | Forward: TGCACCCAAACCGAAGTCAT; Reverse: TTGTCAGAAGCCAGCGTTCAC | |
| Sequence-based reagent | Mouse Tnf qPCR primers | IDT | Forward: CATCTTCTCAAAATTCGAGTGACAA; Reverse: TGGGAGTAGACAAGGTACAACCC | |
| Sequence-based reagent | Mouse Ifng qPCR primers | IDT | Forward: TCAAGTGGCATAGATGTGGAAGAA; Reverse: TGGCTCTGCAGGATTTTCATG | |
| Sequence-based reagent | Mouse Csf3 qPCR primers | IDT | Forward: TGCTTAAGTCCCTGGAGCAA; Reverse: AGCTTGTAGGTGGCACACAA | |
| Sequence-based reagent | Mouse Il1b qPCR primers | IDT | Forward: CTCTCCAGCCAAGCTTCCTTGTGC; Reverse: GCTCTCATCAGGACAGCCCAGGT | |
| Sequence-based reagent | Mouse Il17a qPCR primers | IDT | Forward: GCTCCAGAAGGCCCTCAGA; Reverse: AGCTTTCCCTCCGCATTGA | |
| Peptide, recombinant protein | Recombinant Mouse CCL28 (MEC) | BioLegend | Cat#584706 | In vitro killing: various concentrations (indicated in text) |
| Peptide, recombinant protein | Recombinant Mouse CCL28 Protein | R&D Systems | Cat#533-VI | Chemotaxis: 50 nM; neutrophil stimulation: 50 nM |
| Peptide, recombinant protein | Recombinant Mouse CCL11/Eotaxin Protein | R&D Systems | Cat#420-ME | Chemotaxis: 50 nM; neutrophil stimulation: 25 nM |
| Peptide, recombinant protein | Recombinant Murine KC (CXCL1) | Peprotech | Cat#250–11 | Chemotaxis: 50 nM |
| Peptide, recombinant protein | Recombinant human CCL28 | BioLegend | Cat#584602 | Neutrophil stimulation: 50 nM |
| Peptide, recombinant protein | Recombinant Mouse TNF-α | BioLegend | Cat#575202 | Neutrophil stimulation: 100 ng/ml |
| Peptide, recombinant protein | Recombinant Mouse IFN-γ | BioLegend | Cat#575304 | Neutrophil stimulation: 500 U/ml |
| Peptide, recombinant protein | Recombinant Mouse GM-CSF | BioLegend | Cat#576302 | Neutrophil stimulation: 10 ng/ml |
| Peptide, recombinant protein | LPS-B5 Ultrapure | Invivogen | Cat#tlrl-pb5lps | Mouse neutrophil stimulation: 100 ng/ml |
| Commercial assay or kit | EasySep Mouse Neutrophil Enrichment Kit | STEMCELL Technologies | Cat#19762 | |
| Commercial assay or kit | EasySep Direct Human Neutrophil Isolation Kit | STEMCELL Technologies | Cat#19666 | |
| Commercial assay or kit | Mouse CCL28 ELISA Max Deluxe | BioLegend | Cat# 441304 | |
| Commercial assay or kit | Mouse Myeloperoxidase DuoSet ELISA Kit | R&D Systems | Cat#DY3667 | |
| Commercial assay or kit | Mouse Neutrophil Elastase/ELA2 DuoSet ELISA Kit | R&D Systems | Cat#DY4517 | |
| Commercial assay or kit | Mouse S100a9 DuoSet ELISA Kit | R&D Systems | Cat#DY2065 | |
| Commercial assay or kit | PowerUp SYBR Green Master Mix for qPCR | Applied Biosystems (Thermo Fisher) | Cat#A25742 | |
| Commercial assay or kit | SuperScript VILO cDNA Synthesis Kit | Thermo Fisher | Cat#11766500 | |
| Commercial assay or kit | eBioscience Fixable Viability Dye eFluor 780 | Thermo Fisher | Cat#65-0865-14 | FC (1:1000) |
| Chemical compound, drug | fMLP (N-Formyl-Met-Leu-Phe) | Sigma-Aldrich | Cat#F3506 | Neutrophil stimulation: 1 µM |
| Chemical compound, drug | PMA (Phorbol 12-myristate 13-acetate) | Sigma-Aldrich | Cat#79346 | Neutrophil stimulation: 100 nM |
| Chemical compound, drug | Cytochalasin D | Sigma-Aldrich | Cat#C8273 | Incubated cells at 10 µM |
| Chemical compound, drug | SB328437 [N-(1-naphthalenylcarbonyl)-4-nitro-L-phenylalanine methyl ester] | Tocris Bioscience | Cat#3650 | CCR3 antagonist (10 µM) |
| Chemical compound, drug | BI-6901 (N-[(1R)-3-(2-Cyano-1H-pyrrol-1-yl)-1-[(4-methyl-1-piperidinyl)carbonyl]propyl]-1H-indole-4-sulfonamide) | Gift from Boehringer-Ingelheim Pharma GmbH & Co KG | CCR10 antagonist (20 µM) | |
| Chemical compound, drug | Xylazine | VetOne | Cat#RX-0065 | Used for temporary anesthesia: 10 mg/kg, i.p. |
| Chemical compound, drug | Ketamine | Zoetis | Cat#000680 | Used for temporary anesthesia: 100 mg/kg, i.p |
| Chemical compound, drug | Nalidixic acid sodium salt | Fisher Scientific | Cat#AAJ6355014 | 50 µg/ml for selection |
| Chemical compound, drug | Streptomycin sulfate | Fisher Scientific | Cat#5711 | For oral gavage (20 mg/mouse) |
| Software, algorithm | GraphPad Prism 10.0 | GraphPad Software | RRID:SCR_002798 | |
| Software, algorithm | FlowJo 10.8.1 | BD Biosciences | RRID:SCR_008520 | |
| Software, algorithm | QuantStudio 5 Reat-Time PCR System | Thermo Fisher Scientific | RRID:SCR_020240 | |
| Software, algorithm | QuPath Analysis Software | QuPath (PMID:29203879) | RRID:SCR_018257 | |
| Other | DMSO | Millipore Sigma | Cat#EM-MX1458-6 | Used at 0.1% for vehicle for cytochalasin D during in vitro infection assays described in the Materials and methods |
| Other | 2′,7′-Dichlorodihydrofluorescein diacetate | Invitrogen | Cat#D399 | Used at 25 µM for incubation of neutrophils for detection of ROS production by neutrophils, as described in the Materials and methods |
| Other | TRI Reagent | Sigma-Aldrich | Cat#T9424 | Used for RNA isolation from tissues, described in Materials and methods section ‘RNA extraction and qPCR’ |
| Other | SlowFade Gold Antifade Mountant | Invitrogen | Cat#36936 | Used for staining and mounting immunoflourescent lung sections, described in Materials and methods section ‘Immunofluorescence’ |
| Other | APC/Cy7 Streptavidin | BioLegend | Cat#405208 | For tagging biotin-conjugated anti-human myeloperoxidase; FC (1:1000) |
| Other | OneComp eBeads | Thermo Fisher | Cat#01-1111-42 | Added to cells at 5 × 10⁵ beads per 1 × 10⁶ cells, as described in the Materials and methods section ‘In vitro neutrophil stimulation’ |
| Other | Collagenase, Type VIII | Sigma-Aldrich | Cat#C2139 | For tissue digestion, as described in the Materials and methods: 1 mg/ml |
| Other | Liberase | Sigma-Aldrich | Cat#5401020001 | For tissue digestion, as described in the Materials and methods: 20 µg/ml |
| Other | DNase I | Sigma-Aldrich | Cat#DN25 | For tissue digestion, as described in the Materials and methods: 0.25 mg/ml |
| Other | Helix NP Green | BioLegend | Cat#425303 | For staining neutrophil DNA, as described in the Materials and methods. FC: 10 nM; immuno-fluorescence: 5 µM |
| Other | LB Broth, Miller | Fisher Scientific | Cat#DF0446-17-3 | Used for routine culturing of S. Typhimurium, described in Materials and methods section ‘Salmonella infection models’ |
| Other | LB agar, Miller | Fisher Scientific | Cat#DF0445-17-4 | Used for growth and enumeration of S. Typhimurium and Acinetobacter CFUs, as described throughout the Materials and methods section |
| Other | Mueller-Hinton Broth | Fisher Scientific | Cat#DF0757-17-6 | Used for routine culturing of A. baumannii, described in Materials and methods section ‘Acinetobacter infection model’ |
| Other | DPBS | Gibco | Cat#14190250 | Used for washing or resuspension of various cells and bacteria, as described throughout the Materials and methods section |
| Other | cOmplete, Mini, EDTA-free Protease Inhibitor Cocktail | Sigma-Aldrich | Cat#4693159001 | Used for fecal protease inhibition as described in the Materials and methods |
| Other | Fetal bovine serum (FBS), heat-inactivated | Gibco | Cat#A3840001 | Used for general cell preservation and assays as described in the Materials and methods |
| Other | Antibiotic–antimycotic | Gibco | Cat#15-240-062 | Used for general tissue cell preservation as described in the Materials and methods |
| Other | RPMI 1640 Medium, with L-glutamine | Gibco | Cat#11875-119 | Used for general tissue cell preservation and assays as described in the Materials and methods |
| Other | RPMI 1640 Medium, no glutamine, no phenol red | Gibco | Cat#32404014 | Used for H2DCFDA ROS assays as described in the Materials and methods |
| Other | IMDM | Gibco | Cat#12440061 | Used for gut tissue cell isolation as described in the Materials and methods |
| Other | Hank’s Balanced Salt Solution | Fisher Scientific | Cat#MT21021CV | Used for gut tissue cell isolation as described in the Materials and methods |
| Other | HEPES | Gibco | Cat#15630080 | Used for general tissue cell preservation and assays as described in the Materials and methods |
| Other | EDTA | Fisher Scientific | Cat#S311-500 | Used for collection of mouse blood, and for lung and gut tissue cells isolation as described in Materials and methods section ‘Cell extraction and analysis’ |
| Other | Bovine serum albumin (BSA) | Fisher Scientific | Cat#BP9703100 | Added to various media for the purpose of blocking non-specific interactions, as described in the Materials and methods sections ‘Cell extraction and analysis’ and ‘Chemotaxis assay’ |
Additional files
Download links
A two-part list of links to download the article, or parts of the article, in various formats.
Downloads (link to download the article as PDF)
Open citations (links to open the citations from this article in various online reference manager services)
Cite this article (links to download the citations from this article in formats compatible with various reference manager tools)
CCL28 modulates neutrophil responses during infection with mucosal pathogens
eLife 13:e78206.
https://doi.org/10.7554/eLife.78206


