Spatial modeling reveals nuclear phosphorylation and subcellular shuttling of YAP upon drug-induced liver injury
- Institute of Pathology, University Hospital Heidelberg, Germany
- Department of Modeling of Biological Processes, COS Heidelberg/BioQuant, Heidelberg University, Germany
- Institute of Biomedicine (IBIOMED), University of León, Spain
- Centro de Investigación Biomédica en Red de Enfermedades Hepáticas y Digestivas (CIBERehd), Instituto de Salud Carlos III, Spain
- Leibniz Research Centre for Working Environment and Human Factors, Department of Toxicology, Technical University Dortmund, Germany
- Department of Forensic Medicine and Toxicology, Faculty of Veterinary Medicine, South Valley University, Egypt
Figures
Figure 1 with 1 supplement
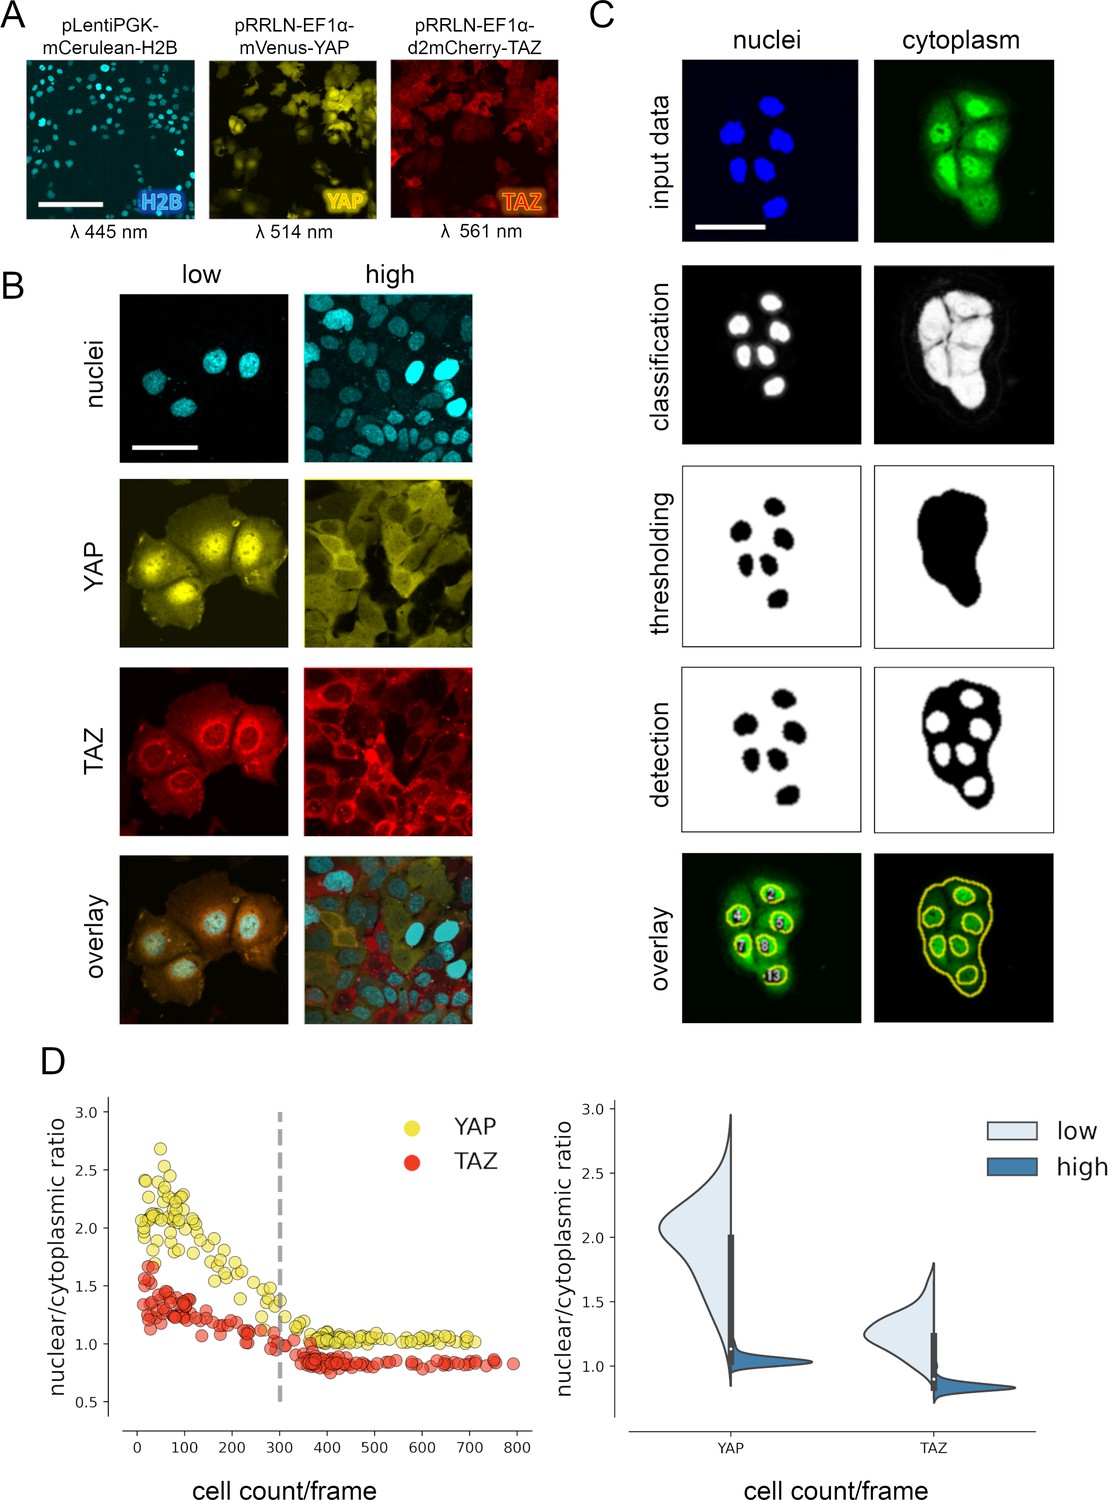
YAP and TAZ show distinct nuclear shuttling in hepatocellular cells upon increasing cell density.
(A) The hepatocyte-derived cell line Hep3B was transduced using three lentiviral vectors coding for mCerulean-tagged H2B (pLentiPGK-mCerulean-H2B), mVenus-tagged YAP (pRRLN-EF1α-mVenus-YAP), and mCherry-tagged TAZ (pRRLN-EF1α-d2mCherry-TAZ). Combined treatment with the antibiotics hygromycin, geneticin, and blasticidin selected for triple-positive cells. Cells were confocally imaged in three channels: 445 nm (CFP, mCerulean), 514 nm (YFP, mVenus), and 561 nm (RFP, mCherry). Scale bar: 250 µm. (B) Exemplary pictures illustrating the subcellular localization of H2B, YAP, and TAZ proteins under low (left) and high (right) cell density conditions. Scale bar: 50 µm. (C) Automatic image analysis workflow depicts analysis of nuclear (left) and cytoplasmic (right) fluorescence intensity in confocal images of living cells. The acquired images were prescreened for imaging artifacts (e.g., out-of-focus images were excluded) and subjected to the image analysis pipeline in Fiji. Object classification (Weka algorithm), thresholding, and object counting were performed. Object masks were overlaid with original data and the nuclear/cytoplasmic ratio (NCR) was calculated by dividing average fluorescent signal intensity of YAP/TAZ in the nucleus with the fluorescence intensity in the cytoplasm. Scale bar: 50 µm. (D) Quantification of YAP and TAZ NCR under increasing cell density conditions. One of four representative experiment is depicted. Left: the NCR of YAP (yellow, n = 310) and TAZ (red, n = 310) was plotted against cell count per visual field (0.4 mm2). A high NCR value indicates predominant nuclear localization. Dashed line shows mean cell count. Right: violin plots summarize shift in NCR between low (below mean cell count) and high (above mean cell count) cell density for YAP and TAZ.
Figure 1—figure supplement 1
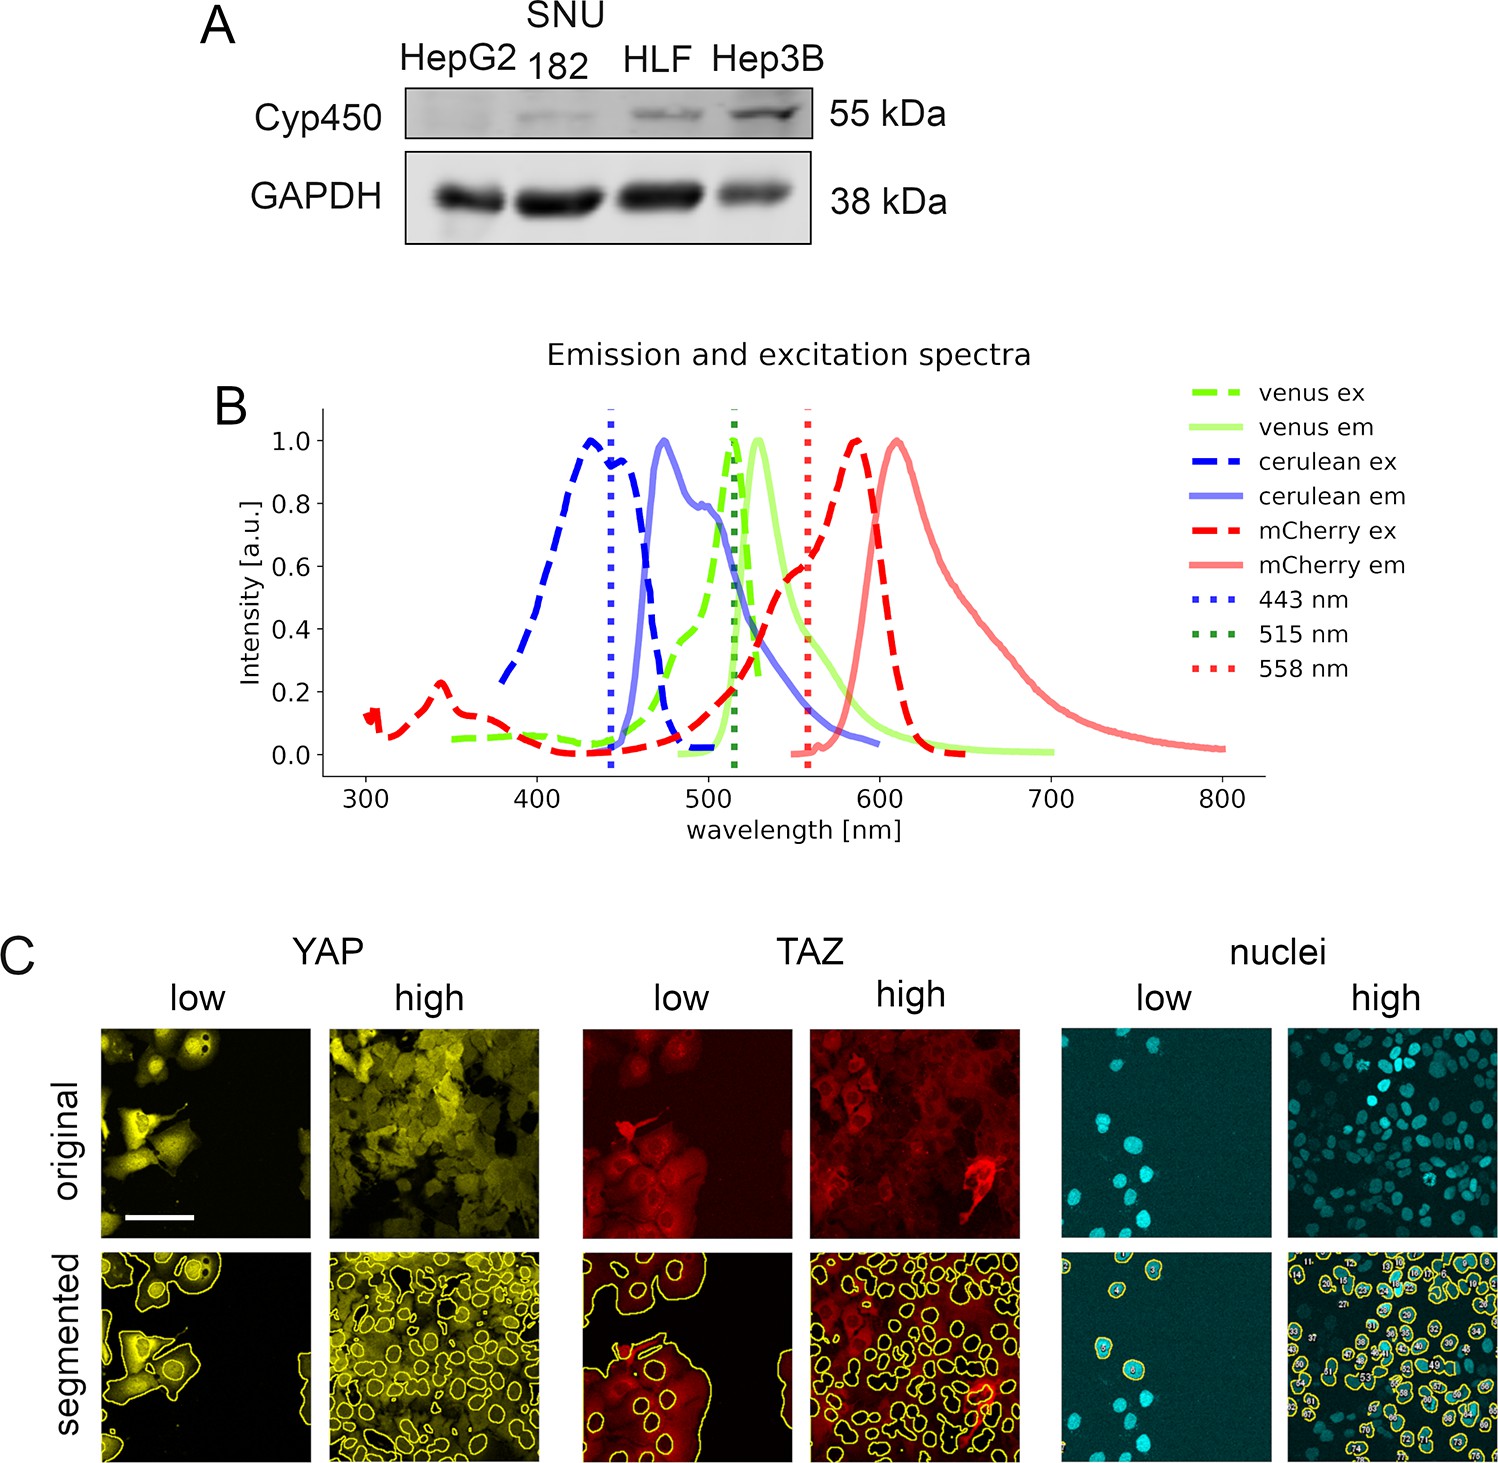
In vitro model establishment.
(A) Western immunoblotting of cell lines HepG2, SNU182, HLF, and Hep3B, which were tested for the abundance of cytochrome P450 2E1 (CYP2E1/Cyp450), a liver enzyme which metabolizes APAP. Hep3B cells show a prominent CYP2E1 expression. GAPDH serves as a loading control. (B) Emission and excitation spectra of mVenus, mCerulean, and mCherry fluorophores. Dotted line represents the wavelength of lasers, which were used for the confocal microscopy setup. (C) Exemplary segmentation results of the image analysis pipeline for nuclei, YAP and TAZ localization under low and high cell density conditions are shown. Yellow lines represent outlines of the segmented areas for the cytoplasmic positivity (either YAP-mVenus or TAZ-mCherry) or nuclear positivity (defined by H2B-mCerulean). Images are gamma corrected (γ = 0.5). Scale bar: 100 µm.
-
Figure 1—figure supplement 1—source data 1
Original western blot data.
- https://cdn.elifesciences.org/articles/78540/elife-78540-fig1-figsupp1-data1-v1.zip
Figure 2 with 2 supplements

Mathematical modeling predicts that nuclear phosphorylation controls YAP/TAZ subcellular localization.
(A) The model reaction scheme of the canonical Hippo pathway. Only unphosphorylated YAP/TAZ can enter the nucleus, whereas pYAP and pTAZ are exclusively localized to the cytosol. The phosphorylation of YAP/TAZ takes place exclusively outside nuclei. (B) Partial differential equation (PDE) model simulation of the canonical Hippo pathway compared to the experimentally measured YAP/TAZ localization. The residuals (experimental data minus model simulation) indicate low spatial accordance of the model simulation with the experimentally measured subcellular localization of YAP/TAZ. Images were normalized to the maximal value within each image. Nuclear outline is indicated in black. (C) The model reaction scheme of the alternative Hippo pathway model. Phosphorylation and dephosphorylation of YAP/TAZ take place in the nucleus. Unphosphorylated YAP/TAZ is imported in the nucleus and phosphorylated YAP/TAZ is rapidly exported to the cytoplasm. (D) PDE simulation of the alternative model compared to experimental data. Residuals for the subcellular localization (e.g., nuclear distribution) sufficiently reflect results from confocal microscopy. Nuclear outline is indicated in black. (E) Simulated impact of the nuclear phosphorylation to dephosphorylation ratio on subcellular localization of YAP in the alternative Hippo pathway model. Left: model simulation of two phosphorylation/dephosphorylation rates (0.17 and 0.75). Right: summarized residuals with respect to experimental data of YAP and TAZ as a function of phosphorylation to dephosphorylation ratio in the nucleus. (F) Western immunoblot after nuclear and cytoplasmic protein fractionation under low cell density conditions. The central Hippo pathway kinases LATS1/2 were detectable in the nuclear fraction. As expected, high pYAP levels are detectable in the cytoplasm, illustrating that the protein is transported outside the nucleus upon phosphorylation. PARP and Tubulin serve as loading controls for nuclear and cytoplasmic fractions, respectively. Equal amounts of cytoplasmic and nuclear proteins were loaded (n = 4; one representative experiment shown). (G) Proximity ligation assay (PLA) for phosphorylated LATS1/2 (pLATS1/2) and YAP (top row). Red dots indicate physical interaction between pLATS1/2 and YAP. DAPI (4′,6-diamidino-2-phenylindole)-stained nuclei are indicated in cyan. Individual pLATS and YAP antibodies serve as assay controls. Bottom row: computational segmentation of nuclei (empty circles) and dots (black spots). Scale bar: 50 µm. (H) Quantification of the PLA assay. Each dot represents an individual image. Left: quantification of interactions between YAP and pLATS1/2 in the nucleus (n = 18) compared to the negative controls (pLATS1/2 and YAP antibodies alone, n = 16 and n = 17, respectively). Right: the number of PLA dots of pLATS1/2 and YAP interaction in cytoplasm and in nuclei (n = 18). Statistical test: two-tailed paired t-test (p value = 0.01) **p ≤ 0.01.
-
Figure 2—source data 1
Raw data for Western Blot shown in Figure 2F.
- https://cdn.elifesciences.org/articles/78540/elife-78540-fig2-data1-v1.zip
Figure 2—figure supplement 1
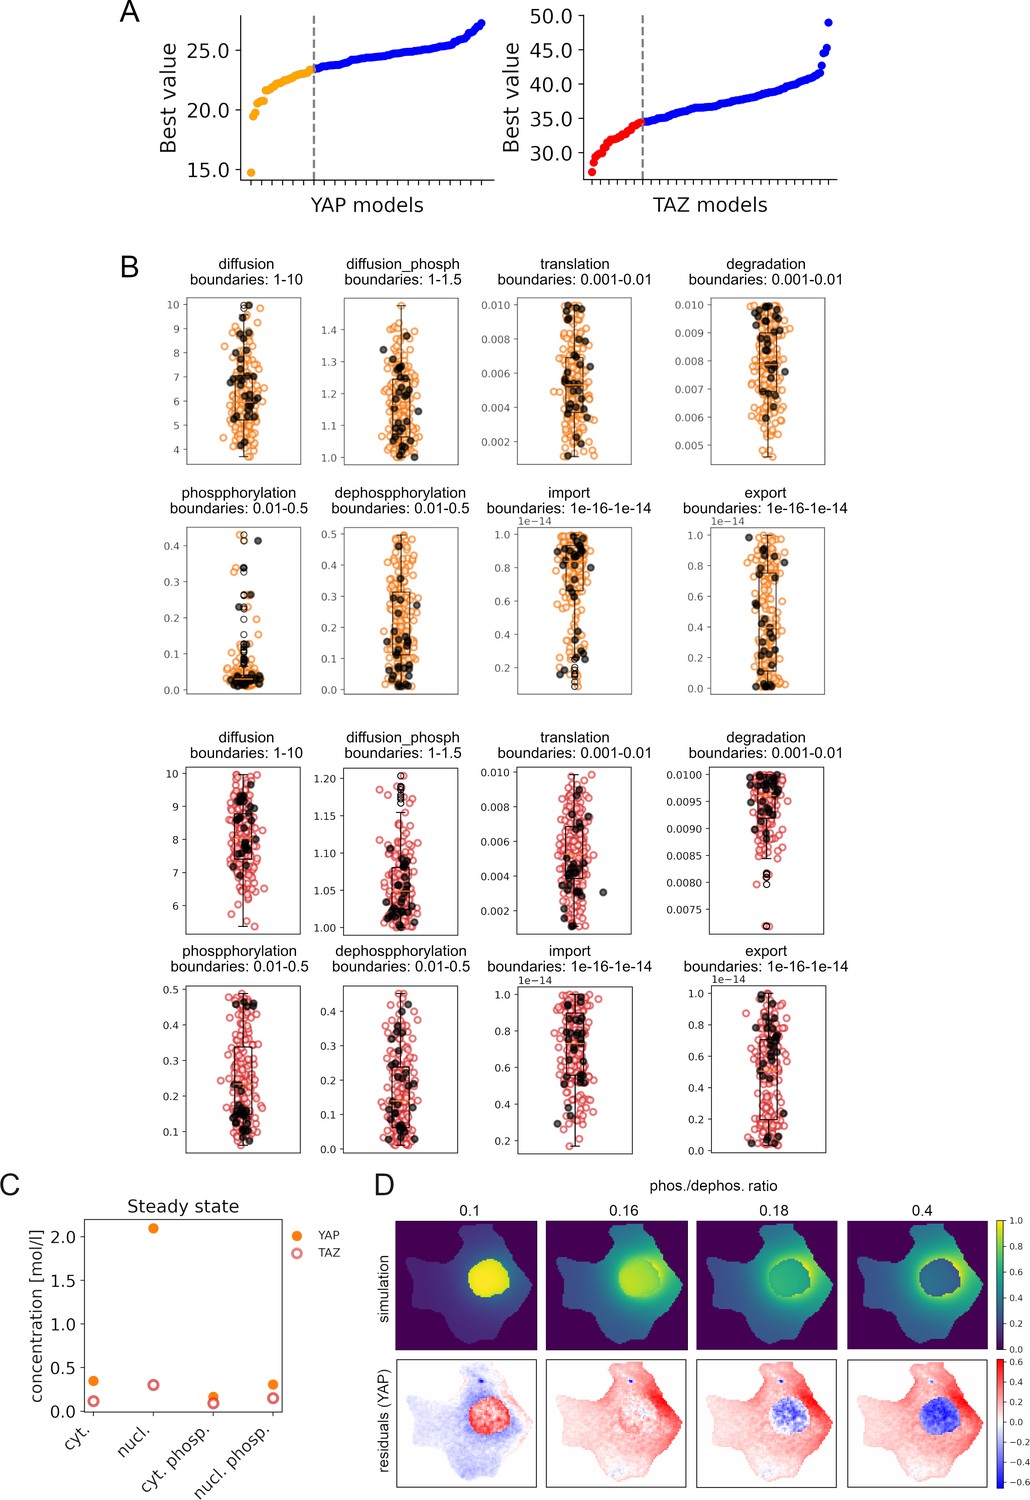
Parametrizing alternative computational steady-state models.
(A) Best value of the objective function of all fitted YAP and TAZ alternative models. Orange and red dots indicate best 30 models for YAP and TAZ, respectively. (B) Distribution of parameter values for each fitted parameter of alternative Hippo pathway models for YAP (orange) and TAZ (red) proteins. Here, 200 models were obtained by parameter estimation method with particle swarm algorithm (200 iterations, 20 particles). Obtained parameters are plotted within the min and max values of the evaluated parameter space boundaries. Black dots indicate parameter values obtained from the 30 best models for YAP and TAZ. (C) Steady-state values of YAP/TAZ and pYAP/pTAZ concentrations in nuclei and cytoplasm of an exemplary alternative model for YAP and TAZ (model simulation depicted in Figure 2D). (D) Alternative model simulations with respect to changes in phosphorylation to dephosphorylation ratio (phos./dephos. ratio). Increasing phos./dephos. ratio drives YAP protein from mainly nuclear localization to the cytoplasm, mirroring the differences between YAP and TAZ localization under low cell density conditions in a steady-state.
Figure 2—figure supplement 2
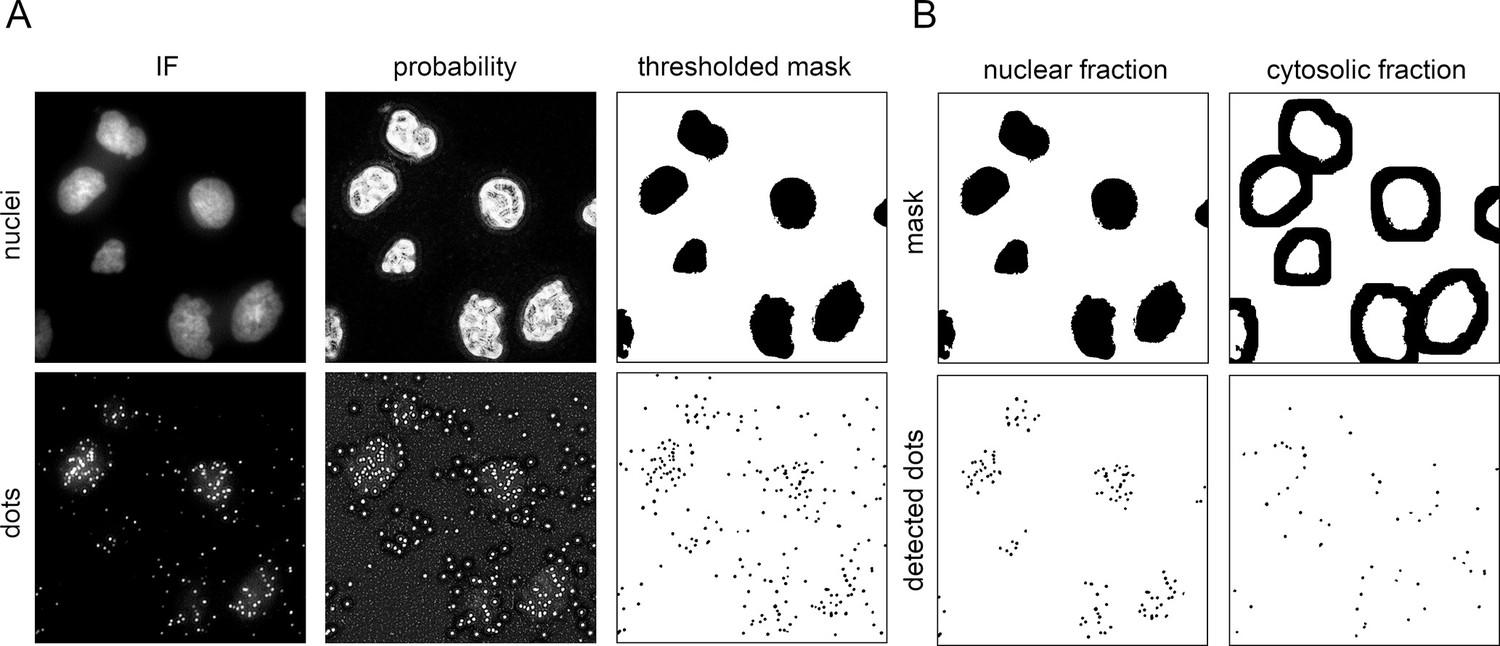
Data analysis pipeline for proximity ligation assay (PLA) quantification.
(A) First steps of the image analysis pipeline involve generation of probability maps by applying trained Weka segmentation model onto images of nuclei and PLA dots. Further, by setting a threshold to the probability maps, masked images of nuclei and dots are generated. IF: immunofluorescence. (B) The number of dots within the area of nuclear and cytoplasmic mask is counted. Cytosolic mask was obtained by expanding the nuclear area for 30 iterations using ImageJ’s dilate function. This generated a cytoplasmic area comparable to the respective nuclear area for each cell.
Figure 3 with 2 supplements
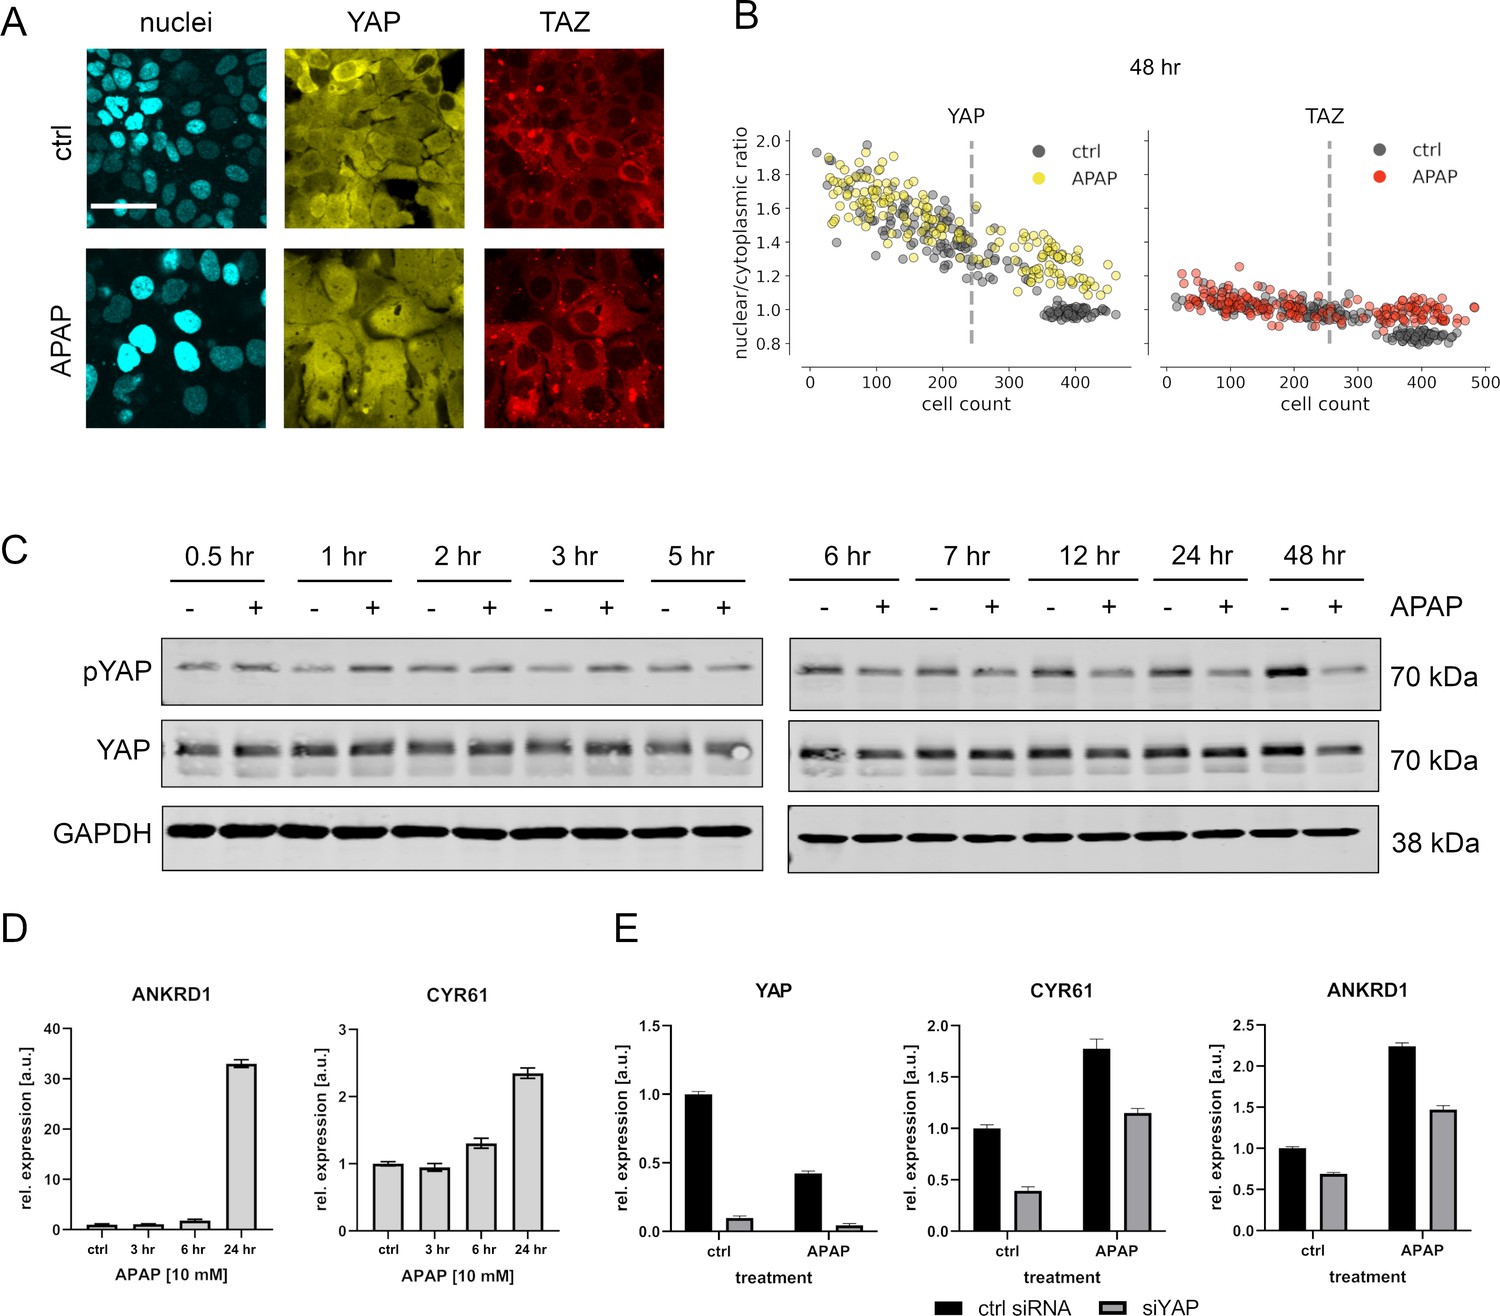
APAP regulates YAP phosphorylation, localization, and expression of its target genes.
(A) Live cell confocal imaging of H2B-mCerulean, YAP-mVenus, and TAZ-mCherry in Hep3B cells. Upper row: control treatment (phosphate-buffered saline, PBS). Lower row: APAP treatment (10 mM) induces nuclear enrichment of YAP, but not TAZ protein after APAP treatment within 48 hr (n = 4; one representative experiment shown). Scale bar: 50 µm. (B) Live cell confocal microscopy image quantification. Nuclear/cytoplasmic ratio (NCR) of YAP and TAZ with APAP (10 mM for 48 hr; yellow and red circles, n = 180 per channel) and control (PBS; gray circles, n = 180 per channel) treatment under increasing cell density conditions (represented as mean cell count per visual field). Each dot represents a single visual field. Dashed line: mean cell density. (C) Western immunoblot of YAP and pYAP after APAP treatment (10 mM) in Hep3B cells (n = 6; one representative experiment shown). GAPDH served as a loading control. (D) Relative expression of the YAP target genes ANKRD1 and CYR61 24 hr after APAP (10 mM) treatment in HLF cells (n = 2; one out of two biological replicates shown). (E) Rescue experiment: relative expression of YAP and its target genes CYR61 and ANKRD1 with and without siRNA-mediated YAP inhibition (for 24 hr) with or without APAP (10 mM) treatment for 24 hr (n = 2; one out of two biological replicates shown).
-
Figure 3—source data 1
Source data for Western Blot shown in Figure 3C.
- https://cdn.elifesciences.org/articles/78540/elife-78540-fig3-data1-v1.zip
Figure 3—figure supplement 1
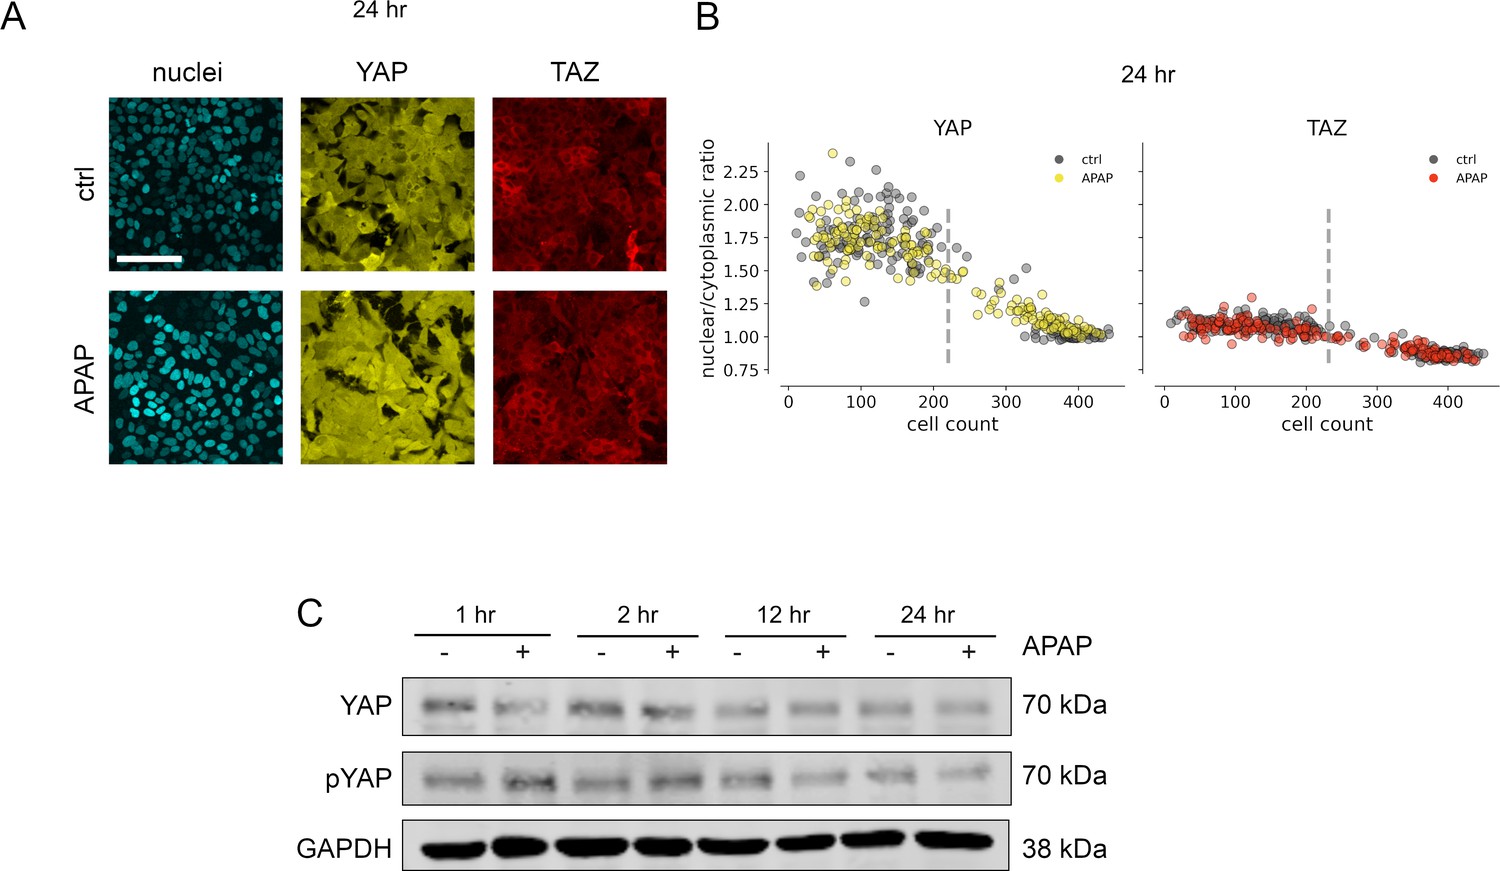
APAP treatment of hepatocellular cells induces YAP and TAZ dynamics.
(A) The subcellular localization of YAP and TAZ 24 hr after and APAP 10 (mM) treatment in comparison to untreated cells (ctrl). Scale bar: 100 µm. (B) Quantification of the YAP and TAZ nuclear/cytoplasmic ratio (NCR) dynamics in relation to cell density changes 24 hr after APAP (10 mM) treatment. (C) Time-dependent dynamics of YAP and pYAP expression after APAP (10 mM) treatment in HepG2 cells.
-
Figure 3—figure supplement 1—source data 1
Source data for Western Blot in Figure 3—figure supplement 1C.
- https://cdn.elifesciences.org/articles/78540/elife-78540-fig3-figsupp1-data1-v1.zip
Figure 3—figure supplement 2
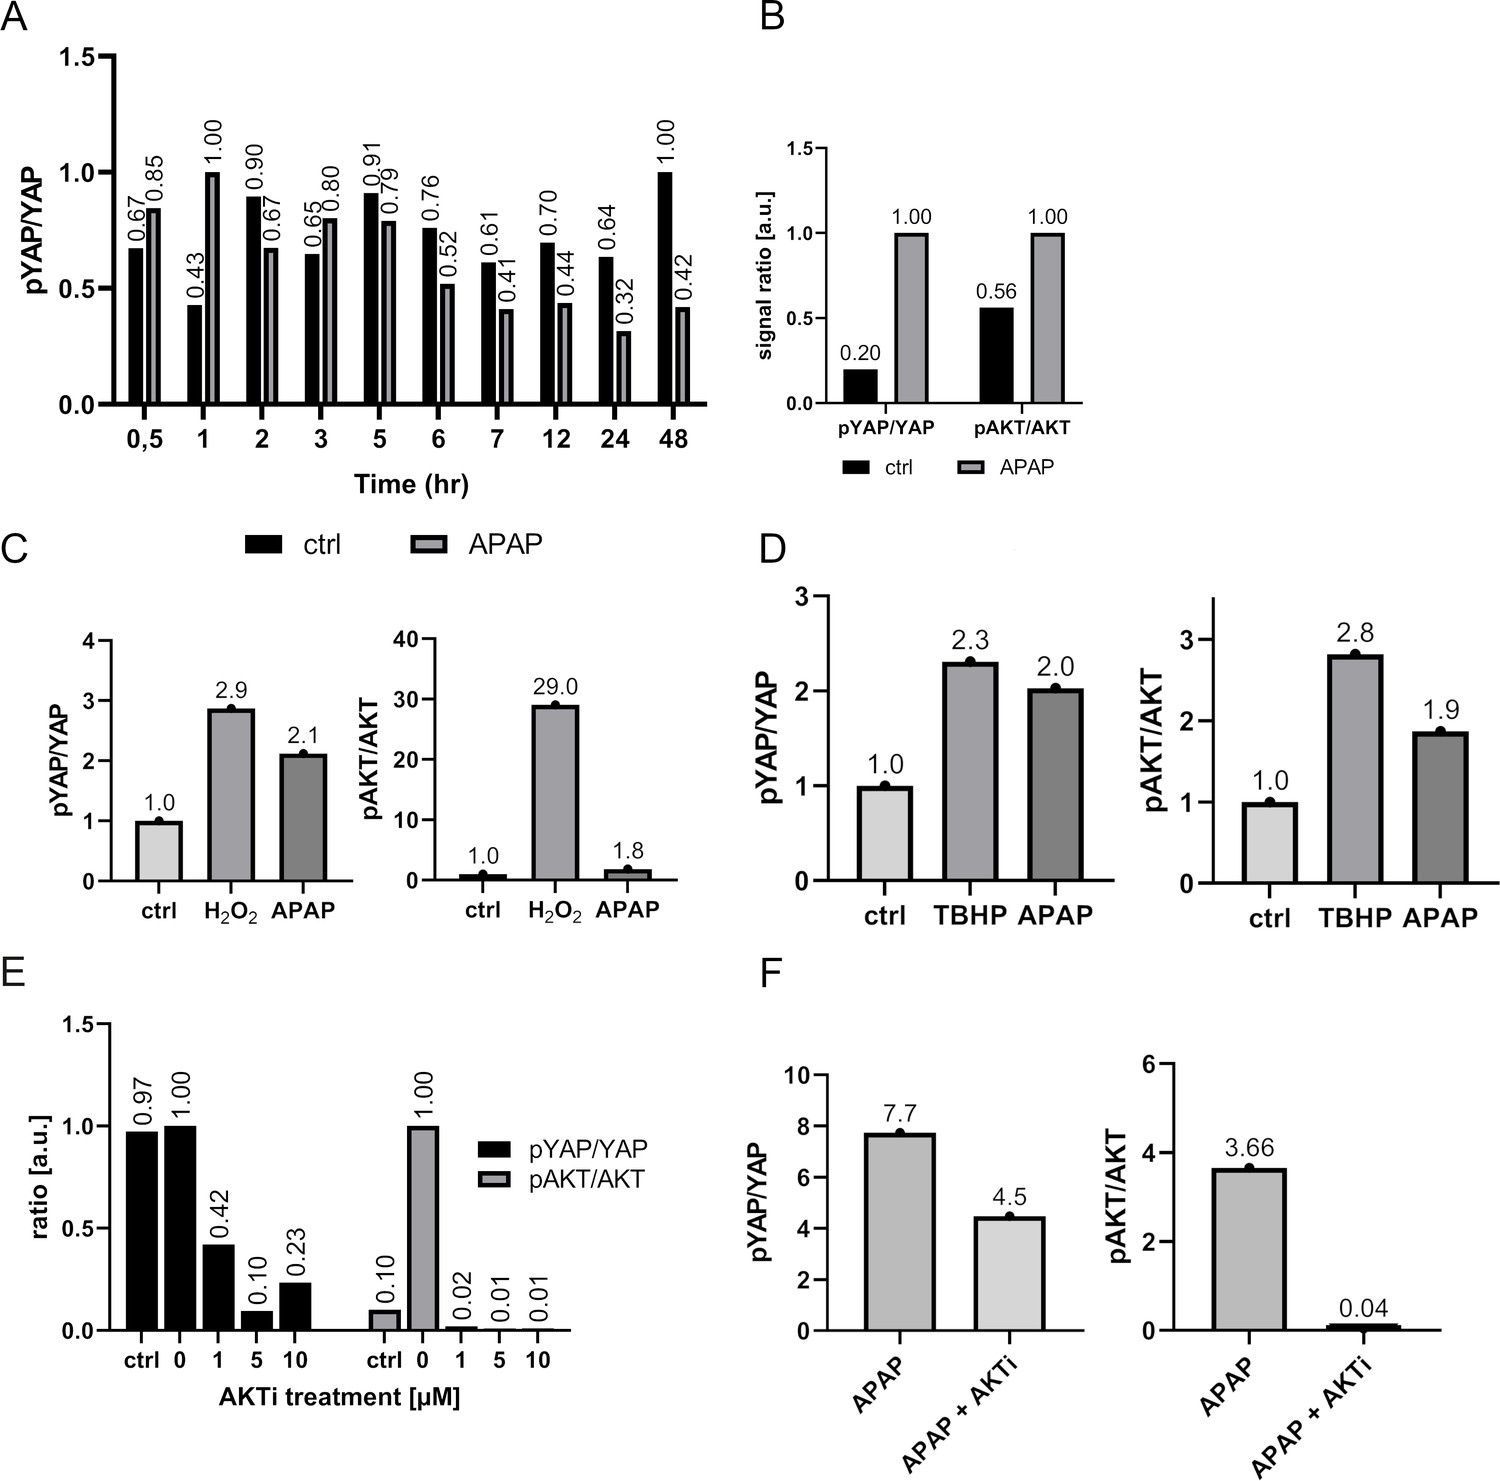
Quantification of the Western immunoblot analysis of Figures 3 and 4.
The pYAP to YAP and pAKT to AKT ratio was quantified. Panel A corresponds to Figure 3C; B – 4A; C – 4C, D – 4D, E – 4E, F – 4F.
Figure 4
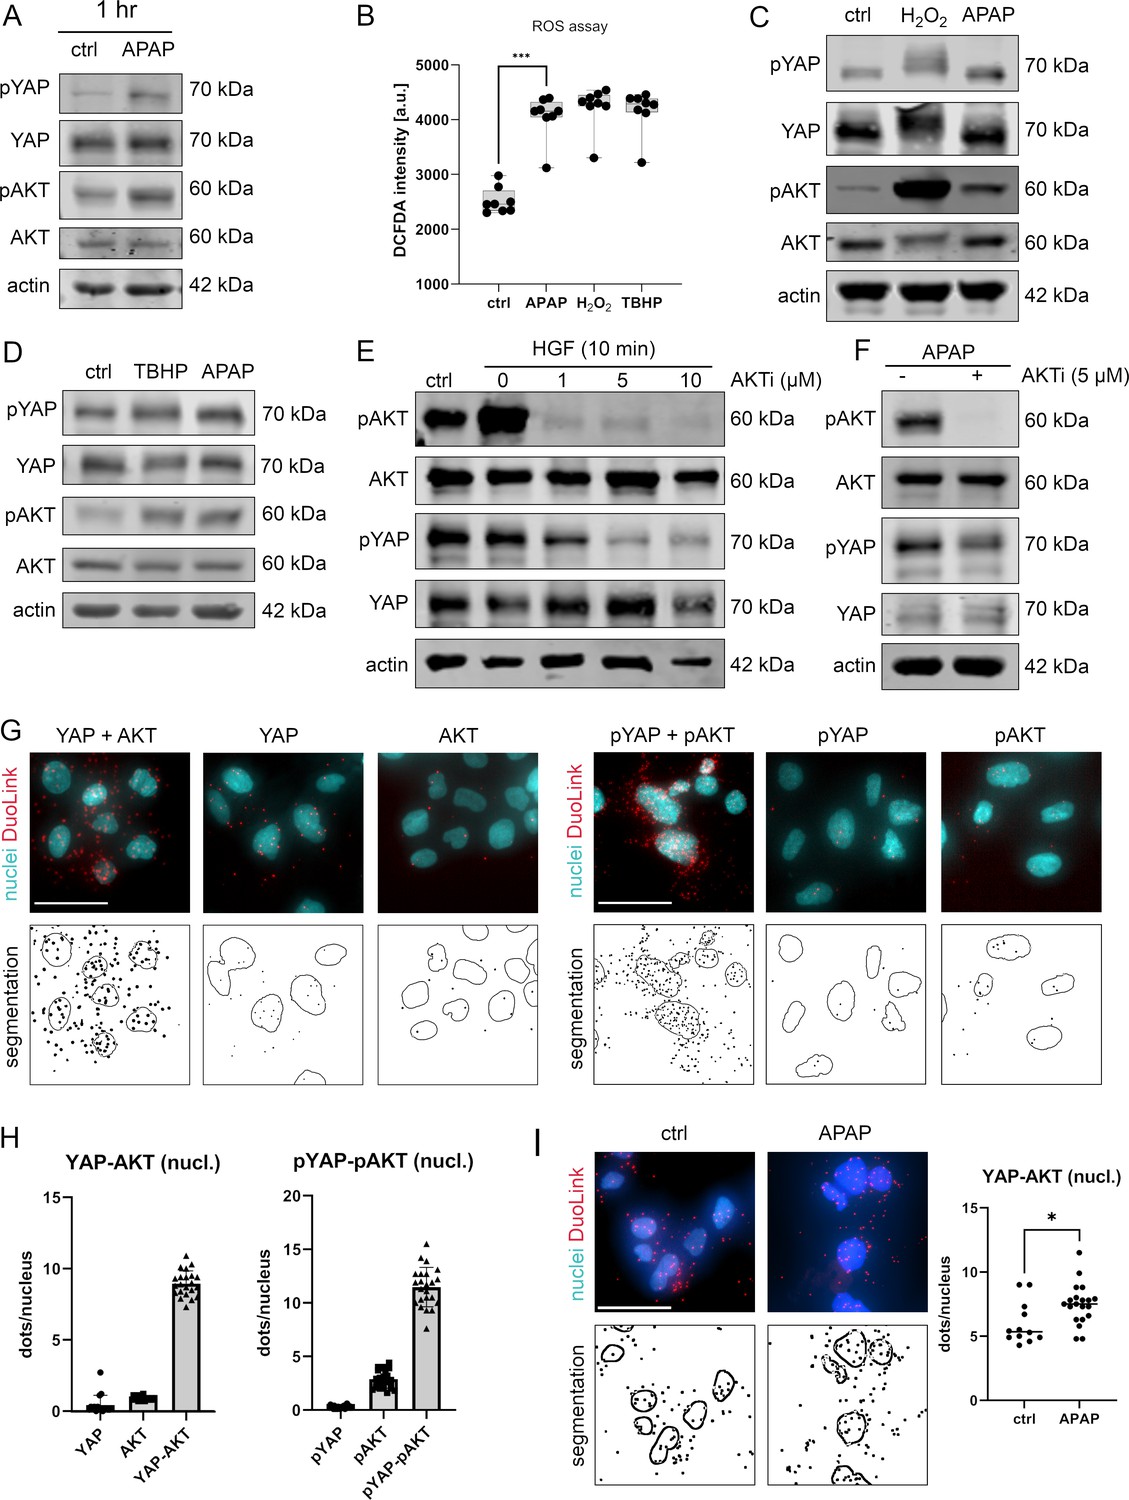
APAP controls nuclear YAP enrichment via induction of reactive oxygen species (ROS) and AKT.
(A) Western immunoblot analysis of pYAP, YAP, pAKT, and AKT after APAP (10 mM) administration in Hep3B cells after 1 hr (Hep3B). The concentration of pYAP and pAKT is induced after APAP treatment in comparison to phosphate-buffered saline (PBS)-treated cells (ctrl); n = 2. (B) Spectrophotometric ROS measurement after APAP (10 mM), hydrogen peroxide (H2O2, 2 mM), and tert-butyl hydroperoxide (TBHP, 300 µM) treatment in Hep3B cells after 6 hr (n = 8 technical replicates, one out of two biological replicates is shown). APAP as well as H2O2 and TBHP induce ROS formation in living cells. Statistical test: one-way analysis of variance (ANOVA) with Geisser–Greenhouse correction (adjusted p value = 0.001) ***p-value ≤ 0.001. Whiskers depict min and max of the dataset. (C) Western immunoblot analysis of pYAP, YAP, pAKT, and AKT after H2O2 (2 mM) and APAP (10 mM) treatment for 1 hr. APAP, as well as H2O2 induce YAP and AKT phosphorylation compared to untreated cells (ctrl); n = 4. (D) Western immunoblot analysis of pYAP, YAP, pAKT, and AKT dynamics after TBHP (300 µM) and APAP (10 mM) treatment for 2 hr (Hep3B). APAP and TBHP induce AKT and YAP phosphorylation as compared to respective controls (ctrl). (E) Western immunoblot analysis of pAKT, AKT, pYAP, and YAP after hepatocyte growth factor (HGF) treatment (10 ng/µl) for 10 min (Hep3B). The cells were pretreated with an AKT inhibitor VIII (AKTi, 1, 5, and 10 µM) and starved for 3 hr prior HGF administration. Data illustrate that AKT inhibition prevents HGF-induced AKT and YAP phosphorylation. (F) Western immunoblot of pAKT, AKT, pYAP, and YAP after APAP (10 mM) administration for 1 hr (Hep3B). Cells were starved in Fetal calf serum (FCS)-free medium and pretreated with AKTi (5 µM) before APAP treatment for 3 hr. Results demonstrate that AKT inhibition reduces YAP phosphorylation early after APAP treatment. (G) Proximity ligation assay (PLA) of the protein combinations YAP/AKT and pYAP/pAKT. Red dots indicate interactions between YAP/AKT and pYAP/pAKT, respectively. DAPI-stained nuclei are depicted in cyan. Single YAP, AKT, pYAP, and pAKT stains serve as assay controls. Bottom row: segmentation of the nuclei (empty circles) and dots (black spots). One out of two representative experiment is shown. Scale bar: 50 µm. (H) Quantification of the interactions between YAP/AKT and pYAP/pAKT in the nucleus (experiment shown in G). One symbol represents one image (YAP = 17, AKT = 16, YAP-AKT = 22, pYAP = 24, pAKT = 25, pYAP-pAKT = 23). (I) PLA showing YAP–AKT interaction units per nuclei of untreated (ctrl, n = 12) and APAP-treated cells (10 mM, for 2 hr, n = 20). APAP treatment induces nuclear interaction between YAP and AKT. Statistical test: unpaired two-tailed parametric t-test (p value = 0.0155). For A and C–F, actin served as loading control.
-
Figure 4—source data 1
Source data for Western Blots shown in Figure 4A,C-F.
- https://cdn.elifesciences.org/articles/78540/elife-78540-fig4-data1-v1.zip
Figure 5 with 1 supplement
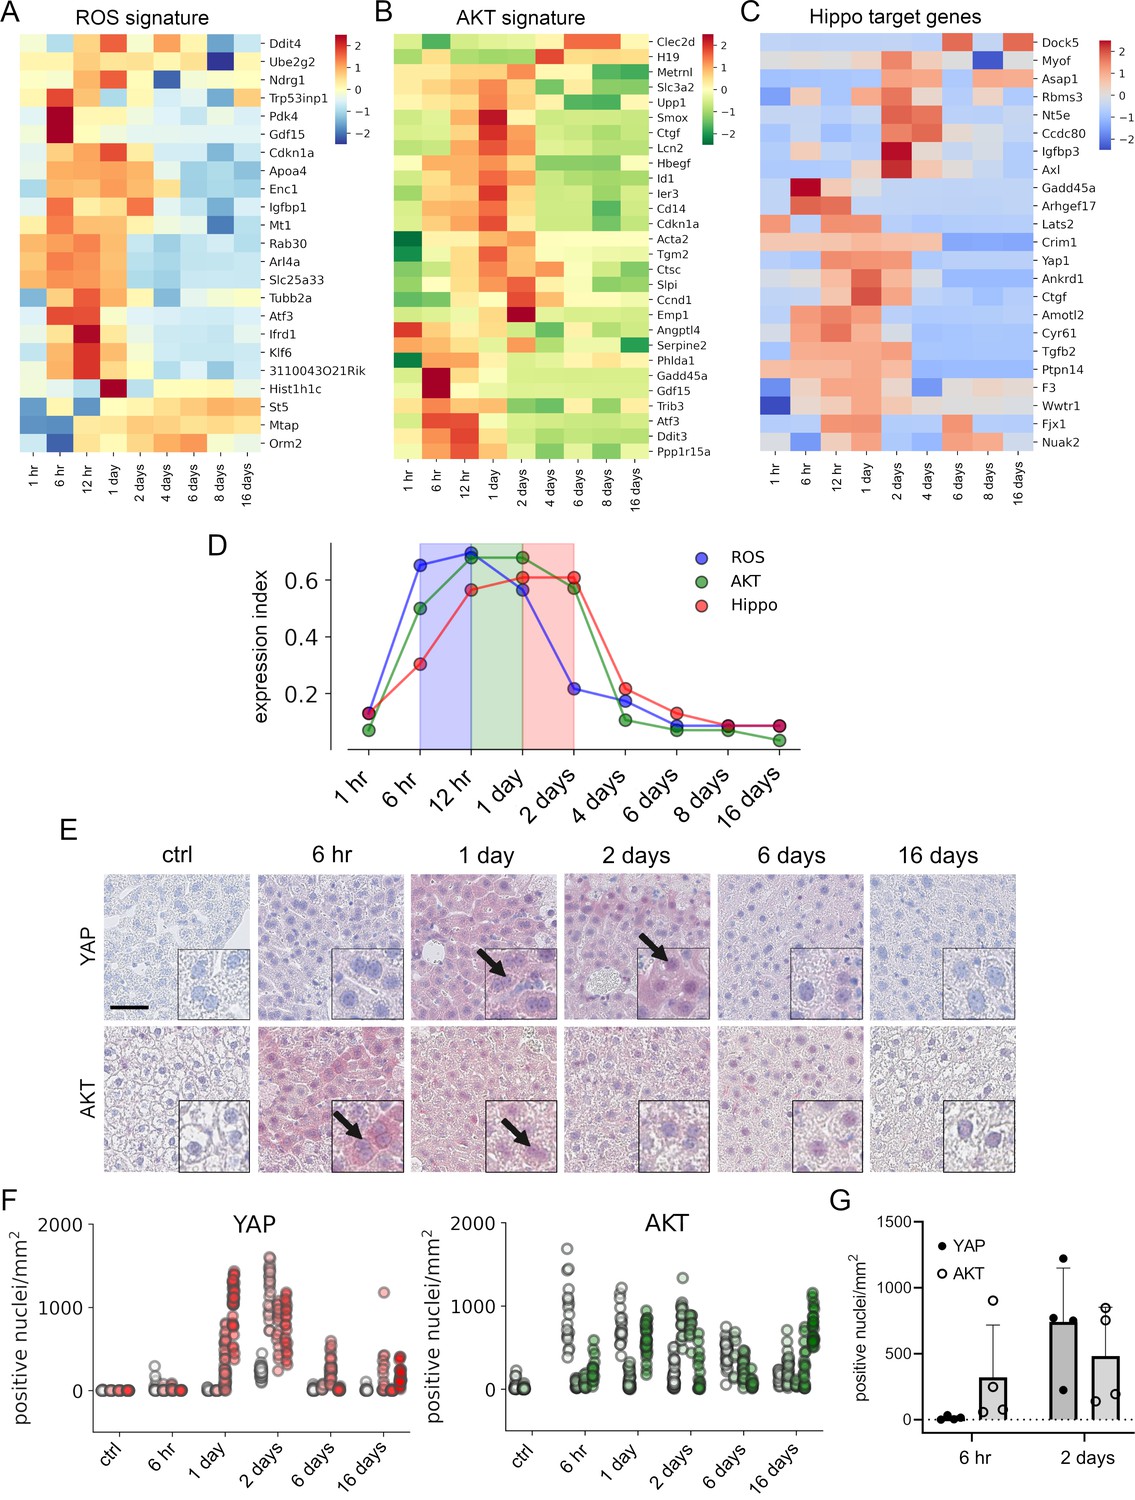
APAP stimulates the sequential activation of reactive oxygen species (ROS), AKT, and YAP in vivo.
Gene expression profiling over time of mouse livers after APAP treatment (A–C) was performed for up to 16 days (3–5 animals/group, 300 mg/kg). Abundance of gene signatures characteristic for the activity of ROS consisting of 23 genes (Han et al., 2008) (A), AKT (B) with 28 genes (De Marco et al., 2017) and YAP (C) consisting of 23 genes (Wang et al., 2018) were analyzed. In A–C, gene expression values are z-score normalized. (D) Summarized gene expression scores (expression index) over time illustrate the timely order of ROS (max values between 6 and 12 hr), AKT (max values between 12 hr and 1 day) and YAP (max values between 1 and 2 days) target gene signatures after APAP treatment. (E) Mouse liver tissue sections stained for YAP (top tow) and total AKT (bottom row) under control condition and at 6 hr as well as 1, 2, 6, and 16 days after APAP treatment (300 mg/kg). Arrows indicate high YAP and AKT positivity in nuclei. Scale bar: 50 µm. (F) Automatic quantification of nuclei with YAP and AKT positivity in mouse liver tissues. Each dot represents the count of stained nuclei in one image (a tile, 1 mm2) for YAP (n = 733) and AKT (n = 520). (G) Quantification of YAP and AKT nuclear positivity 6 hr and 2 days after APAP treatment. One dot represents the average count of positive nuclei in one animal (n = 4).
Figure 5—figure supplement 1
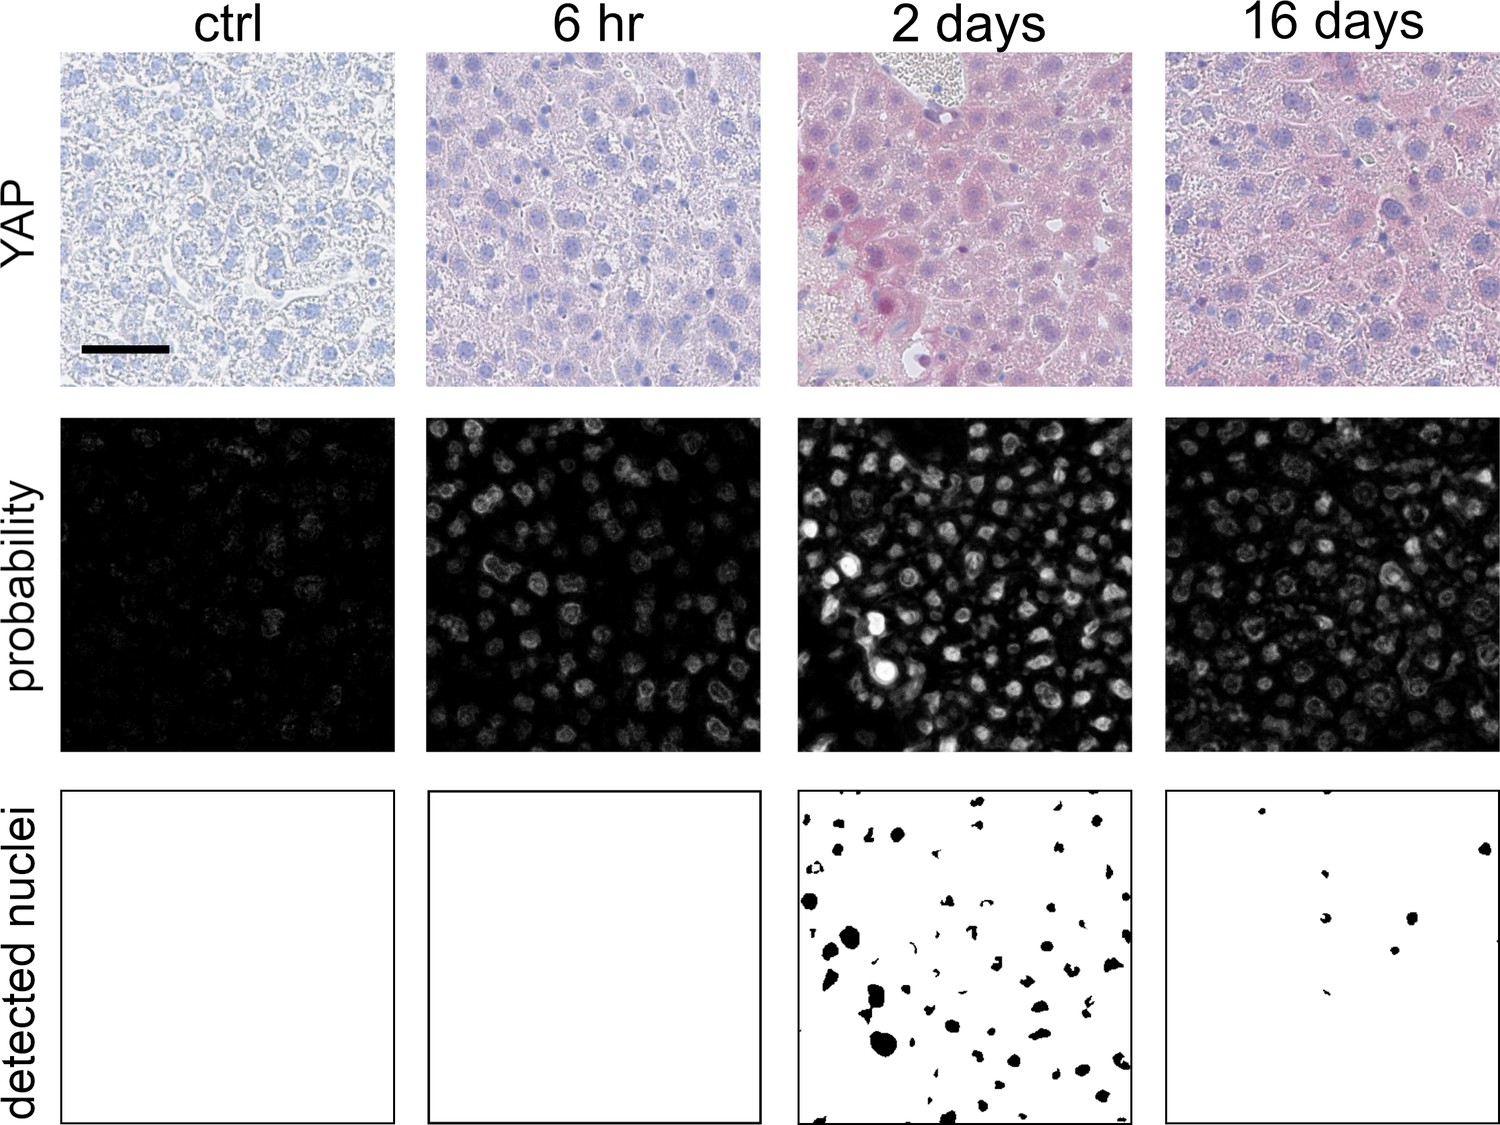
Quantification of YAP- and AKT-positive nuclei using immunohistochemically stained tissue slides.
Exemplary quantification workflow for YAP-positive nuclei in mouse liver tissues. Top row: Immunohistochemistry (IHC) stain for YAP in untreated tissue samples and after APAP treatment (300 mg/kg). The respective time after APAP treatment is indicated above. Middle row: probability maps obtained by the trained model. Bottom row: detected nuclei after applying threshold on the probability maps.
Author response image 1
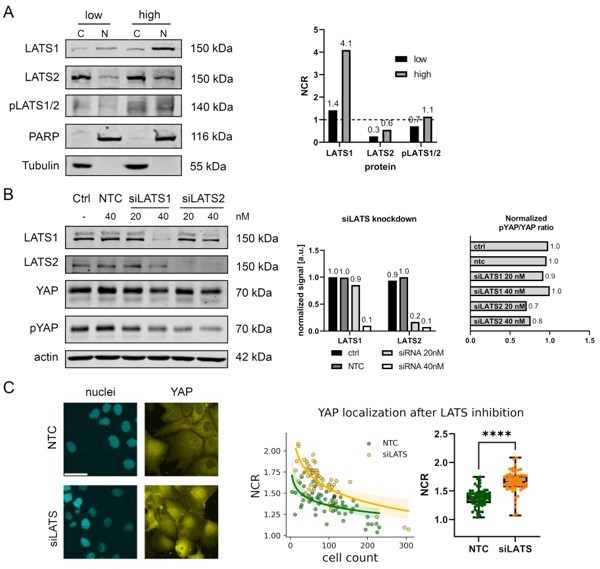
Western blot of nuclear and cytoplasmic protein fractions derived from Hep3B cells under low and high cell density conditions (5x10⁵ for low cell density and 3x10⁶ cells for high cell density per 10 cm dish).
Quantification of the NCR for LATS1, LATS2, and phosphorylated LATS (pLATS1/2) under low and high cell density is depicted on the right. C: cytoplasmic fraction; N: nuclear fraction. (B): Inhibition of LATS proteins in Hep3B cells using siRNAs at different concentrations for 4 hr (20 and 40 nM; (siLATS1, 5’-CCA GAA GGA UAU AGA CAA AdTdT-3’; siLATS2, 5’-CAU GAA GAC CCU AAG GAA AdTdT-3’). Quantification of LATS knockdown efficiency and effect on YAP phosphorylation is shown on the right. Ctrl: untreated control, NTC: no template control. Cytoplasmic (C) and nuclear (N) protein fraction. (C): Live-cell imaging of Hep3B cells after LATS inhibition (siLATS1/2) and NTC (no template control) treatment (left). Scale bar 50 µm. Quantification of the NCR between NTC (n=60) and siLATS (n=55) with respect to cell count per image (representing cell density). Shaded area around the green and yellow curves represent 96% confidence interval of the fitted log(x) function. Statistics: two-tailed Mann-Whitney test with p-value<0.0001.
Author response image 2
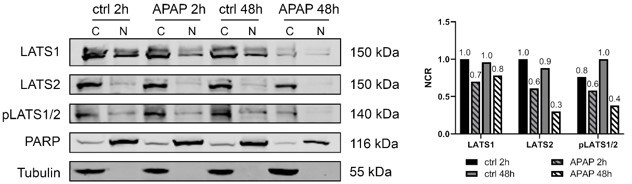
Western blotting of cytoplasmic (C) and nuclear (N) fraction 2 and 48 hours after APAP (10 mM) and control (ctrl) treatment in Hep3B cells.
The localization of LATS1, LATS2 and pLATS1/2 proteins was detected. PARP and Tubulin served as loading controls for nucleus and cytoplasm, respectively. The quantification of the NCR of LATS1, LATS2 and pLATS1/2 shown on the right. Western blots were obtained from one experiment.
Author response image 3
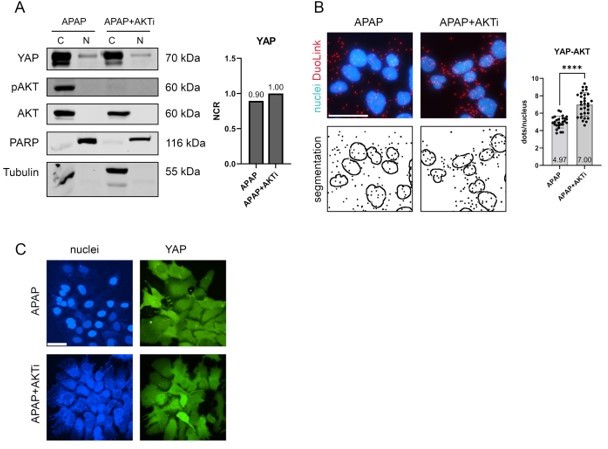
(A): Left: nuclear and cytoplasmic protein fractionation after APAP (10 mM, 1h in FCS-free medium) and combined APAP and AKTi (AKT inhibitor VIII, 10 µM 3h in FCS-free medium) treatment of Hep3B cells.
PARP and Tubulin serve as loading controls for nuclear and cytoplasmic fraction, respectively. Right: quantification of the NCR of YAP after APAP and combined APAP and AKTi treatment. (B): DuoLink PLA between YAP and AKT proteins under APAP (10 mM, 2h) and combined APAP and AKTi (10 µM, 3h) treatment. Top row: nuclei (blue) and YAP-AKT interaction (red dots); bottom row: segmentation of the nuclei and PLA dots. Right: quantification of the PLA dots in nuclei for APAP (27 images) and combined APAP/AKTi treatment (31 images). Statistics: two tailed Mann-Whitney test, p-value<0.0001. Scale bar 50 µm. (C): Live-cell imaging of Hep3B cells under APAP (10 mM 2h, top row) and combined APAP and AKTi (10µM 3h, bottom row) treatment.
Author response image 4
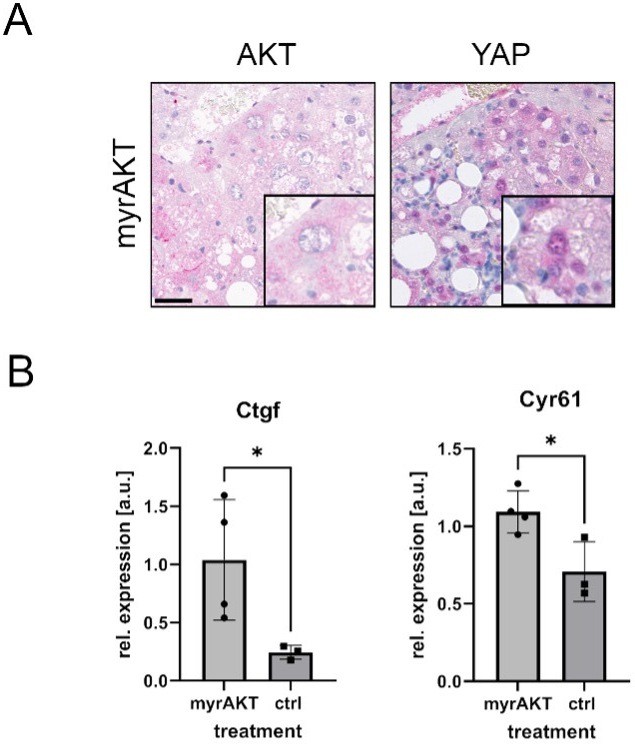
(A): Immuno-histochemical staining of AKT (left) and YAP (right) of tissues derived from FVB mice after hydrodynamic injection of expression vectors coding myrAKT.
Experiments and ethical aspects have been published previously (Luiken et al., 2020). Scale bar 50 µm. (B): Quantitative polymerase chain reaction (qPCR) measurements of murine Hippo target genes Ctgf and Cyr61 (biological replicates: ncontrol = 3, nmyrAKT = 4). Statistics: unpaired two tailed t test; p-valueCtgf = 0.049, p-valueCyr61 = 0.026.
Author response image 5
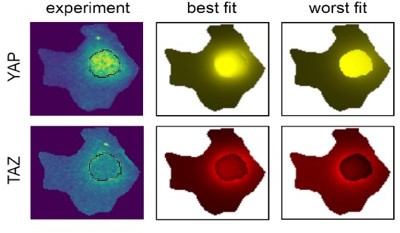
A visual representation of one of the best models for YAP and TAZ, and the worst models.
Parameter value distribution of YAP.
Author response image 6
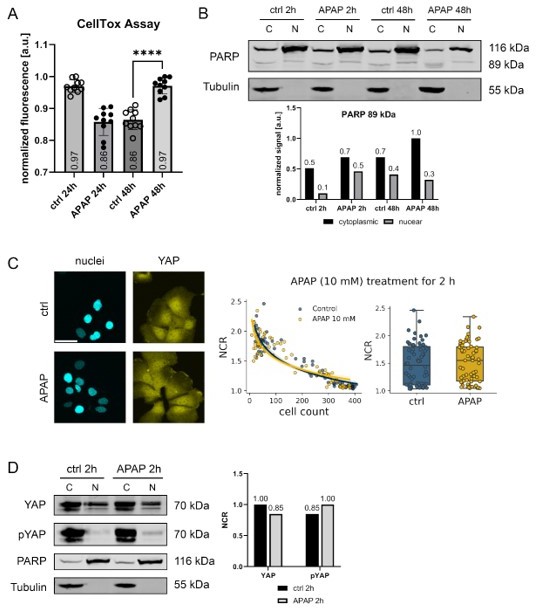
(A): CellTox assay quantifying non-viable cells in Hep3B cells after APAP (10 mM) treatment for 24 and 48 hours (n=10, technical replicates, independent biological replicates are not shown).
Statistics: two-tailed unpaired t test, p-value<0.0001. (B): Nuclear/cytoplasmic protein fractioning of Hep3B cells after APAP (10mM) treatment for 2 and 48 hours. Total (116 kDa) and cleaved PARP (89 kDa) were detected. Tubulin served as fractionation control. Quantification of cleaved PARP fragments is shown below. C: cytoplasmic; N: nuclear fraction. (C): Live-cell imaging of Hep3B cells expressing Venus-tagged YAP 2 hours after APAP (10 mM) or control treatment (PBS). Exemplary fluorescent images (left) and data quantification of NCR as a function of cell count per image (right) are shown. One (out of three) representative experiment is shown (nctrl = 68; nAPAP = 68). Scale bar 50 µm. (D): Nuclear/cytoplasmic protein fractionation after APAP treatment (10 mM, 2 hours). Detection of YAP and pYAP is shown. PARP and tubulin serve as loading controls. Quantification of NCR between YAP and pYAP is shown (right). C: cytoplasmic; N: nuclear fraction. Western immunoblots in (B) and (D) were obtained from one experiment.
Tables
Key resources table
| Reagent type (species) or resource | Designation | Source or reference | Identifiers | Additional information |
|---|---|---|---|---|
| Gene (Homo sapiens) | YAP | Prof. Loewer (TU Darmstadt) | ENSG00000137693 | – |
| Gene (Homo sapiens) | TAZ | Cloned | ENSG00000018408 | – |
| Cell line (Homo sapiens) | Hep3B | DSMZ | #ACC93 | – |
| Cell line (Homo sapiens) | HepG2 | LGC | ATCC-HB-8065 | – |
| Cell line (Homo sapiens) | HLF | JCRB | JCRB0405 | – |
| Cell line (Homo sapiens) | SNU182 | ATCC | CRL-2235 | – |
| Transfected construct | pRRLN-EF1α-mVenus-YAP | Prof. Loewer (TU Darmstadt) | End-to-end sequencing | – |
| Transfected construct | pRRLN-EF1α-d2mCherry-TAZ | This paper | End-to-end sequencing | – |
| Transfected construct | pLentiPGK-mCerulean-H2B | Addgene | 90234 | – |
| Chemical compound, drug | AKT inhibitor VIII | Merck Millipore | 124018 | – |
| Sequence-based reagent | siRNA YAP#1 | This paper | CCACCAAGCUAG AUAAAGA-dT-dT | |
| Sequence-based reagent | siRNA YAP#2 | This paper | GGUCAGAGAUAC UUCUUAA-dT-dT | |
| Sequence-based reagent | control siRNA | This paper | UGGUUUACAUG UCGACUAA | |
| Antibody | YAP (rabbit monoclonal) | Cell Signaling Technology | RRID:AB_2650491 | WB (1:1000) |
| Antibody | pYAP (rabbit polyclonal) | Cell Signaling Technology | RRID:AB_2218913 | WB (1:400) PLA (1:200) |
| Antibody | pAKT (rabbit monoclonal) | Cell Signaling Technology | RRID:AB_2315049 | WB (1:1000) |
| Antibody | AKT (rabbit polyclonal) | Cell Signaling Technology | RRID:AB_329827 | WB (1:1000) PLA (1:200) |
| Antibody | β-Actin (mouse monoclonal) | MP Biomedicals, Solon | RRID:AB_2335127 | WB (1:10,000) |
| Antibody | LATS1 (mouse monoclonal) | Santa Cruz Biotechnology | sc-398560 | WB (1:200) |
| Antibody | LATS2 (mouse monoclonal) | Santa Cruz Biotechnology | sc-515579 | WB (1:200) |
| Antibody | pLATS1/2 (rabbit monoclonal) | Cell Signaling Technology | RRID:AB_10971635 | WB (1:500) PLA (1:200) |
| Antibody | CYP2E1 (rabbit unknown) | Novus Biologicals | RRID:AB_11021447 | WB (1:500) |
| Antibody | PARP (rabbit polyclonal) | Cell Signaling Technology | RRID:AB_2160739 | WB (1:10,000) |
| Antibody | β-Tubulin (mouse monoclonal) | Santa Cruz Biotechnology | RRID:AB_2288090 | WB (1:200) |
| Antibody | GAPDH (chicken polyclonal) | Merck Millipore | RRID:AB_10615768 | WB (1:10,000) |
| Antibody | YAP (mouse monoclonal) | Santa Cruz Biotechnology | RRID:AB_10612397 | PLA (1:25) |
| Antibody | pAKT (mouse monoclonal) | Cell Signaling Technology | RRID:AB_331158 | PLA (1:200) |
| Antibody | YAP (rabbit monoclonal) | Cell Signaling Technology | RRID:AB_2650491 | IHC (1:50) |
| Antibody | AKT (rabbit polyclonal) | Cell Signaling Technology | RRID:AB_329827 | IHC (1:50) |
| Commercial assay or kit | ROS assay kit | Abcam | ab287839 | – |
| Sequence- based reagent | YAP (human) – forward | This paper | NM_006106 | CCTGCGTAGCCAGTTACCAA |
| Sequence- based reagent | YAP (human) – reverse | This paper | NM_006106 | CCATCTCATCCACACTGTTC |
| Sequence- based reagent | ANKRD1 (human) – for | This paper | NM_014391.3 | AGTAGAGGAACTGGTCACTGG |
| Sequence- based reagent | ANKTD1 (human) – rev | This paper | NM_014391.3 | TGGGCTAGAAGT GTCTTCAGA T |
| Sequence- based reagent | CYR61 (human) – for | This paper | NM_001554.5 | AGCCTCGCATCCTATACAACC |
| Sequence- based reagent | CYR61 (human) – rev | This paper | NM_001554.5 | TTCTTTCACAAGGCGGCACTC |
| Sequence- based reagent | GAPDH (human) – for | This paper | NM_002046.7 | CTGGTAAAGTGGATATTGTTGCCAT |
| Sequence- based reagent | GAPDH (human) – rev | This paper | NM_002046.7 | TGGAATCATATTGGAACATGTAAACC |
| Sequence- based reagent | RPL41 (human) – for | This paper | NM_001035267 | AAACCTCTGCGCCATGAGAG |
| Sequence- based reagent | RPL41 (human) – rev | This paper | NM_001035267 | AGCGTCTGGCATTCCATGTT |
| Sequence- based reagent | SRDF4 (human) – for | This paper | NM_005626 | TGCAGCTGGCAAGACCTAAA |
| Sequence- based reagent | SRSF4 (human) – rev | This paper | NM_005626 | TTTTTGCGTCCCTTGTGAGC |
| Sequence- based reagent | B2M (human) – for | This paper | NM_004048 | CACGTCATCCAGCAGAGAAT |
| Sequence- based reagent | B2M (human) – rev | This paper | NM_004048 | TGCTGCTTACATGTCTCGAT |
| Software, algorithm | ASAP software | https://github.com/computationalpathologygroup/ASAP | v1.6 | – |
| Software, algorithm | ImageJ | Rueden et al., 2017 | v1.53f51 | – |
| Software, algorithm | Weka segmentation | Arganda-Carreras et al., 2017 | v3.3.1 | – |
| Software, algorithm | Ilastik | Berg et al., 2019 | v1.3.3 | – |
| Software, algorithm | Spatial Model Editor | https://spatial-model-editor.github.io | v1.2.1 | – |
| Software, algorithm | sme-contrib | https://spatial-model-editor.github.io | v0.014 | – |
Appendix 1—table 1
Canonical model parameters.
| Parameter | Symbol | YAP model | TAZ model | Unit |
|---|---|---|---|---|
| Diffusion | 0.0391776 | 0.00812799 | µm2/s | |
| Diffusion phosphorylated | 0.433785 | 0.501116 | µm2/s | |
| Phosphorylation | 3.2462731384467 | 9.2660885020866 | s–1 | |
| Dephosphorylation | 2.4380091829261 | 2.9721728333365 | s–1 | |
| Translation | 0.013295743091699 | 0.02329254213393 | a.u./s | |
| Degradation | 0.0081058910608829 | 0.0090941179957213 | s–1 | |
| Nuclear import | 9.7229134833679e−16 | 8.1106772583928e−16 | µm/s | |
| Nuclear export | 9.5119620861314e−17 | 6.1050891990604e−17 | µm/s |
Appendix 1—table 2
Alternative model parameters.
| Parameter | Symbol | YAP model | TAZ model | Unit |
|---|---|---|---|---|
| Diffusion | 9.84707 | 9.14393 | µm2/s | |
| Diffusion phosphorylated | 1.04518 | 1.00732 | µm2/s | |
| Phosphorylation | 0.028839815689838 | 0.10286291836829 | s–1 | |
| Dephosphorylation | 0.09121073484801 | 0.10517790271802 | s–1 | |
| Translation | 0.009403085138566 | 0.0030932046019853 | a.u./s | |
| Degradation | 0.0094299166245222 | 0.0097940321843269 | s–1 | |
| Nuclear import | 6.5845623444598e−15 | 9.5850453479782e−15 | µm/s | |
| Nuclear export | 7.8819897236132e−15 | 4.5876638224922e−15 | µm/s |
Appendix 1—table 3
Parameters of the YAP-to-TAZ transition model.
| Parameter | Symbol | Value | Unit |
|---|---|---|---|
| Diffusion | 10 | µm2/s | |
| Diffusion phosphorylated | 1 | µm2/s | |
| Phosphorylation | – | s–1 | |
| Dephosphorylation | – | s–1 | |
| Translation | 0.01 | a.u./s | |
| Degradation | 0.004 | s–1 | |
| Nuclear import | 7.5e−15 | µm/s | |
| Nuclear export | 1.6e−15 | µm/s |
Appendix 1—table 4
Parameter range for particle swarm algorithm of the canonical YAP/TAZ model.
| Parameter | Symbol | Range (min, max) | Unit |
|---|---|---|---|
| Diffusion | (0.001, 5) | µm2/s | |
| Diffusion phosphorylated | (0.001, 1) | µm2/s | |
| Phosphorylation | (0.1, 10) | s–1 | |
| Dephosphorylation | (0.1, 10) | s–1 | |
| Translation | (1e−3, 0.1) | a.u./s | |
| Degradation | (1e−3, 1e−2) | s–1 | |
| Nuclear import | (1e−16, 1e−15) | µm/s | |
| Nuclear export | (1e−17, 1e−15) | µm/s |
Appendix 1—table 5
Parameter range for particle swarm algorithm of the alternative YAP/TAZ model.
| Parameter | Symbol | Range (min, max) | Unit |
|---|---|---|---|
| Diffusion | (1, 10) | µm2/s | |
| Diffusion phosphorylated | (1, 1.5) | µm2/s | |
| Phosphorylation | (0.01, 0.5) | s–1 | |
| Dephosphorylation | (0.01, 0.5) | s–1 | |
| Translation | (1e−3, 0.01) | a.u./s | |
| Degradation | (1e−3, 0.01) | s–1 | |
| Nuclear import | (1e−16, 1e−14) | µm/s | |
| Nuclear export | (1e−16, 1e−14) | µm/s |
Appendix 1—table 6
Parameter values from the literature.
| Parameter | Value | Source |
|---|---|---|
| Hepatocyte cell volume | 10–11 l | Jack et al., 1990 |
| Hepatocyte nucleus volume | 5 ×10–13 | Jack et al., 1990 |
| Nuclear export | 10–100 s | Ege et al., 2018 |
| Nuclear import | 50 s | Ege et al., 2018 |
| Diffusion rate YAP/TAZ | 19 μm2/s | Ege et al., 2018 |
Author response table 1
Murine primers used for qPCR.
Expression of Cyr61 and Ctgf were normalized to a set of house-keeping genes: Actin, Gapdh, Tbp, Tubulin, Hprt, Ppia (software: GeNorm).
| Gene | Forward | Reverse |
|---|---|---|
| Actin | GCTTCTTTGCAGCTCCTTCGT | ACCAGCGCAGCGATATCG |
| Gapdh | TGTCCGTCGTGGATCTGAC | CCTGCTTCACCACCTTCTTG |
| Tbp | TTGTCTGCCATGTTCTCCTG | CAGGGTGATTTCAGTGCAGA |
| Tubulin | TCACTGTGCCTGAACTTACC | GGAACATAGCCGTAAACTGC |
| Ctgf | GGAGAACTGTGTACGGAGCG | CCAGGCAAGTGCATTGGTA |
| Hprt | TCCTCCTCAGACCGCTTTT | CCTGGTTCATCATCGCTAATC |
| Ppia | GCATACAGGTCCTGGCATCT | AGCTGTCCACAGTCGGAAAT |
| Cyr61 | GATCTGTGAAGTGCGTCCTTGTGG | GACACTGGAGCATCCTGCATAAG |
Additional files
-
Supplementary file 1
Fitted parameters for YAP.
- https://cdn.elifesciences.org/articles/78540/elife-78540-supp1-v1.xlsx
-
Supplementary file 2
Fitted parameters for TAZ.
- https://cdn.elifesciences.org/articles/78540/elife-78540-supp2-v1.xlsx
-
MDAR checklist
- https://cdn.elifesciences.org/articles/78540/elife-78540-mdarchecklist1-v1.docx
Download links
A two-part list of links to download the article, or parts of the article, in various formats.
Downloads (link to download the article as PDF)
Open citations (links to open the citations from this article in various online reference manager services)
Cite this article (links to download the citations from this article in formats compatible with various reference manager tools)
Spatial modeling reveals nuclear phosphorylation and subcellular shuttling of YAP upon drug-induced liver injury
eLife 11:e78540.
https://doi.org/10.7554/eLife.78540


