Molecular dissection of condensin II-mediated chromosome assembly using in vitro assays
- Chromosome Dynamics Laboratory, RIKEN, Japan
Figures
Figure 1 with 1 supplement
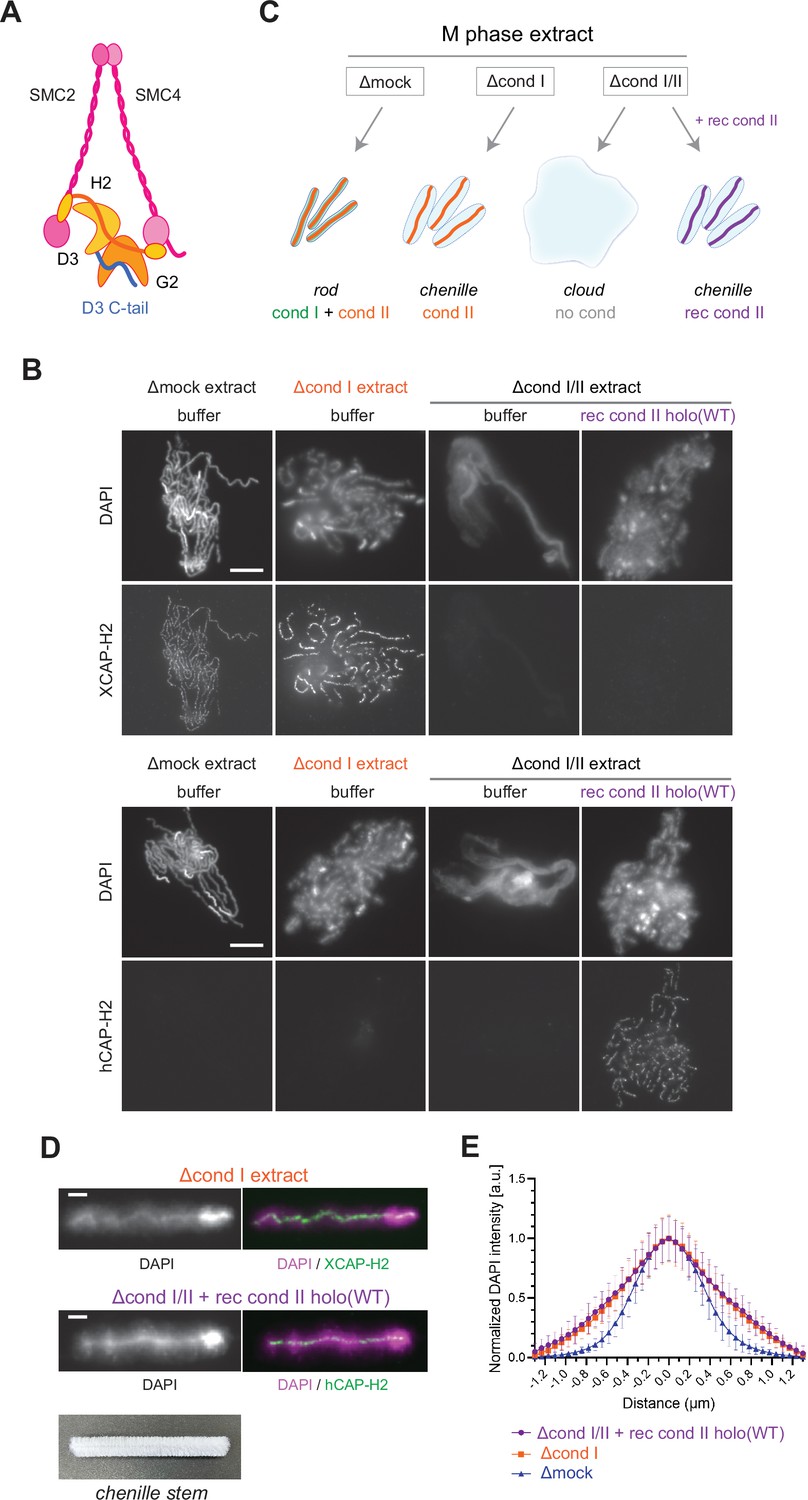
Recombinant condensin II holocomplex can functionally replace endogenous condensin II in Xenopus egg extracts.
(A) A schematic diagram of the condensin II holocomplex that is composed of two structural maintenance of chromosomes (SMC) subunits (SMC2 and SMC4), two HEAT subunits (CAP-D3 and CAP-G2), and a kleisin subunit (CAP-H2). (B) Mouse sperm nuclei were incubated with Δmock, Δcond I, or Δcond I/II extracts that had been supplemented with a control buffer (buffer) or recombinant (rec) condensin II holocomplex, holo(WT), at a final concentration of 200 nM. After 150 min, reaction mixtures were fixed, split, and labeled with an antibody against either Xenopus CAP-H2 (XCAP-H2) or human CAP-H2 (hCAP-H2). DNA was counterstained with DAPI (4′,6-diamidino-2-phenylindole). Shown here is a representative image from over 15 chromosome clusters examined per condition. Scale bar, 10 µm. (C) A schematic representation of the chromosome structures observed in Δmock, Δcond I, or Δcond I/II extracts. Rod-shaped chromosomes and chenille-like chromosomes are assembled in Δmock extract and Δcond I extract, respectively. Δcond I/II extract produces an amorphous mass of chromatin (‘clouds’). The addition of recombinant condensin II (rec cond II) to the same extract restores its ability to assemble chenille-like chromosomes. (D) A single chromosome assembled in Δcond I extract with buffer and Δcond I/II extract with 200 nM holo(WT) from samples from experiment (B) in comparison to a chenille stem. Scale bars for chromosomes, 2 µm. (E) DAPI intensities from the experiment described in (B) were measured along lines drawn perpendicular to chromosome axes to create line scan profiles for the width of chromosomes assembled in the Δcond I extract with buffer and Δcond I/II extract with 200 nM holo(WT) (n=20 chromosomes). The mean and SD were normalized individually to the DAPI intensity (arbitrary unit [a.u.]) at the center of chromosome axes (distance = 0 μm) within each set. A dataset from a single representative experiment out of three repeats is shown.
-
Figure 1—source data 1
Microsoft excel of non-normalized data corresponding to Figure 1E.
- https://cdn.elifesciences.org/articles/78984/elife-78984-fig1-data1-v2.xlsx
Figure 1—figure supplement 1
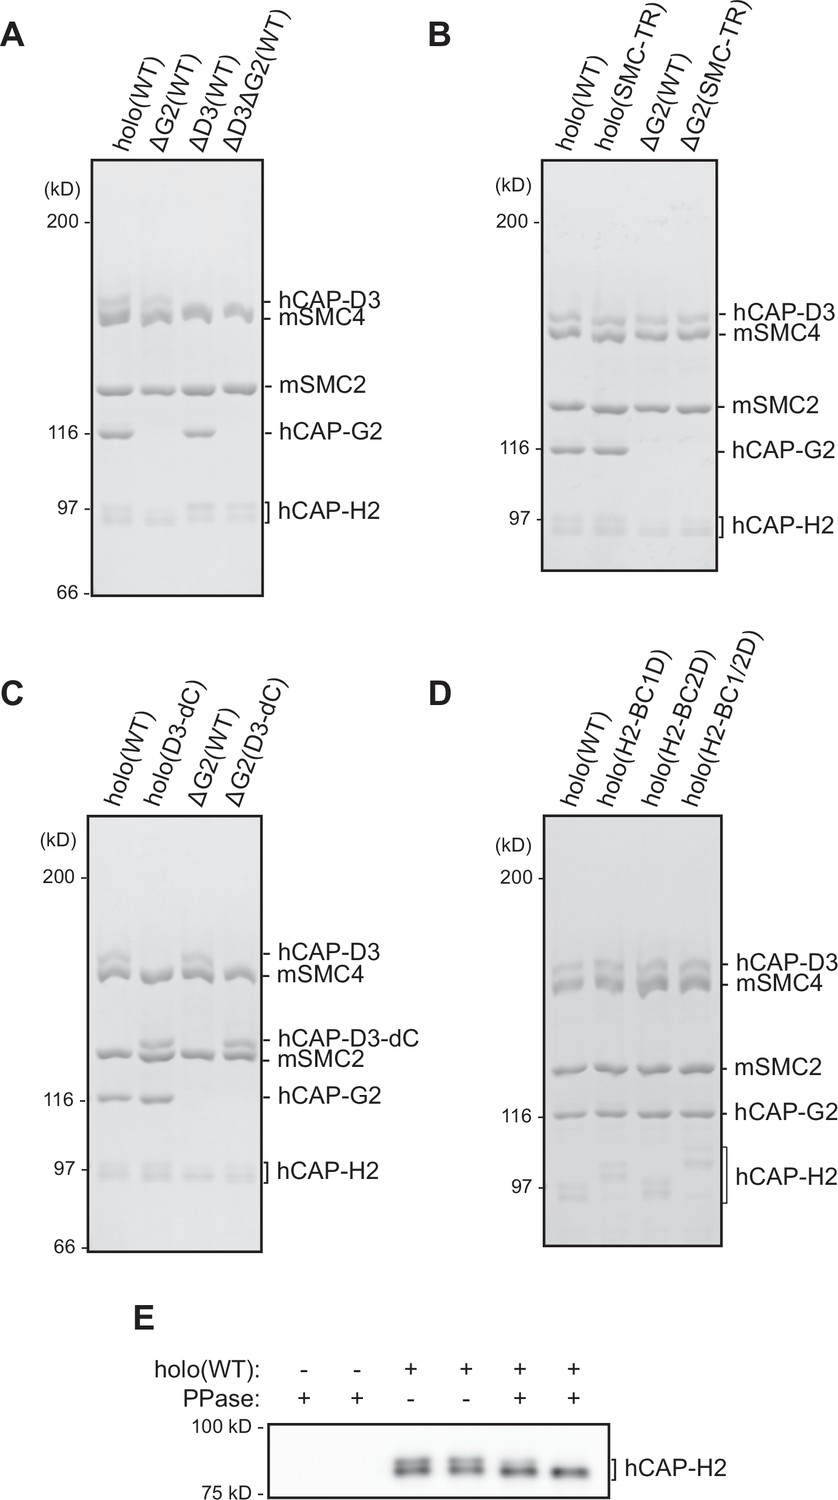
Recombinant condensin II complexes used in the study.
(A) Recombinant condensin II holocomplex (holo[WT]), ΔG2(WT), ΔD3(WT), and ΔD3ΔG2(WT) were purified and subjected to SDS-PAGE. The gel was stained with Coomassie Brilliant Blue (CBB). (B) Recombinant condensin II holocomplexes and ΔG2 subcomplexes containing either wild-type (WT) or transition state (TR) mutant version of the structural maintenance of chromosomes (SMC) subunits. (C) Recombinant condensin II holocomplexes and ΔG2 subcomplexes containing either WT or C-tail truncated version (D3–dC) of the CAP-D3 subunit. (D) Recombinant condensin II holocomplexes containing either WT, a single set of basic cluster mutations (H2-BC1D or H2-BC2D), or both sets of basic cluster mutations (H2-BC1/2D) of the CAP-H2 subunit. (E) Recombinant condensin II holo(WT) was incubated with or without λ protein phosphatase (PPase) for 60 min and subjected to immunoblotting. hCAP-H2 migrated as two bands without phosphatase treatment but migrated as a single band after protein phosphatase treatment, indicating that a fraction of hCAP-H2 is phosphorylated when expressed in insect cells.
-
Figure 1—figure supplement 1—source data 1
Raw data uncropped gels and blot corresponding to Figure 1—figure supplement 1.
- https://cdn.elifesciences.org/articles/78984/elife-78984-fig1-figsupp1-data1-v2.zip
-
Figure 1—figure supplement 1—source data 2
Microsoft excel of DNA constructs used in the study.
- https://cdn.elifesciences.org/articles/78984/elife-78984-fig1-figsupp1-data2-v2.zip
Figure 2 with 1 supplement
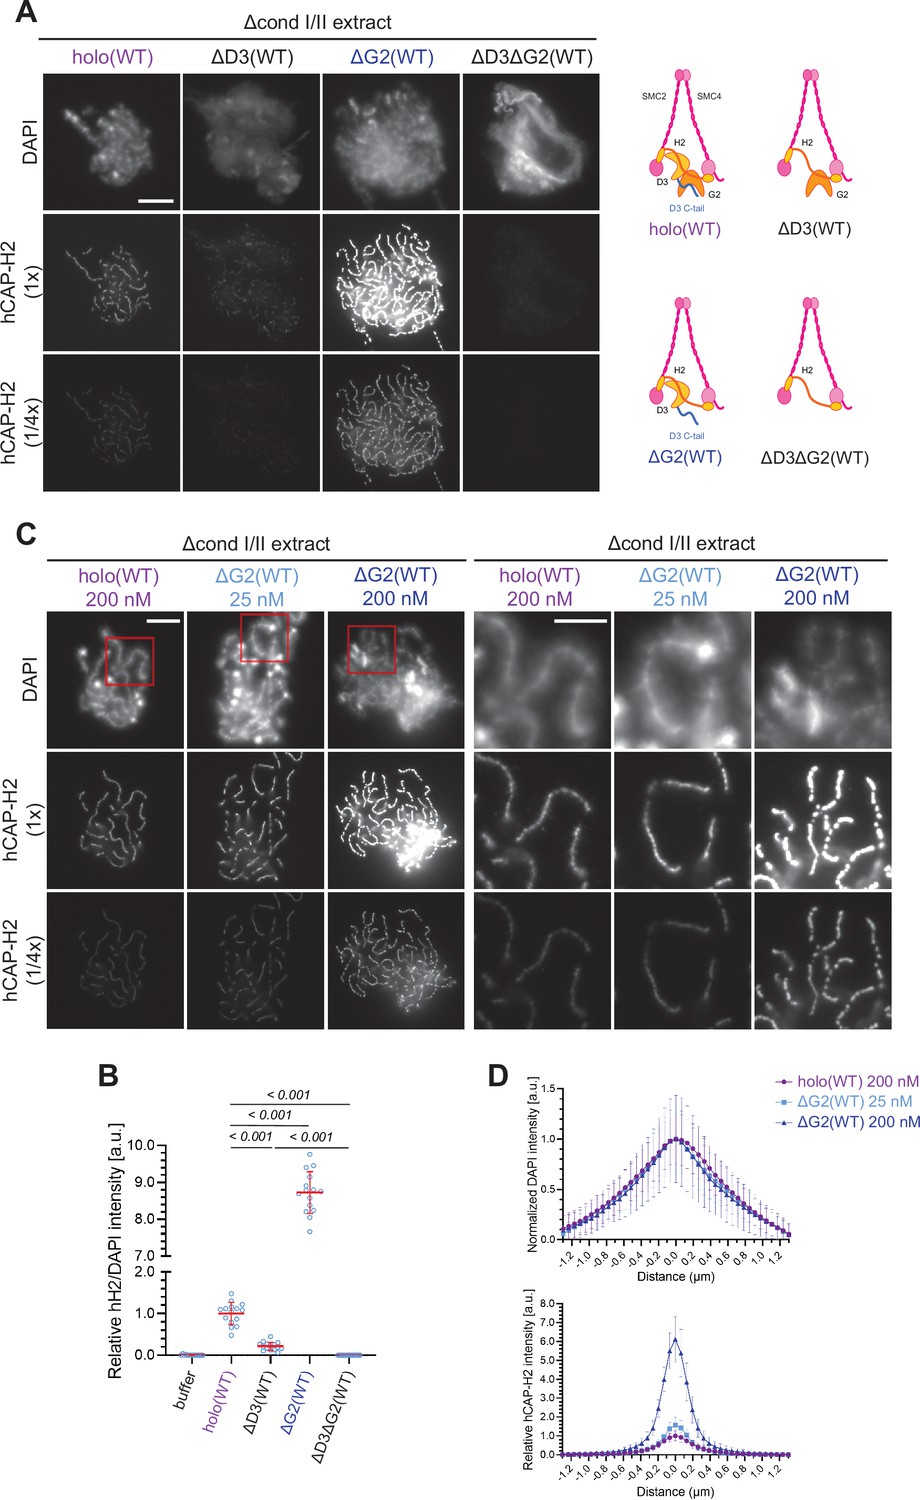
Chromosome association of condensin II is decreased by CAP-D3 deletion but is increased by CAP-G2 deletion.
(A) (Left) Mouse sperm nuclei were incubated with Δcond I/II extracts that had been supplemented with control buffer (buffer), recombinant condensin II holocomplex (holo[WT]) or its subcomplexes (ΔG2[WT], ΔD3[WT], and ΔD3ΔG2[WT]) at 200 nM. After 150 min, reaction mixtures were fixed, and labeled with anti-hCAP-H2 antibody. DNA was counterstained with DAPI. The images of the hCAP-H2 signal were captured at different relative exposure times (1 × and 1/4 ×) to show non-saturated signal intensities of chromosome structures produced by ΔG2(WT). Shown here is a representative image from over 15 chromosome clusters examined per condition. Scale bar, 10 µm. (Right) Schematic diagrams of the holocomplex and subcomplexes. (B) Signal intensities of hCAP-H2 from the experiment described in (A) were divided by DAPI signal intensities and the mean values were normalized relative to the value by holo(WT). The mean ± SD is shown (n=15 chromosome clusters). The p-values listed were assessed by two-tailed Welch’s t-test. (C) Mouse sperm nuclei were incubated with Δcond I/II extracts that had been supplemented with holo(WT) or ΔG2(WT) at concentrations indicated. After 150 min, reaction mixtures were fixed and processed for immunofluorescence as in (A). Shown here is a representative image from over 15 chromosome clusters examined per condition. The right panels show cropped images of the orange sections of the left panels. Scale bar, 10 µm (left) and 5 µm (right). (D) DAPI and hCAP-H2 intensities from the experiment described in (C) were measured along lines drawn perpendicular to the chromosome to create line scan profiles for the width of chromosomes assembled in Δcond I/II extract with 200 nM holo(WT) or either 25 nM or 200 nM ΔG2(WT) (n=20 chromosomes). The mean and standard deviation were normalized individually to the DAPI intensities (arbitrary unit [a.u.]) at the center of chromosome axes (distance = 0 μm) within each set. Intensities of hCAP-H2 were normalized relative to the central value by 200 nM holo(WT) addition. A dataset from a single representative experiment out of three repeats is shown. WT: wild-type.
-
Figure 2—source data 1
Microsoft excel of non-normalized data corresponding to Figure 2B.
- https://cdn.elifesciences.org/articles/78984/elife-78984-fig2-data1-v2.zip
-
Figure 2—source data 2
Microsoft excel of non-normalized data corresponding to Figure 2D.
- https://cdn.elifesciences.org/articles/78984/elife-78984-fig2-data2-v2.zip
Figure 2—figure supplement 1
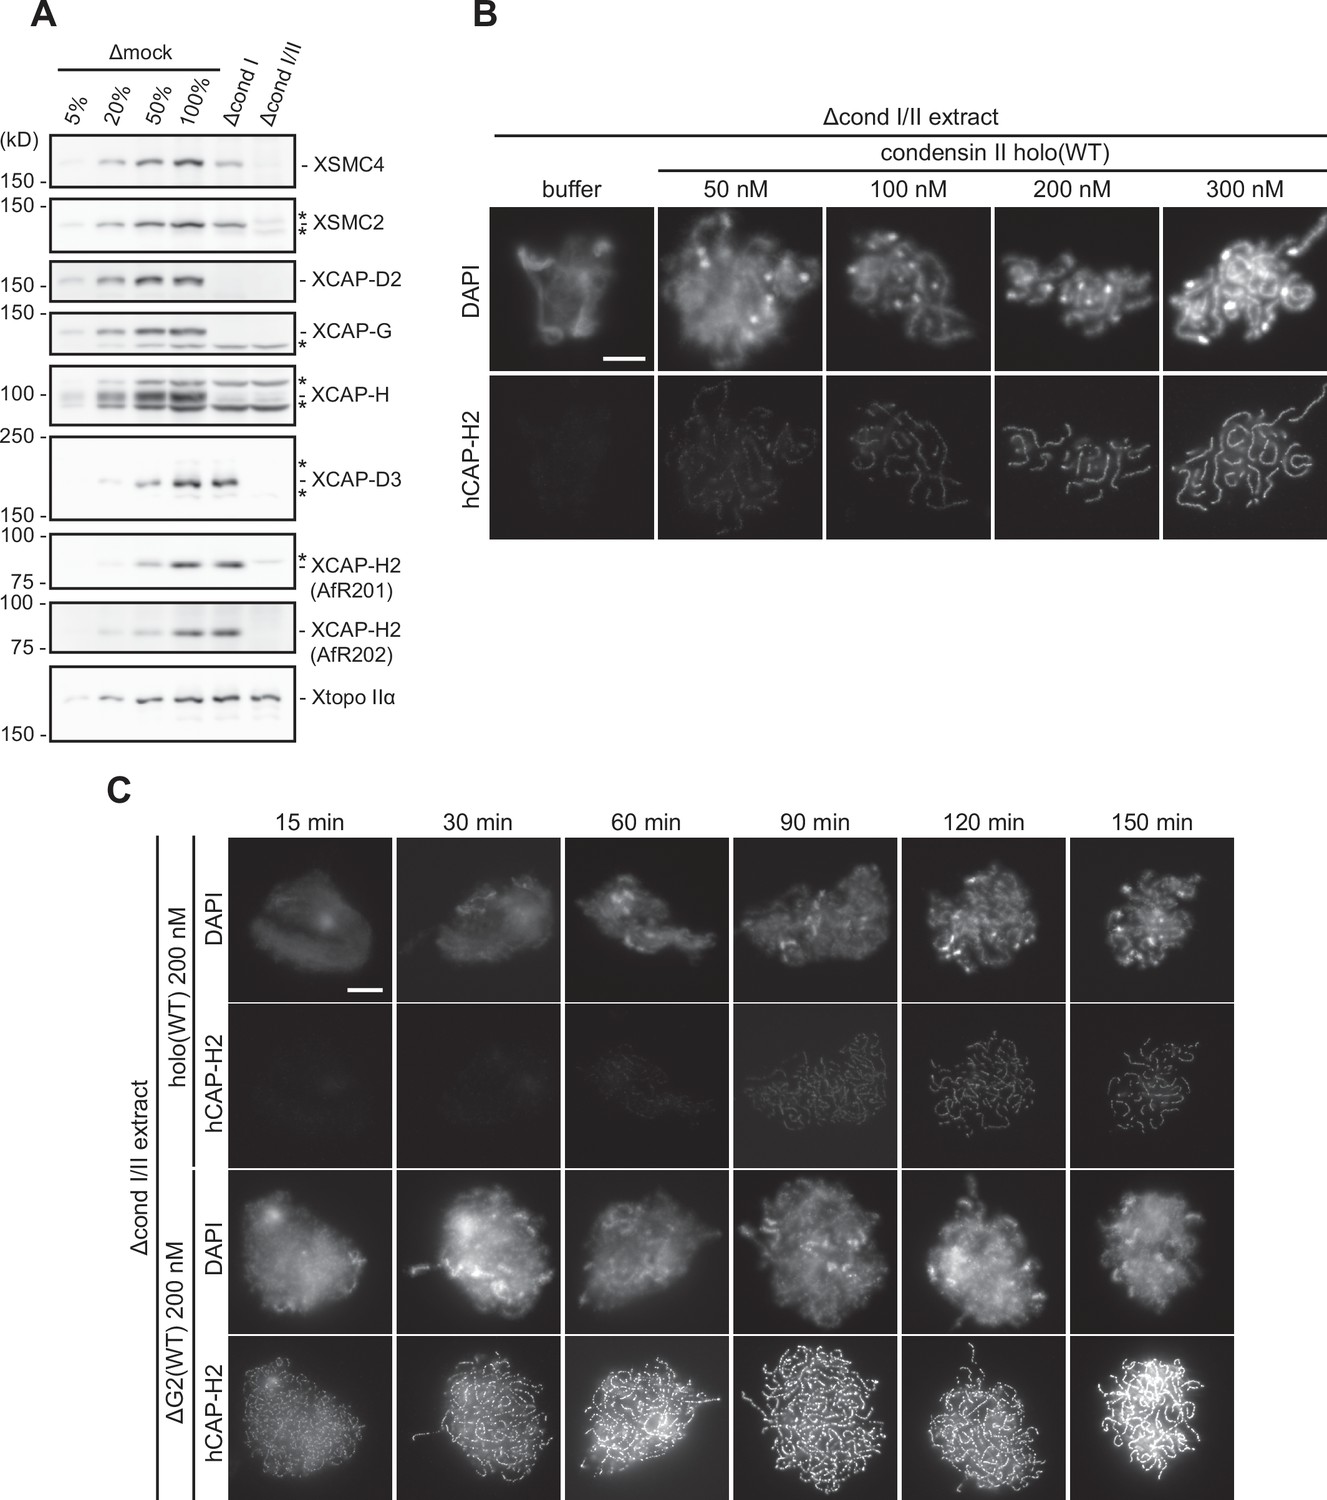
Immunodepletion of endogenous condensin complexes and basic characterization of recombinant condensin II complexes in Xenopus egg extracts.
(A) Xenopus egg extracts were immunodepleted with control IgG (Δmock), antibodies against endogenous condensin I subunit (Δcond I extract), or antibodies against both endogenous condensin I and II subunits (Δcond I/II extract). An aliquot of each immunodepleted extract was analyzed by immunoblotting with antibodies to estimate the efficiency of immunodepletion with decreasing amounts of Δmock extract (100, 50, 20, and 5%). Xenopus topoisomerase IIα (Xtopo IIα) acts as a loading control. Asterisks (*) indicate non-specific bands. Immunodepletion of Xenopus CAP-H2 (XCAP-H2) was evaluated with two different affinity-purified antibodies (AfR201 and AfR202) raised against the same antigen to confirm that the band migrating slightly slower than XCAP-H2 is a non-specific band cross-reacted only with AfR201 but not with AfR202. (B) Mouse sperm nuclei were incubated in Δcond I/II extracts supplemented with control buffer (buffer) or holo(WT) at increasing concentrations from 50 nM to 300 nM. After 150 min, reaction mixtures were fixed, labeled with anti-hCAP-H2 antibody, and stained by DAPI. Shown here is a representative image from over 15 chromosome clusters examined per condition. The change in chromosomal morphology from cloud to chenille-like chromosomes by recombinant mammalian condensin II holo(WT) is concentration-dependent. Scale bar, 10 µm. (C) Mouse sperm nuclei were incubated in Δcond I/II extracts supplemented with control buffer (buffer), holo(WT) at 200 nM or ΔG2(WT) at 200 nM. Reaction mixtures were fixed at 0, 15, 30, 60, 90, 120, and 150 min, and labeled with anti-hCAP-H2 antibody. DNA was counterstained by DAPI. Shown here is a representative image from over 15 chromosome clusters examined per condition. ΔG2(WT) accumulates on chromatin and induces its structural changes at much earlier time points than holo(WT). Scale bar, 10 µm. WT: wild-type.
-
Figure 2—figure supplement 1—source data 1
Raw data uncropped blots corresponding to Figure 2—figure supplement 1A.
- https://cdn.elifesciences.org/articles/78984/elife-78984-fig2-figsupp1-data1-v2.zip
Figure 3

The structural maintenance of chromosome (SMC) ATPase cycle is essential for condensin II function.
(A) Mouse sperm nuclei were incubated with Δcond I/II extracts that had been supplemented with condensin II holo(WT) and holo(SMC-TR) at 200 nM, or ΔG2(WT) and ΔG2(SMC-TR) at either 200 nM or 25 nM. After 150 min, reaction mixtures were fixed and labeled with anti-hCAP-H2 antibody. DNA was counterstained with DAPI. Shown here is a representative image from over 15 chromosome clusters examined per condition. The images of hCAP-H2 signal were first captured at a single exposure time (1/3 ×) and then increased digitally (1 ×) to visualize signals from chromosomes of complexes apart from ΔG2(WT) at 200 nM. Scale bar, 10 µm. (B) Signal intensities of hCAP-H2 from the experiment described in (A) were divided by DAPI intensities and the mean values were normalized relative to the value by holo(WT). The mean ± SD is shown (n=15 chromosome clusters). The p-values listed were assessed by two-tailed Welch’s t-test. A dataset from a single representative experiment out of two repeats is shown. (C) ATPase rates of recombinant condensin II holo(WT), ΔG2(WT), holo(SMC-TR), and ΔG2(SMC-TR) in the presence or absence of double-stranded DNA (dsDNA). The error bar represents the SD from three performed repeats. P values listed were assessed by two-tailed t-test. WT: wild-type.
-
Figure 3—source data 1
Microsoft excel of non-normalized data corresponding to Figure 3B.
- https://cdn.elifesciences.org/articles/78984/elife-78984-fig3-data1-v2.zip
-
Figure 3—source data 2
Microsoft excel of data corresponding to Figure 3C and Figure 4—figure supplement 1C.
- https://cdn.elifesciences.org/articles/78984/elife-78984-fig3-data2-v2.zip
Figure 4 with 3 supplements
The CAP-D3 C-tail negatively regulates condensin II-mediated chromosome assembly.
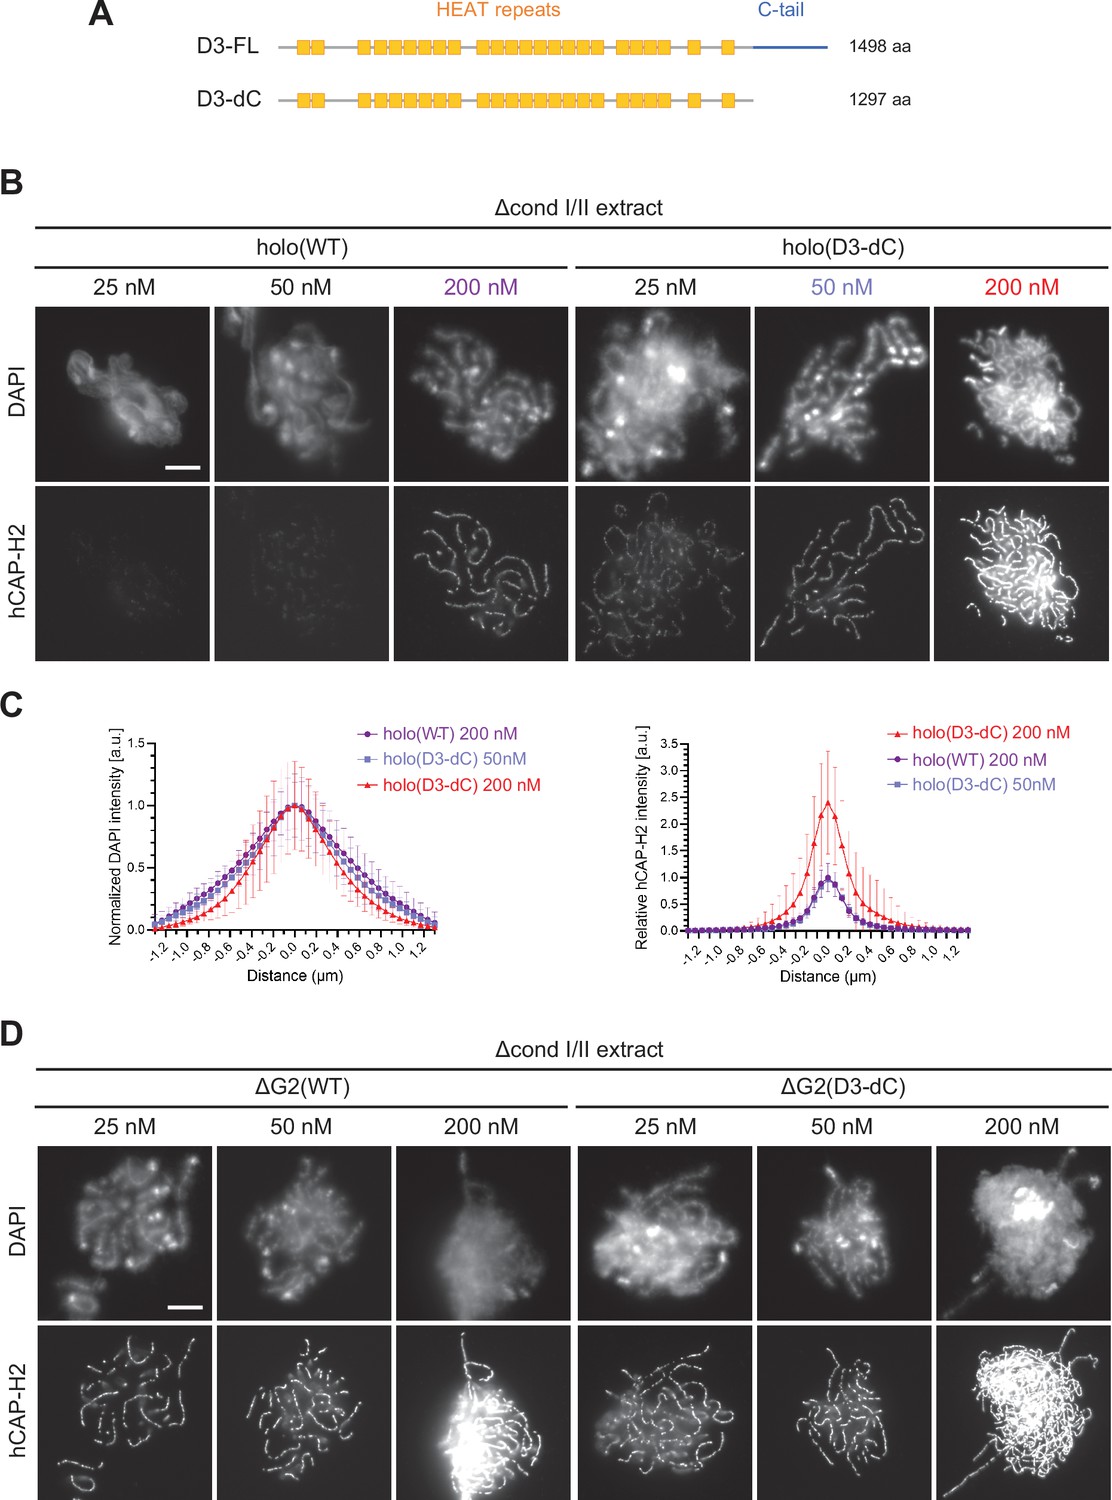
(A) A schematic diagram of the full-length hCAP-D3 (D3–FL) and hCAP-D3 lacking the C-terminal tail (D3–dC). (B) Mouse sperm nuclei were incubated in Δcond I/II extracts that had been supplemented with condensin II holo(WT) or holo(D3-dC) at either 25, 50, or 200 nM. After 150 min, reaction mixtures were fixed and labeled with anti-hCAP-H2 antibody. DNA was counterstained with DAPI. Shown here is a representative image from over 15 chromosome clusters examined per condition. Scale bar, 10 µm. (C) DAPI and hCAP-H2 intensities from the experiment described in (B) were measured along lines drawn perpendicular to chromosome axes to create line scan profiles for the width of chromosomes assembled in Δcond I/II extract with 200 nM holo(WT) or either 50 nM or 200 nM holo(D3-dC) (n=20 chromosomes). The mean and SD were normalized individually to the DAPI intensities (arbitrary unit [a.u.]) at the center of chromosome axes (distance = 0 μm) within each set. Intensities of hCAP-H2 were normalized relative to the central value by 200 nM holo(WT) addition. A dataset from a single representative experiment out of three repeats is shown. (D) Mouse sperm nuclei were incubated in Δcond I/II extracts that had been supplemented with condensin II ΔG2(WT) or ΔG2(D3-dC) at either 25, 50, or 200 nM in the same experiment as (B). After 150 min, reaction mixtures were fixed and labeled with anti-hCAP-H2 antibody. DNA was counterstained with DAPI. Shown here is a representative image from over 15 chromosome clusters examined per condition. Scale bar, 10 µm. WT: wild-type.
-
Figure 4—source data 1
Microsoft excel of non-normalized data of all conditions corresponding to Figure 4 and Figure 4—figure supplement 2.
- https://cdn.elifesciences.org/articles/78984/elife-78984-fig4-data1-v2.zip
Figure 4—figure supplement 1
Additional characterization of deletion of the CAP-D3 C-tail.
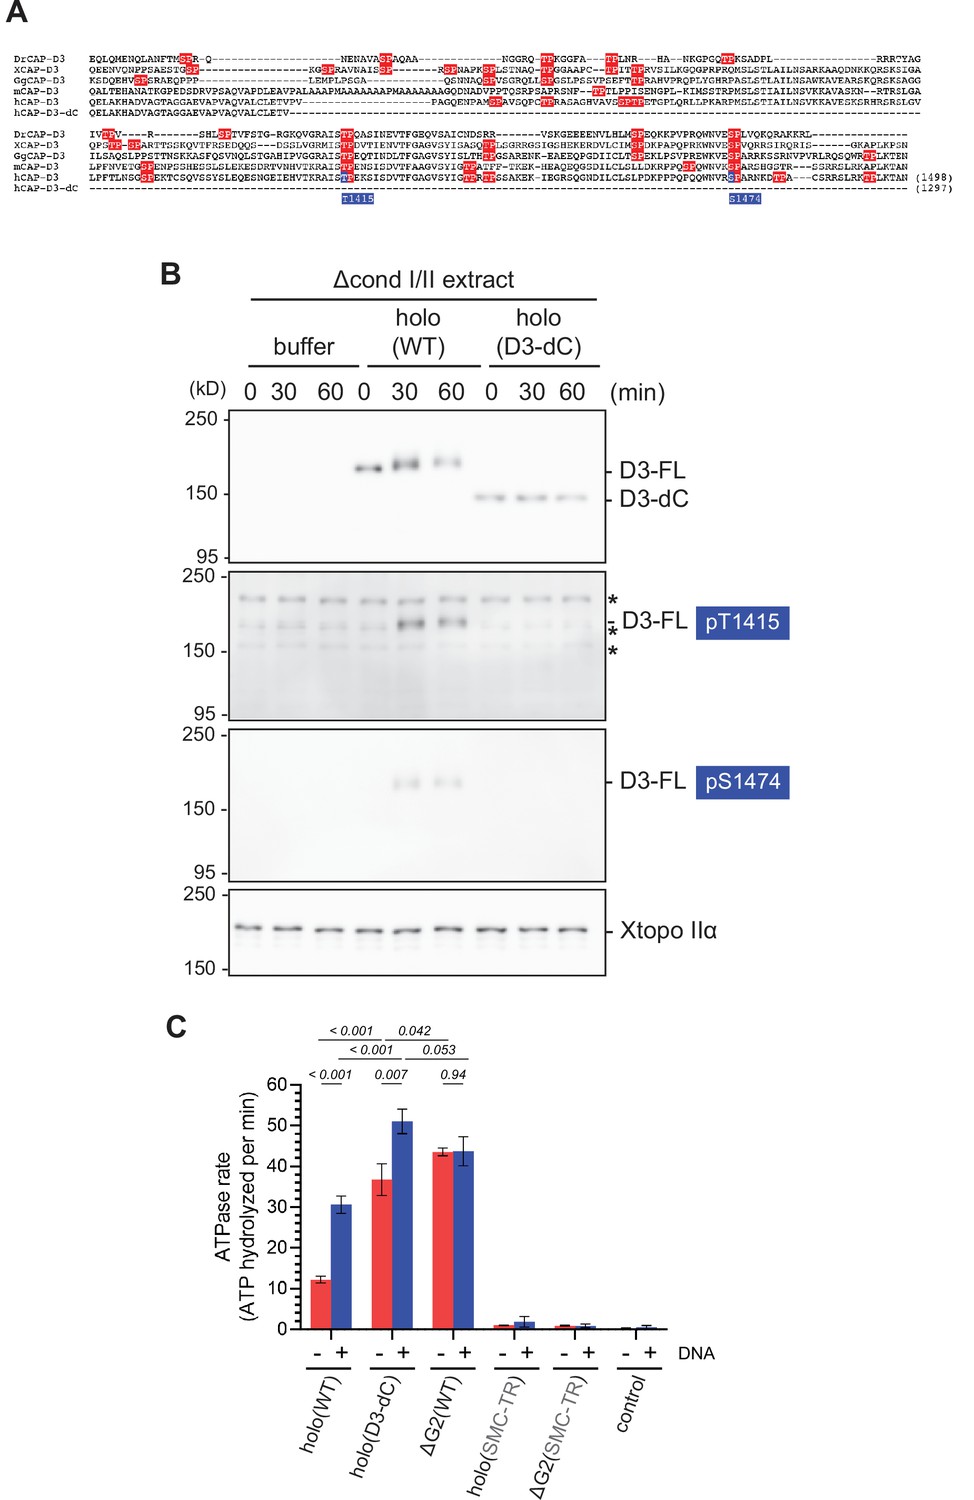
(A) Sequence alignment of the C-tail of the CAP-D3 orthologs from Danio rerio (DrCAP-D3), Xenopus laevis (XCAP-D3), Gallus (GgCAP-D3), Mus musculus (mCAP-D3) and human (hCAP-D3). Note that hCAP-D3-dC lacks the C-tail containing multiple potential CDK1 phosphorylation consensus sites (red), which include T1415 and S1474 (blue). (B) Xenopus egg extracts were immunodepleted with antibodies against both endogenous condensin I and II subunits (Δcond I/II extract). The extracts were supplemented with control buffer (buffer), holo(WT), or holo(D3-dC) without sperm nuclei. Aliquots were taken at the indicated time points and subjected to immunoblotting with the indicated antibodies, including anti-phospho-specific antibodies against hCAP-D3 pT1415 and pS1474. Xenopus topoisomerase IIα (Xtopo IIα) was used as a loading control. Asterisks (*) indicate non-specific bands. Note that full-length hCAP-D3 (D3–FL) migrated slower as incubation time increased, which is accompanied by phosphorylation at T1415 and S1474. In contrast, CAP-D3 lacking the C-tail (D3–dC) did not change in its mobility upon incubation. (C) ATPase rate of holo(D3-dC) was compared with that of holo(WT) and other mutant complexes in the absence or presence of double-stranded DNA (dsDNA). The error bar represents the SD from three repeats. The p-values listed were assessed by two-tailed t-test. Note that part of the data derived from the same set of experiments was shown in Figure 3C.
-
Figure 4—figure supplement 1—source data 1
Raw data uncropped blots corresponding to Figure 4—figure supplement 1.
- https://cdn.elifesciences.org/articles/78984/elife-78984-fig4-figsupp1-data1-v2.zip
Figure 4—figure supplement 2
Additional profiles of chromosomes assembled by holo(WT), holo(D3-dC), ΔG2(WT), and ΔG2(D3-dC) from the experiment described in Figure 4.
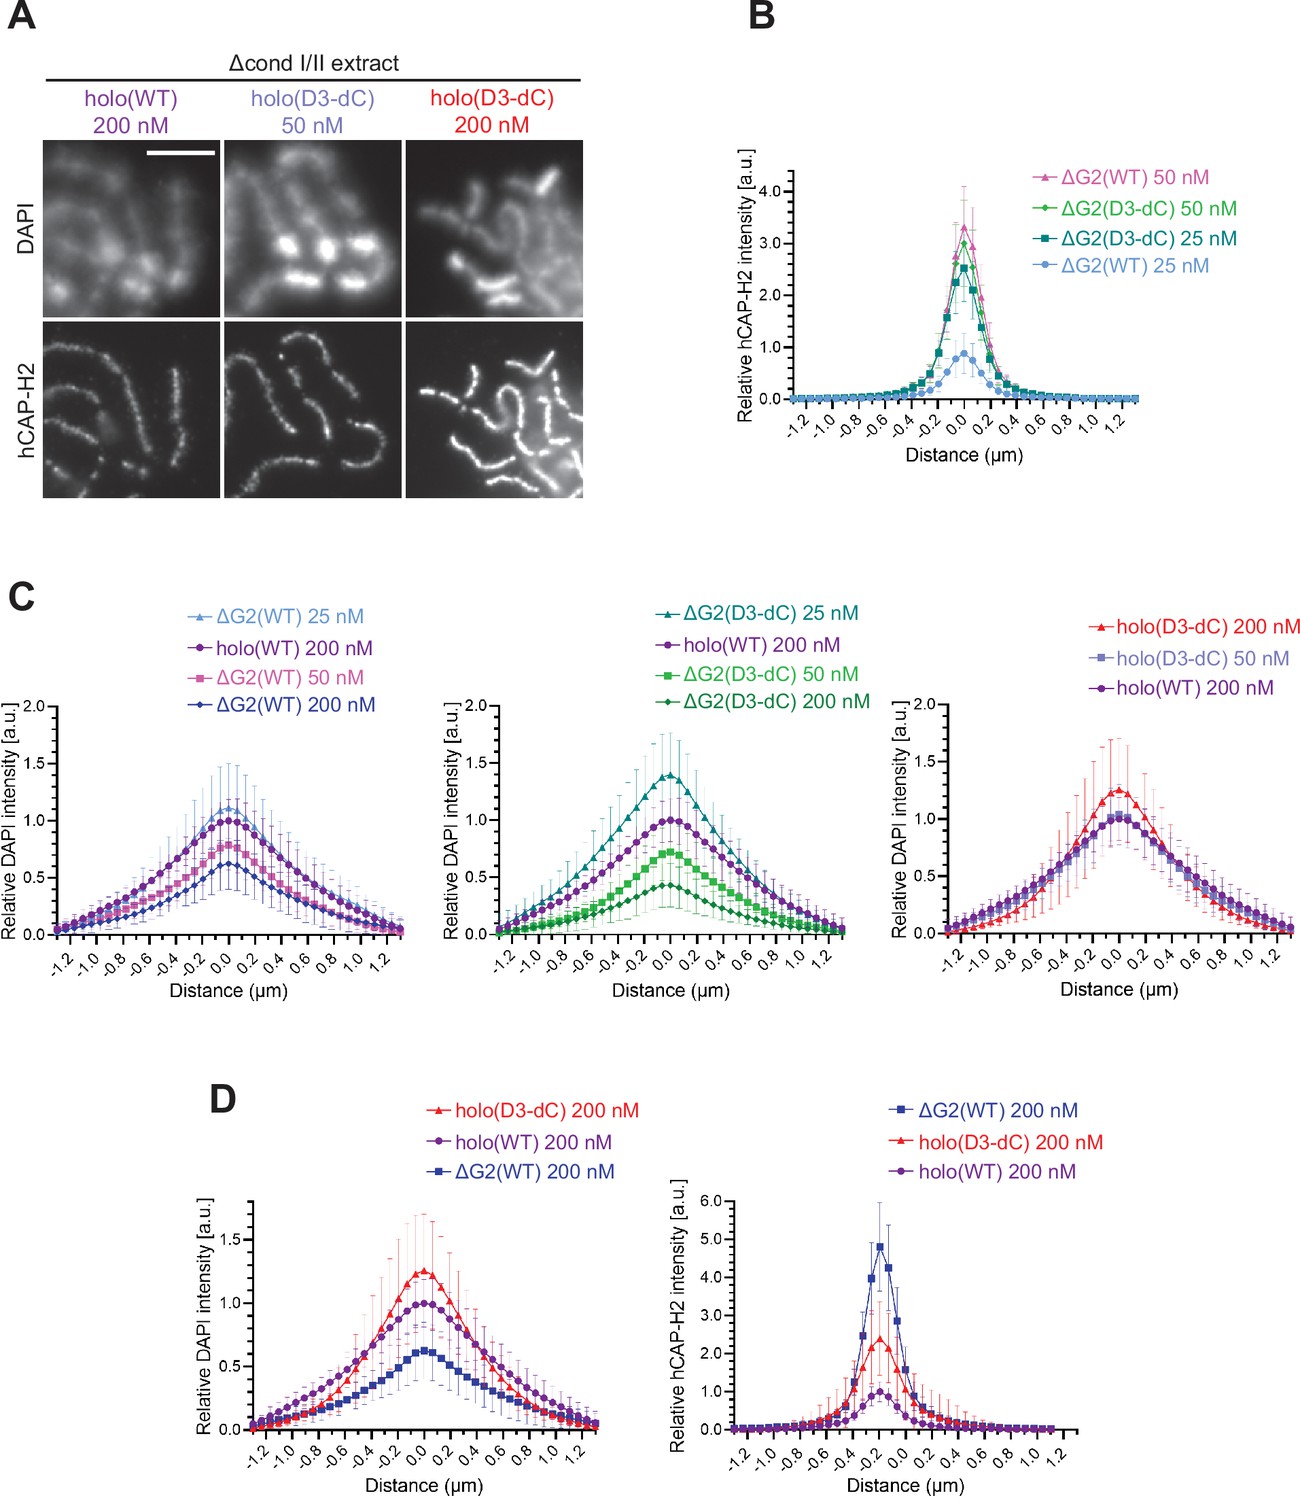
(A) Chromosomes assembled by holo(WT), holo(D3-dC), and holo(D3-dC) added at the concentrations indicated. Shown here are blowups of part of the images presented in Figure 4B. Scale bar, 5 µm. (B) to (D) Chromosomes were assembled in Δcond I/II extract that had been supplemented with holo(WT), holo(D3-dC), ΔG2(WT), or ΔG2(D3-dC) at three different concentrations as described in Figure 4B and D. DAPI and hCAP-H2 intensities were measured along lines drawn perpendicular to chromosome axes to create line scan profiles for the width of chromosomes. The dataset shown is from the same single representative experiment as Figure 4C out of three repeats (n=20 chromosomes). The mean and SD were normalized relative to the DAPI and hCAP-H2 intensities (arbitrary unit [a.u.]) at the center of chromosome axes (distance = 0 μm) formed by 200 nM holo(WT) addition. (B) Profiles of hCAP-H2 intensities for ΔG2(WT) and ΔG2(D3-dC) added at concentrations of 25 nM and 50 nM were compared. (C) Profiles of DAPI intensities for ΔG2(WT), ΔG2(D3-dC), and holo(D3-dC) added at different concentrations were compared to the profile for holo(WT) added at 200 nM. Note that DAPI intensities at the axial region decreased in a dose-dependent manner in the cases of ΔG2(WT) and ΔG2(D3-dC) addition, whereas they increase in the case of holo(D3-dC) addition. (D) Profiles of DAPI and hCAP-H2 intensities for holo(WT), holo(D3-dC), and ΔG2(WT) added at 200 nM were compared. WT: wild-type.
Figure 4—figure supplement 3
Deletion of the CAP-D2 C-tail in condensin I has little impact on chromosome assembly in Xenopus egg extracts.
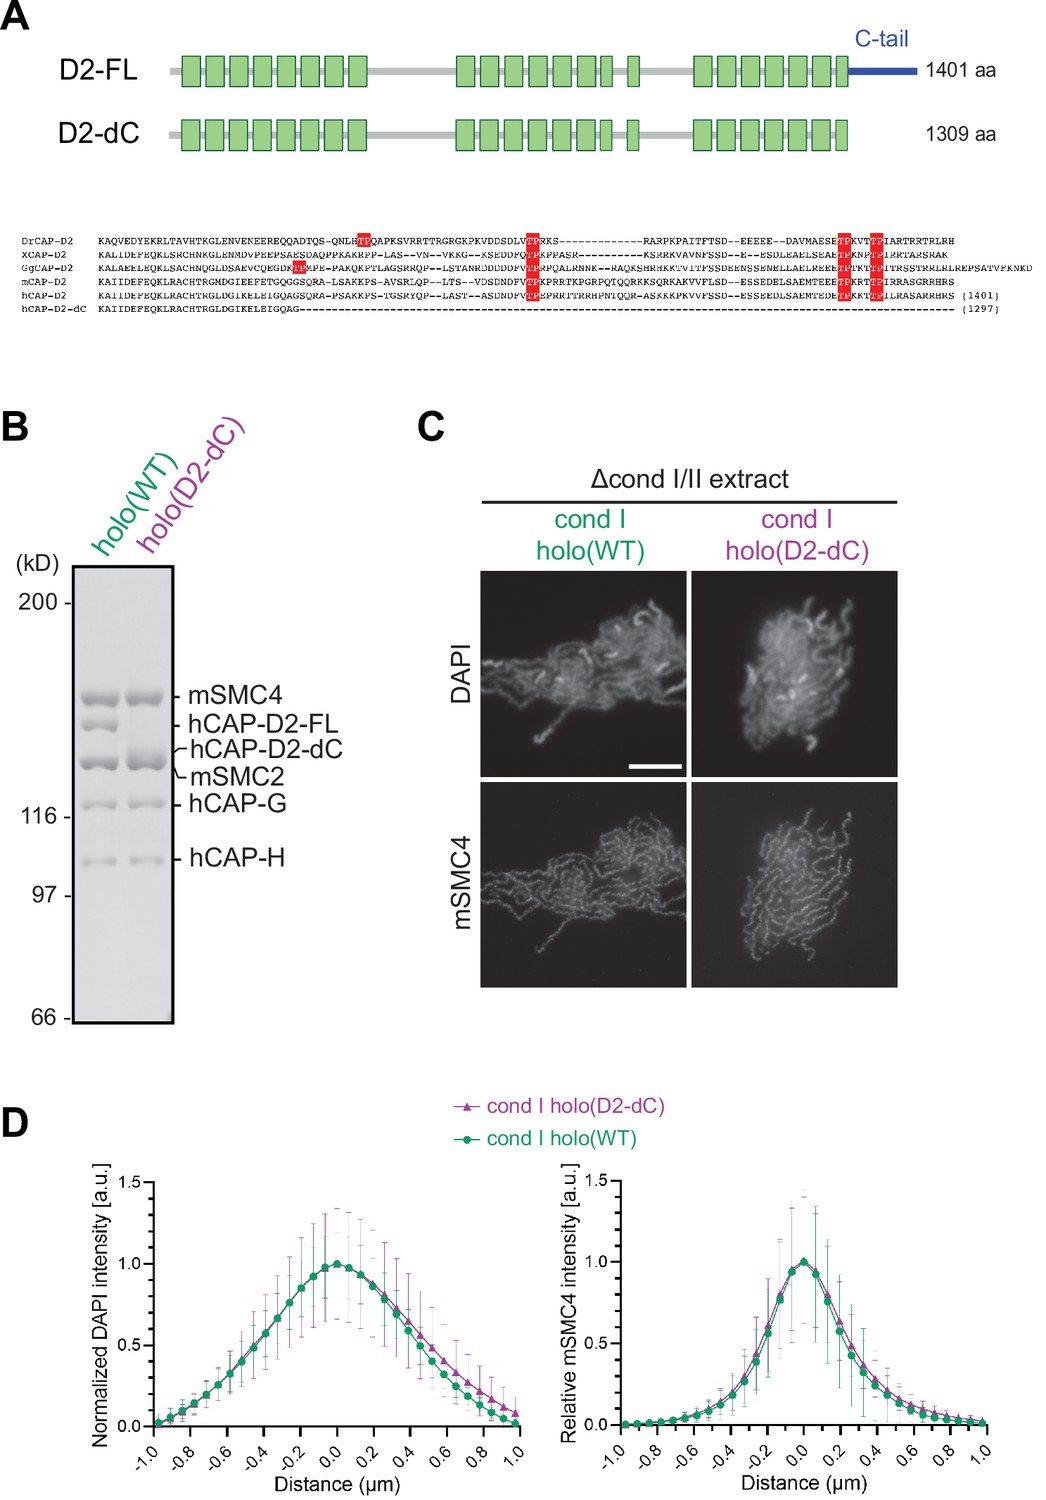
(A) A schematic diagram of the full-length hCAP-D2 (D2–FL) and hCAP-D2 lacking the C-terminal tail (D2–dC). (B) Recombinant condensin I holocomplexes containing either wild-type (WT) or C-tail truncated (D2–dC) version of hCAP-D2 were purified and subjected to SDS-PAGE. The gel was stained with Coomassie Brilliant Blue. (C) Mouse sperm nuclei were incubated in Δcond I/II extracts that had been supplemented with recombinant condensin I holo(WT) or holo(D2-dC) at 35 nM. After 150 min, reaction mixtures were fixed and labeled with anti-mSMC4 antibody. DNA was counterstained with DAPI. Shown here is a representative image from over 15 chromosome clusters examined per condition. Scale bar, 10 µm. (D) DAPI and mSMC4 intensities from the experiment described in (C) were measured along lines drawn perpendicular to chromosome axes to create line scan profiles for the width of chromosomes assembled in Δcond I/II extract with either recombinant condensin I holo(WT) or holo(D2-dC) at 35 nM (n=20 chromosomes). The mean and SD were normalized individually to the DAPI intensities (arbitrary unit [a.u.]) at the center of chromosome axes (distance = 0 μm) within each set. Intensities of mSMC4 were normalized relative to the central value by 35 nM condensin I holo(WT) addition. Deletion of the CAP-D2 C-tail showed little effect on the accumulation of condensin I on the axis and on the rod-shaped chromosome morphology compared to those by holo(WT). SMC, structural maintenance of chromosomes; WT: wild-type.
-
Figure 4—figure supplement 3—source data 1
Raw data uncropped gel corresponding to Figure 4—figure supplement 3B.
- https://cdn.elifesciences.org/articles/78984/elife-78984-fig4-figsupp3-data1-v2.zip
-
Figure 4—figure supplement 3—source data 2
Microsoft excel of non-normalized data corresponding to Figure 4—figure supplement 3D.
- https://cdn.elifesciences.org/articles/78984/elife-78984-fig4-figsupp3-data2-v2.zip
Figure 5 with 1 supplement
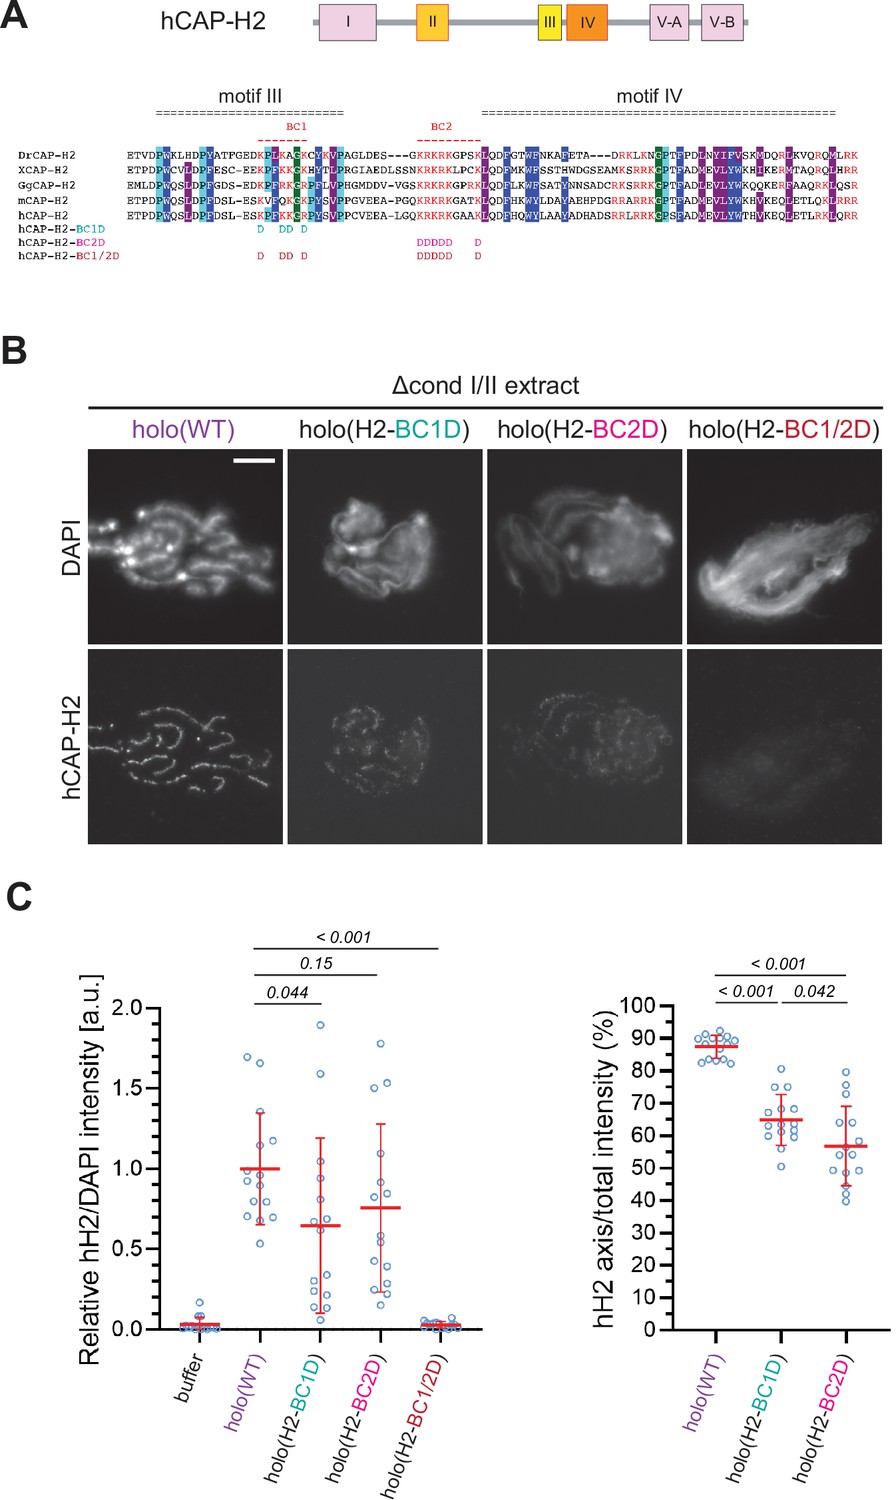
The basic amino acid clusters of CAP-H2 synergistically contribute to condensin II functions.
(A) A schematic diagram of domain organization of hCAP-H2. CAP-H2 has five motifs that are well conserved among vertebrate species (motifs I to V). Shown here is a sequence alignment of the CAP-H2 orthologs from Danio rerio (DrCAP-H2), Xenopus laevis (XCAP-H2), Gallus gallus (GgCAP-H2), Mus musculus (mCAP-H2) and human (hCAP-H2). Conserved residues are labeled in dark blue (Y/F/W), light blue (P) and gray (I/M/L*). Within the central region, two basic amino acid clusters (BC1 and BC2 shown in red). The BC1D and BC2D mutations were created by substituting all basic residues (K/R) conserved in BC1 and BC2, respectively, with aspartic acid residues (D). The BC1/2D mutations are a combination of the BC1D and BC2D mutations. (B) Mouse sperm nuclei were incubated with Δcond I/II extracts that had been supplemented with holo(WT), holo(H2-BC1D), holo(H2-BC2D) and holo(H2-BC1/2D) at 200 nM. After 150 min, reaction mixtures were fixed and labeled with anti-hCAP-H2 antibody. DNA was counterstained with DAPI. Shown here is a representative image from over 15 chromosome clusters examined per condition. Scale bar, 10 µm. (C) (Left) Signal intensities of hCAP-H2 from the experiment described in (B) were divided by DAPI intensities and the mean values were normalized relative to the values by holo(WT). (Right) Signal intensities of hCAP-H2 accumulated at the axes were divided by the overall hCAP-H2 intensities on the chromosomal DNA and the mean values were normalized to the value by holo(WT). The mean ± SD is shown (n=15 chromosome clusters). The p-values listed were assessed by two-tailed Welch’s t-test. A dataset from a single representative experiment out of two repeats is shown.
-
Figure 5—source data 1
Microsoft excel of non-normalized data corresponding to Figure 5C.
- https://cdn.elifesciences.org/articles/78984/elife-78984-fig5-data1-v2.zip
Figure 5—figure supplement 1
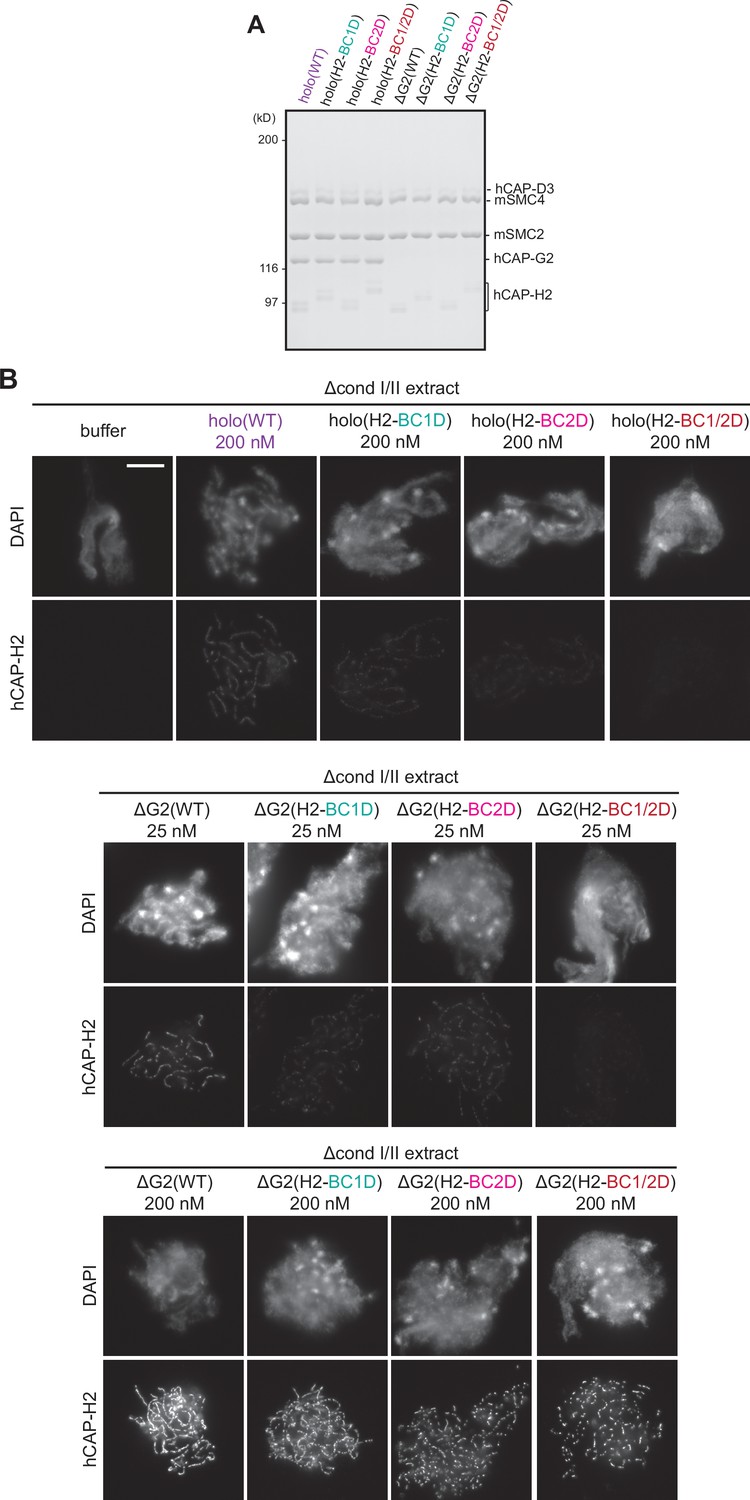
Deletion of CAP-G2 partially rescues mutations in the basic amino acid clusters of CAP-H2.
(A) Recombinant mammalian condensin II holocomplex (holo) and ΔG2 subcomplex harboring either wild-type (WT) or mutations in the H2 basic amino acid cluster (H2-BC1D, H2-BC2D, and H2-BC1/2D) were purified and subjected to SDS-PAGE. The gel was stained with Coomassie Brilliant Blue. (B) Mouse sperm nuclei were incubated in Δcond I/II extracts that had been supplemented with condensin II holocomplex (WT, H2-BC1D, H2-BC2D, or H2-BC1/2D) at 200 nM or ΔG2 subcomplexes (WT, H2-BC1D, H2-BC2D, and H2-BC1/2D) at either 25 or 200 nM. After incubation for 150 min, reactions were fixed and labeled with anti-hCAP-H2 antibody. DNA was counterstained with DAPI. Shown here is a representative image from over 15 chromosome clusters examined per condition. Scale bar, 10 µm. In samples with 200 nM addition, ΔG2 subcomplexes were overloaded on chromosomal axes but only ΔG2(WT) made longer, continuous axes while ΔG2 with H2 basic cluster mutations.
-
Figure 5—figure supplement 1—source data 1
Raw data uncropped gel corresponding to Figure 5—figure supplement 1.
- https://cdn.elifesciences.org/articles/78984/elife-78984-fig5-figsupp1-data1-v2.zip
Figure 6 with 1 supplement
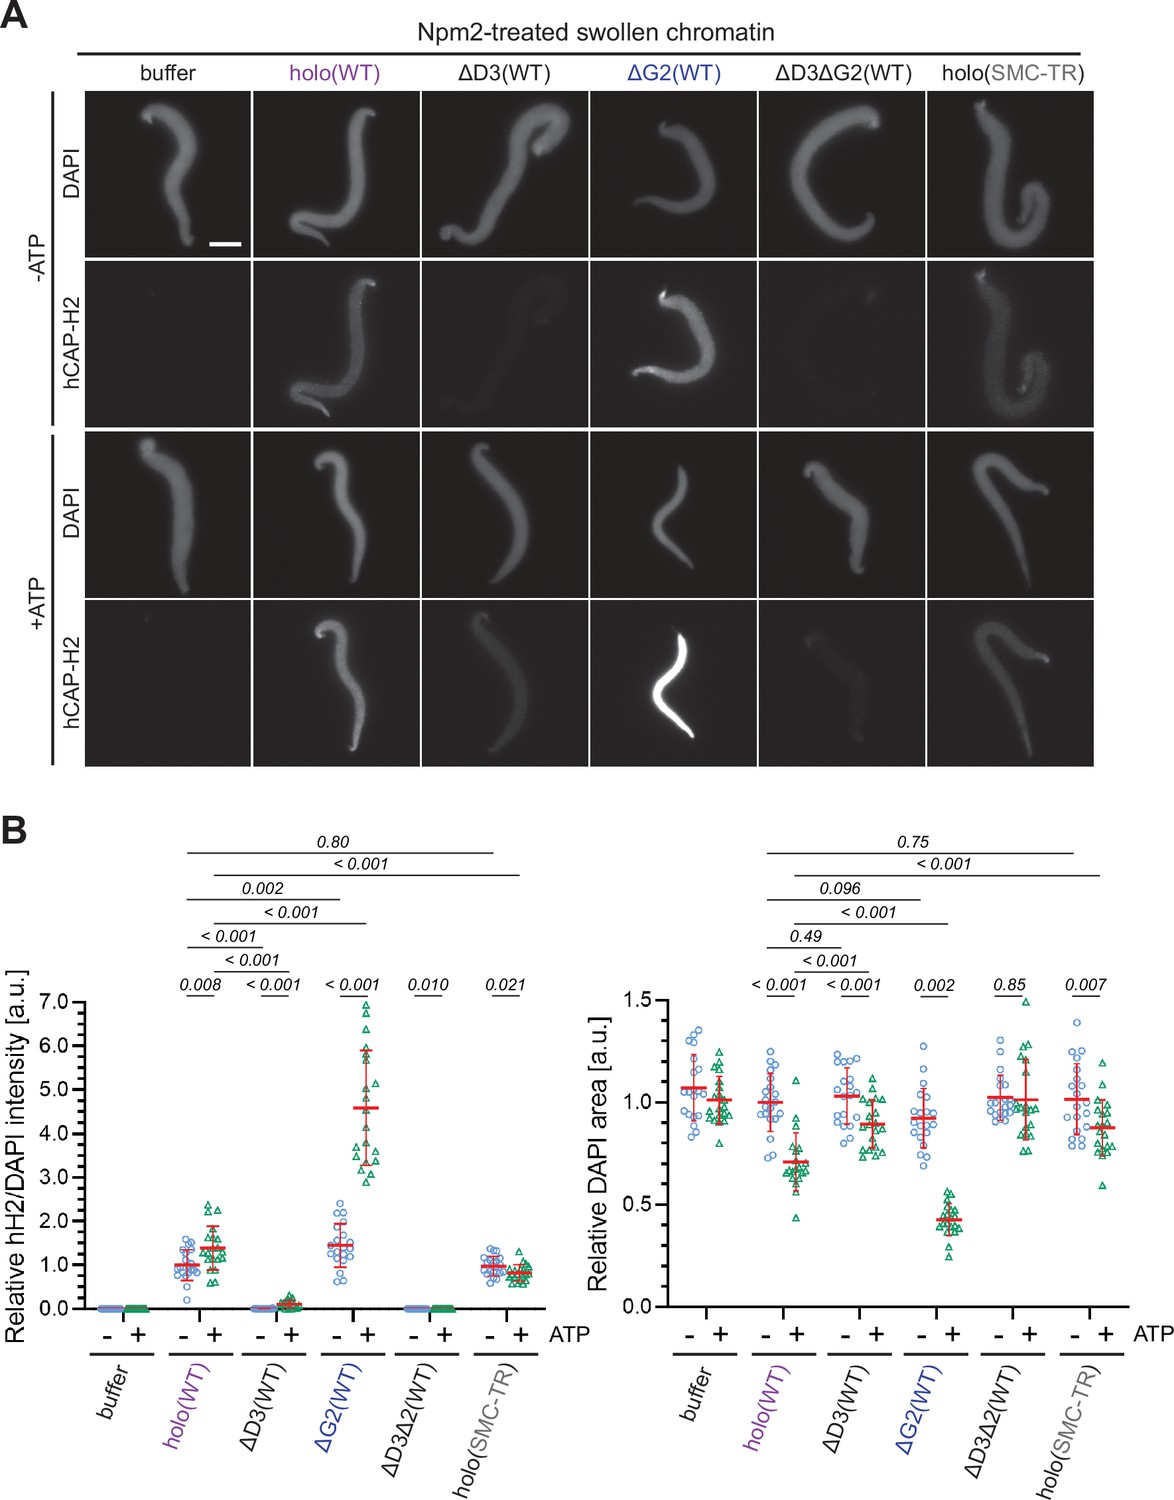
ATP-stimulated chromatin binding of condensin II can be recapitulated in an extract-free assay.
(A) Xenopus sperm nuclei were pre-incubated with a buffer containing recombinant nucleoplasmin (Npm2) in the absence or presence of ATP for 30 min, and then holo(WT), ΔG2(WT), ΔD3(WT), ΔD3ΔG2(WT), or holo(TR) was added at 50 nM. After 120 min, reaction mixtures were fixed and labeled with anti-mSMC4 antibody. DNA was counterstained with DAPI. Shown here is a representative image from over 20 nuclei examined per condition. Scale bar, 10 µm. (B) (Left) Signal intensities of hCAP-H2 were divided by DAPI intensities and the mean values were normalized relative to the values by holo(WT) without ATP addition (-ATP). (Right) Areas of DAPI signals were measured and the mean values were normalized to values by holo(WT) without ATP addition (-ATP). The mean ± SD is shown (n=20 sperm nuclei). The p-values listed were assessed by two-tailed Welch’s t-test. SMC, structural maintenance of chromosomes; WT: wild-type.
-
Figure 6—source data 1
Microsoft excel of non-normalized data corresponding to Figure 6B.
- https://cdn.elifesciences.org/articles/78984/elife-78984-fig6-data1-v2.zip
Figure 6—figure supplement 1
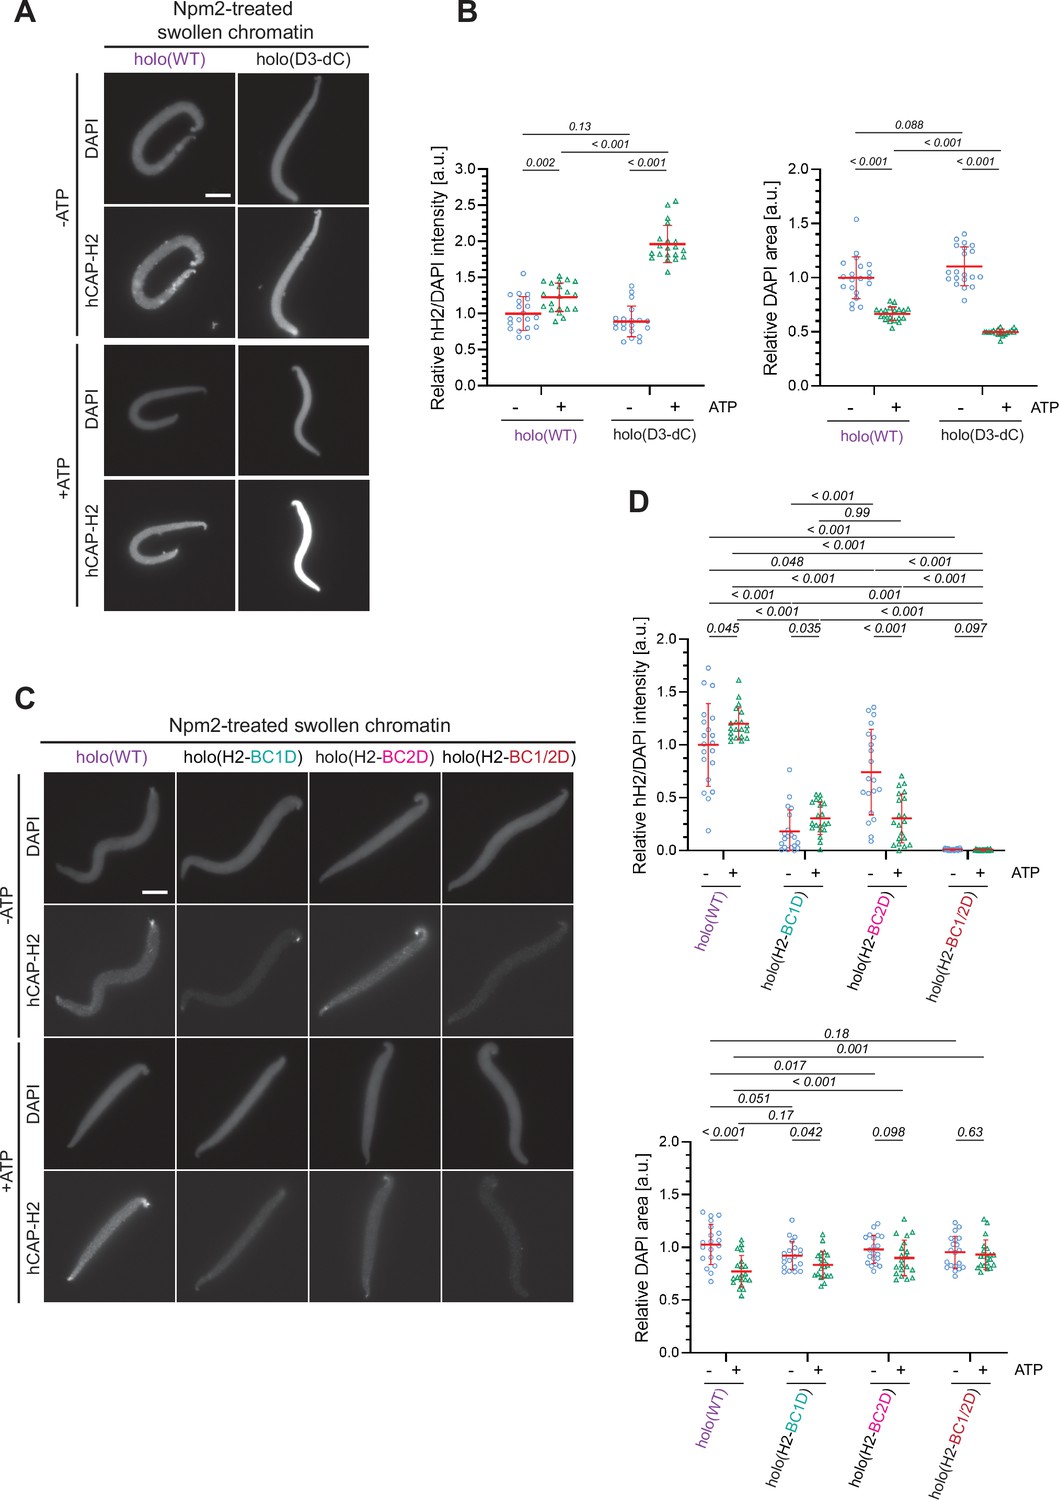
Characterization of holo(D3-dC) in an extract-free chromatin binding assay.
(A) Xenopus sperm nuclei were pre-incubated with a buffer containing recombinant nucleoplasmin (Npm2) in the absence or presence of ATP for 30 min, and then holo(WT) or holo(D3-dC) was added at 50 nM. After 120 min, reaction mixtures were fixed and labeled with anti-mSMC4 antibody. DNA was counterstained with DAPI. Shown here is a representative image from over 20 nuclei examined per condition. Scale bar, 10 µm. (B) (Left) Signal intensities of hCAP-H2 from the experiment described in (A) were divided by DAPI intensities and the mean values were normalized to values by holo(WT) without ATP addition (-ATP). (Right) Areas of DAPI signals were measured and the mean values were normalized relative to the values by holo(WT) without ATP addition (-ATP). The mean ± SD is shown (n=20 sperm nuclei). P values listed were assessed by two-tailed Welch’s t-test. (C) Xenopus sperm nuclei were pre-incubated with a buffer containing recombinant nucleoplasmin (Npm2) in the absence or presence of ATP for 30 min, and then holo(WT) or a holocomplex harboring either H2-BC1D, H2-BC2D, or H2-BC1/2D mutations was added at 50 nM. After 120 min, reaction mixtures were fixed and labeled with anti-mSMC4 antibody. DNA was counterstained with DAPI. Shown here is a representative image from over 20 nuclei examined per condition. Scale bar, 10 µm. (D) (Left) Signal intensities of hCAP-H2 from the experiment described in (C) were divided by DAPI intensities and the mean values were normalized to the values by holo(WT) without ATP addition (-ATP). (Right) Areas of DAPI signals were measured and the mean values were normalized relative to the values by holo(WT) without ATP addition (-ATP). The mean ± SD is shown (n=20 sperm nuclei). P values listed were assessed by two-tailed Welch’s t-test. SMC, structural maintenance of chromosomes; WT: wild-type.
-
Figure 6—figure supplement 1—source data 1
Microsoft excel of non-normalized data corresponding to Figure 6—figure supplement 1B.
- https://cdn.elifesciences.org/articles/78984/elife-78984-fig6-figsupp1-data1-v2.zip
-
Figure 6—figure supplement 1—source data 2
Microsoft excel of non-normalized data corresponding to Figure 6—figure supplement 1D.
- https://cdn.elifesciences.org/articles/78984/elife-78984-fig6-figsupp1-data2-v2.zip
Figure 7
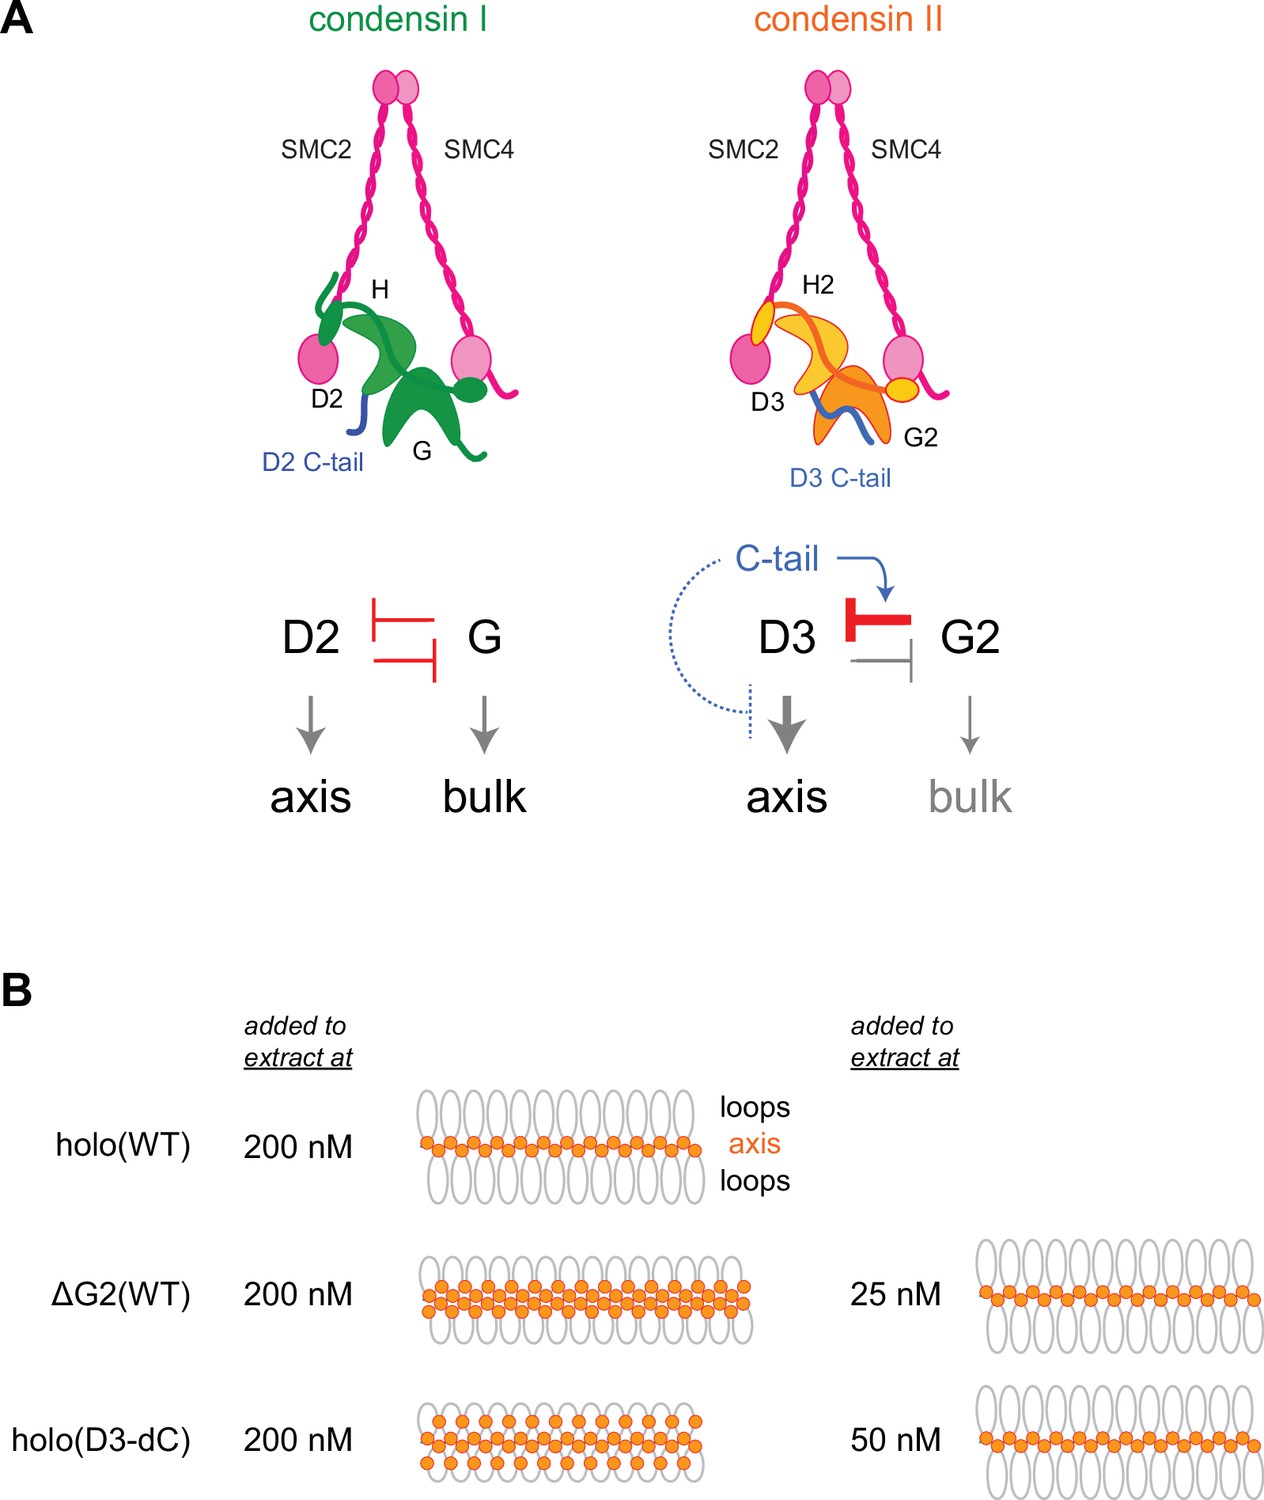
Model of condensin II regulation.
(A) Comparison between condensin I and condensin II. In condensin I, the two HEAT subunits, CAP-D2 and CAP-G, contribute to axis assembly and bulk loading, respectively, and their balancing acts regulate proper chromosome assembly. In condensin II, although CAP-D3 and CAP-G2 contribute to axis assembly and bulk loading, respectively, their balancing acts are modified differently from condensin I: CAP-D3’s role in axis assembly is dominant over CAP-G2’s role in bulk loading, whereas CAP-G2’s function to negatively regulate CAP-D3’s function is prominent (bar-headed arrow shown in red). The CAP-D3 C-tail could negatively regulate CAP-D3’s action through CAP-G2-dependent (blue arrow shown in blue) and CAP-G2-independent mechanisms (bar-headed arrow shown in blue). (B) A schematic representation of the chromosome morphologies formed by holo(WT), ΔG2(WT), and holo(D3-dC) in Xenopus egg extracts. Holo(WT) added at 200 nM localizes at the axis and forms chenille-like chromosomes with large loops. ΔG2(WT) and holo(D3-dC) form similar chenille-like chromosomes at lower doses (at 25 nM and 50 nM, respectively). At 200 nM, ΔG2(WT) greatly accumulates at the axis and elongates the axis while keeping the chenille-like morphology. In contrast, holo(D3-dC), when added at 200 nM, also associates with non-axial regions to support lateral compaction, resulting in the formation of a rod-like chromosome.
Author response image 1
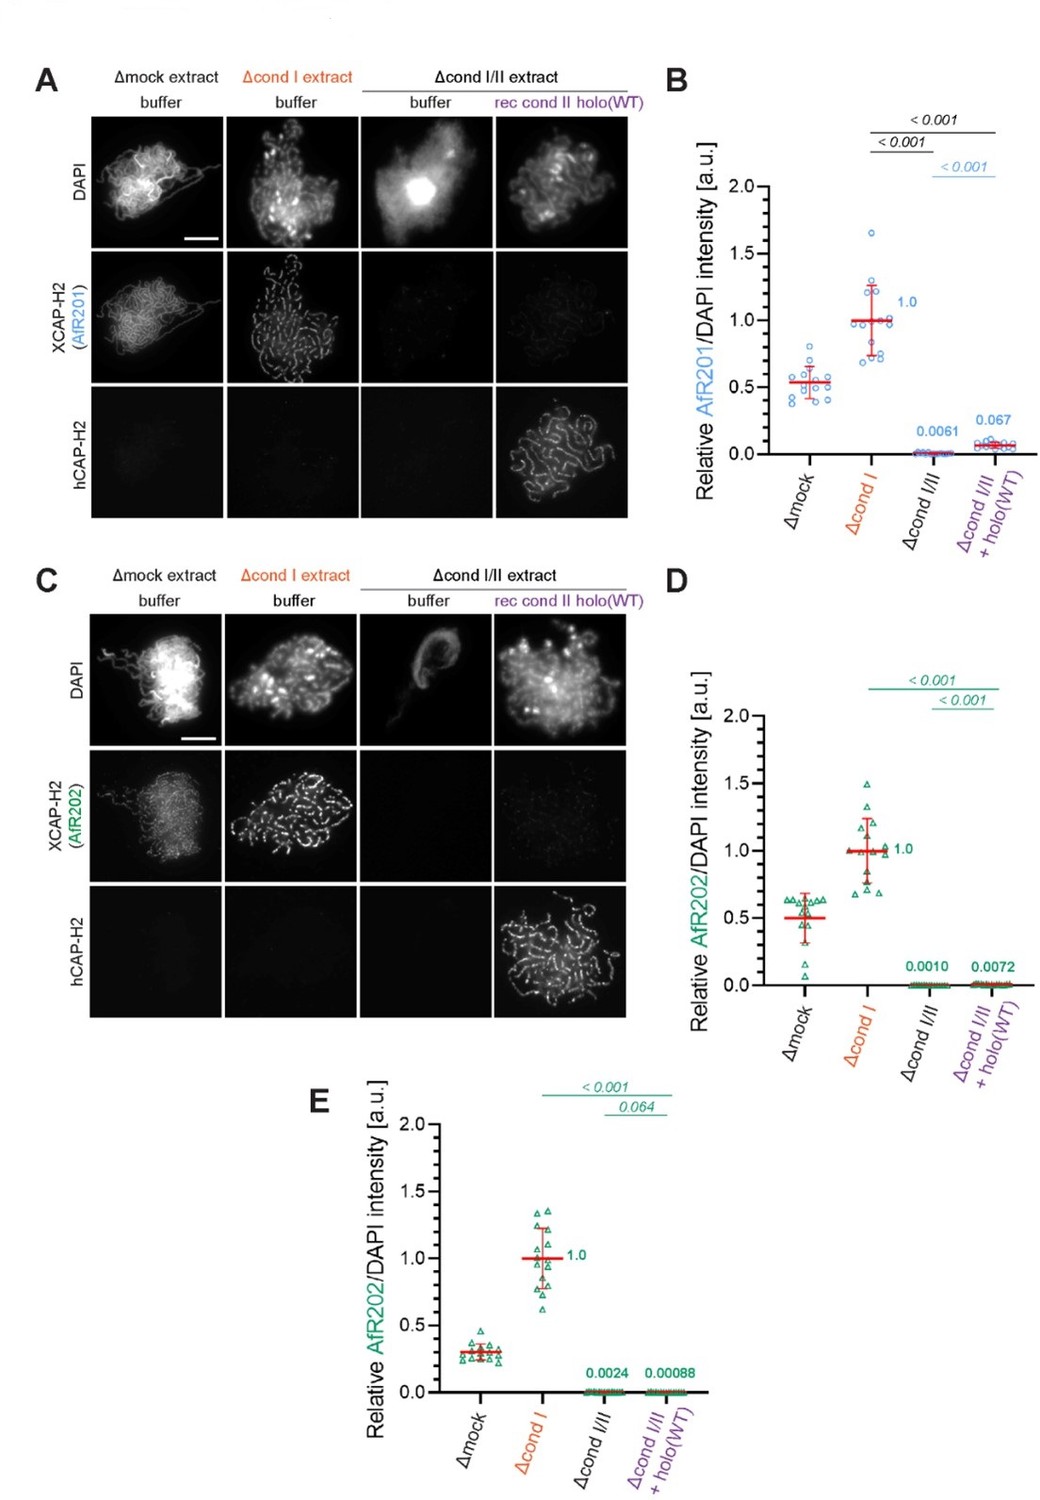
Evidence that the faint immunofluorescence signal detected as XCAP-H2 on chenille-like chromosomes formed in the Δcond I/II +holo(WT) extract is an artifact.
(A) Double labeling of chromatin/chromosomes with antibodies against XCAP-H2 (AfR201) and hCAP-H2. This panel was presented in Figure 1B in the original manuscript. (B) From the double-labeling experiment described in (A), signal intensities of XCAP-H2 were divided by DAPI signal intensities, and the mean values were normalized relatively to the value by Δcond I extract. The mean ± SD is shown (n = 15 chromosome clusters). Mean values were listed in bold. P values listed were assessed by two-tailed Welch’s t-test. (C) The double-labeling experiment was repeated using antibodies against XCAP-H2 (AfR202) and hCAP-H2. (D) From the double-labeling experiment described in (C), signal intensities of XCAP-H2 were divided by DAPI signal intensities and plotted as above. (E) From the single-labeling experiment shown in the revised Figure 1B, signal intensities of XCAP-H2 were divided by DAPI signal intensities and plotted as above.
Tables
Key resources table
| Reagent type (species) or resource | Designation | Source or reference | Identifiers | Additional information |
|---|---|---|---|---|
| Cell line (Spodoptera frugiperda) | Sf9 insect cells | ThermoFisher | 11496015 | |
| Cell line (Spodoptera frugiperda) | High five insect cells | ThermoFisher | B85502 | |
| Strain, strain background (Escherichia coli) | Max efficiency DH10Bac competent cells | ThermoFisher | 10361012 | |
| Strain, strain background (Escherichia coli) | BL21(DE3) competent cells | with lab cultured cells | N/A | Electrocompetent cells |
| Biological sample (Xenopus laevis) | Xenopus laevis egg | Hamamatsu Seibutsu-Kyozai | RRID: NXR 0.031 | Female, adult frogs |
| Biological sample (Xenopus laevis) | Xenopus laevis sperm nuclei | Hamamatsu Seibutsu-Kyozai | RRID: NXR 0.031 | Male, adult frogs |
| Biological sample (Mus musculus) | Mus musculus sperm nuclei | Shintomi et al., 2017; isolated from Mus musculus cauda epididymis (BALB/c×C57BL/6 J)F1 | N/A | Male, adult mouse |
| Antibody | anti-Xenopus topoisomerase IIα (rabbit polyclonal serum) | Hirano and Mitchison, 1994 | in house: αC1-6 | WB (1/2000) |
| Antibody | anti-XCAP-D2 (rabbit polyclonal) | Hirano et al., 1997 | in house: AfR16L | WB (1.0 μg/mL) |
| Antibody | anti-XCAP-G (rabbit polyclonal) | Hirano et al., 1997 | in house: AfR11-3L | WB (1.0 μg/mL) |
| Antibody | anti-XCAP-H (rabbit polyclonal) | Hirano et al., 1997 | in house: AfR18 | WB (0.7 μg/mL) |
| Antibody | anti-XSMC2/XCAP-E (rabbit polyclonal) | Hirano et al., 1997 | in house: AfR9-6 | WB (1.0 μg/mL) |
| Antibody | anti-XSMC4/XCAP-C (rabbit polyclonal) | Hirano et al., 1997 | in house: AfR8L | WB (2.0 μg/mL) |
| Antibody | anti-mSMC4 (rabbit polyclonal) | Lee et al., 2011 | in house: AfR326-3L | IF (1.0 μg/mL) |
| Antibody | anti-hCAP-H2 (rabbit polyclonal) | Ono et al., 2003 | in house: AfR205-4L | WB (0.8 μg/mL); IF (3.0 μg/mL) |
| Antibody | anti-XCAP-D3 (rabbit polyclonal) | Ono et al., 2003 | in house: AfR196-2L | WB (2.0 μg/mL) |
| Antibody | anti-XCAP-H2 (rabbit polyclonal) | Ono et al., 2003 | in house: AfR201-4 | WB (2.0 μg/mL) |
| Antibody | anti-XCAP-H2 (rabbit polyclonal) | Ono et al., 2003 | in house: AfR202-2 | From the same antigen for AfR201; WB (2.0 μg/mL); IF (3.0 μg/mL) |
| Antibody | anti-hCAP-D3 (rabbit polyclonal) | ProteinTech Group | 16828–1-AP; RRID: AB_2282528 | WB (1.0 μg/mL) |
| Antibody | Alexa Fluor 568-conjugated anti-rabbit IgG (goat polyclonal) | ThermoFisher | A11036; RRID: AB_10563566 | IF (1/500) |
| Antibody | anti-hCAP-D3 pS1474 (rabbit polyclonal) | This paper; custom ordered from SIGMA Genosys | in house: AfR358-3P2 | WB (1.0 μg/mL); refer to “Antibodies” subsection |
| Antibody | anti-hCAP-D3 pT1415 (rabbit polyclonal) | This paper; custom ordered from SIGMA Genosys | in house: AfR364-3P2 | WB (1.0 μg/mL); refer to “Antibodies” subsection |
| Antibody | horseradish peroxidase-conjugated anti-rabbit IgG (goat polyclonal) | Vector Laboratories | PI-1000; RRID: AB_2336198 | WB (1/20000) |
| Recombinant DNA reagent | λ DNA | TaKara | 3010 | Used in ATPase assay |
| Sequence-based reagent | hCAP-D3 STOP-to-Glycine forward primer | This paper | N/A | ggccgcgactagttccgttggcagtcttgag |
| Sequence-based reagent | hCAP-D3 STOP-to-Glycine reverse primer | This paper | N/A | ctcaagactgccaacggaactagtcgcggcc |
| Sequence-based reagent | (3 C)-StrepII SpeI/NotI forward oligo | This paper | N/A | ctagtggactggaagttctgttccaggggcccggatcttggagccatccgcaatttgaaaaaggt ggcggttccggcggaggtagcggcggaggttcttggtctcaccctcagttcgagaagtaagc |
| Sequence-based reagent | (3 C)-StrepII SpeI/NotI reverse oligo | This paper | N/A | ggccgcttacttctcgaactgagggtgagaccaagaacctccgccgctacctccgccggaacc gccacctttttcaaattgcggatggctccaagatccgggcccctggaacagaacttccagtcca |
| Sequence-based reagent | StrepII-(3 C) BamHI/EcoRI forward oligo | This paper | N/A | gatccatgtggagccatccgcaatttgaaaaaggtggaggctccggcggaggtagcggcggaggttcttgg tctcaccctcagttcgagaagggaggcggatcactggaagttctgttccaggggcccgggg |
| Sequence-based reagent | StrepII-(3 C) BamHI/EcoRI reverse oligo | This paper | N/A | aattccccgggcccctggaacagaacttccagtgatccgcctcccttctcgaactgagggtgagaccaag aacctccgccgctacctccgccggagcctccacctttttcaaattgcggatggctccacatg |
| Peptide, recombinant protein | Precission Protease | Cytiva | 27-0843-01 | Used in purification of condensins |
| Peptide, recombinant protein | λ protein phosphatase | NEB | P0753 | |
| Peptide, recombinant protein | Benzonase | Novagen | 71205-3CN | Used in purification of condensins |
| Peptide, recombinant protein | BamHI restriction enzyme | TaKaRa | 1010 | |
| Peptide, recombinant protein | EcoRI restriction enzyme | TaKaRa | 1040 | |
| Peptide, recombinant protein | NotI restriction enzyme | TaKaRa | 1166 | |
| Peptide, recombinant protein | SpeI restriction enzyme | TaKaRa | 1086 | |
| Peptide, recombinant protein | T4 polynucleotide kinase | TaKaRa | 2021 | |
| Commercial assay or kit | QuikChange II XL Site-Directed Mutagenesis Kit | Agilent Technologies | 200522 | |
| Commercial assay or kit | DNA Ligation Kit | TaKaRa | 6022 | |
| Commercial assay or kit | EnzChek Phosphate Assay Kit | ThermoFisher | E6646 | |
| Software, algorithm | UNICORN 7 | Cytiva | N/A | |
| Software, algorithm | Prism 8 | GraphPad | N/A | |
| Software, algorithm | Excel | Microsoft | N/A | |
| Software, algorithm | Olympus cellSens Dimensions | Olympus | N/A | |
| Software, algorithm | Photoshop | Adobe | N/A | |
| Software, algorithm | ImageJ | Schneider et al., 2012 | https://imagej.nih.gov/ij/ | |
| Software, algorithm | SparkControl | Tecan Life Sciences | N/A | |
| Other | Coomassie Brilliant Blue R-250 staining solution | Bio-Rad | 1610436 | For polyacrylamide gels |
| Other | Amersham Protran Premium 0.45 nitrocellulose membrane | Cytiva | 10600047 | For Western blots |
| Other | Glutathione Sepharose 4B | Cytiva | 17075601 | Used for purification of condensin I |
| Other | HiTrap Q HP 1 mL | Cytiva | 17115301 | Used for purification of condensins |
| Other | StrepTactin Sepharose HP | Cytiva | 28-9355-99 | Used for purification of condensin II |
| Other | DAPI | Roche | 10236276001 | (2 μg/mL) |
| Other | ATP | Sigma-Aldrich | A2383 | Used in ATPase assay and Npm2-treated chromatin binding assay |
| Other | Dynabeads Protein A | ThermoFisher | 10002D | For immunodepletion with Xenopus egg extract |
| Other | Alexa Flour 488-conjugated streptavidin | ThermoFisher | S32354 | IF (1/2000) |
-
SMC: structural maintenance of chromosomes.
Additional files
Download links
A two-part list of links to download the article, or parts of the article, in various formats.
Downloads (link to download the article as PDF)
Open citations (links to open the citations from this article in various online reference manager services)
Cite this article (links to download the citations from this article in formats compatible with various reference manager tools)
Molecular dissection of condensin II-mediated chromosome assembly using in vitro assays
eLife 11:e78984.
https://doi.org/10.7554/eLife.78984


