Selective endocytosis controls slit diaphragm maintenance and dynamics in Drosophila nephrocytes
- Renal Division, Department of Medicine, Faculty of Medicine and Medical Center - University of Freiburg, Germany
- CIBSS – Centre for Integrative Biological Signalling Studies, Germany
- Lineberger Comprehensive Cancer Center, University of North Carolina at Chapel Hill, United States
- Department of Medicine, Division of Nephrology and Hypertension, University of North Carolina at Chapel Hill, United States
Figures
Figure 1 with 1 supplement

Slit diaphragms proteins form a stable architecture that is re-established upon disruption.
(A) Schematic illustrating the nephrocyte ultrastructure and function (surface detail). Molecules destined for removal (shown as green hexagons) pass a bi-layered filtration barrier before being subject to endocytosis within membrane invaginations. (B) The schematic (upper section) illustrates the slit diaphragm after knock-in of GFP into the nephrin locus. The transmission electron microscopy image (middle section) shows a surface detail of a nephrocyte expressing nephrin-GFP homozygously with regular slit diaphragms. Confocal images (lower section) of a nephrin-GFP nephrocyte show colocalization with endogenous Neph1 (Kirre) in cross-sectional (upper row) and tangential sections (lower row). (C–D’’) Snapshots from a movie obtained by live-cell imaging reveal a stable slit diaphragm pattern in the tangential section (C–C’’). This is confirmed by cross-sectional analysis in the same genotype (D–D’’) where no vesicles for bulk transport of nephrin are observed. (E–F’’) Confocal images of tangential section of nephrocytes stained for slit diaphragm proteins while silencing of fly nephrin (sns) is blocked by GAL80ts at 18°C show a regular staining pattern (E–E’’). A temperature shift to 31°C initiates RNAi expression, resulting in reduction of approximately 50% of the slit diaphragm protein after 2 days (F–F’’). (G–I’’) Confocal images of tangential section of nephrocytes that express nephrin (sns)-RNAi and GAL80ts continuously at a non-inhibiting temperature of 31°C stained for slit diaphragm proteins nephrin (sns) and Neph1 (Kirre) show an extensive loss of nephrin staining after silencing while a punctate pattern of Neph1 (lacking its binding partner) is observed (see also magnified inset) (G–G’’). Both proteins colocalize in short lines indicating renewed formation of slit diaphragms after a temperature shift to 18°C that inhibits RNAi expression for 3 days (H–H’’). Inset in (H’’) shows transmission electron microscopy of the same stage with return of sparse and isolated slit diaphragms (red arrowhead). The longer lines of slit diaphragm proteins begin to cluster in pairs or triplets after another day, covering a large part of the cell surface in a wide-meshed network (I–I’’). (J–J’’) Slit diaphragm architecture is restored after blocking the expression of nephrin-RNAi for 6 days.
Figure 1—figure supplement 1
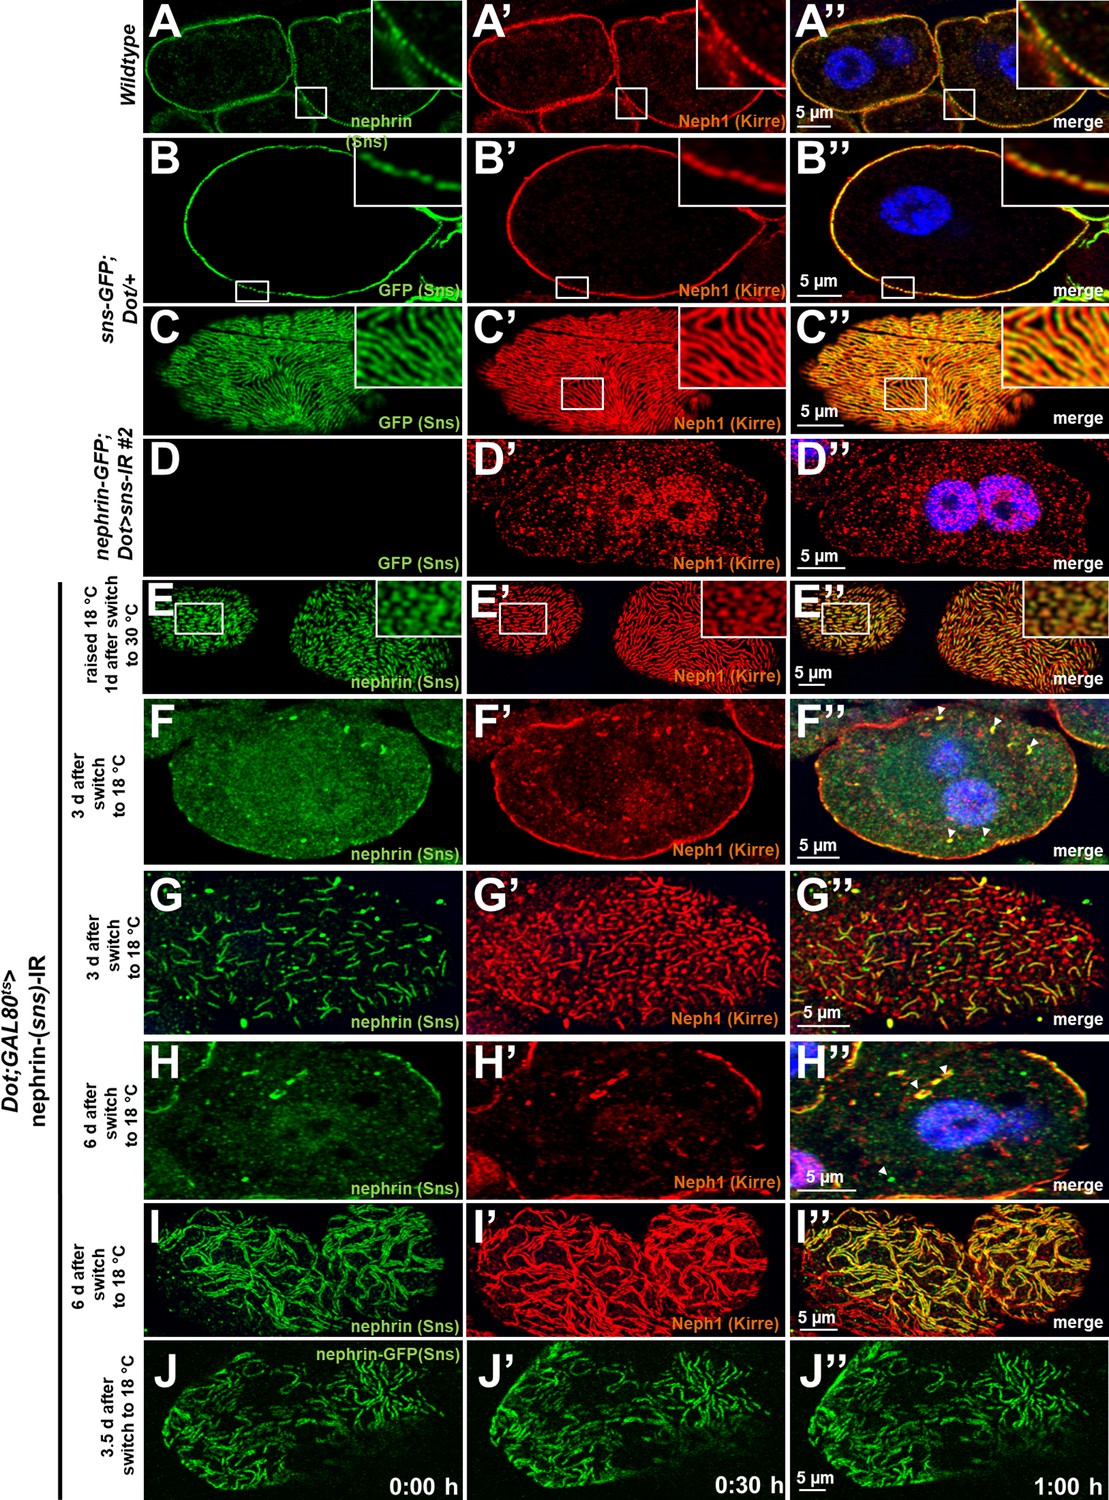
Validation of nephrin-GFP and additional time points for disruption and reassembly of slit diaphragms.
(A) Cross section of a control garland cell nephrocyte (+/+) co-stained for nephrin (Sns) and Neph1 (Kirre). Nuclei are marked by Hoechst 33342 in blue here and throughout the figure. (B–D’’) GFP-derived signal of nephrocytes from animals carrying genomic nephrin-GFP homozygously matches the regular slit diaphragm pattern of endogenous Neph1 in cross sections (B–B’’) and tangential sections (C–C’’) but is abrogated upon silencing of fly nephrin (D–D’’). (E–E’’) Lines of slit diaphragm proteins begin to shorten after 24 hr of fly nephrin silencing. (F–I’’) Fly nephrin is still strongly reduced 3 days after expression of RNAi against fly nephrin has been inhibited by a temperature shift to 18°C (F–-F’’). Nephrin (Sns) begins to return with lines elongating while fly Neph1 resides mostly in punctae after 4 days (G–G’’). Slit diaphragms cover most of the cell surface in clustered lines 6 days after the temperature shift (H–I’’). Arrowheads indicate intracellular nephrin/Neph1. (J–J’’) Live-cell imaging of nephrin-GFP nephrocytes 3.5 days after transient silencing of nephrin shows reconstitution occurs at a slow rate.
Figure 2 with 1 supplement
Live antibody labeling shows rapid nephrin turnover.
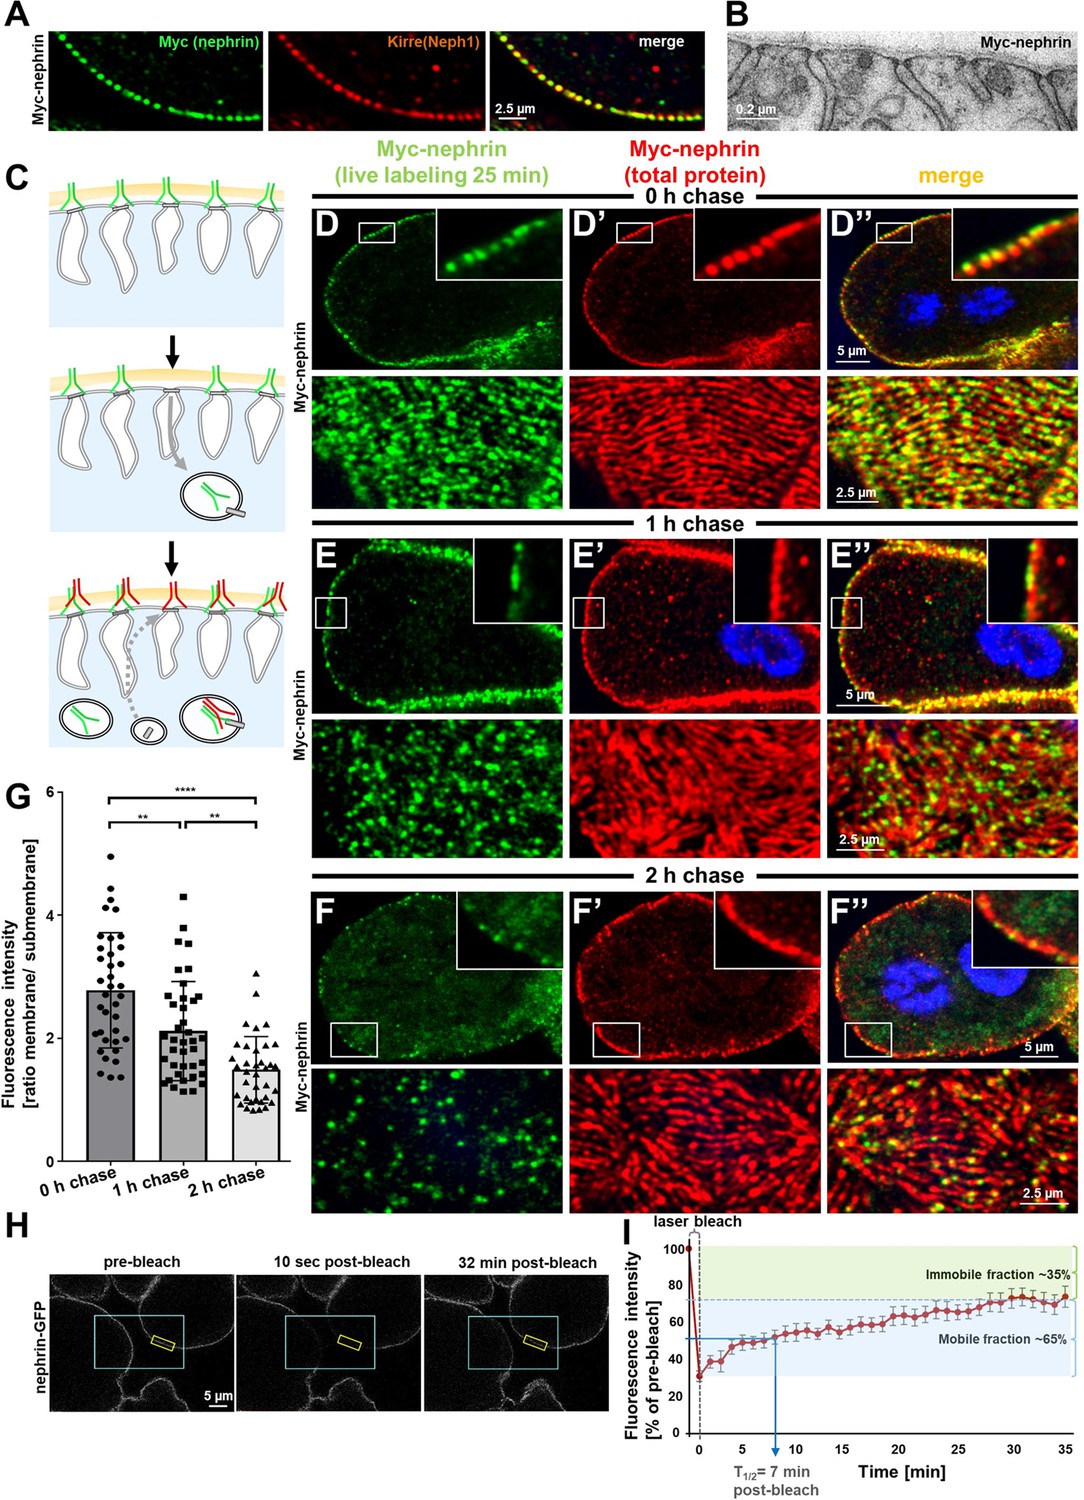
(A) Immunostaining of nephrocyte expressing Myc-nephrin homozygously shows colocalization with endogenous Neph1. (B) Transmission electron microscopy of a nephrocyte expressing Myc-nephrin homozygously reveals regular slit diaphragms suggesting the tagged protein is functional. (C) Schematic illustrating live antibody labeling: Living nephrocytes are labeled with anti-Myc antibody (green) that may undergo endocytosis during chasing. Total nephrin stain follows after fixation and permeabilization (red). Colocalization of green and red indicates stable nephrin (surface) or endocytosed nephrin (subcortical). Exclusively green signal indicates antibody dissociation, while new nephrin reaching the surface during the chase period will stain only red. (D) Confocal microscopy images show cross sections (top) and tangential sections (bottom) from Myc-nephrin nephrocytes after live antibody labeling without chasing. Extensive colocalization indicates successful nephrin labeling. Nuclei are marked by Hoechst 33342 in blue here and throughout the figure. (E) Confocal images analogous to (D) but after 1 hr of chasing reveal incipient endocytosis. (F) Confocal images analogous to (D–D’’) but after 2 hr of chasing suggest extensive endocytosis. Diffuse intracellular signal from live labeling suggests that internalized antibody separated from nephrin. Exclusively red nephrin signal indicates newly delivered protein. (G) Quantitation of fluorescence intensity derived from live labeling from conditions in (D–F) expressed as a ratio of surface (slit diaphragm) and subcortical areas confirms significant nephrin turnover (mean ± standard deviation, n=12–13 animals per p<0.01 for chase of 1 hr and p<0.0001 for 2 hr). (H) Shown are frames from a time lapse movie of nephrin-GFP nephrocytes. The blue box demarcates the region of photobleaching, the yellow box outlines a region of interest (ROI) where the fluorescence intensity was measured over the length of the fluorescence recovery after photobleaching (FRAP) experiment. A loss of fluorescence intensity compared to pre-bleach condition (left panel) is detectable 10 s after photobleaching (middle panel). After 32 min, the fluorescence recovers significantly (right panel). (I) Quantitative analysis from multiple FRAP experiments (n=5 cells, 8 ROIs total, mean ± standard deviation) reveals an initially rapid recovery of fluorescence intensity that slows to a plateau suggesting a nephrin half-life of ~7 min. The majority of nephrin molecules (~65%) are replaced within 30 min (mobile fraction).
Figure 2—figure supplement 1

Validation of Myc-nephrin and bafilomycin treatment.
(A) Shown is a schematic that indicates the genome editing strategy of introducing a myc-tag into the extracellular domain of sns, the fly nephrin. While myc is targeted to the border of exon 2, a marker (in reverse orientation) is inserted into the flanking intron. The marker expresses Dsred under control of the P3 promoter for identification of genome-edited flies, but is removable by flanking loxP sites. (B–C’’) Shown are a tangential section (B–B’’) and a cross section (C–C’’) of a garland cell nephrocyte that carries Myc-tag in frame within the locus of fly nephrin, stained for Myc and Neph1 (Kirre). The Myc staining reveals a highly specific staining in a typical fingerprint-like pattern and colocalizes with endogenous fly Neph1. Nuclei are marked by Hoechst 33342 in blue here and throughout the figure. (D–D’’) Silencing fly nephrin abrogates the specific signal from Myc-staining, confirming that the Myc staining indeed reflects endogenously expressed Myc-nephrin. (E) Schematic drawing of the areas used for the quantitation in Figures 2G and 5L (membrane = orange and subcortical area = blue). (F–F’’) A nephrocyte after live antibody labeling and chase of 120 min in presence of bafilomycin (0.1 µM) is shown. This treatment causes a scattered, vesicular signal in the cytosol (F) that partially colocalizes with total nephrin (F–F’’), suggesting retention of the endocytosed antibody after blocking lysosomal degradation. (G) Quantification of the results from (F–F’’) compared to a control treatment without bafilomycin and shown as an intensity ratio of the cell interior vs. membrane (n=8–10 per genotype, p<0.01 for bafilomycin 0.1 µM).
Figure 3 with 1 supplement
Endosomal regulator Rab5 is required for maintenance of slit diaphragms.
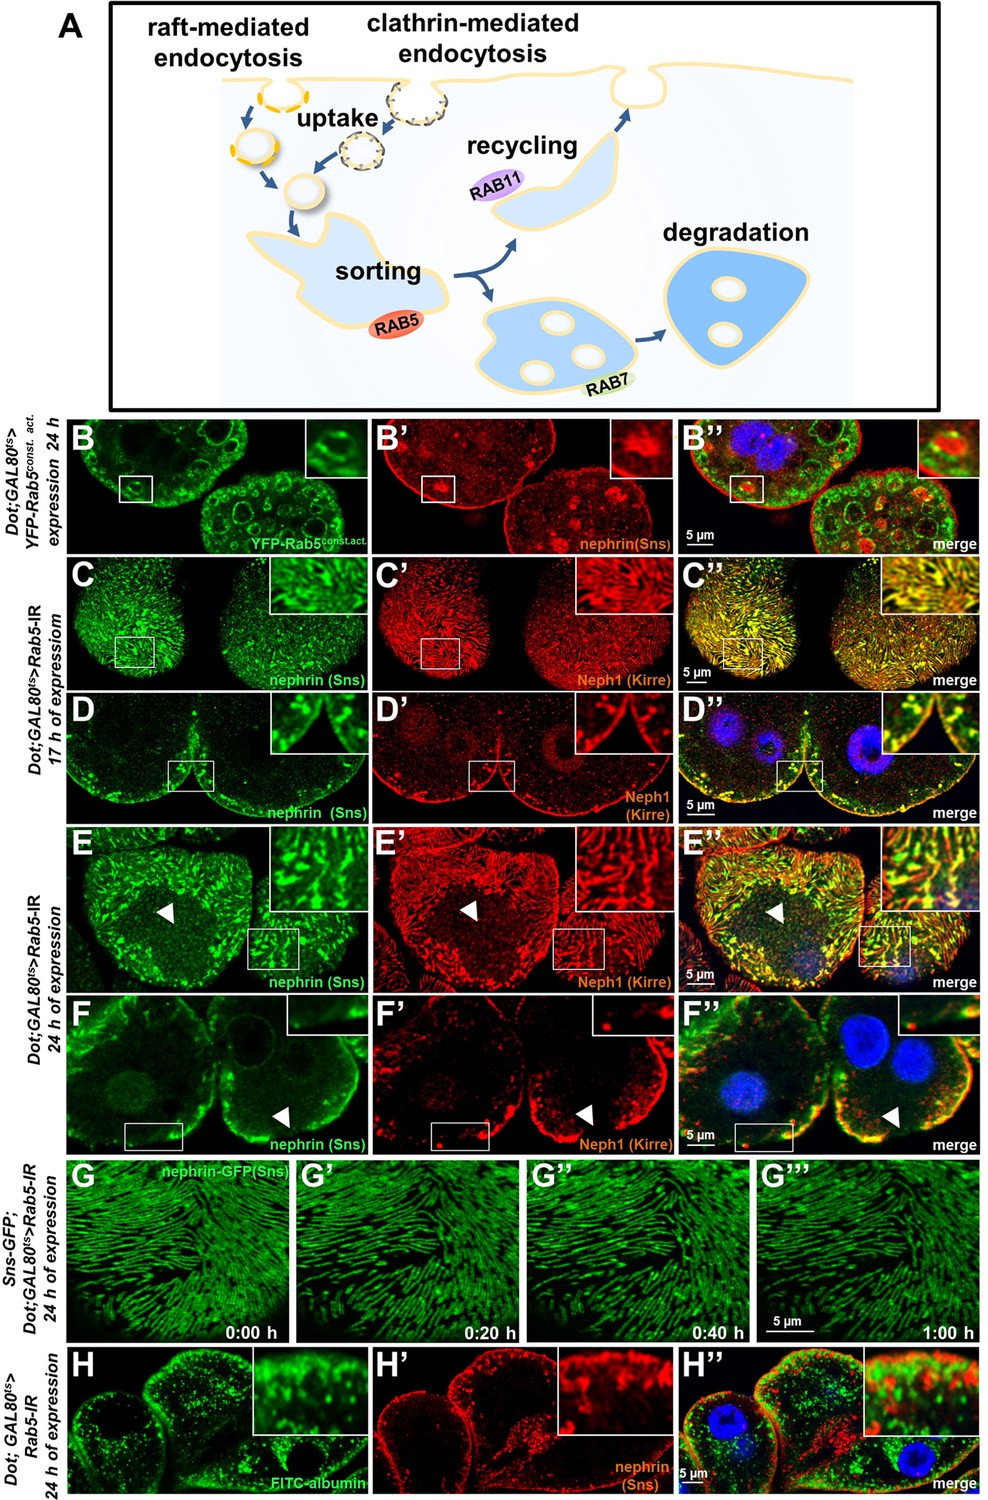
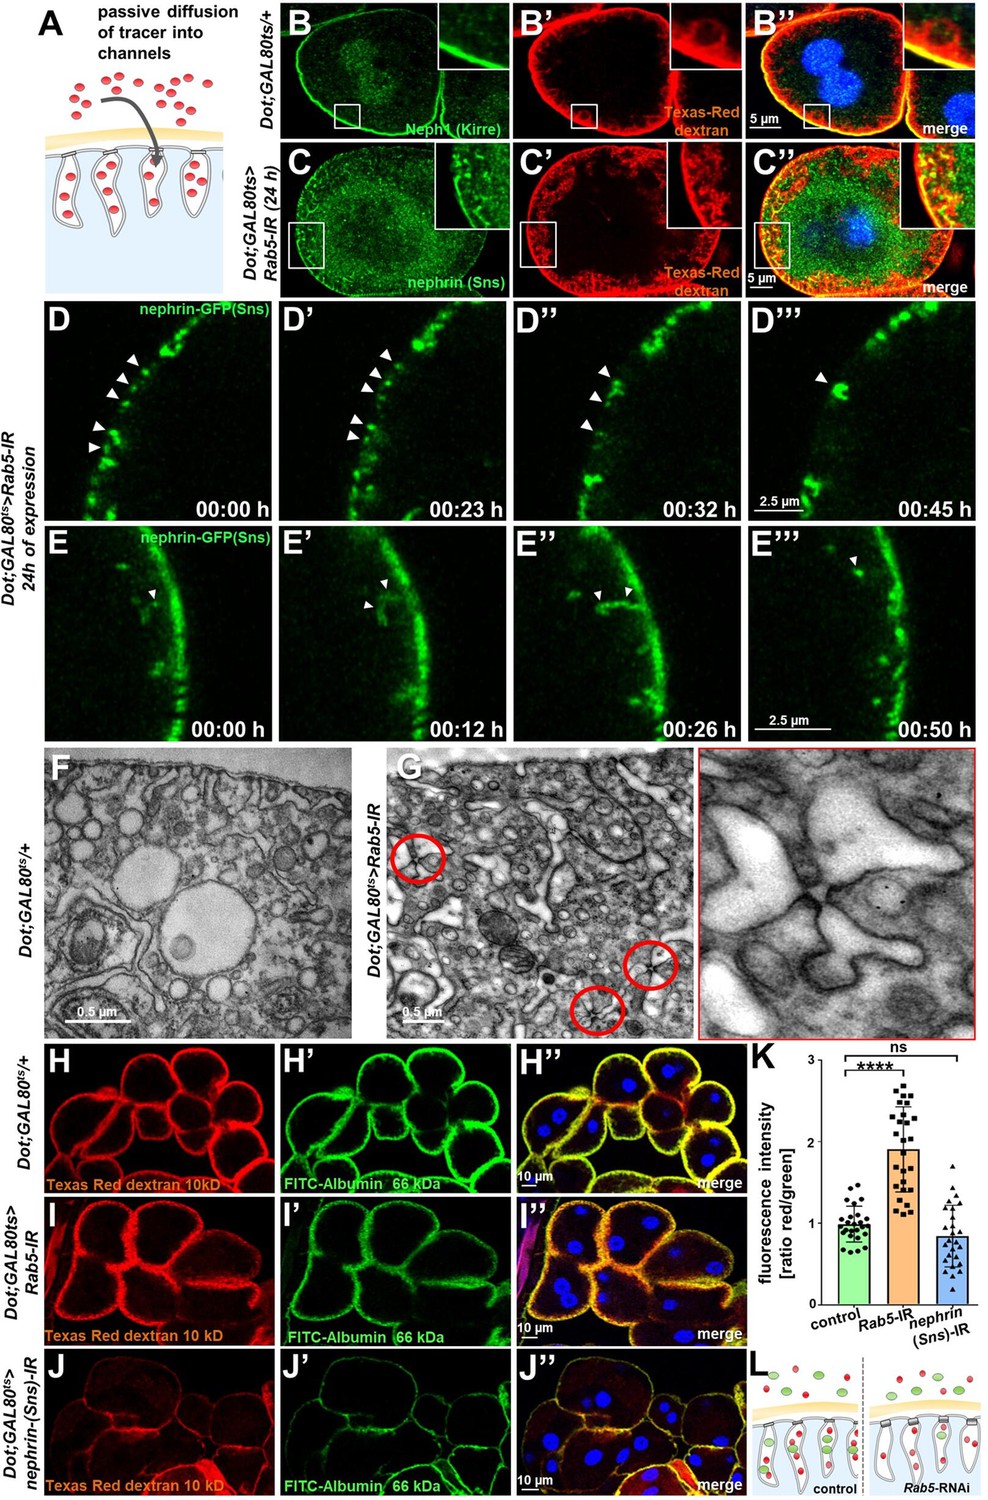
(A) Schematic illustrating endocytic trafficking in a simplified manner shows raft-mediated and clathrin-mediated uptake converging in the early endosome by vesicle fusion. Uptake, early endosome formation and cargo sorting are controlled by Rab5. Sorting may direct cargo either toward degradation, which is promoted by Rab7, or back toward the cell membrane by recycling pathways such as Rab11-dependent recycling. (B–B’’) Cross-sectional confocal microscopy images from nephrocytes expressing constitutively active YFP-Rab5 for 24 hr (green) show highly enlarged early endosomes that contain ectopic fly nephrin (see also magnified inset). Nuclei are marked by Hoechst 33342 in blue here and throughout the figure. (C) Confocal images of nephrocytes with acute silencing of Rab5 for 17 hr reveals brighter sections within the lines of slit diaphragm protein in tangential sections. Lines further are blurry and focally confluent (see also magnified inset). (D) Cross-sectional images of nephrocytes with short-term silencing of Rab5 show appearance of ectopic slit diaphragm protein below the surface (compare to control Figure 3—figure supplement 1A-A"). (E–F) Tangential sections (E) and cross sections (F) of nephrocytes with slightly longer silencing of Rab5 for 24 hr stained for nephrin (Sns) and Neph1 (Kirre) reveal progressive thickening of slit diaphragms and localized breakdown of the slit diaphragms in a circumscribed area (white arrowheads). (G–G’’’) Snapshots from a movie obtained by live-cell imaging using confocal microscopy are shown. Nephrocytes expressing nephrin-GFP (heterozygously) are shown after 24 hr of acute Rab5 silencing. Increasing gaps and a progressive reduction of slit diaphragms are observed over the course of 1 hr. Cells with a mild phenotype were chosen for live-cell imaging to ensure cellular viability. The nephrin signal in tangential sections appears slightly less blurry compared to untagged nephrin. (H–H’’) Confocal microscopy images showing cross sections of nephrocytes after 24 hr of Rab5 silencing are shown. Living cells were exposed to FITC-albumin (green) for 15 min before fixation and staining for nephrin (red). Cells show significant endocytosis of FITC-albumin indicating cell viability and residual endocytic activity despite silencing of Rab5. Ectopic nephrin and FITC-albumin do not colocalize, indicating that ectopic nephrin is not found within a subcellular compartment that is also destination for recently endocytosed cargo.
Figure 3—figure supplement 1
Validation and control experiments for loss-of-function of Rab5.
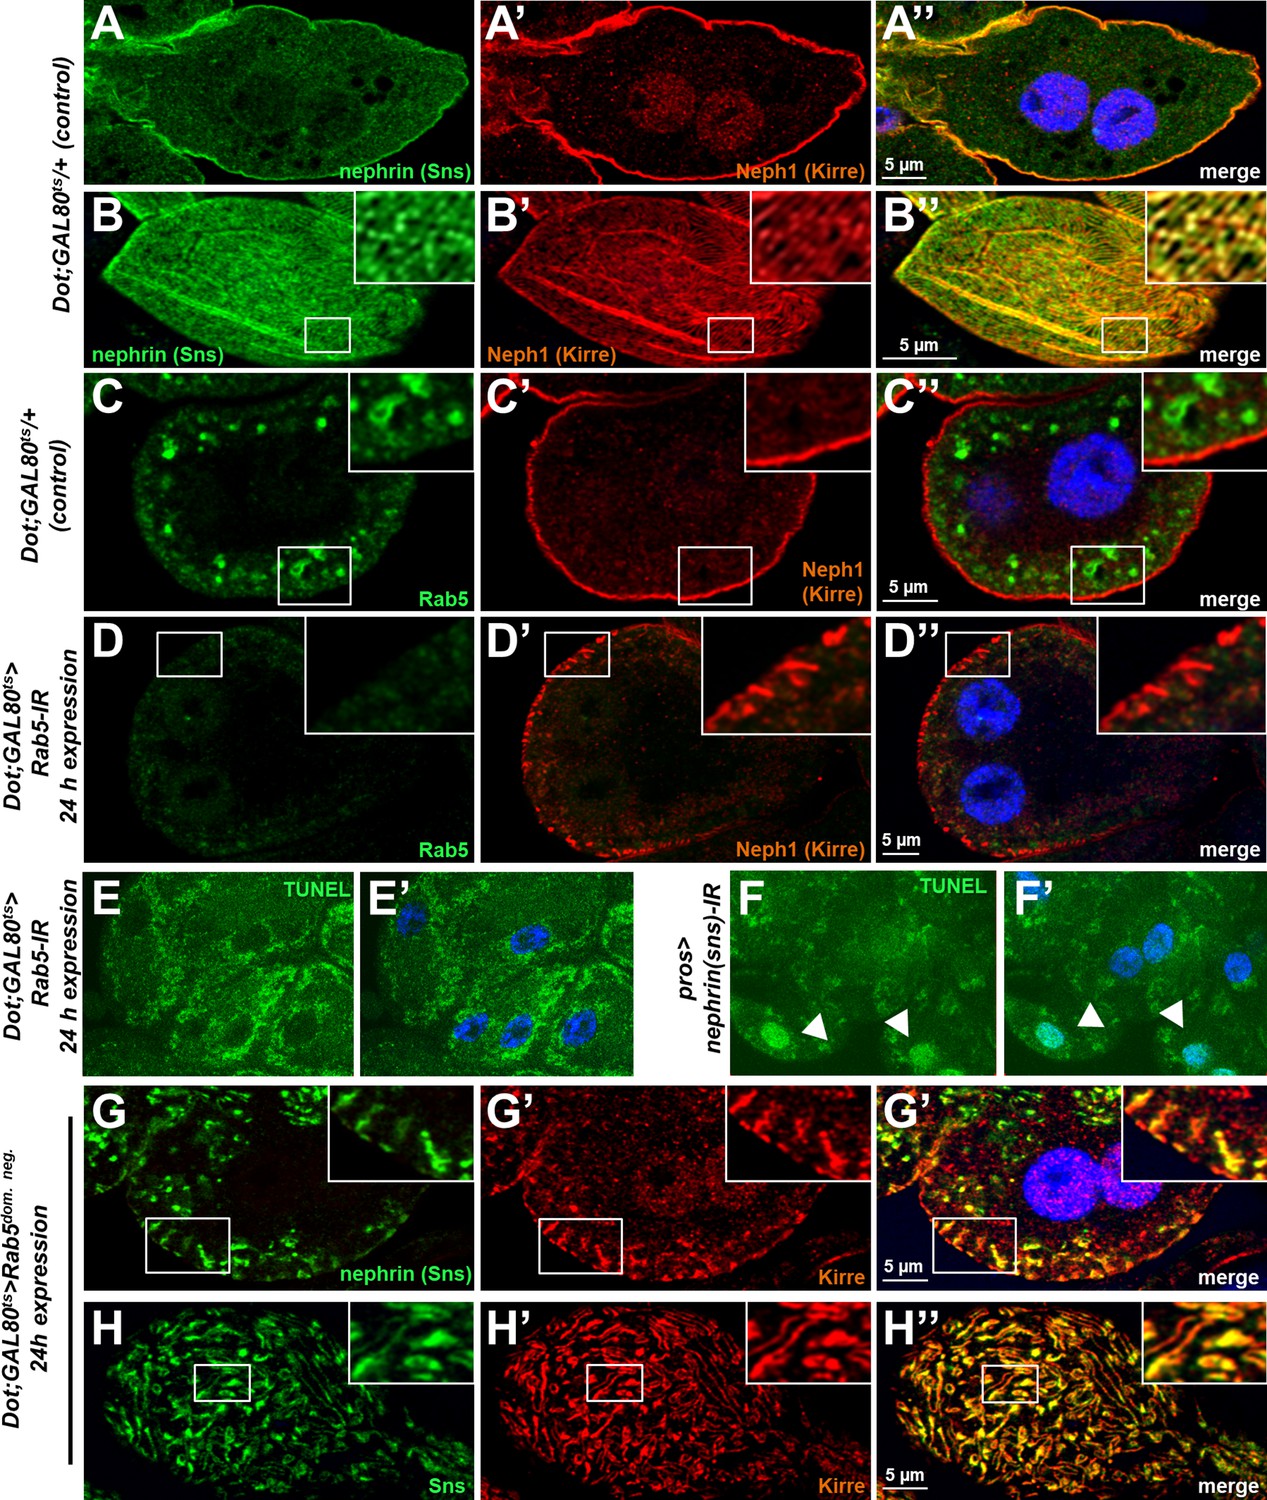
(A–B’’) Shown are a cross section (A–A’’) and a tangential section (B–B’’) of a garland cell nephrocyte that expresses GAL80ts alone, stained for Nephrin (Sns) and Neph1 (Kirre). Nuclei are marked by Hoechst 33342 in blue here and throughout the figure. (C–D’’) Rab5 stains in small vesicles at the cell periphery in control nephrocytes (C–C’’). Silencing Rab5 strongly diminishes the Rab5 signal and fly Neph1 reveals mislocalization. This indicates that short-term silencing is sufficient for a significant knockdown of Rab5. (E–F’) Nephrocytes expressing Rab5-RNAi for 24 hr were subject to transferase dUTP nick end labeling (TUNEL) staining but no specific signal from the nuclei is observed (E, compare to Hoechst 33342 in E’), indicating that cells are not apoptotic. In contrast, when silencing fly nephrin as a positive control, we observed appearance of TUNEL-positive cells (F–F’). (G–H’’) Nephrocytes with short-term expresison of a dominant negative Rab5 for 24 hr show ectopic slit diaphragm protein below the surface in cross sections (G–G’’) and blurry and confluent lines of slit diaphragm protein in tangential sections (H–H’’).
Figure 4 with 1 supplement
Endocytosis prevents lateral diffusion of nephrin and preserves filter permeability.
(A) Schematic illustrates the assay for visualization of labyrinthine channels. Nephrocytes are fixed briefly before exposure to Texas-Red-Dextran that enters the channels by passive diffusion. (B) Confocal microscopy image of a control nephrocyte is stained for Neph1 (green) together with labeling of the channels by Texas-Red-Dextran (10 kDa, red). Channels extend directly below the slit diaphragms. Nuclei are marked by Hoechst 33342 in blue here and throughout the figure. (C) Confocal images of nephrocytes with short-term silencing of Rab5 show mislocalized fly nephrin below the cell surface that colocalizes significantly with the labyrinthine channels visualized by Texas-Red-Dextran (10 kDa). (D–E’’’) Snapshots from movies obtained by live-cell imaging are shown. Nephrocytes express nephrin-GFP (heterozygously) concomitant with Rab5-RNAi for 24 hr. Fusion and cluster formation (white arrowheads in panels D) of fly nephrin precedes appearance of gaps (D–D’’’). Similarly, formation of protrusions of slit diaphragm proteins from the cell surface is followed by a formation of vesicles (E–E’’’, white arrowheads). (F) Electron microscopy (EM) image from a cross section through the surface of a control nephrocyte reveals regular slit diaphragms bridging the membrane invaginations called labyrinthine channels. (G) EM image from a section through the surface of a nephrocyte expressing Rab5-RNAi acutely for 24 hr demonstrates ectopic formation of slit diaphragms forming rosette-like structures within the labyrinthine channels (red circles, magnification on the right). (H–J’’) Confocal microscopy images of nephrocytes after simultaneous uptake of tracers FITC-albumin (66 kDa, green) and Texas-Red-Dextran (10 kDa) are shown. Control nephrocytes show robust uptake of both tracers (H–H’’). Silencing of Rab5 acutely for 24 hr shows a stronger decrease in the uptake of the larger tracer FITC-albumin compared to smaller Texas-Red-Dextran (I–I’’). Both tracers are equally reduced upon nephrin silencing (J–J’’). (K) Quantitation of fluorescence intensity expressed as a ratio of Texas-Red-Dextran/FITC-albumin (small/large tracer) confirms a disproportionate reduction for the larger tracer for Rab5-RNAi but not nephrin-RNAi (mean ± standard deviation, n=9 animals per genotype, p<0.0001 for Rab5-RNAi, p>0.05 for nephrin-RNAi). (L) Schematic illustrates how incipient filter clogging affects uptake of larger tracer disproportionately.
Figure 4—figure supplement 1
Channel diffusion assay reveals loss of invaginations upon silencing of nephrin and impaired slit diaphragm passage upon silencing of Rab5.
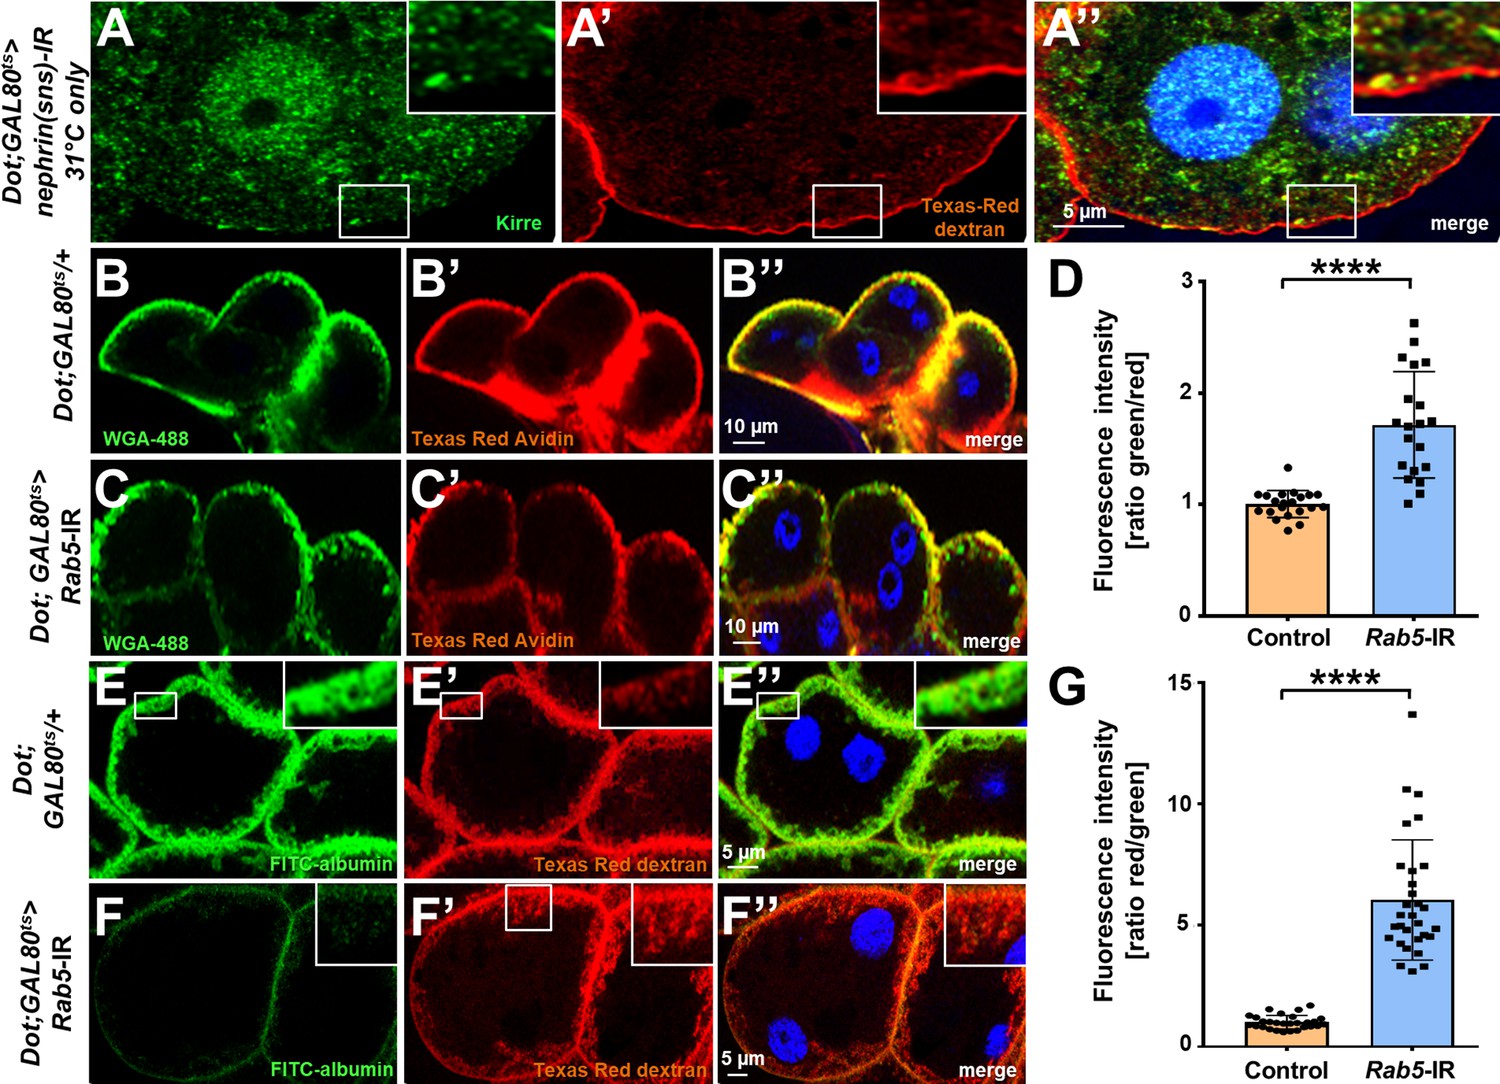
(A–A’’) Shown is a cross section (A–A’’) of a garland cell nephrocyte subject to the channel diffusion assay. Texas-Red-Dextran does not penetrate deeper into the cell when channels are abrogated by expression nephrin (Sns)-RNAi, supporting that the signal is specific for the membrane invaginations called labyrinthine channels. Nuclei are marked by Hoechst 33342 in blue here and throughout the figure. (B–C’’) Confocal microscopy image of nephrocytes after simultaneous uptake of Alexa Fluor 488 wheat germ agglutinin (38 kDa, green) and the larger tracer Texas-Red-Avidin (66 kDa) for control nephrocytes (B) and after silencing Rab5 (C), which has a weaker impact on uptake of the smaller tracer. (D) Quantitation of fluorescence intensity expressed as a ratio of WGA-488/Texas-Red-Avidin (small/large tracer) confirms disproportionate reduction for the larger tracer upon expression of Rab5-RNAi (mean ± standard deviation n=7 animals per genotype, p<0.0001 for Rab5-RNAi). (E–F’’) The channel assay reveals a greater reduction in FITC-albumin penetration into channels compared to the smaller Texas-Red-Dextran (10 kDa) for silencing of Rab5 (F–F’’) compared to the control (E–E’’). (G) Quantitation of fluorescence intensity expressed as a ratio of Texas-Red-Dextran/FITC-albumin (small/large tracer) further confirms the described disbalanced reduction for the larger tracer for Rab5-RNAi (mean ± standard deviation, n=9 animals per genotype, p<0.0001 for Rab5-RNAi).
Figure 5 with 2 supplements
Endocytic uptake and Rab11-dependent recycling are required for slit diaphragm maintenance.
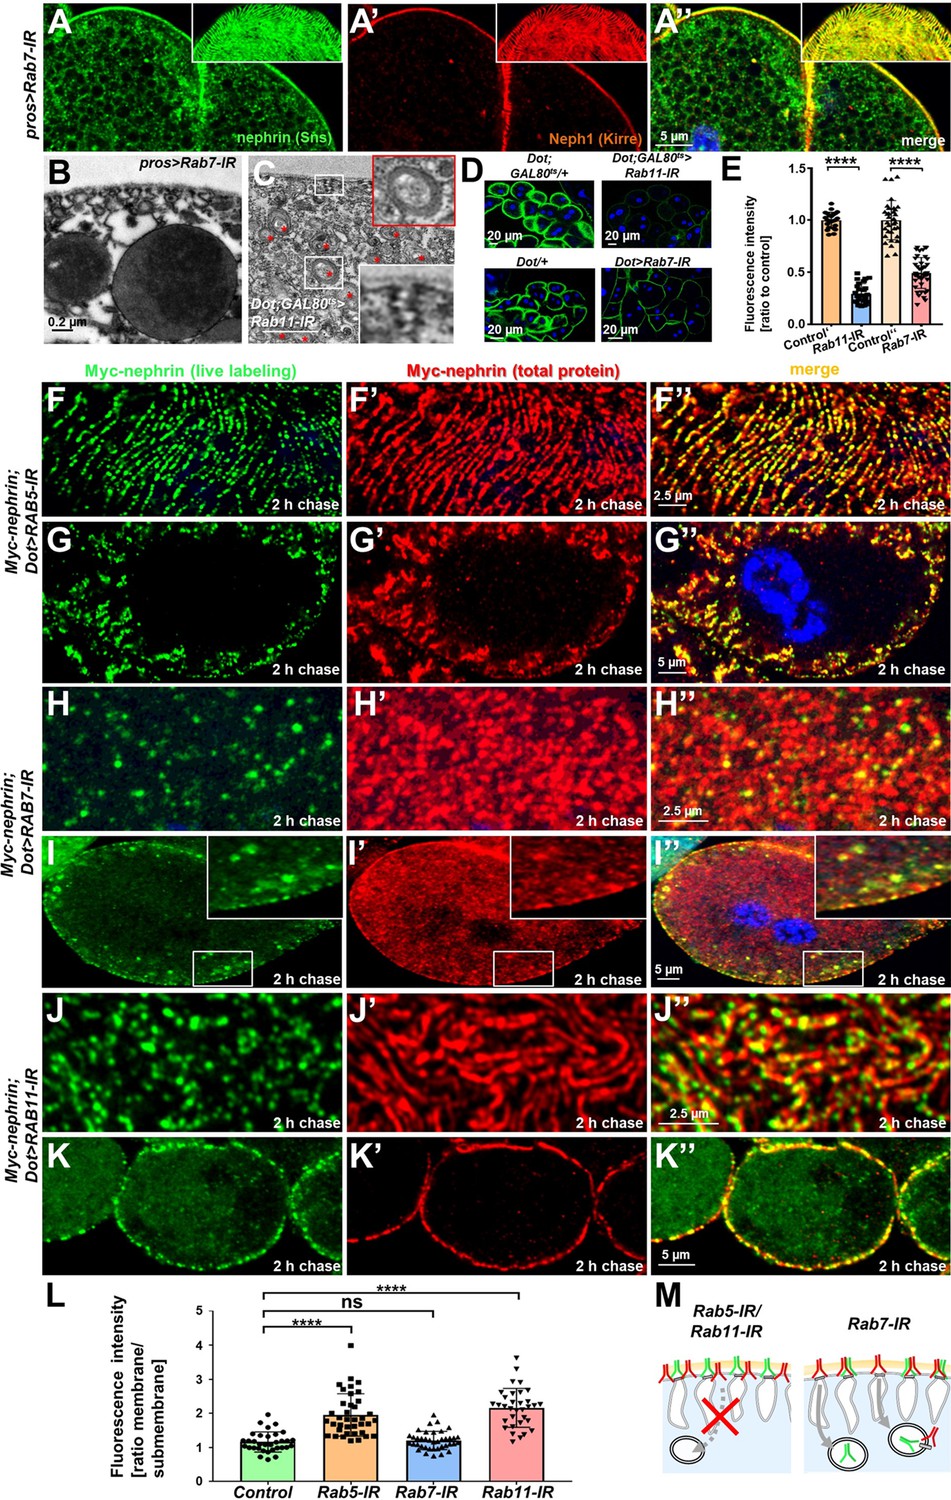
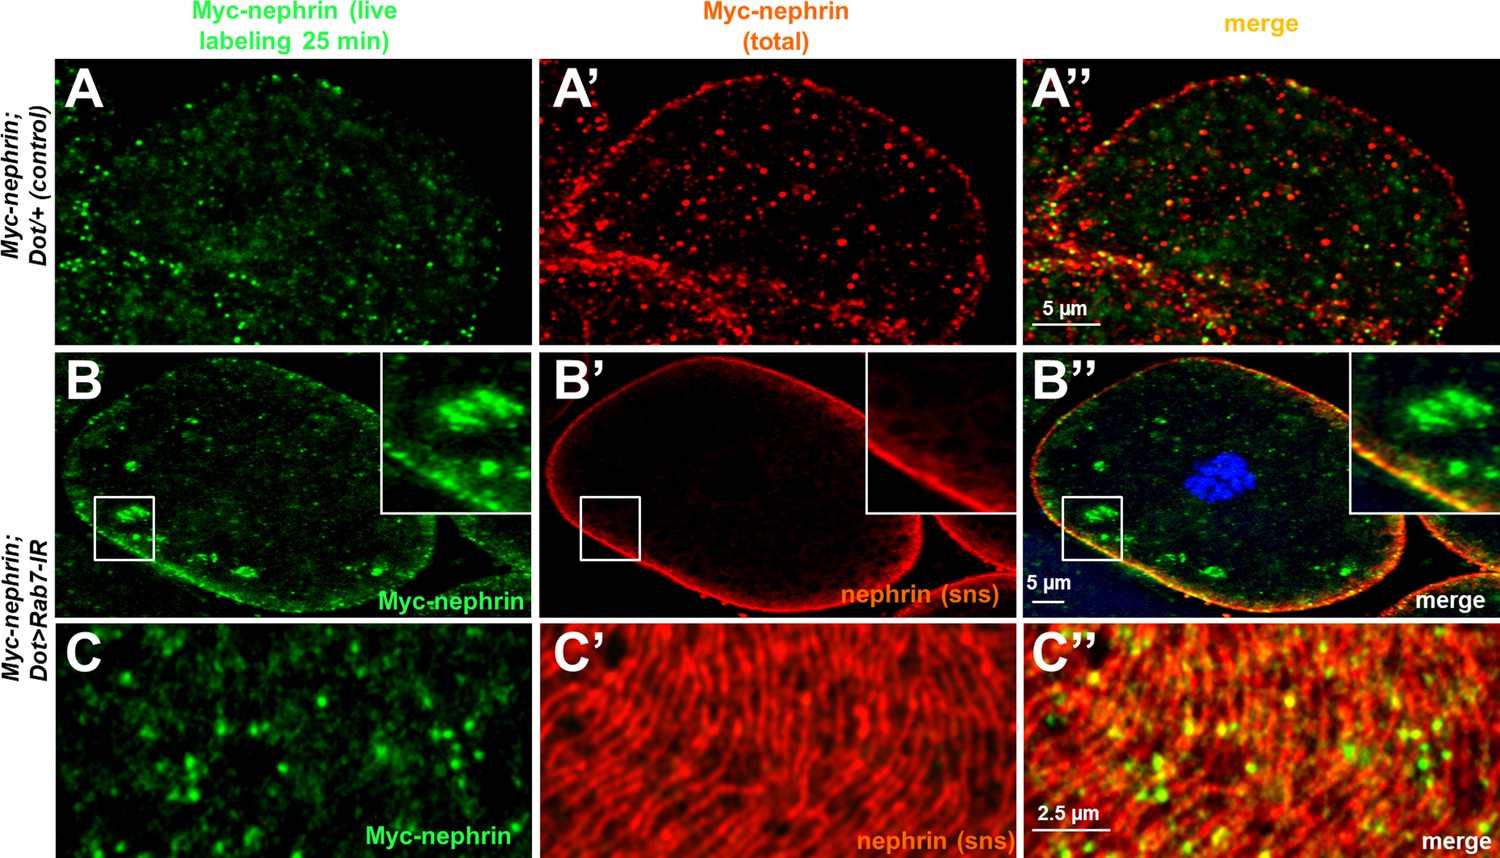
(A–A’’) Stainings of Rab7-RNAi nephrocytes reveal an additional faint signal for nephrin but not for Neph1 that likely reflects accumulation of nephrin upon defective degradation. Tangential sections (insets) show a regular fingerprint-like pattern, indicating undisturbed slit diaphragm formation. Nuclei are marked by Hoechst 33342 in blue here and throughout the figure. (B) Electron microscopy (EM) image of Rab7-RNAi nephrocyte shows normal slit diaphragms and large vesicles. (C) EM of nephrocyte expressing Rab11-RNAi reveals reduction of labyrinthine channels with multiple slits close to the cell surface (see inset) and expansion of lysosomes (red asterisks, see also magnified inset). Scale bar represents 0.2 µm. (D) FITC-albumin endocytosis as assay for nephrocyte function shows reduced uptake for Rab7-RNAi (lower panels) and Rab11-RNAi (upper panels) using Dorothy-GAL4 or prospero-GAL4 compared to the respective controls. (E) Quantitation of results from (D) in ratio to a control experiment performed in parallel (mean ± standard deviation, n=11–14 animals per genotype, p<0.0001 for Rab7-RNAi and n=9 animals per genotype p<0.0001 for Rab11-RNAi). Sidak post hoc analysis was used to correct for multiple comparisons. (F–K’’) Confocal microscopy images of tangential sections (F–F’’, H–H’’, J–J’’) and cross sections (G–G’’, I–I’’, K–K’’) of Myc-nephrin nephrocytes after live antibody labeling and 2 hr of chasing are shown for the indicated genotypes. Silencing of Rab5 at 18°C was obtained before flies were adapted to 25°C for 1 hr (F-G’’). Live labeling (green) and total stain (red) show near-complete colocalization for Rab5-RNAi (F–G’’), indicating disrupted nephrin turnover. Extensive amounts of subcortical nephrin are revealed in cross sections (G–G’’), compatible with lateral diffusion into the membrane invaginations. Cells expressing Rab7-RNAi after live antibody labeling show undisturbed nephrin turnover as the live labeled antibody is removed from the surface (H–H’’). Cross sections of Rab7-RNAi nephrocytes reveal numerous subcortical vesicles that partially show isolated signal for the live labeling, indicating the antibody disengaged from nephrin (I–I’’). Nephrocytes expressing Rab11-RNAi show strong retention of live labeled nephrin on the cell surface (J–J’’), suggesting impaired turnover. Cross sections show the antibody on the surface, but not in labyrinthine channels (K–K’’). (L) Quantitation of results from (F–K’’) expressed as ratio of the fluorescence intensity between surface and subcortical region for individual cells (mean ± standard deviation, n=11–13 animals per genotype, p<0.0001 for Rab5-RNAi, p>0.05 for Rab7-RNAi and p<0.0001 for Rab11-RNAi). (M) Schematic illustrates findings studying nephrin live labeling upon silencing of Rab5/Rab7/Rab11.
Figure 5—figure supplement 1
Validation and controls for Rab7 and Rab11.
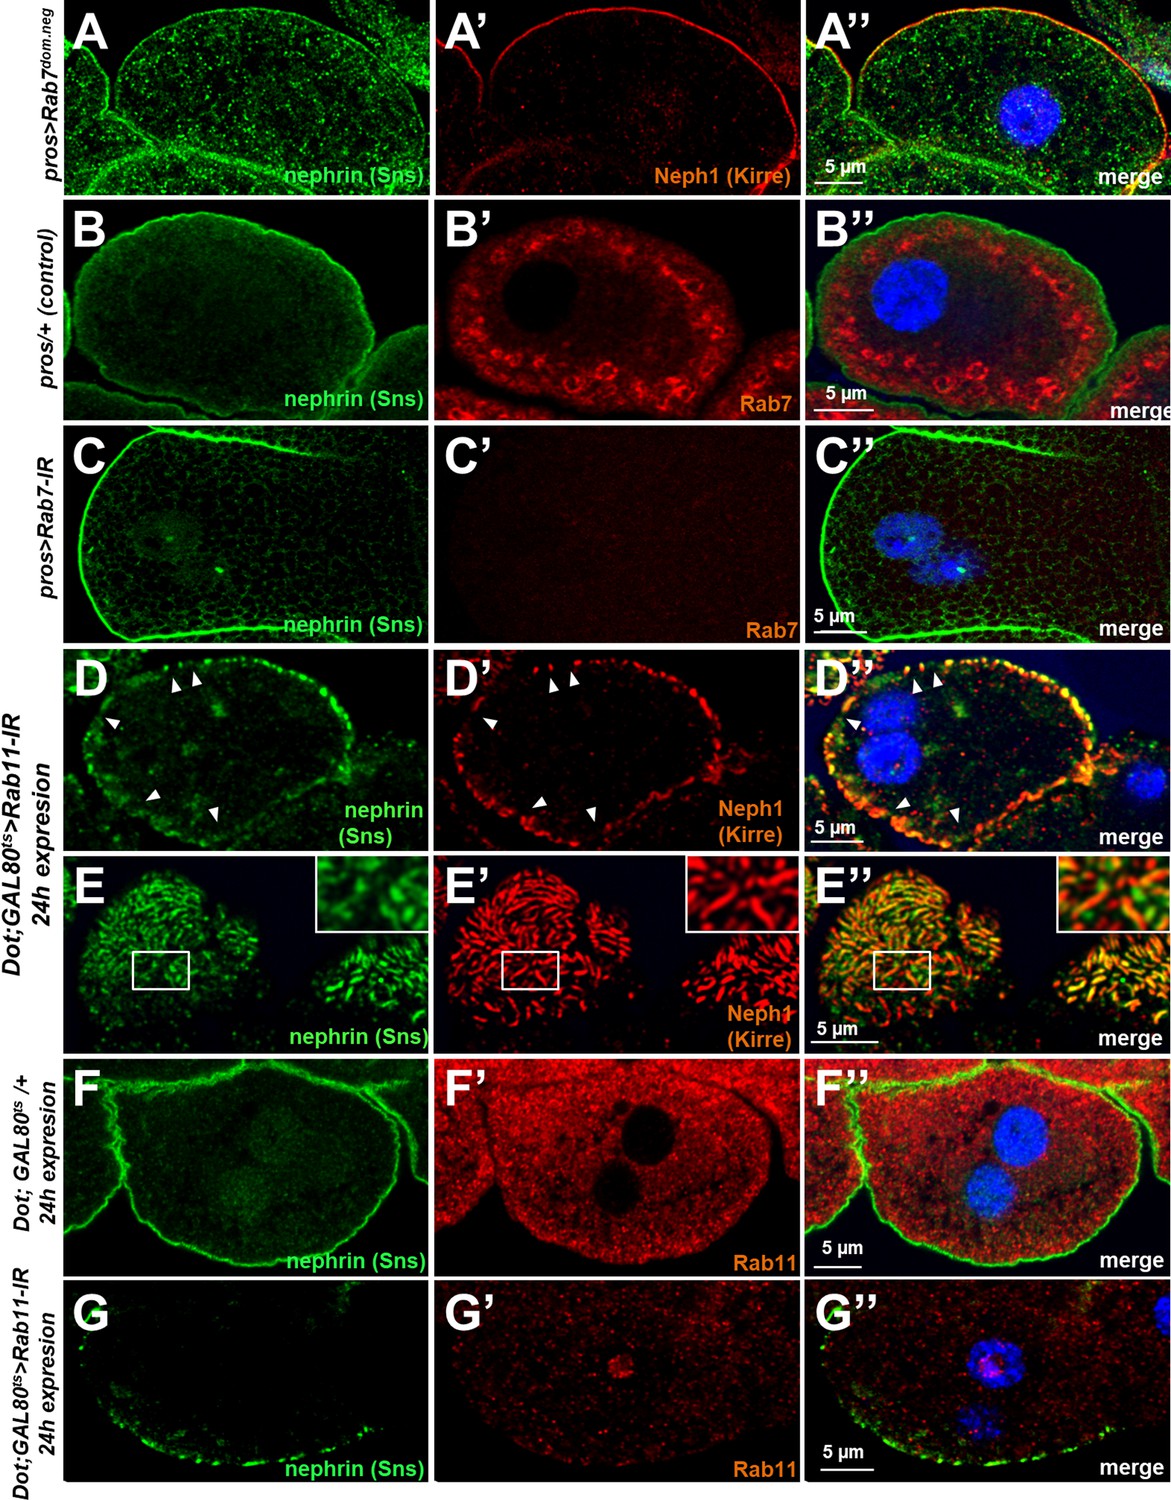
(A–A’’) Slit diaphragms are formed regularly upon expression of dominant negative Rab7, while nephrin accumulates diffusely in the cell. Fly Neph1 is less affected than fly nephrin upon silencing of Rab7. (B–C’’) Control nephrocytes expressing prospero-GAL4 alone (B–B’’) show the regular staining pattern of fly nephrin (Sns) and Rab7. Signal of the Rab7 antibody is lost upon expression of Rab7-RNAi (C–C’’). (D–E’’) Acute silencing of Rab11 for 24 hr in nephrocytes results in coarser, wider spaced dots in cross sections (D–D’’) matching wider gaps between the lines of slit diaphragm proteins in tangential sections (E–E’’). Slit diaphragm proteins may occasionally occur independently from each other (inset in E–E’’). (F–G’’) Short-term expression of Rab11-RNAi strongly diminishes the signal derived from an antibody raised against human Rab11 (compare F–F’’ to G–G’’) suggesting an efficient knockdown.
Figure 5—figure supplement 2
Additional images for live antibody.
(A–A’’) Confocal images of control nephrocytes that express Myc-nephrin heterozygously show complete turnover, not distinguishable from cells that carry the genomed-edited locus homozygously (compare to Figure 2). (B–C’’) Confocal images of nephrocyte expressing Rab7-RNAi after live antibody labeling show subcortical vesicles that exclusively stain for the live labeled antibody (green) but not for nephrin staining, suggesting they contain antibody that is no longer coupled to nephrin (B–B’’). Tangential sections from the same cell confirm undisturbed nephrin turnover as the live labeled antibody is removed from the surface (C–C’’). Nuclei are marked by Hoechst 33342 in blue here and throughout the figure.
Figure 6 with 1 supplement
Differential transport through dynamin-mediated or raft-mediated endocytosis is required for slit diaphragm maintenance in nephrocytes.
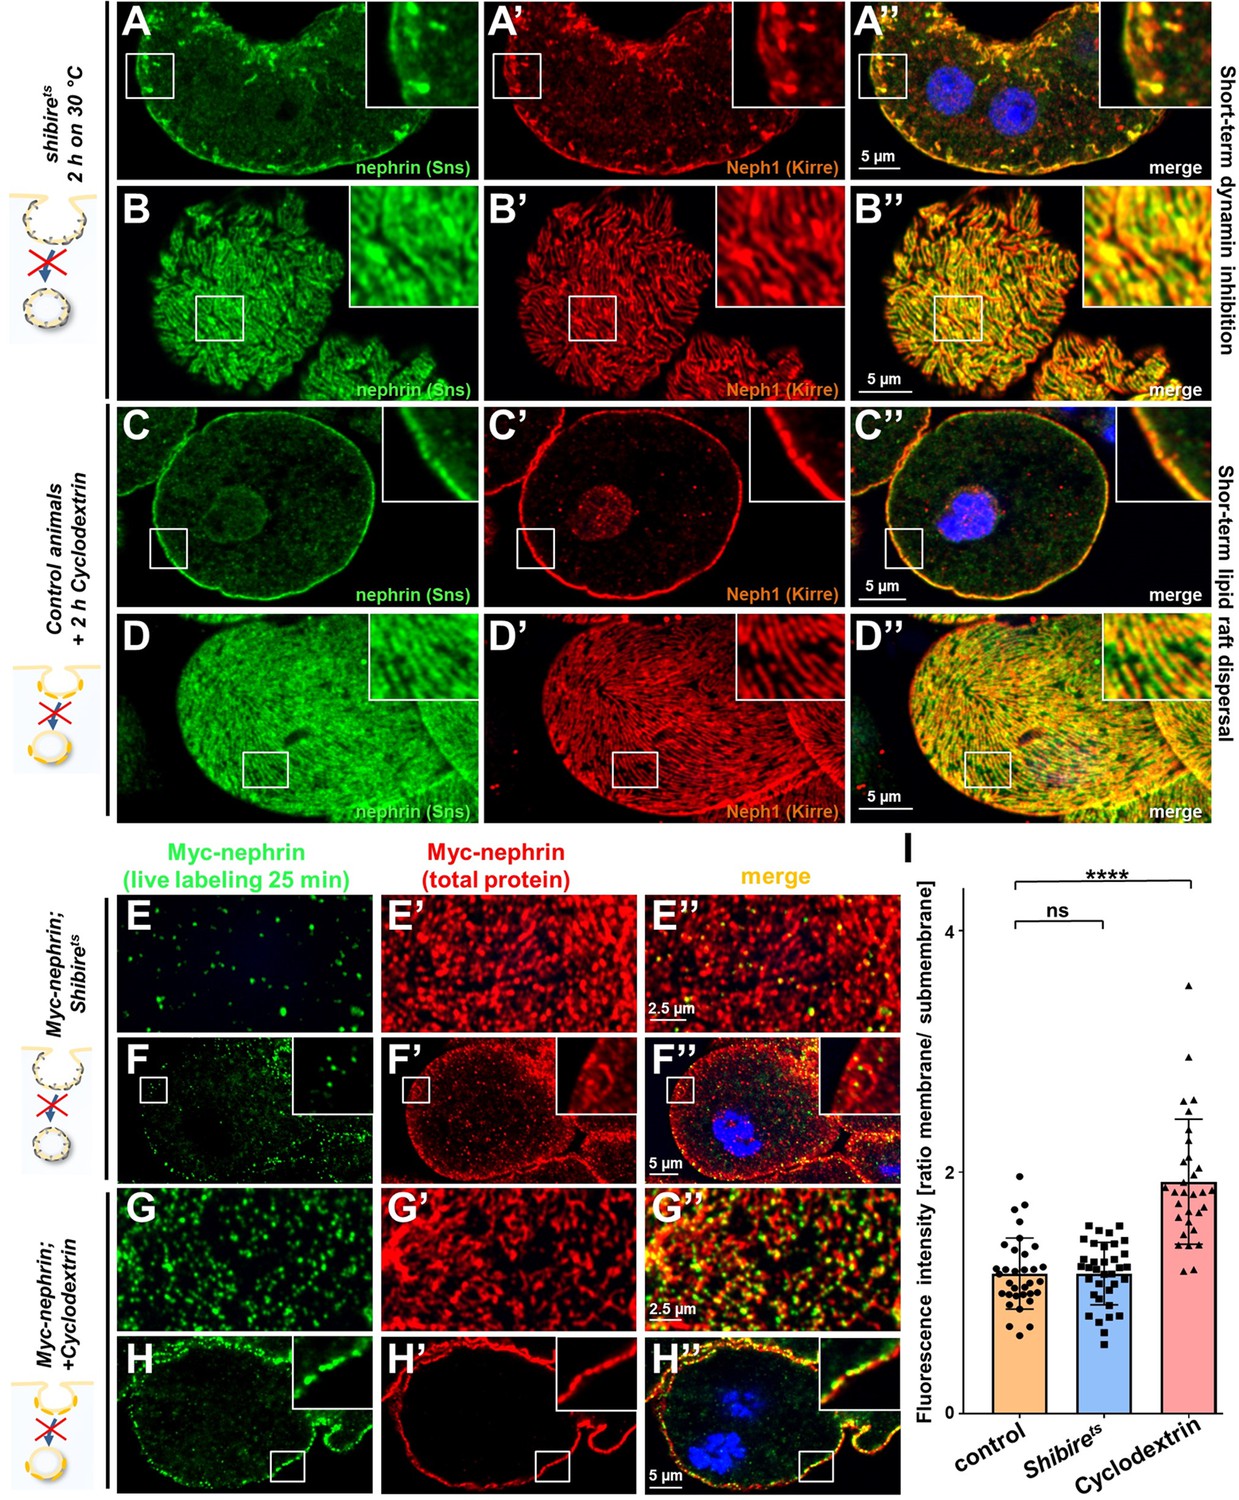
(A–B’’) Confocal images of nephrocytes stained for slit diaphragm proteins carrying a temperature-sensitive variant (G141S) of shibire, the Drosophila dynamin, homozygously. The mutant protein is functional at lower temperatures but lacks function at 30°C and the animals were exposed to 30°C for 2 hr before staining. Cross sections show accumulation of subcortical slit diaphragm protein in clusters and short lines protruding from the surface (A–A’’). Tangential sections indicate a mild confluence and few brighter clusters of slit diaphragm proteins (B–B’’). (C–D’’) Confocal images of control nephrocytes treated with cylodextrin for 2 hr ex vivo to inhibit raft-mediated endocytosis show a regular staining pattern of slit diaphragm proteins in cross-sectional (C–C’’) and tangential planes (D–D’’). (E–H’’) Confocal microscopy images showing tangential sections (panels E and G) and cross sections (panels F and G) of nephrocytes carrying one copy of the genomic Myc-nephrin after live antibody labeling with 2 hr of chase period are for the indicated genotypes or interventions. Shibirets animals show intense nephrocyte turnover in the live labeling assay despite exposure to a temperature of 31°C for 2 hr which inhibits function of the fly dynamin during that period (E–F’’). In contrast, blocking raft-mediated endocytosis for 2 hr by cyclodextrin in control nephrocytes strongly diminishes nephrin turnover and a large amount of the live labeled antibody is retained (G–H’’). This suggests that nephrin turnover depends on raft-mediated endocytosis that occurs independent from dynamin function. The diffuse intracellular signal from live labeling was similar to control (Figure 5—figure supplement 2A). (I) Quantitation of results from (E–H’’) expressed as ratio of the fluorescence intensity between surface and subcortical region for individual cells (mean ± standard deviation, n=11–12 animals per genotype, p>0.05 for shibirets, and p<0.0001 for cyclodextrin treatment).
Figure 6—figure supplement 1
Validation and controls for Shibirets.
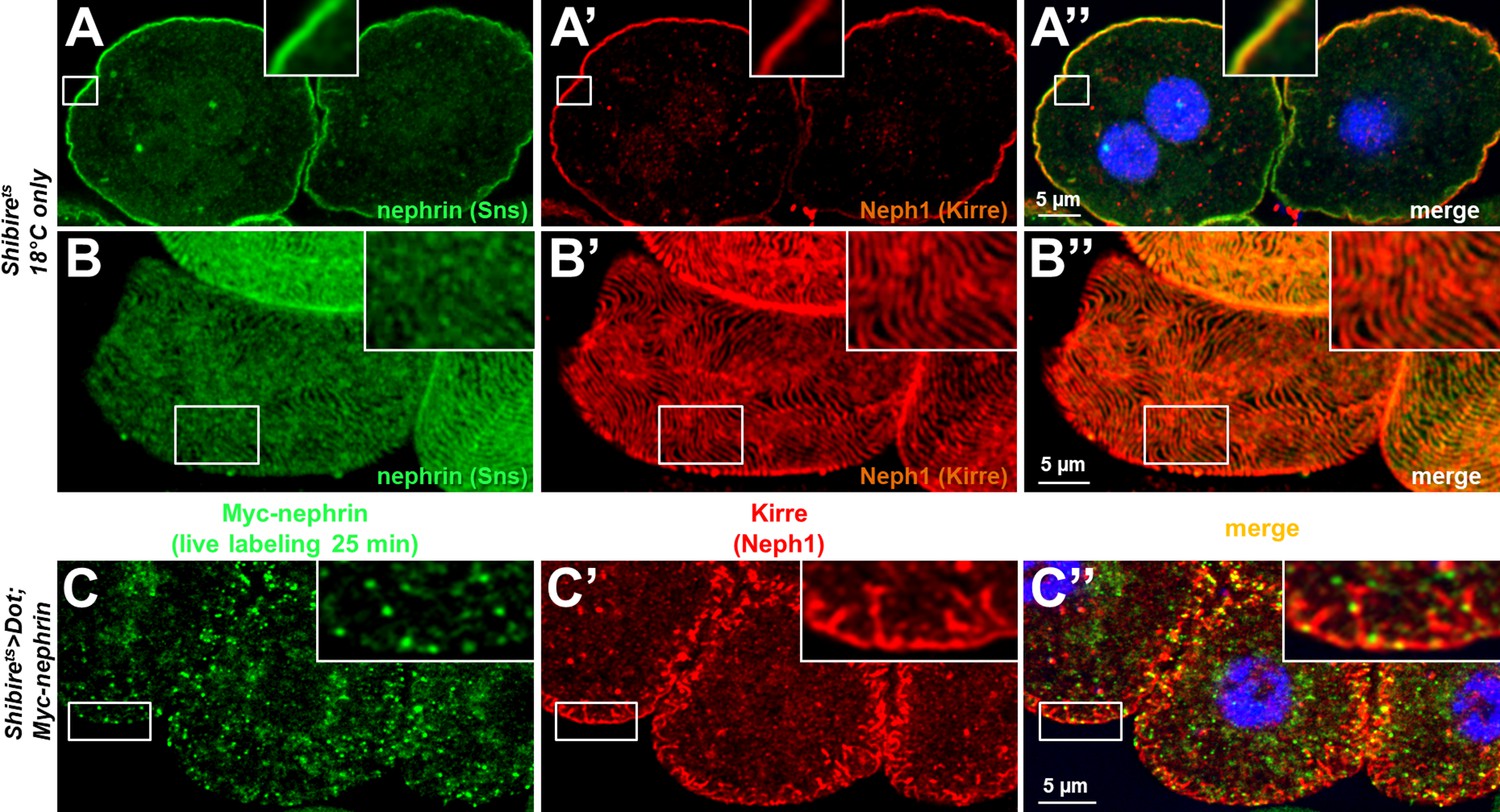
(A–B’’) Nephrocytes carrying the temperature-sensitive allele of shibire show a regular staining pattern at a lower temperature at which the protein remains functional in cross sections (A–A’’) and tangential sections (B–B’’). (C–C’’) A chase time of 120 min after live antibody labeling is shown for the temperature-sensitive allele of shibire with Kirre co-staining. Most of the live labeled nephrin is removed from the cell surface while Kirre indicates a severe mislocalization.
Figure 7 with 1 supplement
Flotillin2-mediated endocytosis is required for nephrin turnover in Drosophila nephrocytes.
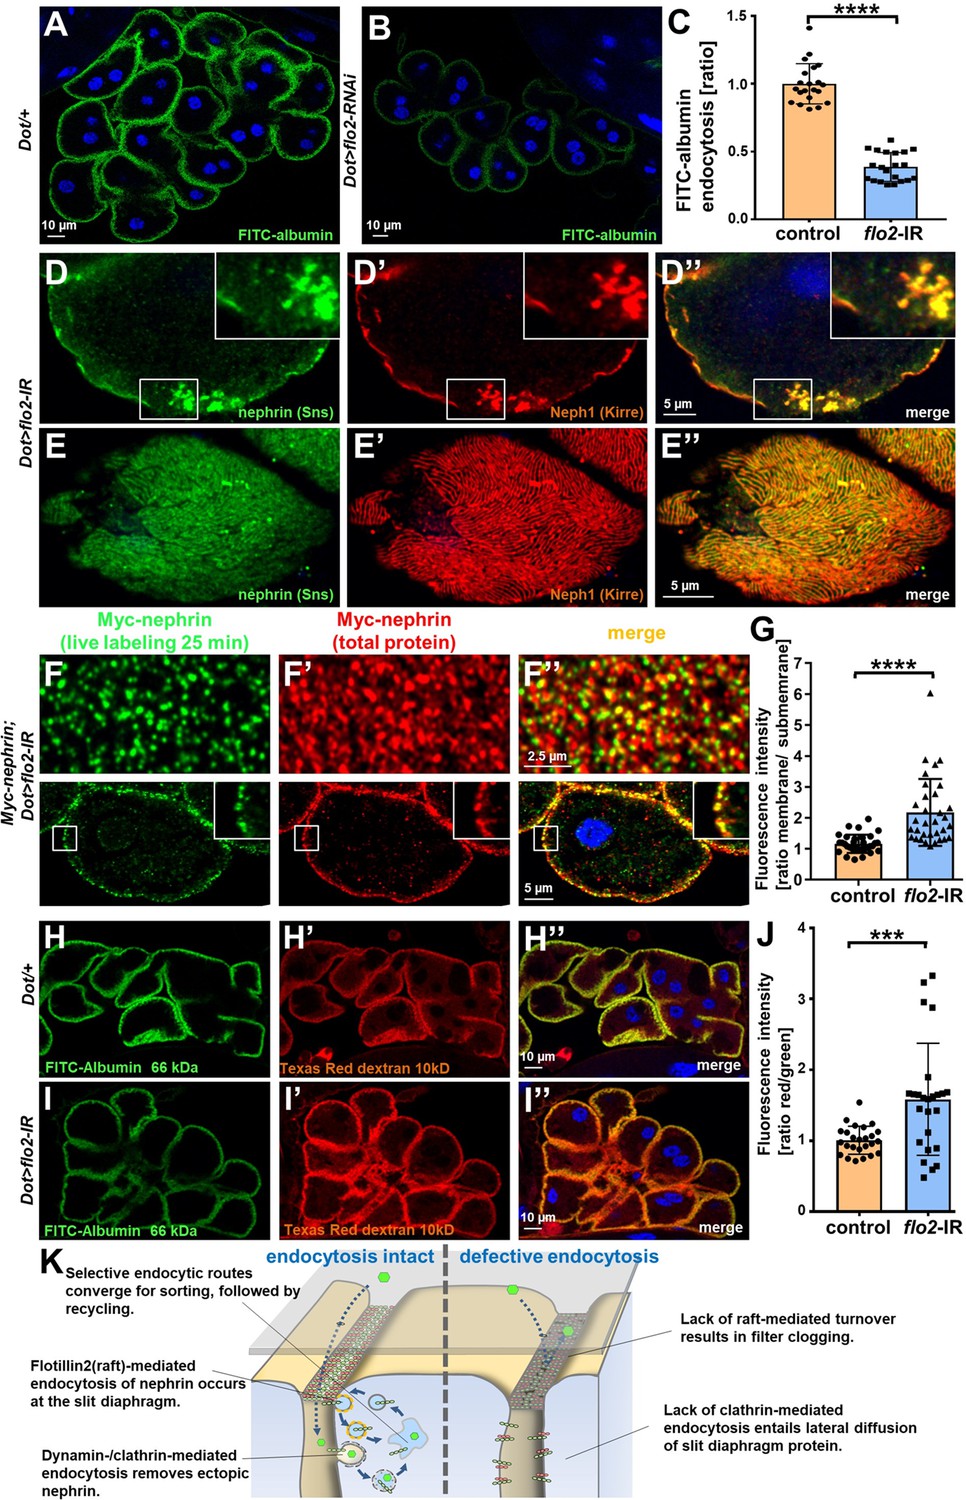
(A–B) Confocal microscopy images of nephrocytes after uptake of FITC-albumin as read-out of nephrocyte function are shown. Control nephrocytes exhibit stronger uptake (A) than nephrocytes expressing flo2-RNAi (B). (C) Quantitation of results analogous to (A–B) in ratio to a control experiment performed in parallel (mean ± standard deviation, n=7 animals per genotype, p<0.0001 for flo2-RNAi). (D–E’’) Confocal images of nephrocytes expressing flo2-RNAi show localized breakdown of slit diaphragms in cross-sectional (D–D’’) and tangential planes (E–E’’). (F–F’’) Confocal microscopy images in tangential sections (upper row) and cross sections (lower row) of nephrocytes are shown after live antibody labeling with 2 hr of chasing. Animals express flo2-RNAi under control of Dorothy-GAL4. Nephrin turnover is strongly reduced compared to control (Figure 5—figure supplement 2A). The diffuse intracellular signal from live labeling was similar to control (Figure 5—figure supplement 2A). (G) Quantitation of results from (F) compared to control experiments. Results are expressed as ratio of the fluorescence intensity between surface and subcortical regions for individual cells (mean ± standard deviation, n=11 animals per genotype, p<0.0001 for flo2-RNAi). (H–I’’) Confocal microscopy images of nephrocytes after simultaneous uptake of FITC-albumin (66 kDa, green) and Texas-Red-Dextran (10 kDa) are shown. Control nephrocytes show significant uptake of both tracers (H–H’’). Silencing of flo2 causes a stronger decrease in the uptake of the larger tracer FITC-albumin compared to smaller Texas-Red-Dextran (I–I’’). (J) Quantitation of fluorescence intensity expressed as a ratio of Texas-Red-Dextran/FITC-albumin (small/large tracer) confirms a disproportionate reduction for flo2-RNAi (mean ± standard deviation, n=9 animals per genotype, p<0.001 for flo2-RNAi). (K) Schematic illustrating the proposed mechanistic role of endocytosis for maintenance of the filtration barrier. Left: Ectopic fly nephrin within the channels is removed by clathrin-dependent endocytosis that returns most of the protein to the surface through recycling pathways. The nephrin that is bound within the slit diaphragm complex is subject to turnover in a shorter circuit that is raft-mediated and feeds into recycling as well. Right: Upon disruption of endocytosis filtration is impaired by clogging of the filter due to lack of cleansing and the architecture of the slit diaphragms is disturbed by unhindered lateral diffusion of slit diaphragm protein.
Figure 7—figure supplement 1

Silencing flotillin2 using a second RNAi line confirms reduced FITC-albumin uptake and altered permeability of the filtration barrier.
(A–D) Silencing of flo2 may result in regular nephrin/Neph1 staining (A–B, using flo2-RNAi 1) or localized breakdown of slit diaphragm (C–D, using flo2-RNAi 2). Nuclei are marked by Hoechst 33342 in blue here and throughout the figure. (E–F) Confocal microscopy image of nephrocytes after uptake of FITC-albumin shows impaired uptake of nephrocytes expressing flo2-RNAi-2 (F) compared to control cells (E). (G) Quantitation of results from (E–F) in ratio to a control experiment performed in parallel (mean ± standard deviation n=8–9 animals per genotype, p<0.05 for flo2-RNAi-2). (H–I’’) Confocal microscopy image of nephrocytes after simultaneous uptake of FITC-albumin (66 kDa, green) and the smaller endocytic tracer Texas-Red-Dextran (10 kDa) are shown. Silencing of flo2 causes a relatively stronger decrease in the uptake of the larger tracer FITC-albumin compared to smaller Texas-Red-Dextran. (J) Quantitation of fluorescence intensity expressed as a ratio of Texas-Red-Dextran/FITC-albumin (small/large tracer) confirms a disproportionate reduction for the larger tracer for flo2-RNAi-2 (mean ± standard deviation, n=8–9 animals per genotype, p<0.001 for flo2-RNAi-2).
Videos
Video 1
Nephrin-GFP in larval nephrocyte tangential section.
A movie obtained by confocal live-cell imaging reveals a stable slit diaphragm pattern in the tangential section. Time stamp indicates elapsed time in minutes.
Video 2
Nephrin-GFP in larval nephrocyte cross section.
Movie obtained by confocal live-cell imaging is shown. No vesicles for bulk transport of nephrin are observed during the observation peroid. Time stamp indicates elapsed time in minutes.
Video 3
Nephrin-GFP in larval nephrocyte upon transient nephrin silencing.
Confocal live-cell imaging of nephrin-GFP nephrocytes 3.5 days after transient silencing of nephrin reveals that reconstitution of slit diaphragms occurs slowly with minor changes during the observation period after ceased RNAi expression. Time stamp indicates elapsed time in minutes.
Video 4
Nephrin-GFP in larval nephrocyte upon acute Rab5 silencing (surface).
Confocal live-cell imaging using is shown. Nephrocytes expressing nephrin-GFP (heterozygously) are recorded after 24 hr of acute Rab5 silencing. Increasing gaps and a progressive reduction of slit diaphragms are observed over the observed period. Cells with a mild phenotype were chosen for live-cell imaging to ensure cellular viability. The nephrin signal in tangential sections appears slightly less blurry compared to endogenous nephrin.
Video 5
Nephrin-GFP in larval nephrocyte upon acute Rab5 silencing (breakdown of slit diaphragms).
Shown is a movie obtained by confocal live-cell imaging. Nephrocytes recorded in a tangential section express nephrin-GFP (heterozygously) concomitant with Rab5-RNAi for 24 hr. Fusion and cluster formation of fly nephrin precedes appearance of growing gaps (D–D’’’).
Video 6
Nephrin-GFP in larval nephrocyte upon acute Rab5 silencing (lateral diffusion).
Confocal live-cell imaging of (heterozygously) nephrin-GFP expressing nephrocyte after 24 hr of Rab5-RNAi expression shows formation of protrusions of slit diaphragm protein from the cell surface followed by formation of vesicles.
Tables
Key resources table
| Reagent type (species) or resource | Designation | Source or reference | Identifiers | Additional information |
|---|---|---|---|---|
| Gene (Drosophila melanogaster) | Nephrin (Sns) | Flybase | FLYB: FBgn0024189 | For simplicity we use the human name |
| Gene (Drosophila melanogaster) | Neph1 (Kirre) | Flybase | FLYB: FBgn0028369 | For simplicity we use the human name |
| Gene (Drosophila melanogaster) | Rab5 | Flybase | FLYB: FBgn0014010 | |
| Gene (Drosophila melanogaster) | Rab7 | Flybase | FLYB: FBgn0015795 | |
| Gene (Drosophila melanogaster) | Rab11 | Flybase | FLYB: FBgn0015790 | Transgenic animals |
| Gene (Drosophila melanogaster) | Shibire (Shi) | Flybase | FLYB: FBgn0003392 | Transgenic animals |
| Gene (Drosophila melanogaster) | Flotillin 2 (Flo2) | Flybase | FLYB: FBgn0264078 | Transgenic animals |
| Strain, strain background (Drosophila melanogaster) | Nephrin-RNAi (Sns-RNAi) | VDRC | VDRC #109442 | Transgenic animals |
| Strain, strain background (Drosophila melanogaster) | Nephrin-RNAi-2 (Sns-RNAi-2) | BDSC | BDSC #64872 | Transgenic animals |
| Strain, strain background (Drosophila melanogaster) | UAS-Rab5-RNAi | BDSC | BDSC #34832 | Transgenic animals |
| Strain, strain background (Drosophila melanogaster) | UAS-Rab5S43N | BDSC | BDSC #42704 | Transgenic animals, dominant negative variant |
| Strain, strain background (Drosophila melanogaster) | UAS-YFP-Rab5Q88L | BDSC | BDSC #9774 | Transgenic animals, constitutively active variant |
| Strain, strain background (Drosophila melanogaster) | UAS-Rab7-RNAi | BDSC | BDSC #27051 | Transgenic animals |
| Strain, strain background (Drosophila melanogaster) | UAS-YFP-Rab7T22N | BDSC | BDSC #9778 | Transgenic animals, dominant negative variant |
| Strain, strain background (Drosophila melanogaster) | UAS-Rab11-RNAi | BDSC | BDSC #42709 | Transgenic animals |
| Strain, strain background (Drosophila melanogaster) | UAS-flo2-RNAi | BDSC | BDSC #40833 | Transgenic animals |
| Strain, strain background (Drosophila melanogaster) | UAS-flo2-RNAi-2 | VDRC | VDRC #330316 | Transgenic animals |
| Strain, strain background (Drosophila melanogaster) | Shibirets | BDSC | BDSC #2248 | Temperature-sensitive allele |
| Strain, strain background (Drosophila melanogaster) | Dorothy-GAL4 | BDSC | BDSC #6903 | Transgenic, GAL4-dependent expression in nephrocytes |
| Strain, strain background (Drosophila melanogaster) | prospero-GAL4 | Weavers et al., 2009 (PubMed-ID: 18971929) | Promoter derived from: FLYB: FBgn0004595 | Transgenic, GAL4-dependent expression in nephrocytes |
| Strain, strain background (Drosophila melanogaster) | UAS-GFP-RNAi | BDSC | BDSC #41553 | Transgenic animals, control-RNAi |
| Strain, strain background (Drosophila melanogaster) | nephrin-GFP | This work | Edited gene: FLYB: FBgn0024189 | Insertion of GFP into the c-terminus of sns, (genomic) |
| Strain, strain background (Drosophila melanogaster) | Myc-nephrin | This work | Edited gene: FLYB: FBgn0024189 | Insertion of Myc into exon 2 of sns (genomic) |
| Antibody | anti-Sns (nephrin, rabbit polyclonal) | Bour et al., 2000 (PubMed-ID: 10859168) | Target: FLYB: FBgn0024189 | 1:300 for IF |
| Antibody | anti-Kirre (Neph1, guinea pig, polyclonal) | Galletta et al., 2004 (PubMed-ID: 15511638) | Target: FLYB: FBgn0028369 | 1:200 for IF |
| Antibody | anti-Rab5 (rabbit, polyclonal) | Abcam | ab18211 | 1:200 for IF |
| Antibody | anti-Rab7 (mouse, monoclonal) | DSHB | Rab7 | 1:100 for IF |
| Antibody | anti-Myc (mouse, monoclonal) | DSHB | 9E10 | 1:100 for IF |
| Antibody | anti-Myc (mouse, monoclonal) | Santa Cruz Biotechnology | sc-40 | 1:100 for IF |
| Antibody | anti-RAB11 (rabbit, monoclonal) | Cell Signaling Technology | 5589S | 1:100 for IF |
| Antibody | Alexa Fluor 488 anti-rabbit, (donkey, polyclonal) | Thermofisher | #A-21206 | 1:200 for IF, secondary antibody |
| Antibody | Alexa Fluor 488 anti-mouse (donkey, polyclonal) | Thermofisher | #A32766 | 1:200 for IF, secondary antibody |
| Antibody | Alexa Fluor 568 anti-rabbit (donkey, polyclonal) | Thermofisher | #A10042 | 1:200 for IF, secondary antibody |
| Antibody | Alexa Fluor 568 anti-mouse (donkey, polyclonal) | Thermofisher | #A10037 | 1:200 for IF, secondary antibody |
| Antibody | Alexa Fluor 568 anti-guinea pig (goat, polyclonal) | Thermofisher | #11075 | 1:200 for IF, secondary antibody |
| Commercial assay or kit | In Situ Cell Death Detection Kit | Sigma/Roche | 11684795910 | TUNEL labeling |
| Chemical compound, drug | FITC-albumin | Sigma/Merck | A9771 | Final conc.: 0.2 mg/ml |
| Chemical compound, drug | Texas-Red-Dextran | Thermofisher | D1863 | Final conc.: 0.2 mg/ml |
| Chemical compound, drug | Texas-Red-Avidin | Thermofisher | A2348 | Final conc.: 0.2 mg/ml |
| Chemical compound, drug | Alexa 488 wheat germ agglutinin | Thermofisher | W11261 | Final conc.: 0.2 mg/ml |
| Chemical compound | Roti-Mount | Carl Roth | HP19.1 | For mounting |
| Chemical compound, drug | Hoechst 33342 | Thermofisher | H1399 | 1:1000 for IF |
| Chemical compound, drug | Bafilomycin | Invivogen | tlrl-baf1 | Final conc.: 0.1 µM |
| Chemical compound, drug | Methyl-β-cyclodextrin | Sigma-Aldrich/Merck | 332615 | Final conc.: 10 mM |
| Chemical compound,drug | Low-melting-agarose | Carl Roth | #6351.5 | Final use: 1% agarose |
| Chemical compound, drug | Schneider’s insect medium | Sigma-Aldrich/Merck | #S0146 | |
| Chemical compound, drug | Triton X-100 | Sigma-Aldrich/Merck | #9036-19-5 | Final conc.: 0.1% in PBS |
| Software, algorithm | GraphPad Prism | GraphPad Inc | GraphPad Prism 9.3.1 | |
| Software, algorithm | Fiji/ImageJ | Open source | ImageJ 2.1.0/1.53c | |
| Software, algorithm | GIMP | Open source | GIMP 2.10 |
Additional files
-
MDAR checklist
- https://cdn.elifesciences.org/articles/79037/elife-79037-mdarchecklist1-v2.docx
-
Reporting standard 1
ARRIVE Essential 10.
- https://cdn.elifesciences.org/articles/79037/elife-79037-repstand1-v2.pdf
Download links
A two-part list of links to download the article, or parts of the article, in various formats.
Downloads (link to download the article as PDF)
Open citations (links to open the citations from this article in various online reference manager services)
Cite this article (links to download the citations from this article in formats compatible with various reference manager tools)
Selective endocytosis controls slit diaphragm maintenance and dynamics in Drosophila nephrocytes
eLife 11:e79037.
https://doi.org/10.7554/eLife.79037


