Defining cellular population dynamics at single-cell resolution during prostate cancer progression
- Division of Human Biology, Fred Hutchinson Cancer Center, United States
- University of Washington Molecular and Cellular Biology Program, United States
- Division of Vaccine and infectious Diseases, Fred Hutchinson Cancer Center, United States
- Division of Public Health Sciences, Translational Research Program, Fred Hutchinson Cancer Center, United States
- Laboratory of Genitourinary Cancer Pathogenesis, Center for Cancer Research, National Cancer Institute, NIH, United States
- Division of Hematology/Oncology, Department of Medicine, University of California, San Francisco, United States
- Department of Pathology and Laboratory Medicine, Weill Cornell Medicine, United States
- Center for Data Visualization, Fred Hutchinson Cancer Center, United States
- University of Washington Departments of Medicine and Genome Sciences, United States
- Translational Data Science Integrated Research Center, Fred Hutchinson Cancer Center, United States
- Division of Basic Sciences, Fred Hutchinson Cancer Center, United States
Figures
Figure 1 with 2 supplements
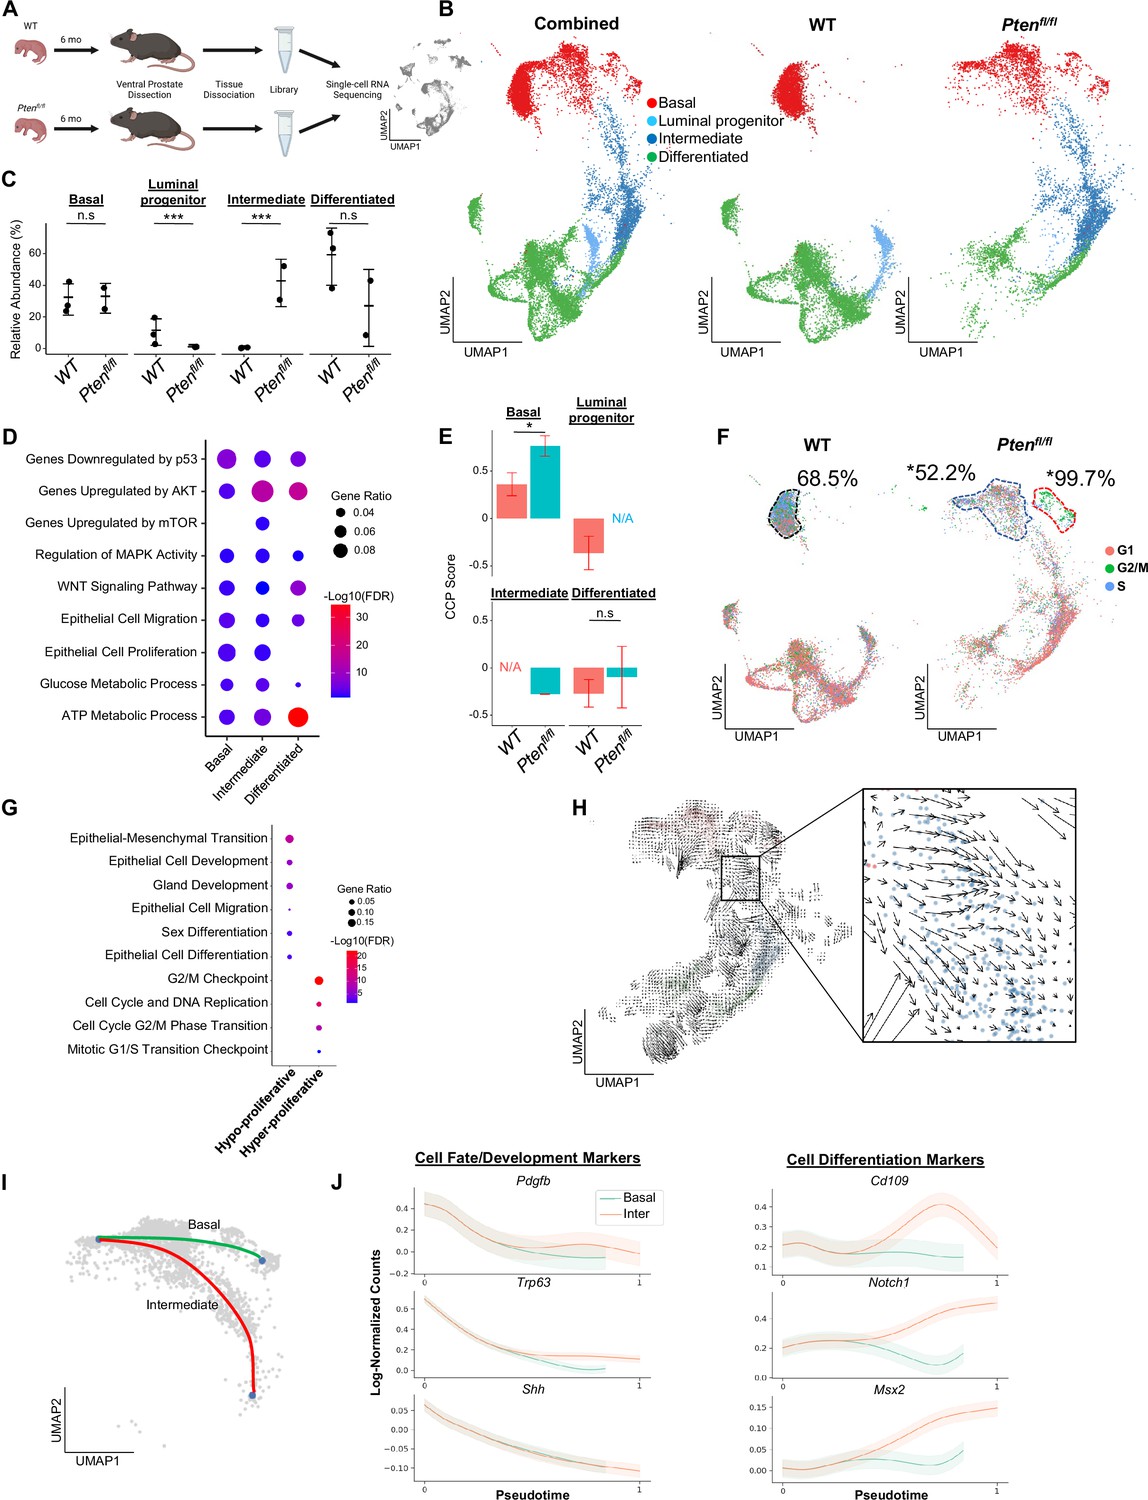
Proliferative split in basal cancer cells enables expansion of intermediate cells.
(A) Simplified schematic of single-cell RNA sequencing of WT and Ptenfl/fl ventral prostates. (B) UMAP of WT and Ptenfl/fl epithelial cells. Left, both conditions superposed; middle, WT only; right, Ptenfl/fl only. Epithelial cell types are demarcated by color (red = basal, light blue = luminal progenitor, dark blue = intermediate, green = differentiated). (C) Relative abundance of epithelial cells in WT (n=3) and Ptenfl/fl (n=2) mice. Y-axis shows the % composition of each sample by cell type (***p<0.001, negative binomial test). Data presented as +/-SD. (D) Top GSEA results enriched in Ptenfl/fl compared to WT for each epithelial subtype. Intermediate cells in Ptenfl/fl were compared to luminal progenitor cells in WT. All pathways are enriched with FDR <0.05. (E) Proliferation signature (CCP) composite score in epithelial cells, clustered by condition (Data presented as +/-SD, *p<0.05, n.s.=not significant, permutation test). N/A indicates missing data due to no cells being present in the condition. WT n=3, Ptenfl/fl n=2. (F) UMAP visualization of cell cycle phase assignment per cell, showing % cells in non-G1 (S or G2/M) (black border = WT basal cells, blue border = hypo-proliferative basal cells in Ptenfl/fl, and red border = hyper-proliferative basal cells in Ptenfl/fl. *p<0.05, chi-square test). (G) GSEA between hyper- and hypo-proliferative basal clusters in Ptenfl/fl. All pathways are enriched with FDR <0.05. (H) RNA velocity analysis of Ptenfl/fl epithelial cells; highlighted section shows intersection of basal and intermediate cells. (I) Pseudotime trajectories drawn by Palantir through the basal and intermediate compartments, with hypo-proliferating basal cells as the designated start point. (J) Expression of important cell fate and differentiation regulators along basal-intermediate trajectory.
Figure 1—figure supplement 1
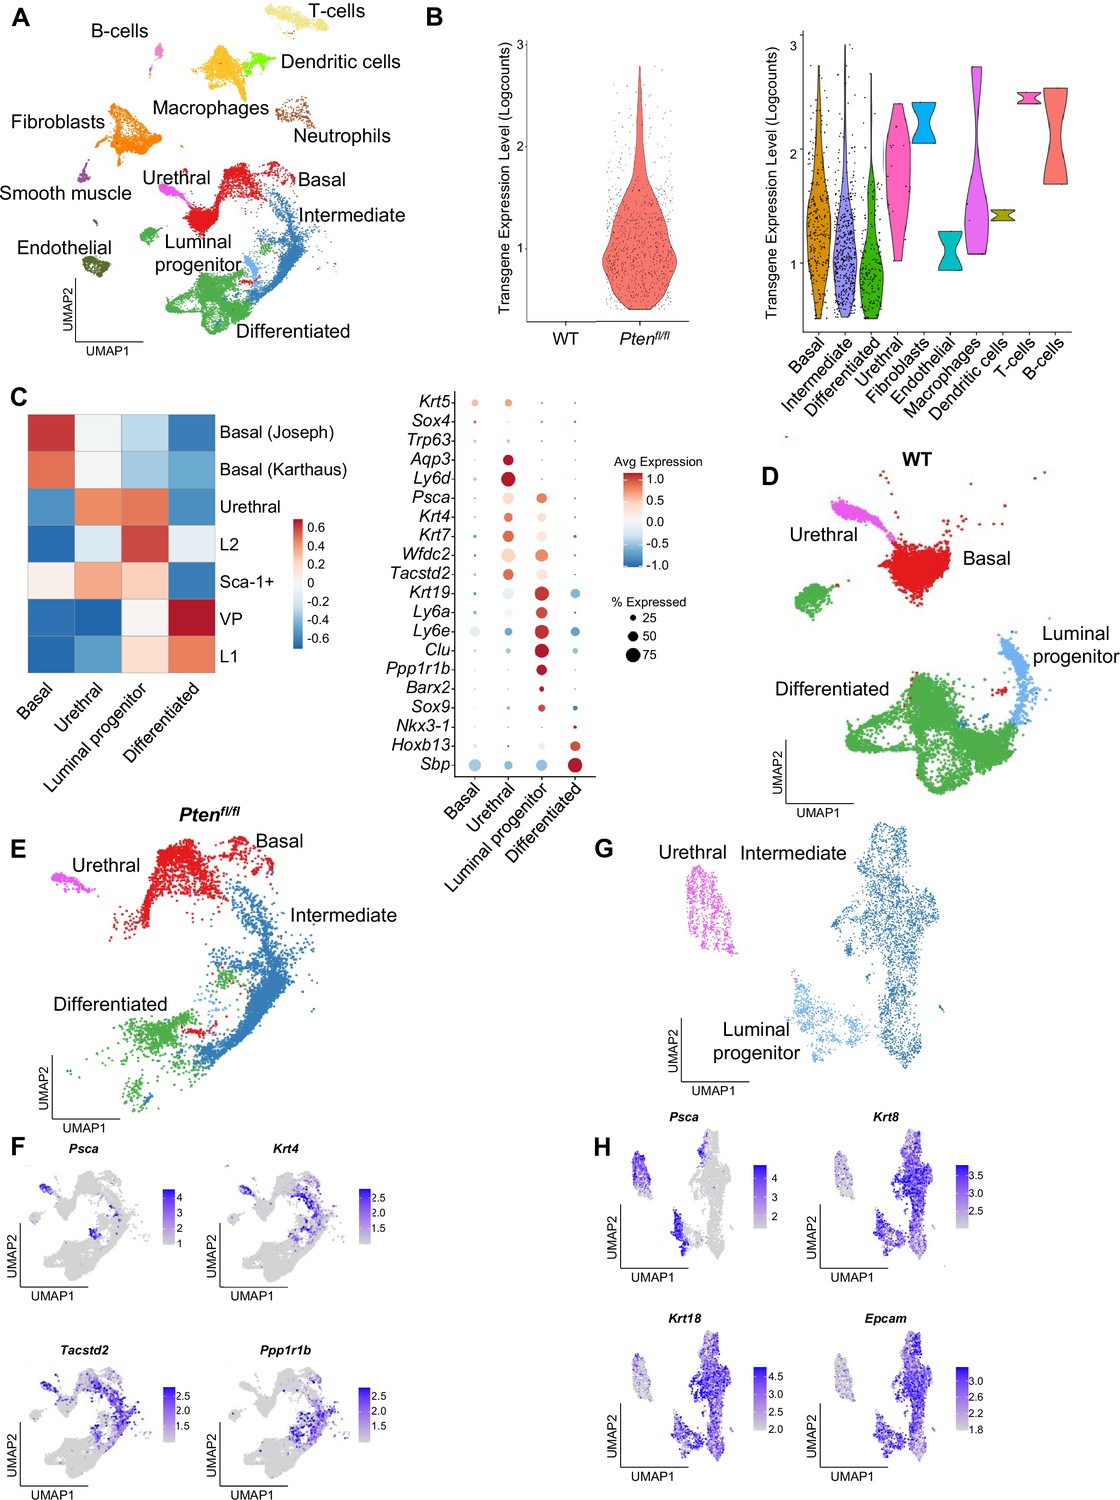
Epithelial cells contain published subtypes and urethral cells.
(A) UMAP visualization of all cells in WT and Ptenfl/fl ventral prostates, colored and labeled by cell ID. (B) Violin plots of rtTA-eGFP transgene expression. Left, transgene expression in WT and Ptenfl/fl mice. Right, expression in Ptenfl/fl cell types. (C) Heatmap of composite scores of published prostate epithelial subtype signatures in basal, urethral, luminal progenitor, and differentiated cells in WT mice (left). Dot plot of epithelial biomarker gene expression in WT mice (right). (D) UMAP visualization of epithelial cells in WT prostates, colored and labeled by cell ID. (E) UMAP visualization of epithelial cells in Ptenfl/fl prostates, colored and labeled by cell ID. (F) UMAP visualization of published intermediate cell biomarkers in WT and Ptenfl/fl mice. (G) UMAP visualization of urethral, luminal progenitor, and intermediate cells in WT and Ptenfl/fl mice, colored and labeled by cell ID. (H) UMAP visualization of Psca, pan-epithelial and luminal biomarkers in urethral, luminal progenitor, and intermediate cells in WT and Ptenfl/fl mice.
Figure 1—figure supplement 2
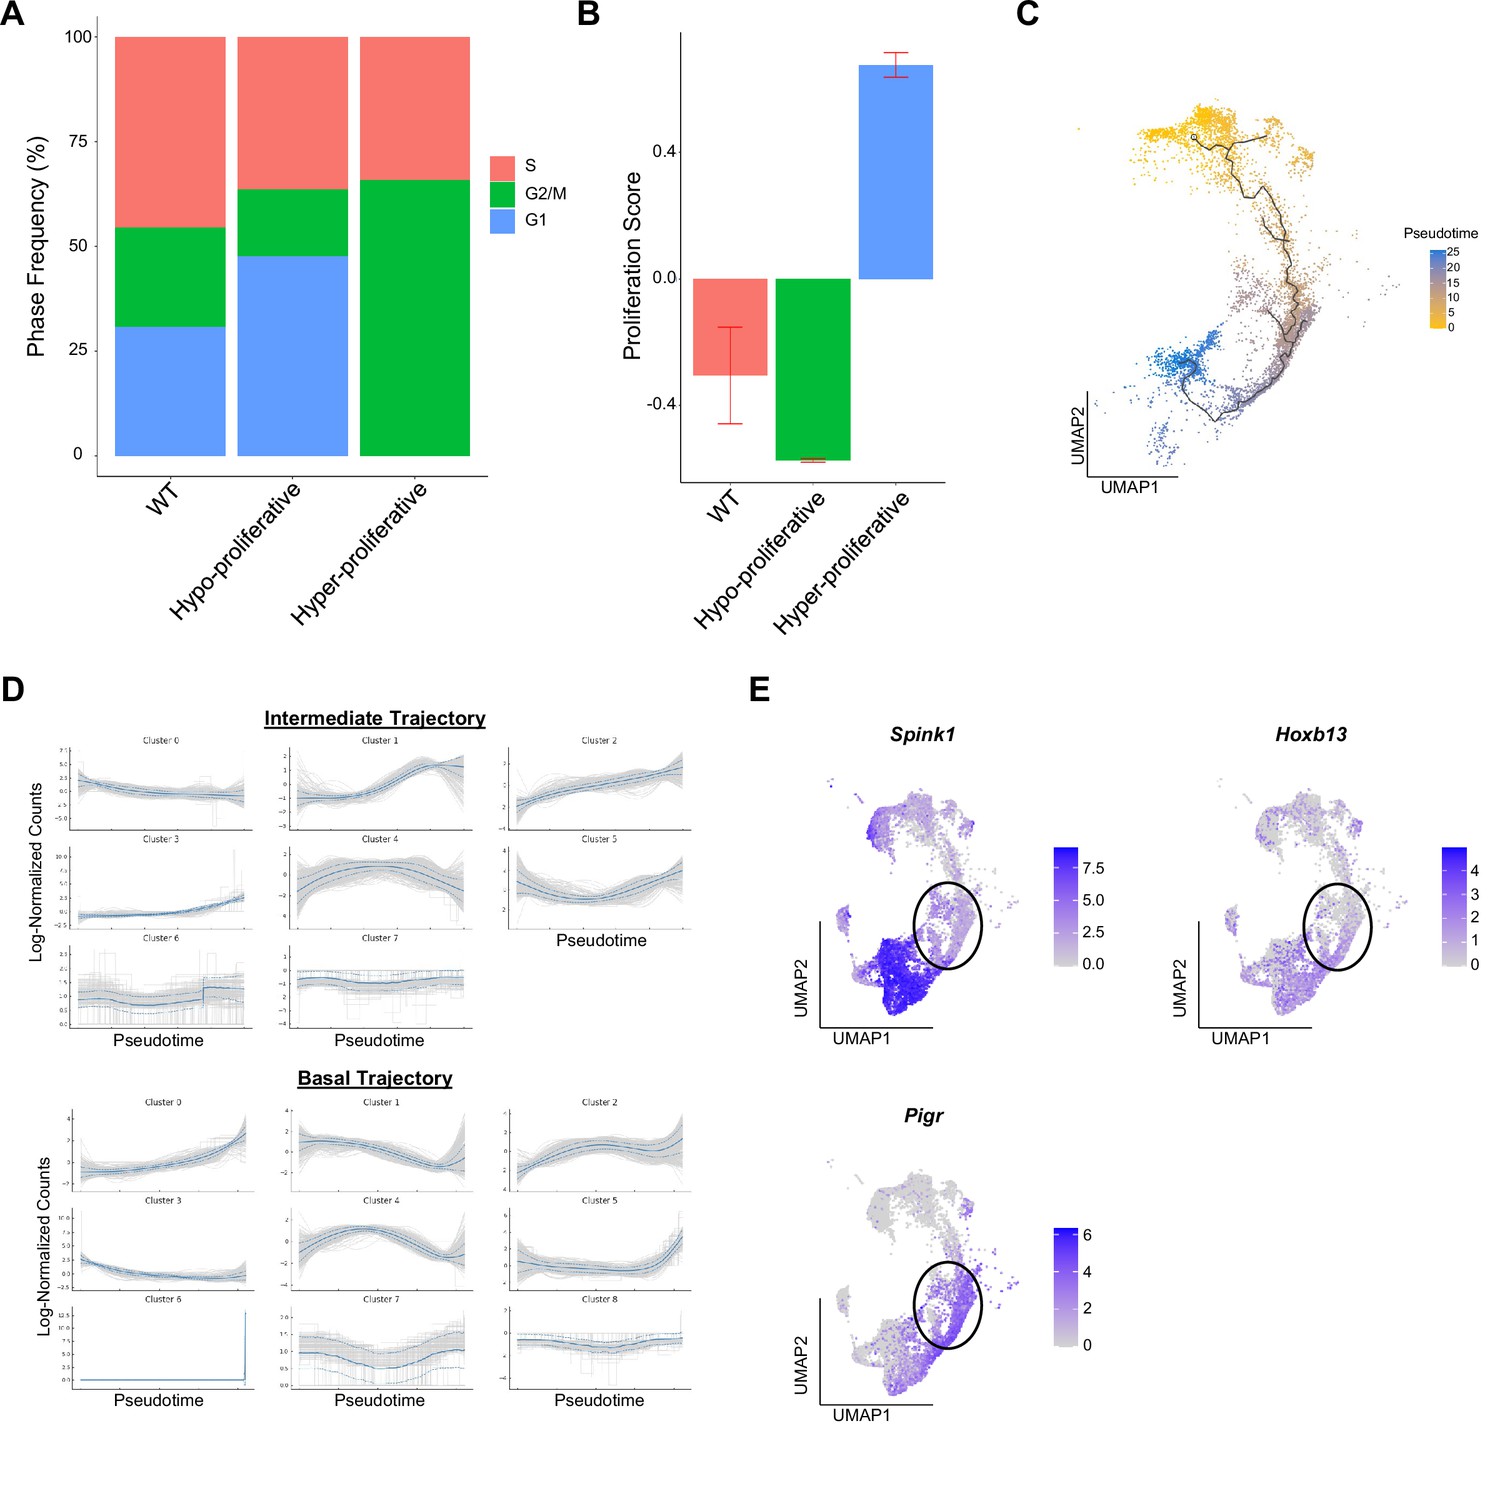
Basal proliferation is subset-specific and intermediate cells express luminal markers.
(A) Bar plot of cell cycle phase assignments in WT basal cells and Ptenfl/fl hyper- and hypo-proliferative basal cells. (B) Bar plot of CCP signature composite score in WT (n=3) basal cells and Ptenfl/fl (n=2) hyper- and hypo-proliferative basal cells (Data presented as +/-SD). (C) Trajectory analysis of Ptenfl/fl epithelial cells. (D) Top 3000 highly variable genes in Ptenfl/fl basal and intermediate cells, clustered by expression pattern along the basal-intermediate (top) or hypo-proliferative basal-hyper-proliferative basal (bottom) trajectories drawn via Palantir (Figure 1I). (E) UMAP visualization of luminal biomarkers in epithelial cells in WT and Ptenfl/fl mice. Black circles indicate luminal-intermediate transition zone.
Figure 2 with 1 supplement
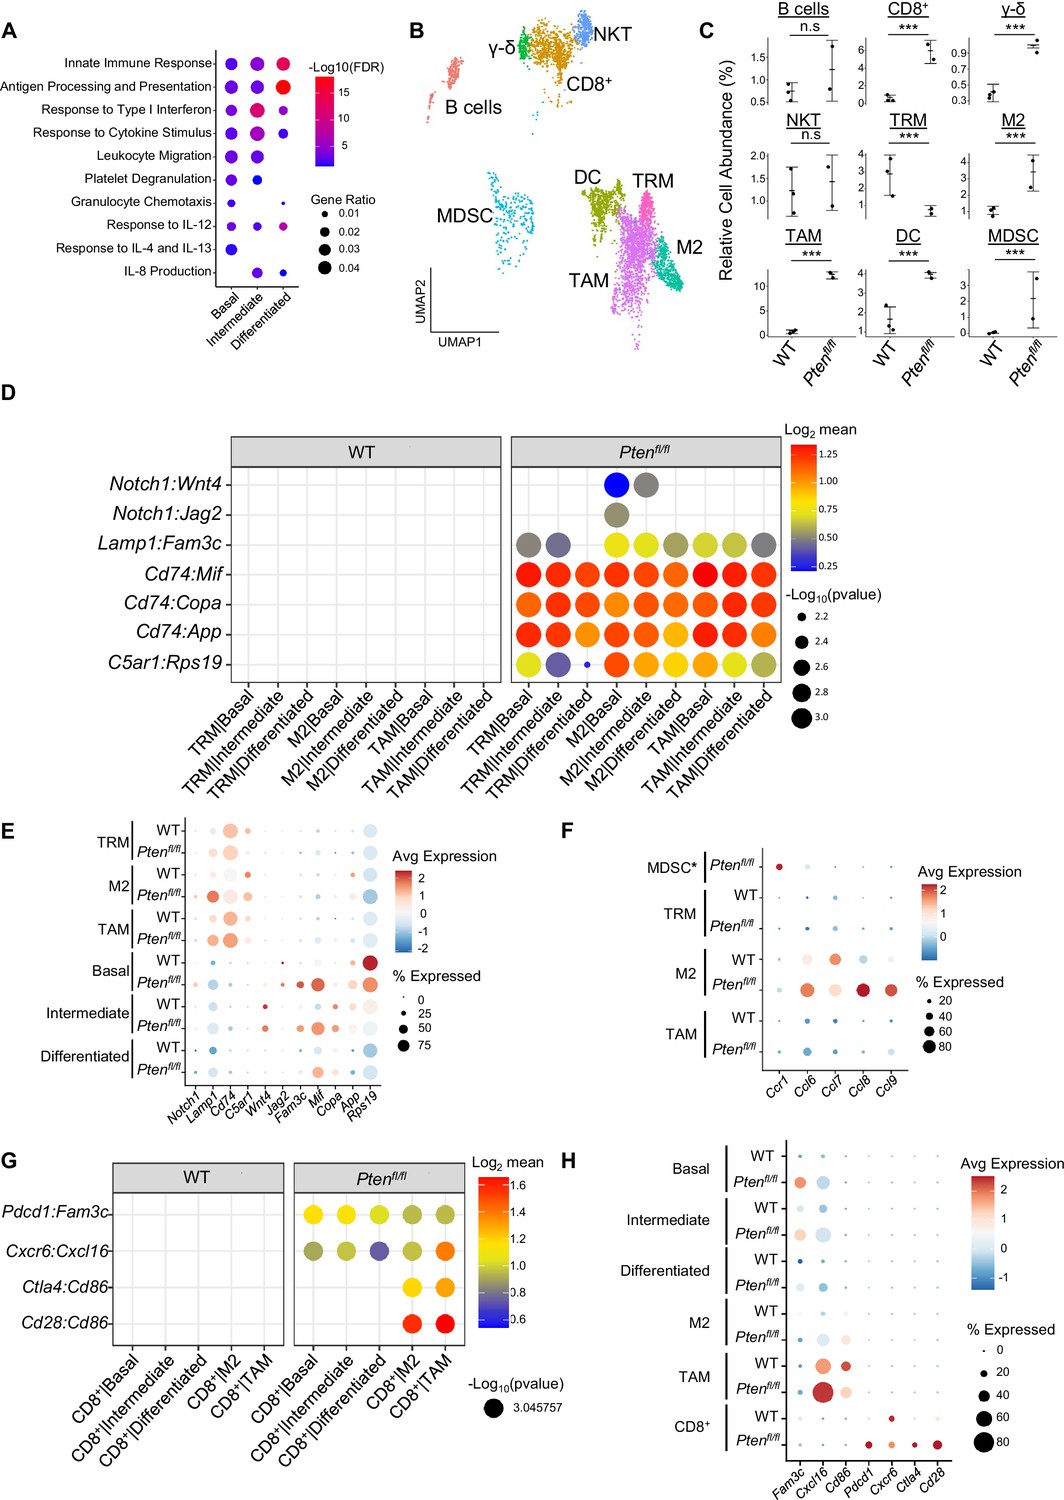
Immune recruitment in Ptenfl/fl prostates is mediated by both epithelial and immune cell signaling.
(A) Top immune-related GSEA results enriched in Ptenfl/fl compared to WT mice for each epithelial subtype. All pathways are enriched with FDR <0.05. (B) UMAP visualization of immune cells labeled by cell subtype or state. (C) Relative abundance of immune cells in WT (n=3) and Ptenfl/fl (n=2) mice. Y-axis shows the % composition of each sample by cell type (Data presented as +/-SD, ***p<0.001, n.s.=not significant, negative binomial test). (D) Dot plot of signaling interactions between macrophages and epithelial cells. Y-axis, ligand-receptor pairs from CellphoneDB database. X-axis, cell-cell pairings. Interactions are directional: the first gene in a pair is expressed in the first cell in the cell-cell interaction. (E) Dot plot of epithelial ligand and macrophage receptor gene expression in WT and Ptenfl/fl mice. (F) Dot plot of Ccr1 and Ccr1 ligand expression in MDSCs and macrophages in WT and Ptenfl/fl ventral prostates. MDSCs are only present in Ptenfl/fl and therefore do not have a WT row (denoted by asterisk). (G) Plot of signaling interactions between CD8 +T cells and epithelial cells and macrophages. (H) Dot plot of CD8+ T cell receptors and epithelial and macrophage ligand gene expression in WT and Ptenfl/fl ventral prostates.
Figure 2—figure supplement 1
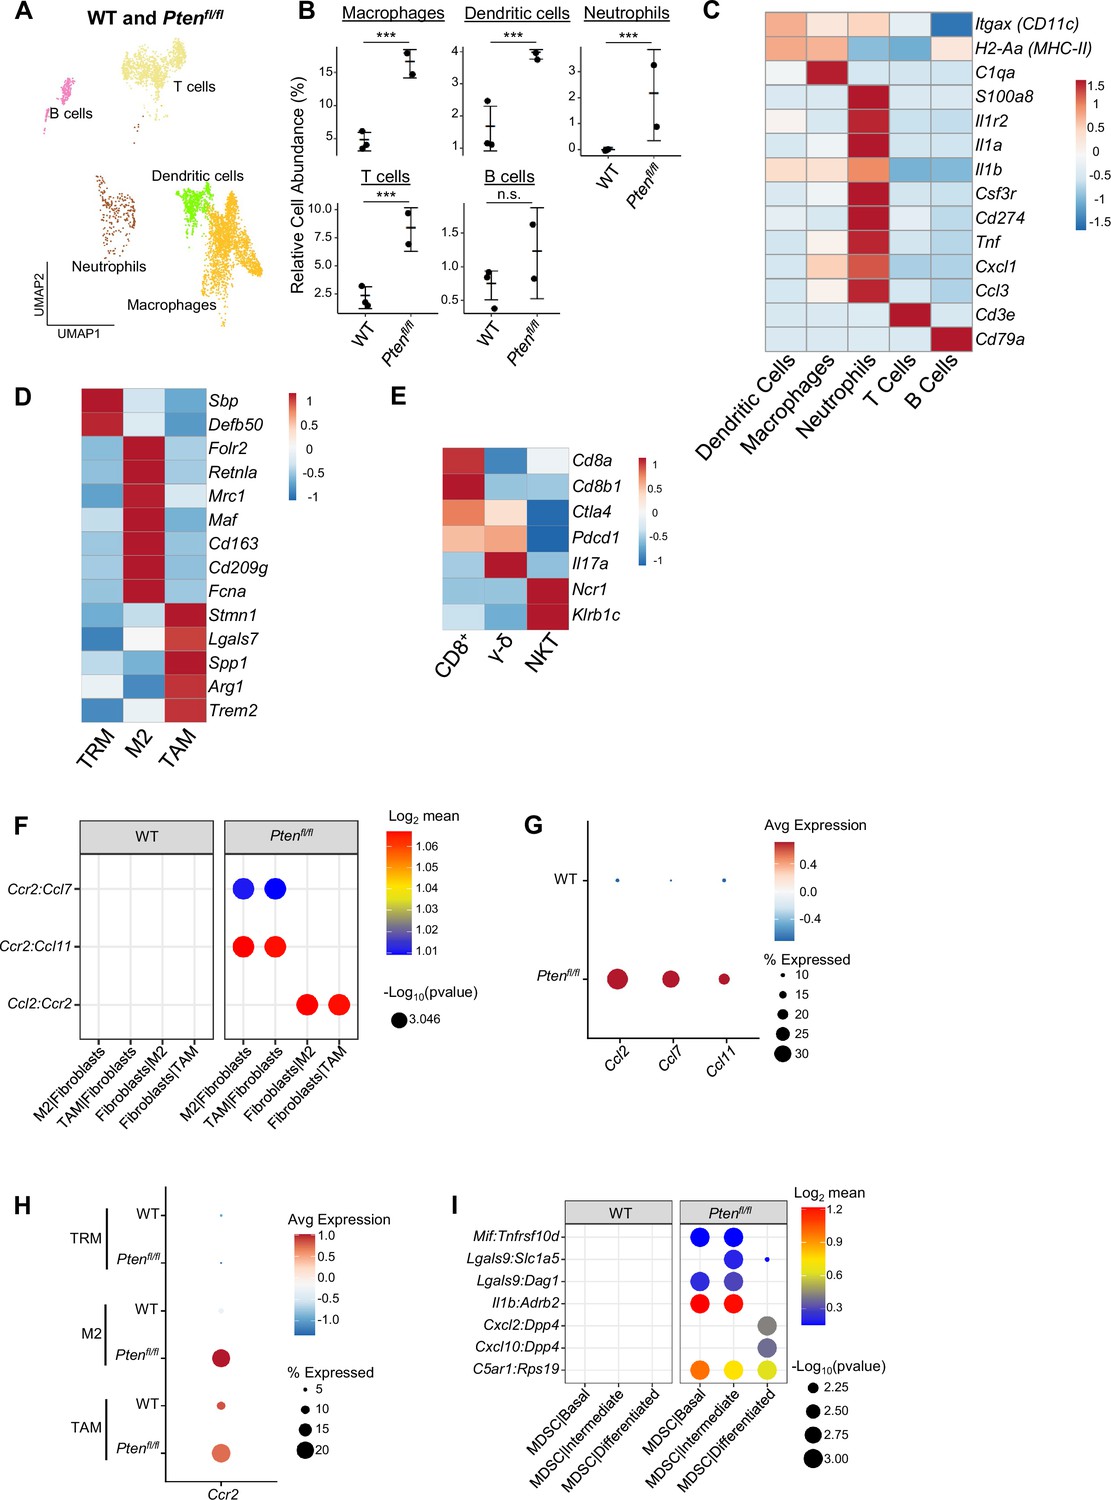
Immune cells contain pro-tumorigenic subtypes and macrophages are recruited by fibroblast signaling.
(A) UMAP of immune cells in WT and Ptenfl/fl prostates, labeled by cell types. (B) Relative abundance of immune cell types in WT (n=3) and Ptenfl/fl (n=2) mice (***p<0.001, n.s.=not significant, negative binomial regression test). (C) Heatmap of immune cell type biomarker expression in WT and Ptenfl/fl mice; neutrophil cells express MDSC markers. Log-transformed read counts. (D) Heatmap of marker expression in macrophage cell subtypes. Log-transformed read counts. (E) Heatmap of marker expression in T cell subtypes. Log-transformed read counts. (F) Plot of ligand-receptor interactions between fibroblast and macrophage subtypes. (G) Dot plot of Ccr2 ligand expression in fibroblasts in WT and Ptenfl/fl ventral prostates. (H) Dot plot of Ccr2 expression in macrophage subtypes in WT and Ptenfl/fl ventral prostates. (I) Dot plot of signaling interactions between epithelial cells and MDSCs.
Figure 3 with 1 supplement
Intermediate cells are primed for survival and diversification in the context of castration.
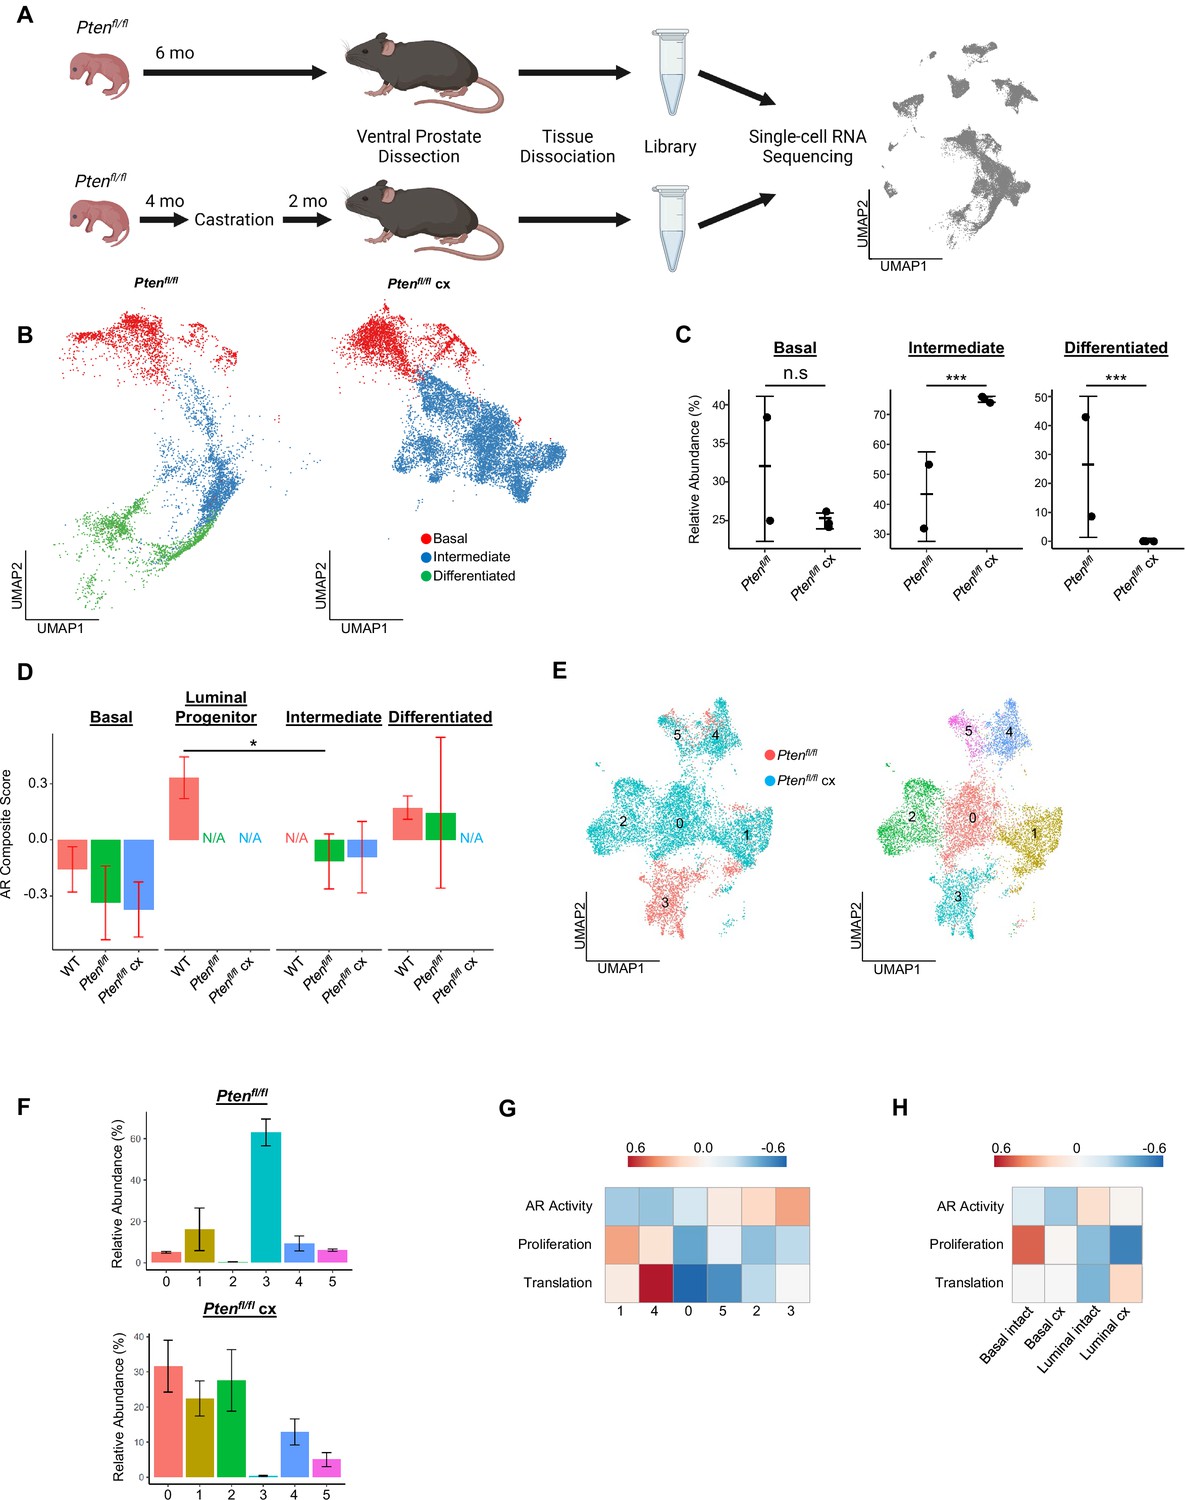
(A) Simplified schematic of setup for single-cell sequencing of Ptenfl/fl intact and Ptenfl/fl castrated (cx) ventral prostates. (B) Split UMAP visualizations of Ptenfl/fl and Ptenfl/fl cx epithelial cells. (C) Relative abundance of epithelial cells in Ptenfl/fl intact (n=2) and cx (n=3) prostates. Y-axis shows the % composition of each sample by cell type (Data presented as +/-SD, ***p<0.001, n.s.=not significant, negative binomial test). (D) Androgen Receptor (AR) gene signature composite score in epithelial cells, clustered by condition (Data presented as +/-SD, *p<0.05, permutation test). N/A indicates missing data due to no cells being present in the condition. WT n=3, Ptenfl/fl intact n=2, Ptenfl/fl cx n=3. (E) UMAP visualization of intermediate cells in Ptenfl/fl intact and cx prostates. Left, colored by condition; right, colored by clusters 0–5. (F) Relative abundance of intermediate clusters. Top, intact Ptenfl/fl(n=2); bottom, Ptenfl/fl cx (n=3) (Data presented as +/-SD). (G) Heatmap of composite score for AR, CCP, and Reactome translation gene signatures in intermediate clusters. (H) Heatmap of composite score for AR, CCP, and Reactome translation gene signatures in WT intact and castrate basal and luminal cells.
Figure 3—figure supplement 1
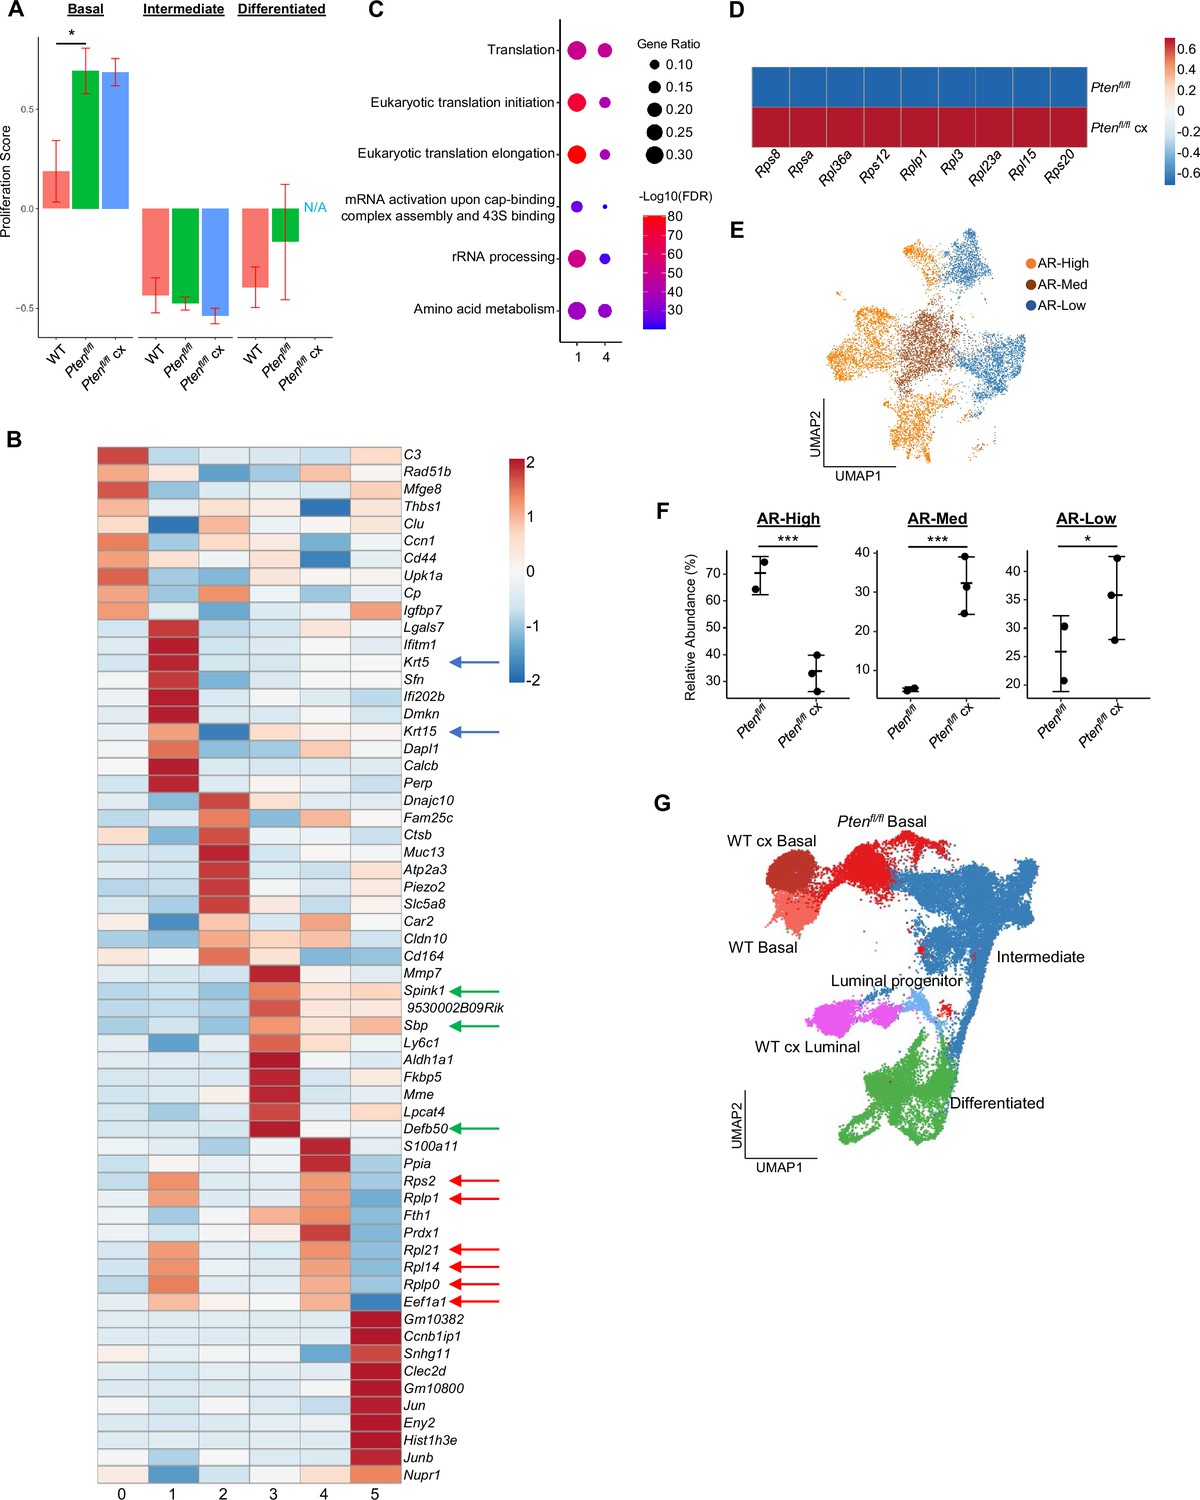
Castration-resistant intermediate cells are phenotypically diverse.
(A) Composite score of CCP signature in WT, Ptenfl/fl intact, and Ptenfl/fl cx epithelial cells (Data presented as +/-SD, *p<0.05, permutation test) (B) Heatmap of top differentially expressed genes across intermediate clusters 0–5. Blue arrows, basal markers; green arrows, AR-dependent genes; red arrows, ribosomal or translation machinery genes. (C) Top GSEA results for genes upregulated in intermediate clusters 1 and 4. All pathways are enriched with FDR <0.05. (D) Heatmap of ribosomal gene expression in basal cells in Ptenfl/fl intact and Ptenfl/fl cx mice. (E) UMAP visualization of AR signaling status in intermediate cells in Ptenfl/fl intact and Ptenfl/fl cx mice. (F) Relative abundance of intermediate cells with high, medium, or low AR signaling in Ptenfl/fl intact (n=2) and Ptenfl/fl cx (n=3) mice (Data presented as +/-SD, *p<0.05, ***p<0.001, negative binomial regression test). (G) UMAP visualization of epithelial cells in WT intact, WT cx, Ptenfl/fl intact, and Ptenfl/fl cx mice, colored and labeled by cell ID.
Figure 4 with 1 supplement
Intermediate cells are enriched for a signature of treatment resistance that correlates with advanced human disease.
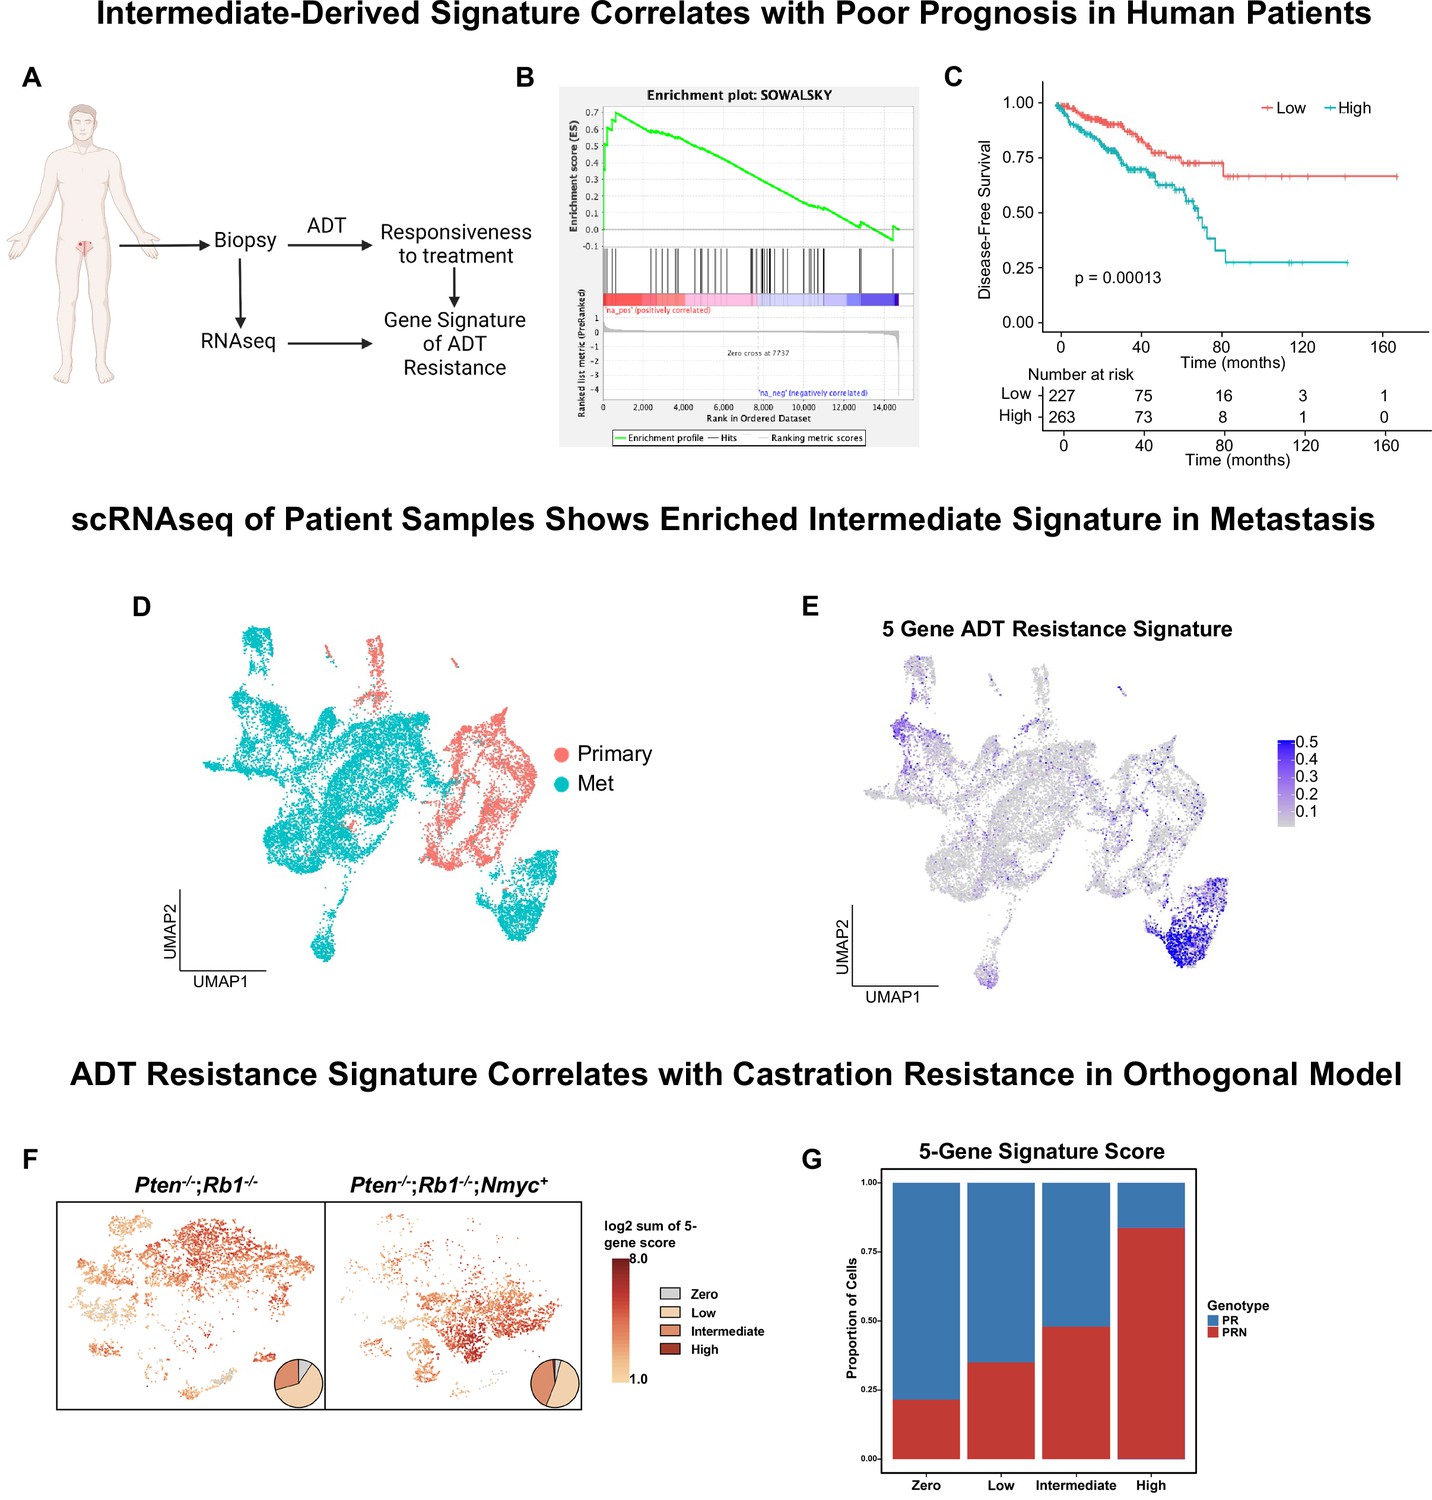
(A) Diagram of clinical trial used to establish gene signature of androgen deprivation treatment resistance (NCT02430480). (B) Enrichment plot of ADT resistance gene signature relative to intermediate cell DEGs between Ptenfl/fl and Ptenfl/fl cx (adjusted p-value = 0.00381). (C) Kaplan-Meier curve of disease-free survival for prostate cancer patients in TCGA database with or without high RNA expression of top correlated genes from B. Red line, patients with normal expression of all genes; blue line, patients with expression of at least 1 gene with TPM (transcripts per million) in the 80th percentile or above. (D) UMAP of tumor cells from human patient samples. Red, primary cancer; blue, metastatic cancer. (E) UMAP visualization of per-cell computed score for 5-gene signature from (B-C) in human cancer samples. (F) UMAP visualization of per-cell computed score for 5-gene signature from (B-C) in PR and PRN mouse models. Pie charts indicate proportion of cells with zero, low, intermediate, or high signature scores. (G) Stacked bar chart showing proportion of cells from PR or PRN mice in each scoring category for the 5-gene signature.
Figure 4—figure supplement 1
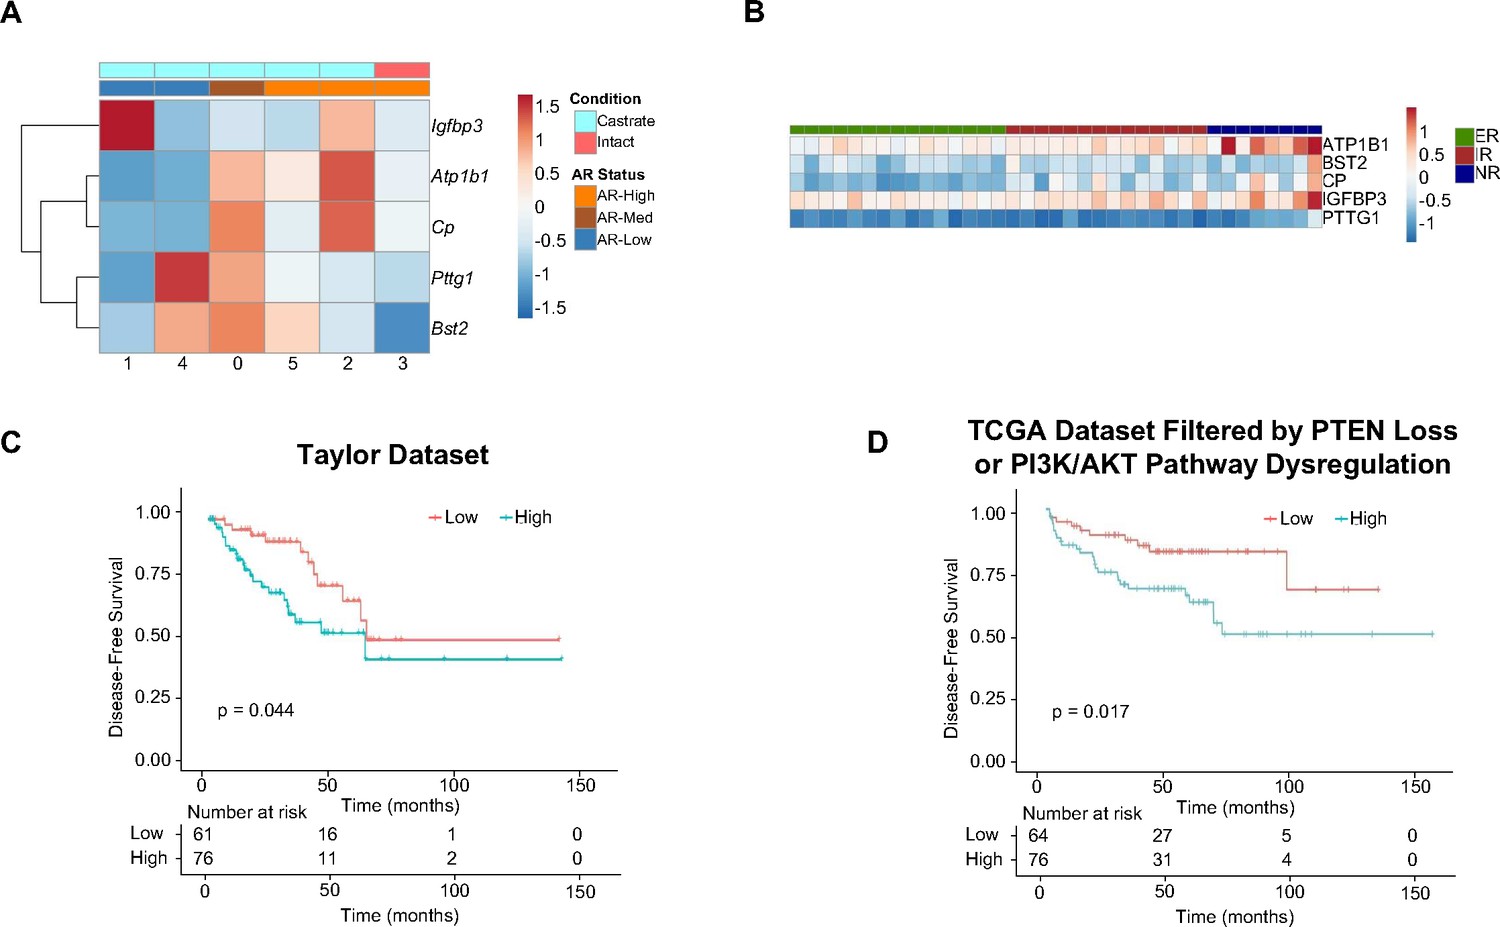
5 Genes expressed in intermediate cells correlate with poor disease outcomes in human patients.
(A) Heatmap of top 5 resistance genes in intermediate clusters, labeled by AR status and condition (intact or castrate). (B) Heatmap of the top 5 genes enriched in castrated intermediate cells (Figure 4B) and their expression in ADT non-responder (NR), intermediate responder (IR), and excellent responder (ER) patients. (C) Kaplan-Meier curve of disease-free survival of patients in the Taylor et al., 2010 cohort, separated by expression of the top 5 resistance genes in castrated intermediate cells. Red line, normal expression of top 5 genes; blue line, patients with expression of at least 1 gene with TPM in the 80th percentile or above. (D) Kaplan-Meier curve of disease-free survival of patients in the TCGA database, filtered for PTEN loss or PI3K/AKT pathway dysregulation, separated by expression of the top 5 resistance genes in castrated intermediate cells. Red line, normal expression of top 5 genes; blue line, patients with expression of at least 1 gene with TPM (transcripts per million) in the 80th percentile or above.
Figure 5 with 1 supplement
Castration remodels immune environment via fibroblast signaling and increases TNF pathway activity.
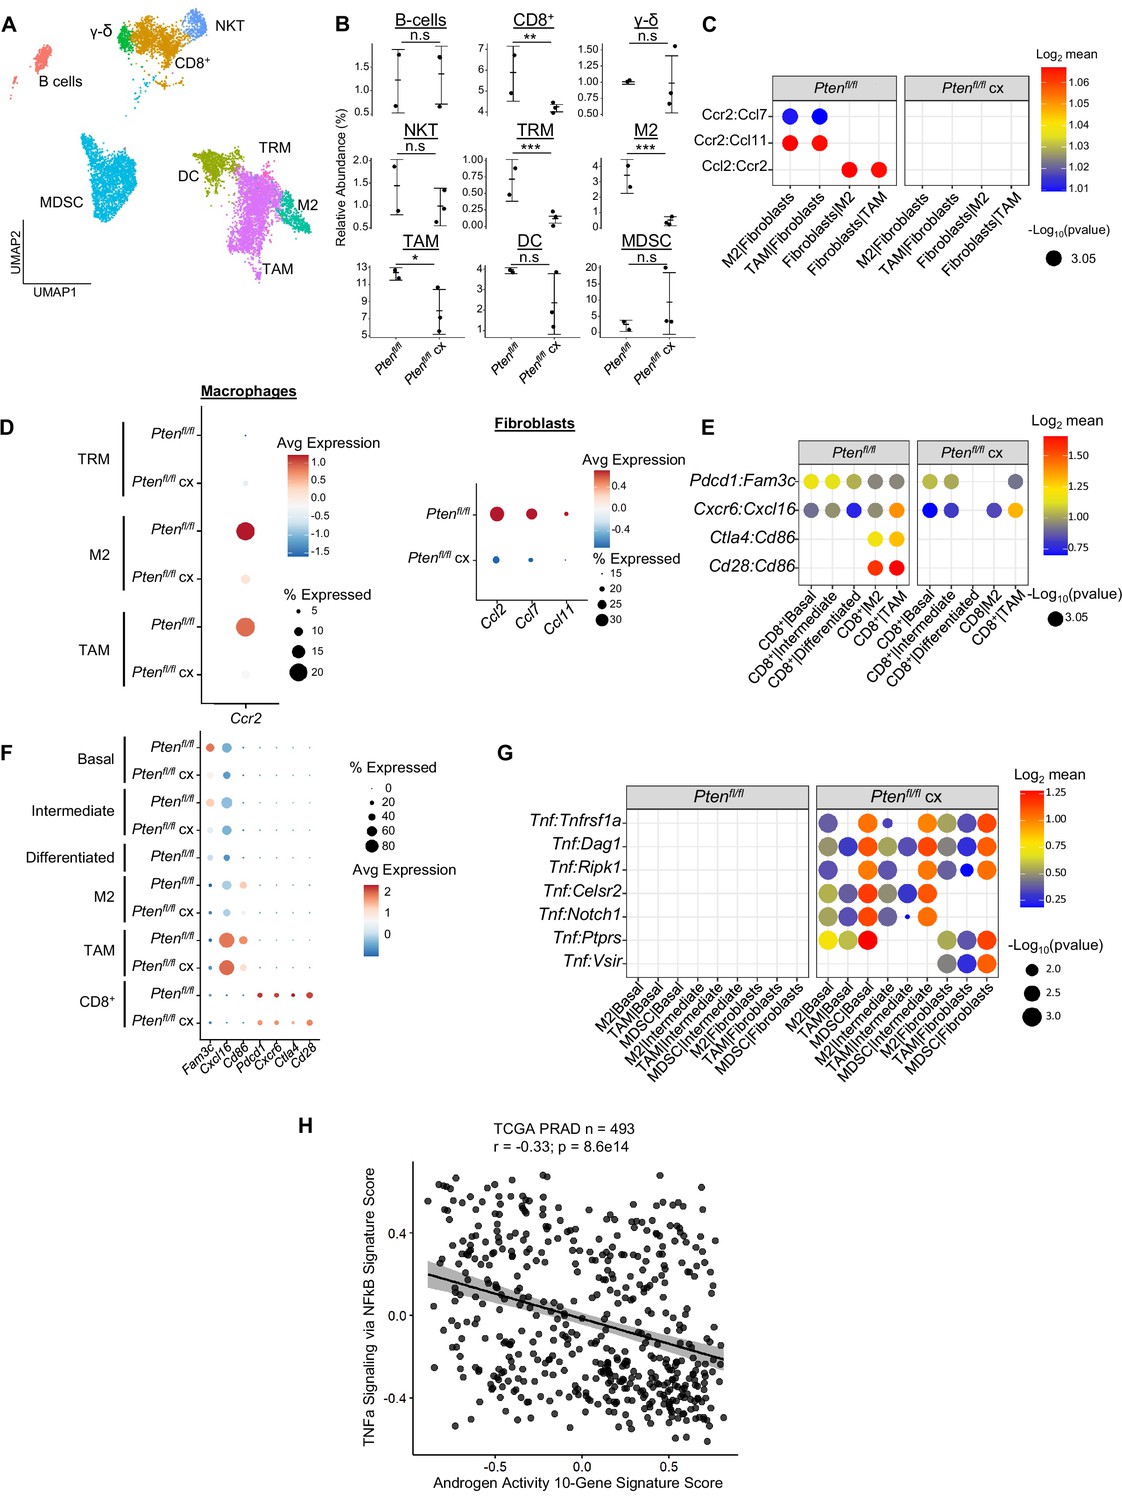
(A) Combined UMAP visualization of immune cells in Ptenfl/fl and Ptenfl/fl cx ventral prostates. (B) Relative abundance of immune cells in Ptenfl/fl intact (n=2) and cx (n=3) mice. Y-axis shows the % composition of each sample by cell type (Data presented as +/-SD, *p<0.05, **p<0.01, ***p<0.001, n.s=not significant, negative binomial test). (C) Dot plot of signaling interactions between macrophages and fibroblasts. (D) Dot plot of Ccr2 expression in M2 macrophages and TAMs (left). Dot plot of Ccr2 ligand expression in fibroblasts in Ptenfl/fl intact and cx mice (right). (E) Dot plot of signaling interactions between CD8+ T cells and epithelial and macrophage cells in Ptenfl/fl intact and cx mice. (F) Dot plot of epithelial and macrophage ligands and CD8+ T cell receptor gene expression in Ptenfl/fl intact and cx mice. (G) Dot plot of Tnf signaling interactions between myeloid and epithelial/fibroblast cells in Ptenfl/fl intact and cx prostates. (H) Scatter plot of TCGA PRAD study patient signature composite scores. Y-axis, TNF signaling signature score; X-axis, AR signaling signature score (Pearson’s correlation).
Figure 5—figure supplement 1
Epithelial-mediated macrophage recruitment is not interrupted by castration.
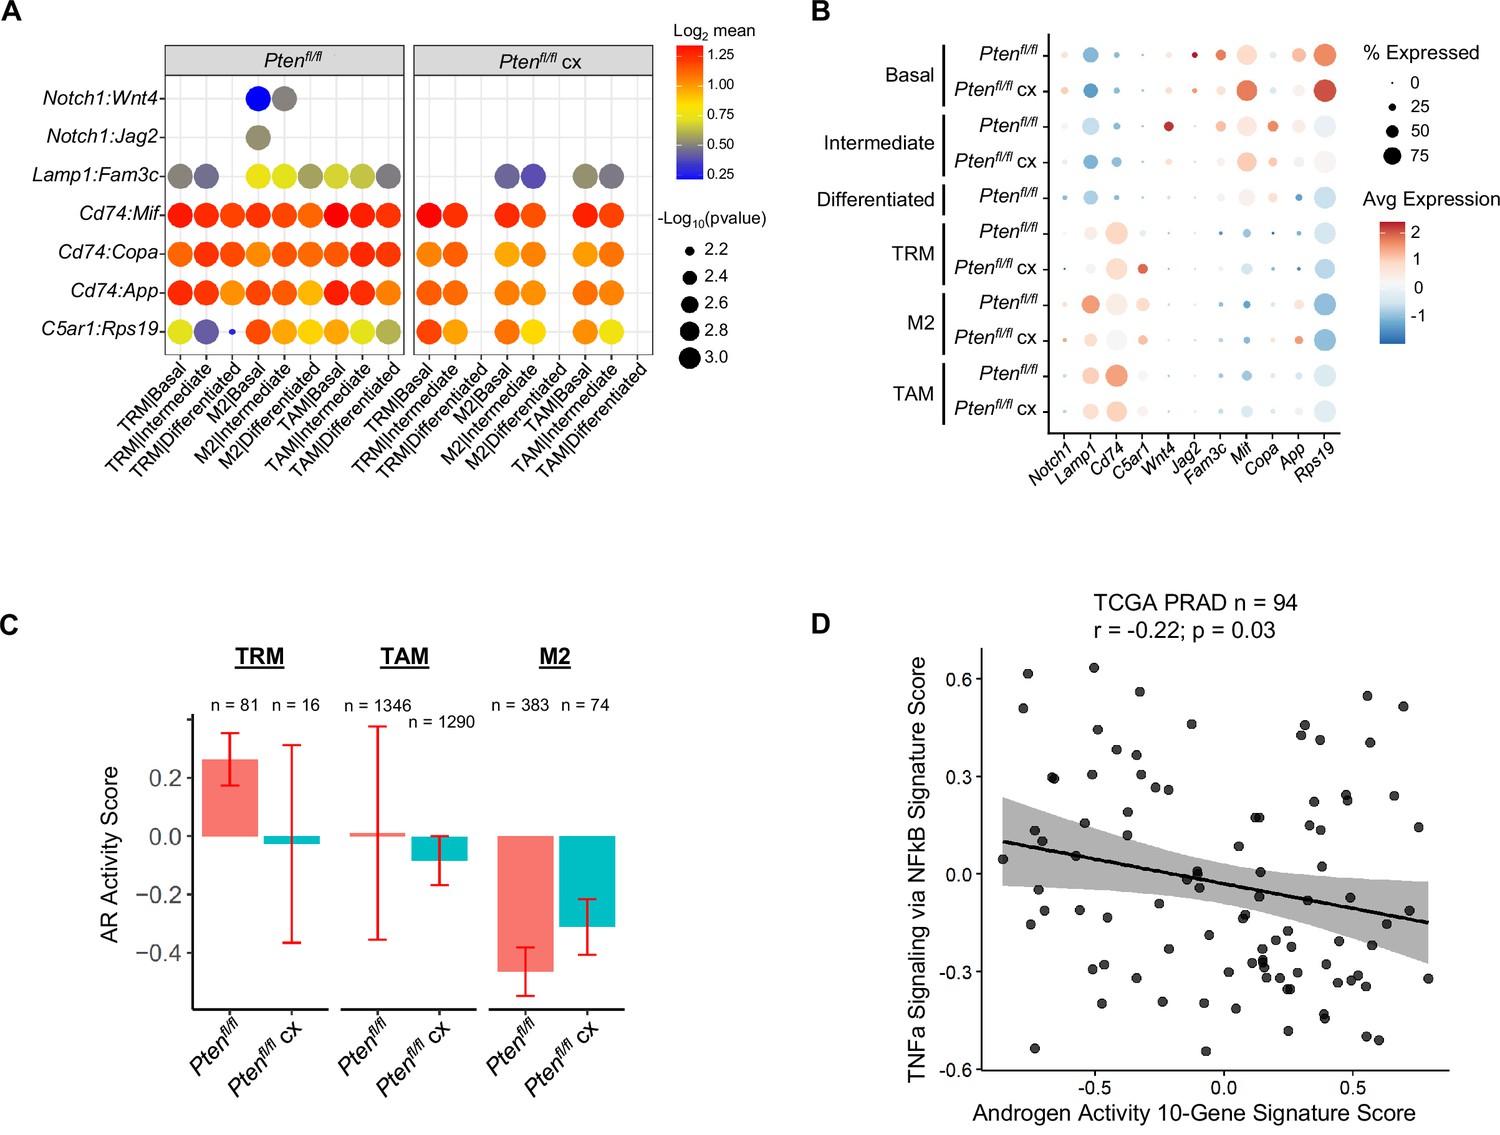
(A) Plot of signaling interactions between macrophage subtypes and epithelial cells in Ptenfl/fl intact and Ptenfl/fl cx prostates. (B) Dot plot of epithelial ligand and macrophage receptor gene expression in Ptenfl/fl intact and Ptenfl/fl cx ventral prostates. (C) Composite score of AR signaling signature in macrophage subtypes in Ptenfl/fl intact and Ptenfl/fl cx prostates (Data presented as +/-SD). (D) Scatter plot of TCGA PRAD study patient signature composite scores, filtered for patients harboring PTEN mutations. Y-axis, TNF signaling signature score; X-axis, AR signaling signature score (Pearson’s correlation).
Figure 6 with 1 supplement
4EBP1M expression is lethal in epithelial cells and decreases EGFR and TNF ligands in epithelial cells and fibroblasts.
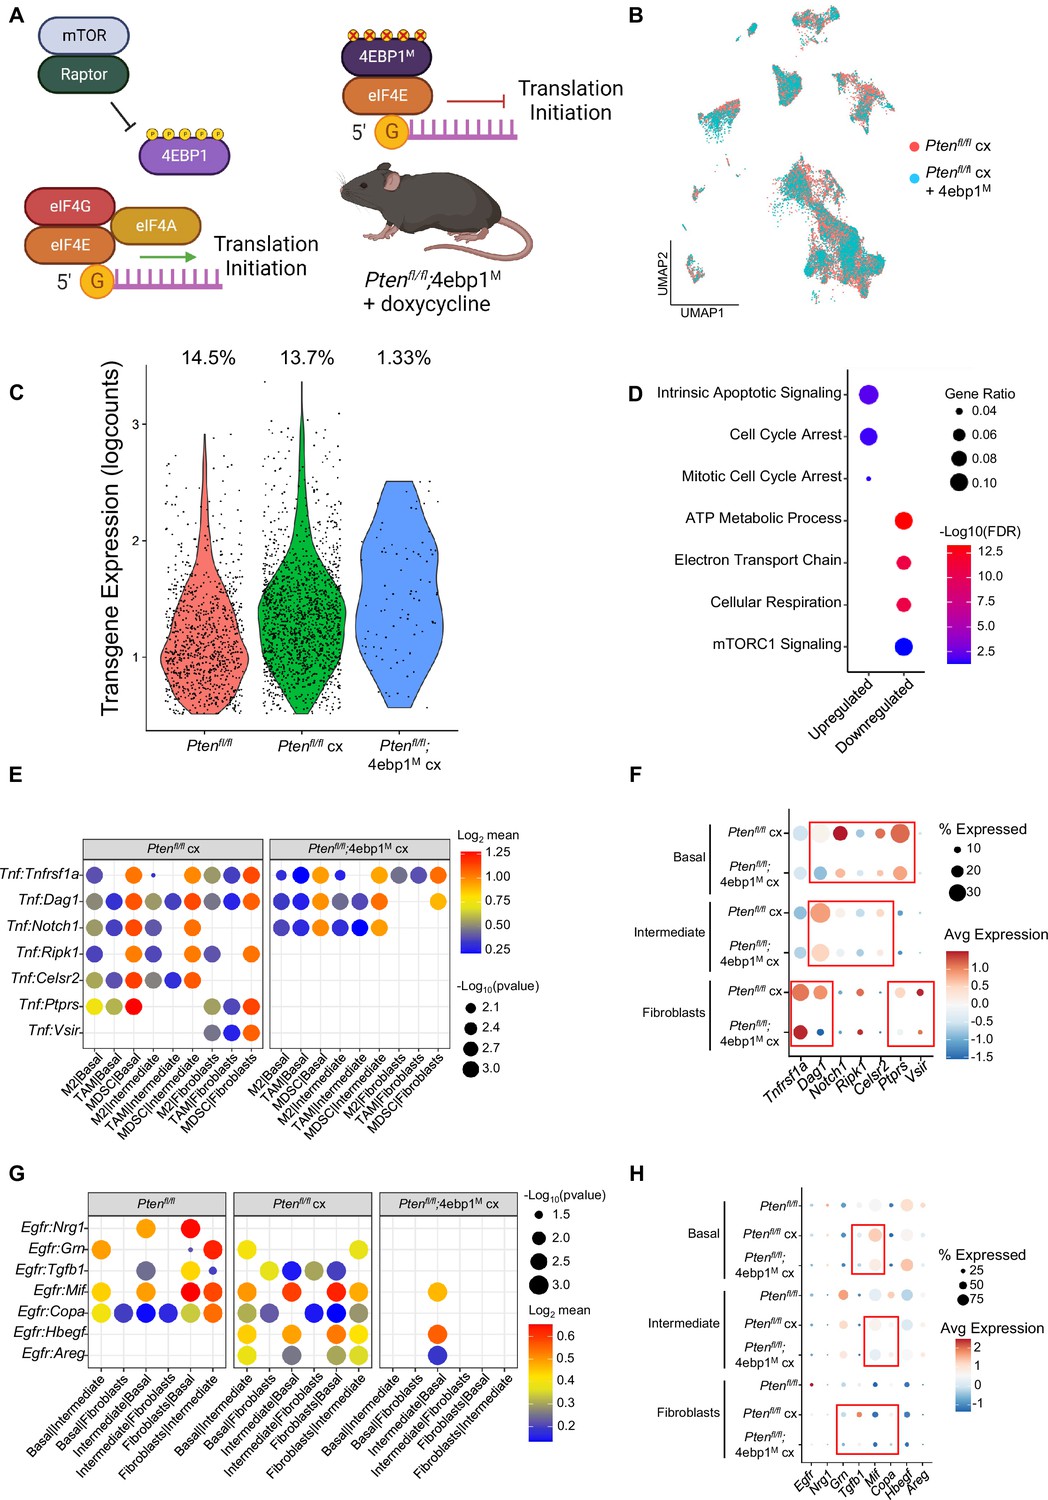
(A) Simplified schematic of the eIF4F translation initiation complex and how the 4EBP1M protein functions in the Ptenfl/fl;4ebp1M mouse model when treated with doxycycline. (B) UMAP visualization of epithelial cells in Ptenfl/fl cx and Ptenfl/fl;4ebp1M cx prostates, colored by genotype. (C) Violin plot of rtTA-eGFP transgene expression in epithelial cells in each Ptenfl/fl condition. Plot shows only cells expressing the transgene; each dot represents a cell. Percentages represent the proportion of transgene-positive cells in each condition. (D) Dot plot of top GSEA results from DEG analysis of transgene-positive basal cells in Ptenfl/fl;4ebp1M cx mice compared to Ptenfl/fl cx ventral prostates. All pathways are enriched with FDR <0.05. (E) Dot plot of Tnf signaling interactions between myeloid and epithelial/fibroblast cells in Ptenfl/fl cx and Ptenfl/fl;4ebp1M cx mice. (F) Dot plot of Tnf and Tnf ligand expression in myeloid cells, epithelial cells, and fibroblasts in Ptenfl/fl cx and Ptenfl/fl;4ebp1M cx prostates. Red boxes highlight ligands with decreased expression in Ptenfl/fl;4ebp1M cx mice. (G) Plot of Egfr signaling interactions between epithelial cells and fibroblasts in Ptenfl/fl intact, Ptenfl/fl cx, and Ptenfl/fl;4ebp1M cx prostates. (H) Dot plot of Egfr and Egfr ligand expression in epithelial cells and fibroblasts in Ptenfl/fl intact, Ptenfl/fl cx, and Ptenfl/fl;4ebp1M cx ventral prostates. Red boxes highlight ligands with decreased expression in Ptenfl/fl;4ebp1M cx mice.
Figure 6—figure supplement 1
Interactive Portal, Enabling Gene- and Cell- Specific Comparisons Across the Spectrum of Prostate Cancer Initiation and Progression in vivo.
Interactive website can be found at https://atlas.fredhutch.org/hsieh-prostate/.
Tables
Table 1
Transgene abundance in PTEN mouse epithelia.
| Cell Type | Ptenfl/fl | Ptenfl/fl cx | Ptenfl/fl;4ebp1M | |
|---|---|---|---|---|
| Basal | All | 1795 | 2718 | 1565 |
| rtTA-eGFP+ | 255 (14.2%) | 422 (15.5%) | 41 (2.6%) | |
| Intermediate | All | 2391 | 8230 | 4760 |
| rtTA-eGFP+ | 438 (18.3%) | 1073 (13.0%) | 43 (0.90%) | |
Table 2
Basal proliferative subset proportions in rtTA-eGFP+ cells.
| Basal Subset | Hypo-proliferative | Hyper-proliferative |
|---|---|---|
| Ptenfl/fl | 188 (73.7%) | 60 (23.5%) |
| Ptenfl/fl cx | 313 (74.1%) | 98 (23.2%) |
| Ptenfl/fl;4ebp1M | 38 (97.4%) | 1 (2.6%) |
Additional files
-
Supplementary file 1
Quality control metrics and Figure 1 supplementary information.
(A) Quality control measures for each mouse replicate. (B) Breakdown of cell ID numbers and relative abundance (%) per mouse condition. (C) Breakdown of cell ID numbers and relative abundance (%) per mouse replicate. (D) Genes upregulated in Ptenfl/fl compared to WT mice for each epithelial subtype. Thresholds set at avg_log2FC >0.25 and FDR <0.05. (E) Breakdown of cell cycle phase assignment for every cell ID in WT and Ptenfl/fl mice. (F) Differentially expressed genes between hyper-proliferative and hypo-proliferative basal cells in Ptenfl/fl mice. Thresholds set at avg_log2FC >0.25 and FDR <0.05. Positive avg_log2FC values indicate upregulation in hypo-proliferative basal cells.
- https://cdn.elifesciences.org/articles/79076/elife-79076-supp1-v1.xlsx
-
Supplementary file 2
CellphoneDB cell-cell interaction data in Ptenfl/fl mice (see Figure 2).
The first gene in the “pair” column is expressed in the first cell ID in the “clusters” column and the second gene is expressed in the second cell ID.
- https://cdn.elifesciences.org/articles/79076/elife-79076-supp2-v1.xlsx
-
Supplementary file 3
Differentially expressed genes in Ptenfl/fl and Ptenfl/fl cx intermediate cells.
6-way comparison between clusters 0–5 (see Figure 3E). Each sheet shows significantly up- or down-regulated genes for one cluster relative to all others. Thresholds set at avg_log2FC >0.25 and FDR <0.05.
- https://cdn.elifesciences.org/articles/79076/elife-79076-supp3-v1.xlsx
-
Supplementary file 4
CellphoneDB cell-cell interaction data in Ptenfl/fl cx mice (see Figure 5).
The first gene in the “pair” column is expressed in the first cell ID in the “clusters” column and the second gene is expressed in the second cell ID.
- https://cdn.elifesciences.org/articles/79076/elife-79076-supp4-v1.xlsx
-
Supplementary file 5
Differentially expressed genes and CellphoneDB cell-cell interaction data in Ptenfl/fl;4ebp1M cx mice (see Figure 6).
(A) Genes upregulated in Ptenfl/fl;4ebp1M cx compared to Ptenfl/fl cx mice for each epithelial subtype. Thresholds set at avg_log2FC >0.25 and FDR <0.05. (B) Genes upregulated in Ptenfl/fl;4ebp1M cx compared to Ptenfl/fl cx mice for each epithelial subtype, filtered for cells expressing the rtTA-eGFP transgene. Thresholds set at avg_log2FC >0.25 and FDR <0.05. (C) CellphoneDB cell-cell interaction data in Ptenfl/fl;4ebp1M cx mice (see Figure 6E–H). The first gene in the “pair” column is expressed in the first cell ID in the “clusters” column and the second gene is expressed in the second cell ID.
- https://cdn.elifesciences.org/articles/79076/elife-79076-supp5-v1.xlsx
-
MDAR checklist
- https://cdn.elifesciences.org/articles/79076/elife-79076-mdarchecklist1-v1.pdf
Download links
A two-part list of links to download the article, or parts of the article, in various formats.
Downloads (link to download the article as PDF)
Open citations (links to open the citations from this article in various online reference manager services)
Cite this article (links to download the citations from this article in formats compatible with various reference manager tools)
Defining cellular population dynamics at single-cell resolution during prostate cancer progression
eLife 11:e79076.
https://doi.org/10.7554/eLife.79076


