Selenocyanate derived Se-incorporation into the nitrogenase Fe protein cluster
- Division of Chemistry and Chemical Engineering, California Institute of Technology, United States
- Howard Hughes Medical Institute, California Institute of Technology, United States
Figures
Figure 1
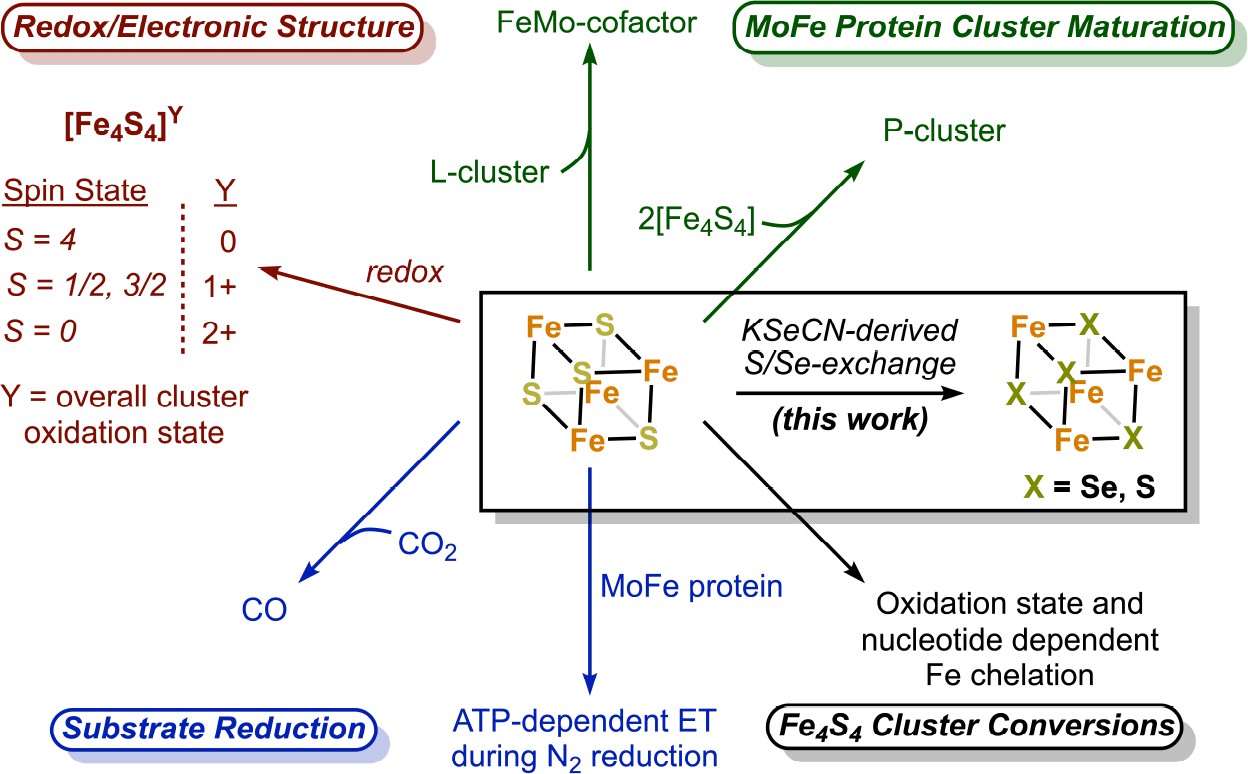
The nitrogenase Fe protein contains a Fe4S4 cluster with unique properties and participates in multiple reactions.
Figure 2 with 7 supplements
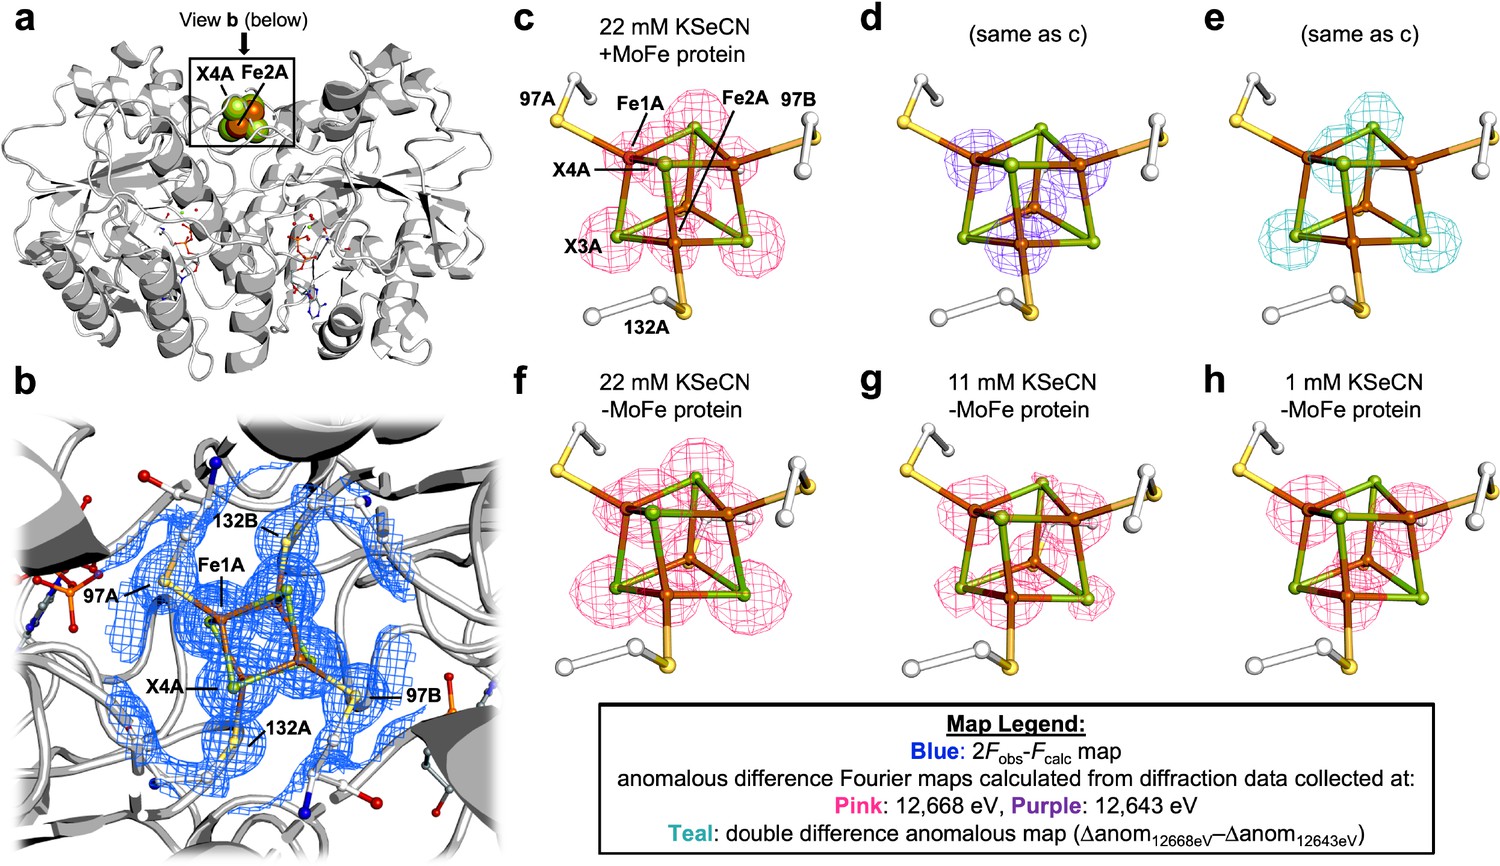
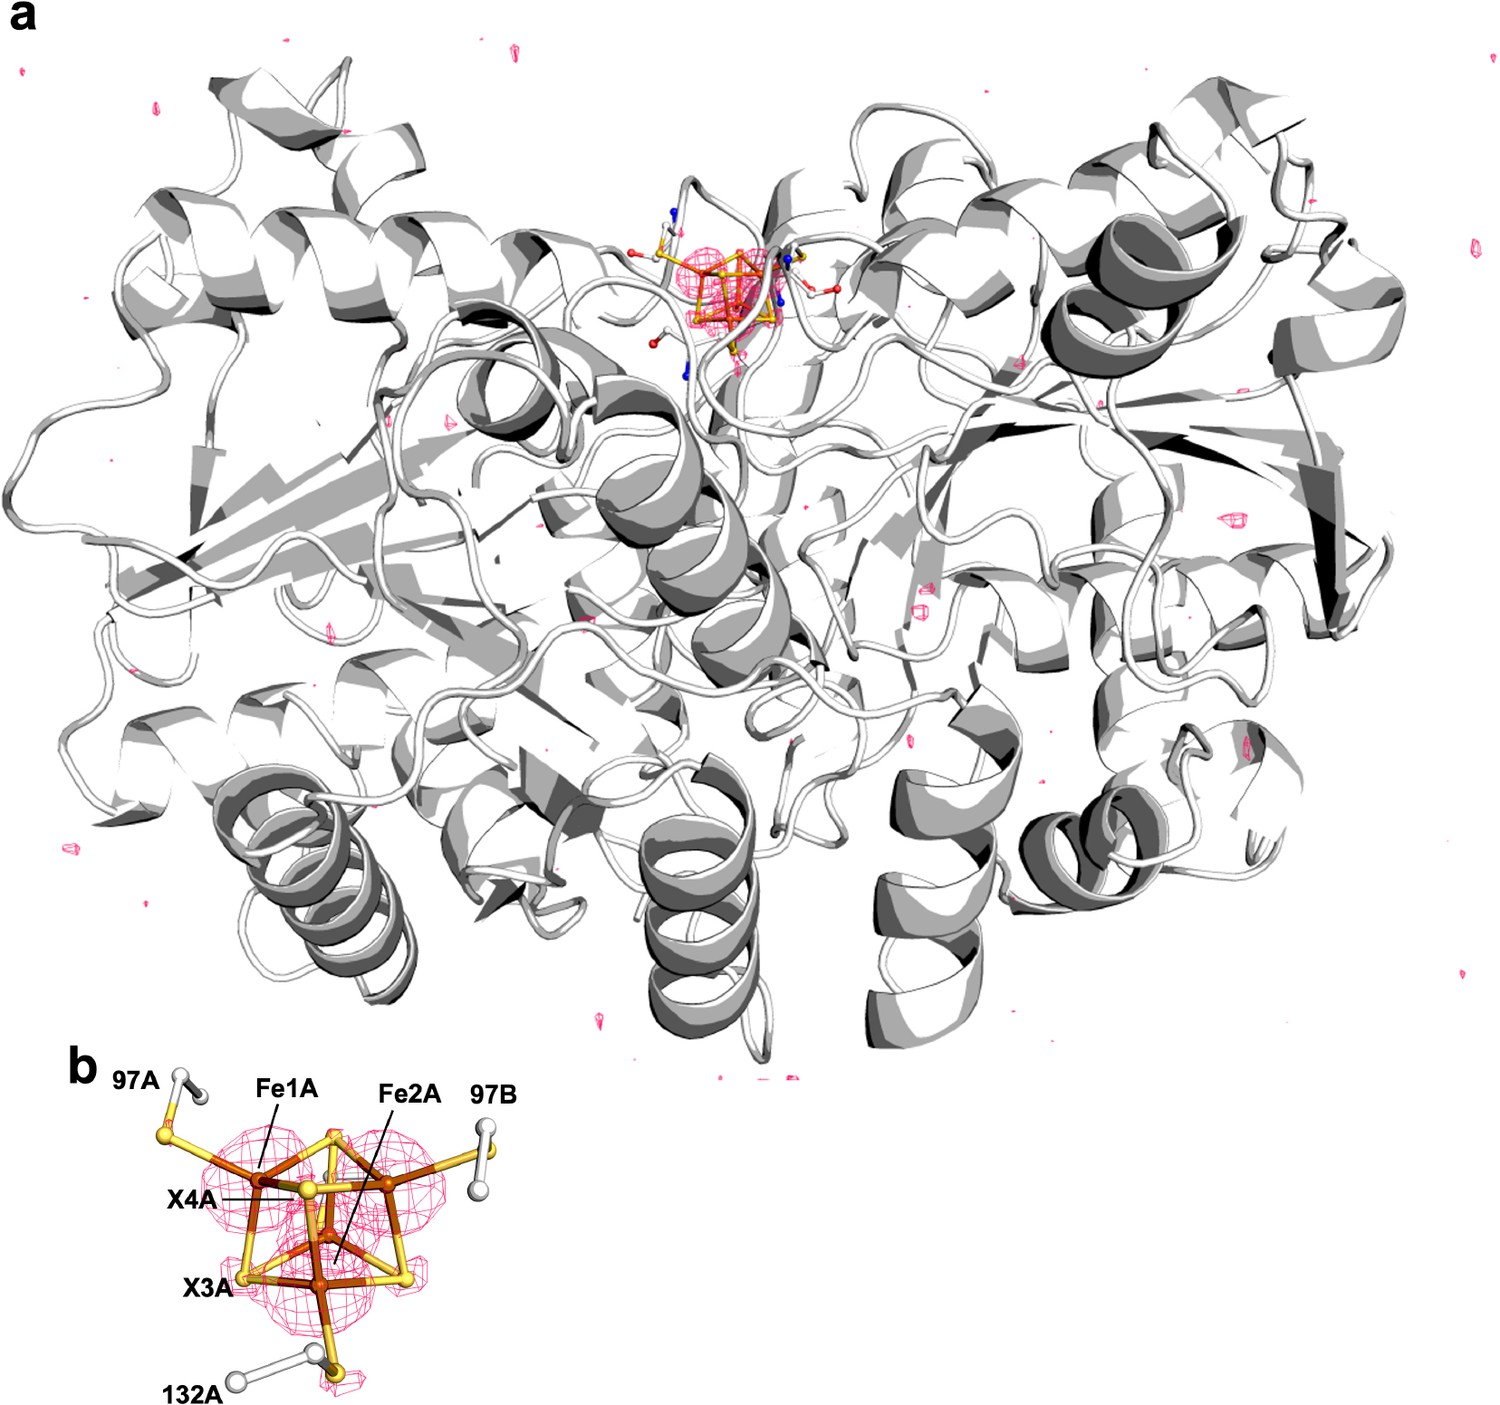
Pymol representation of the Se-incorporated Fe protein cluster at 1.51 Å resolution (PDB ID 7T4H), where the cluster chalcogenide (X) positions (green) feature a mixture of S and Se ions.
(a) Protein overview (b) with overlaid electron density (2Fobs − Fcalc) map around the Fe4S4 cluster contoured at 1.5 σ (blue mesh) viewed with the dimer twofold axis coincident with, and perpendicular to the plane of the paper, respectively. Anomalous difference Fourier maps calculated from diffraction data collected at (c) 12,668 eV contoured at 11.0 σ (magenta mesh, (d) 12,643 eV contoured at 11.0 σ (purple mesh), and (e) double difference (Δanom12,668 eV − Δanom12,643 eV)) anomalous map contoured at 11.0 σ (teal mesh). (f–h) Anomalous difference Fourier maps calculated from diffraction data collected at 12,668 eV (magenta mesh) corresponding to crystals derived from reactions containing 22 mM KSeCN (PDB ID 7TNE), 11 mM KSeCN (PDB ID 7TPN), and 1 mM KSeCN (PDB ID 7TPO) contoured at 11.0, 7.0, and 5.0 σ, respectively.
Figure 2—figure supplement 1
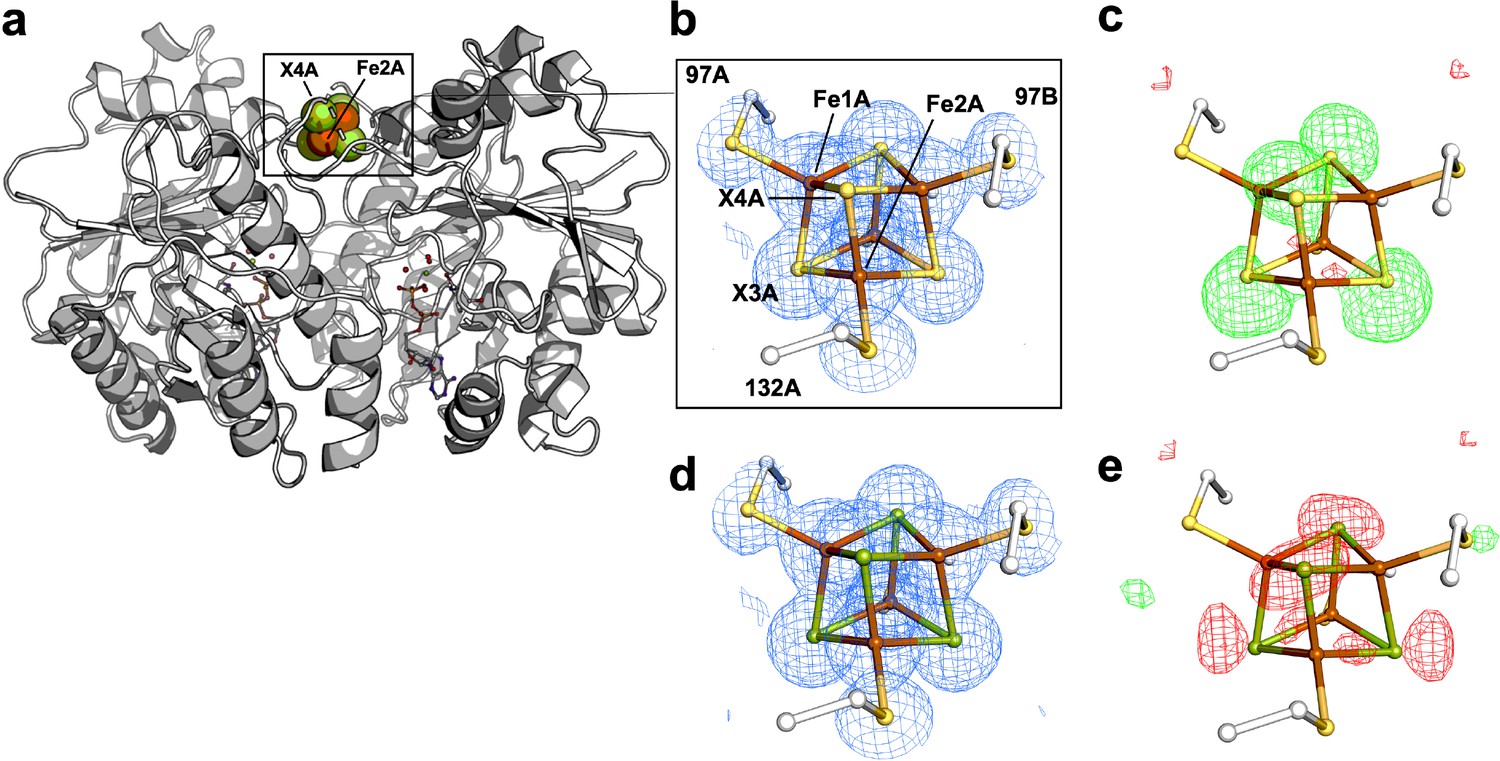
Comparison of 2Fobs − Fcalc and Fobs− Fcalc maps for cluster modeled as exclusively S- vs. Se-containing forms.
(a) Protein overview. The all S-containing model with (b) overlaid electron density (2Fobs-Fcalc) map contoured at 1.5 σ (blue mesh) and (c) overlaid difference density (Fobs-Fcalc) map contoured at 3.0 σ. The all Se-containing model with (d) overlaid electron density (2Fobs-Fcalc) map contoured at 1.5 σ (blue mesh) and (e) overlaid difference density (Fobs-Fcalc) map contoured at 3.0 σ. The positive and negative difference densities in (c) and (e) are displayed in green and red, respectively.
Figure 2—figure supplement 2
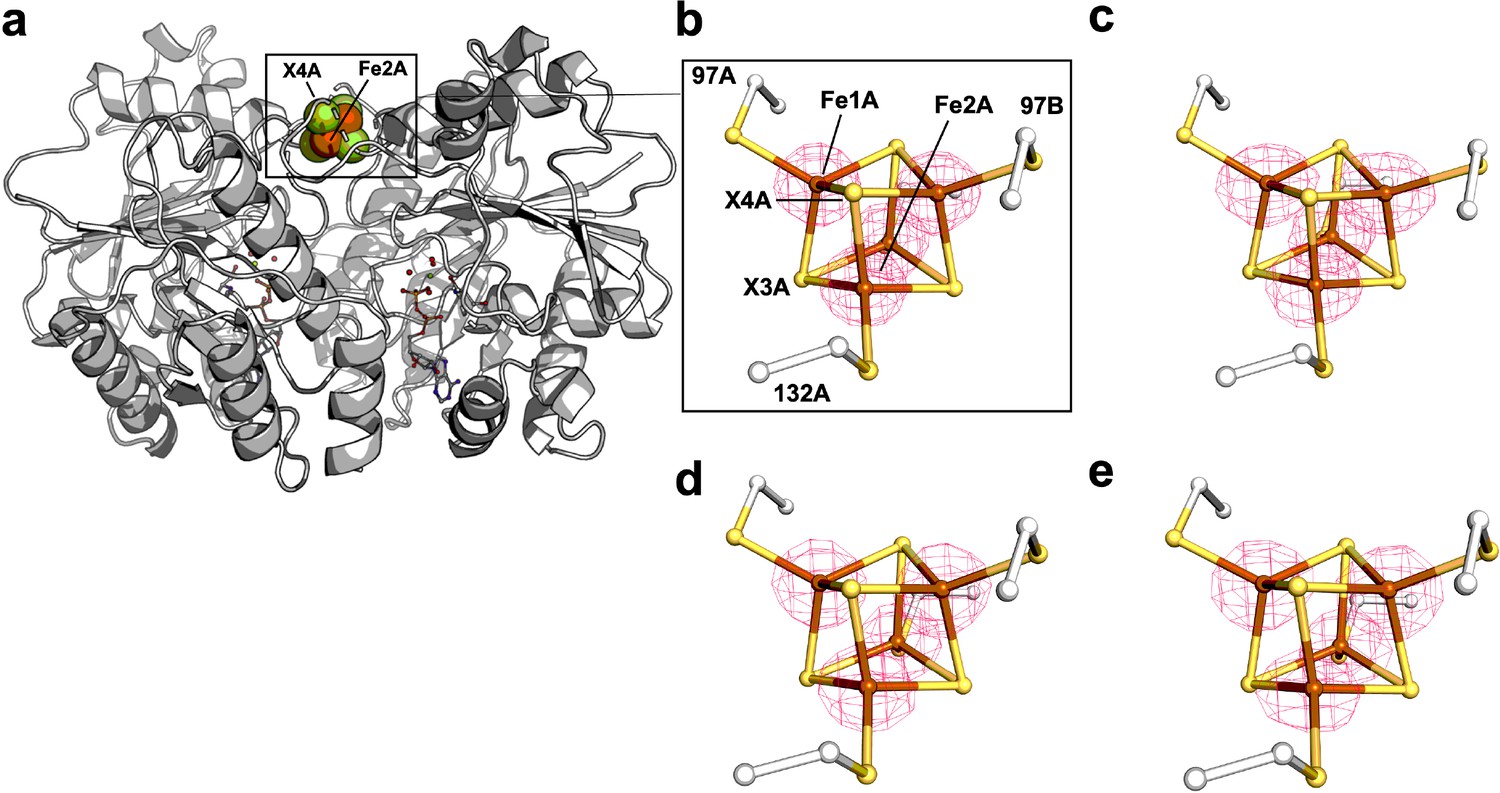
Anomalous difference Fourier maps (pink mesh, contoured at 7 σ) calculated from diffraction data collected at 12,668 eV for Se-free Fe protein crystals corresponding to crystal in (b) Supplementary file 2, PDB ID 7TPW (c) Supplementary file 2, PDB ID 7TPX, (d) Supplementary file 2, PDB ID 7TPY (nucleotide free reaction), and (e) Supplementary file 2, PDB ID 7TPZ (MgADP in place of MgATP/ATP regeneration system).
A protein overview is shown in (a) for orientation purposes.
Figure 2—figure supplement 3
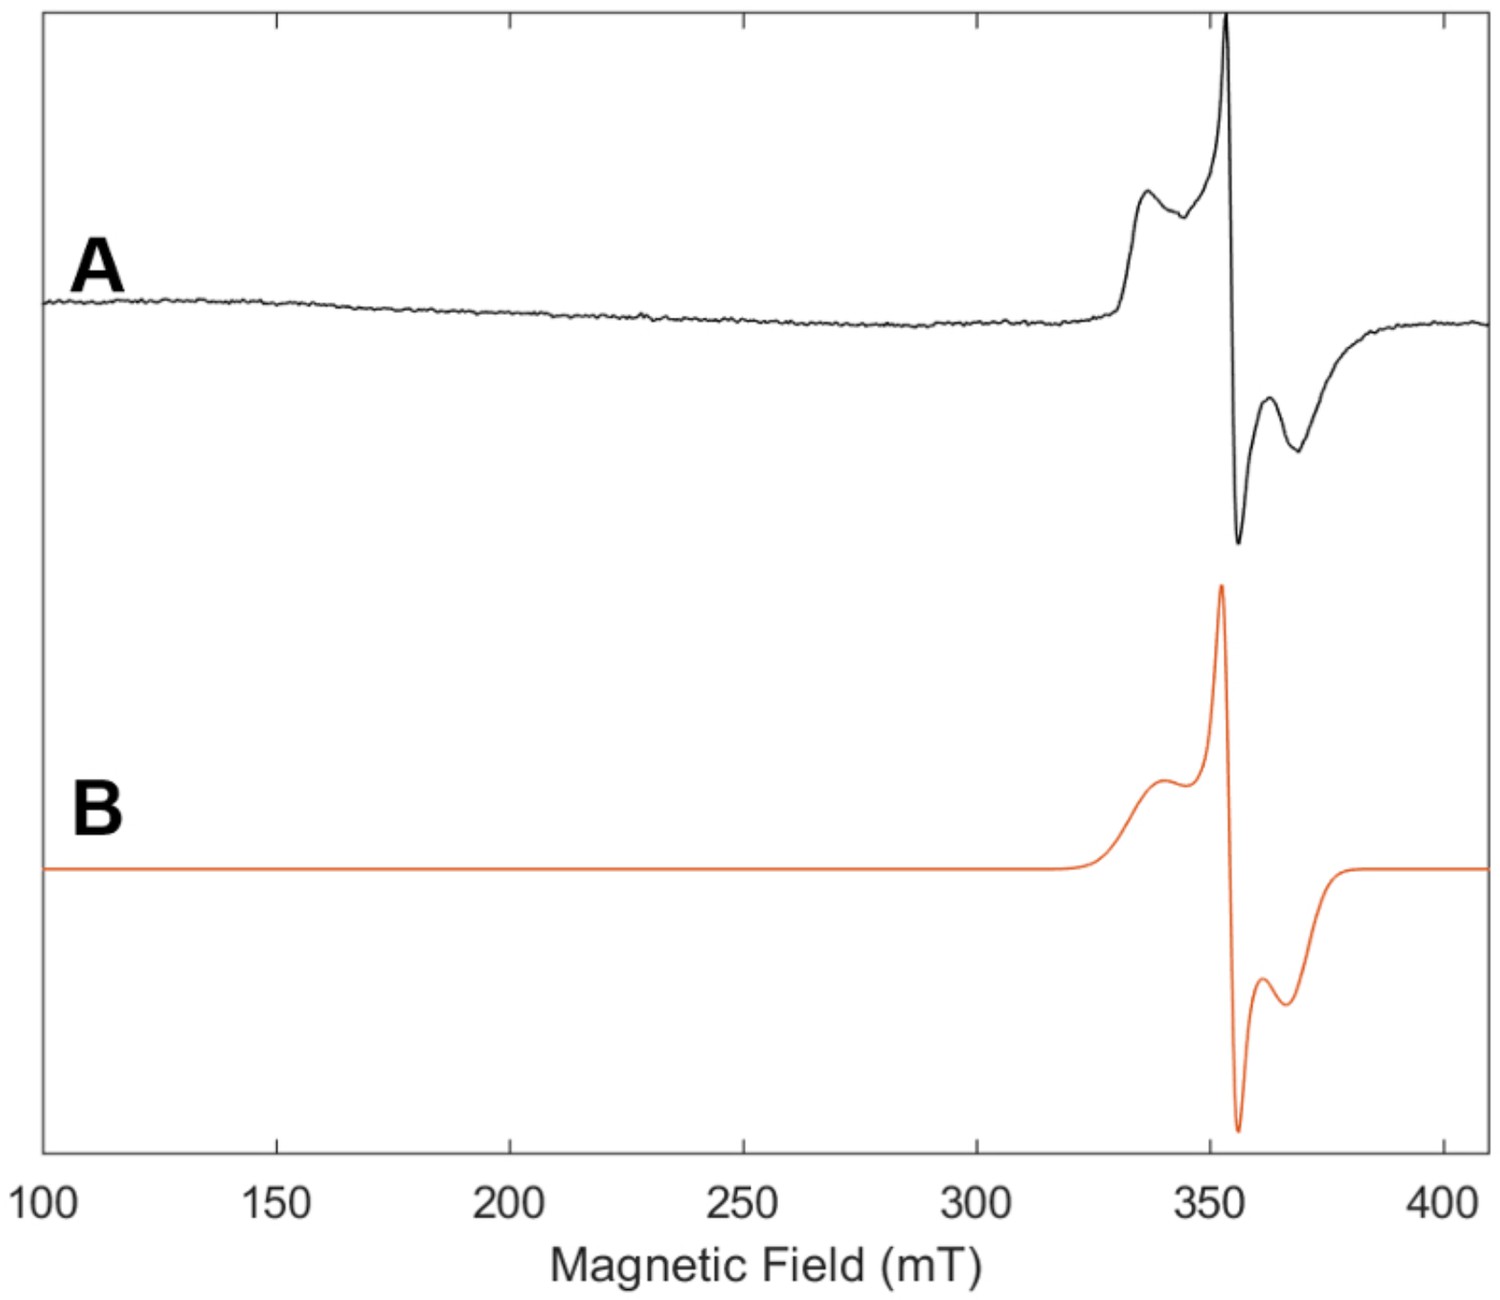
Electron paramagnetic resonance (EPR) spectrum of Fe protein used in control reaction with no MoFe protein with (A) experimental data (black) and (B) simulation (orange).
The frozen solution (10K) spectrum was collected at 9.64 GHz with a microwave power of 2.2 mW, a modulation amplitude of 8.0 G, a modulation frequency of 100 KHz and conversion time of 42 ms.
Figure 2—figure supplement 4
Anomalous difference Fourier map (pink mesh, contoured at 4.0 σ) calculated from diffraction data collected at 12,668 eV for ADP-bound Fe protein crystal soaked with KSeCN over (a) the entire protein, (b) the cluster.
Figure 2—figure supplement 5

The FeMo-cofactor of Se-incorporated MoFe protein overlaid with the double difference (Δanom12668eV – Δanom12643eV) anomalous difference Fourier map contoured at 9.0 σ (olive mesh); X denotes a mixture of Se and S atoms.
Iron atoms are shown in orange, sulfur in yellow, molybdenum in turquoise, and a mixture of Se/S in green.
Figure 2—figure supplement 6
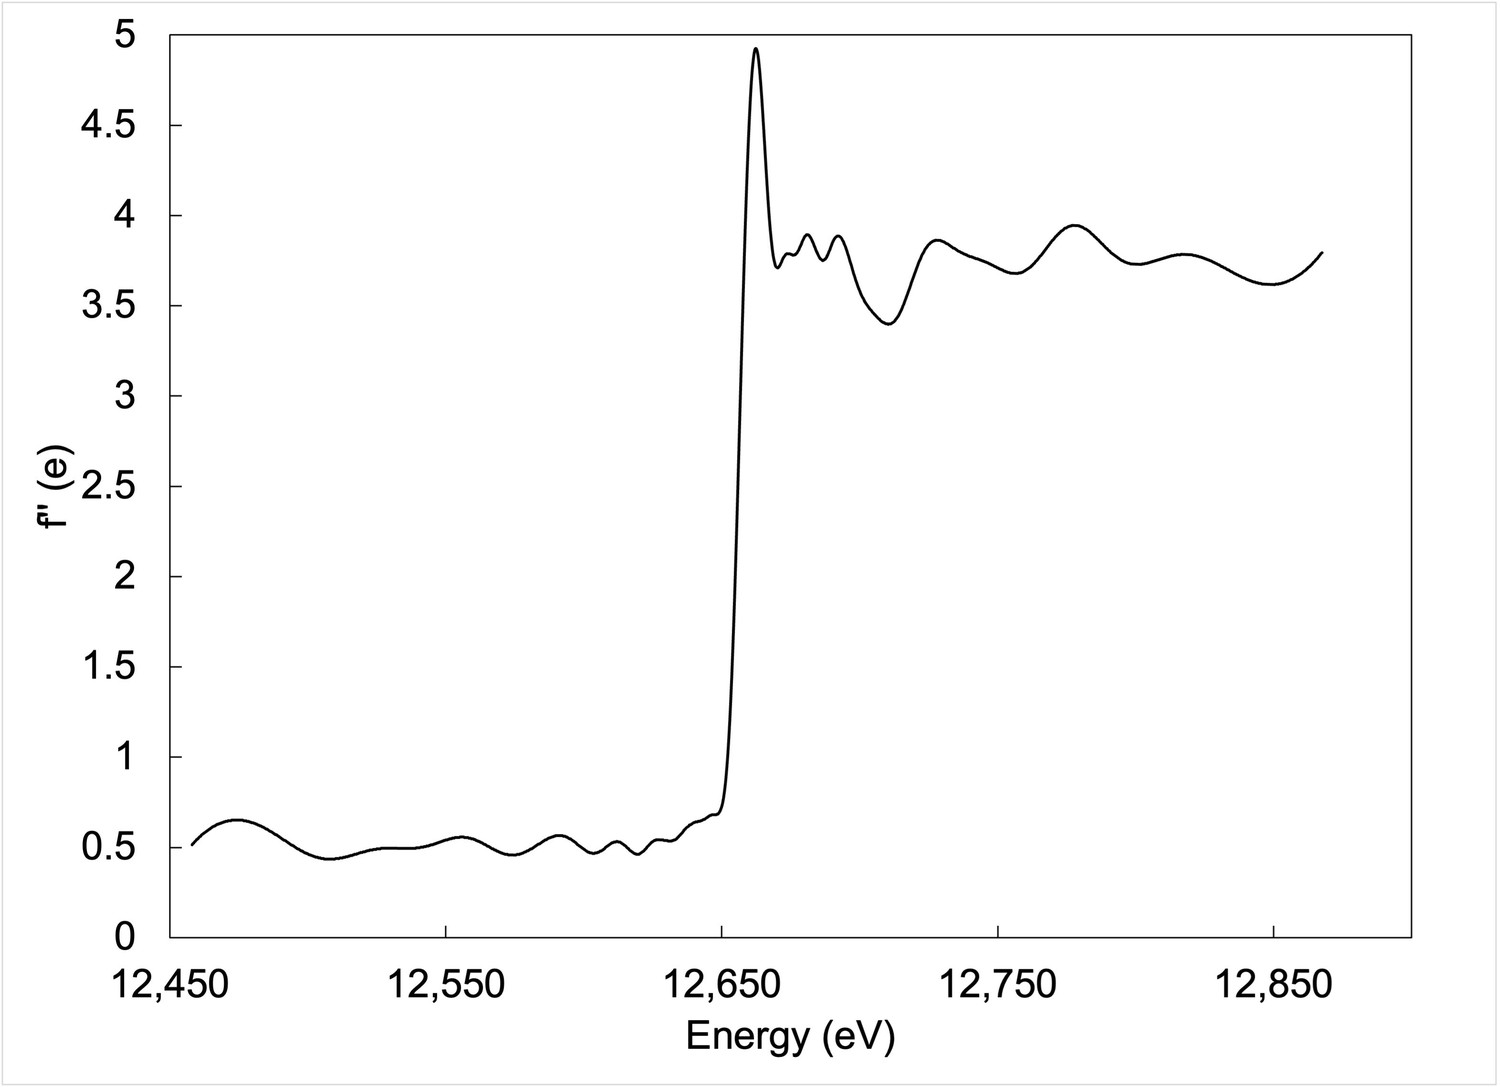
Fluorescence scan collected around Se K-edge energy for Se-incorporated Fe protein crystal.
Figure 2—figure supplement 7
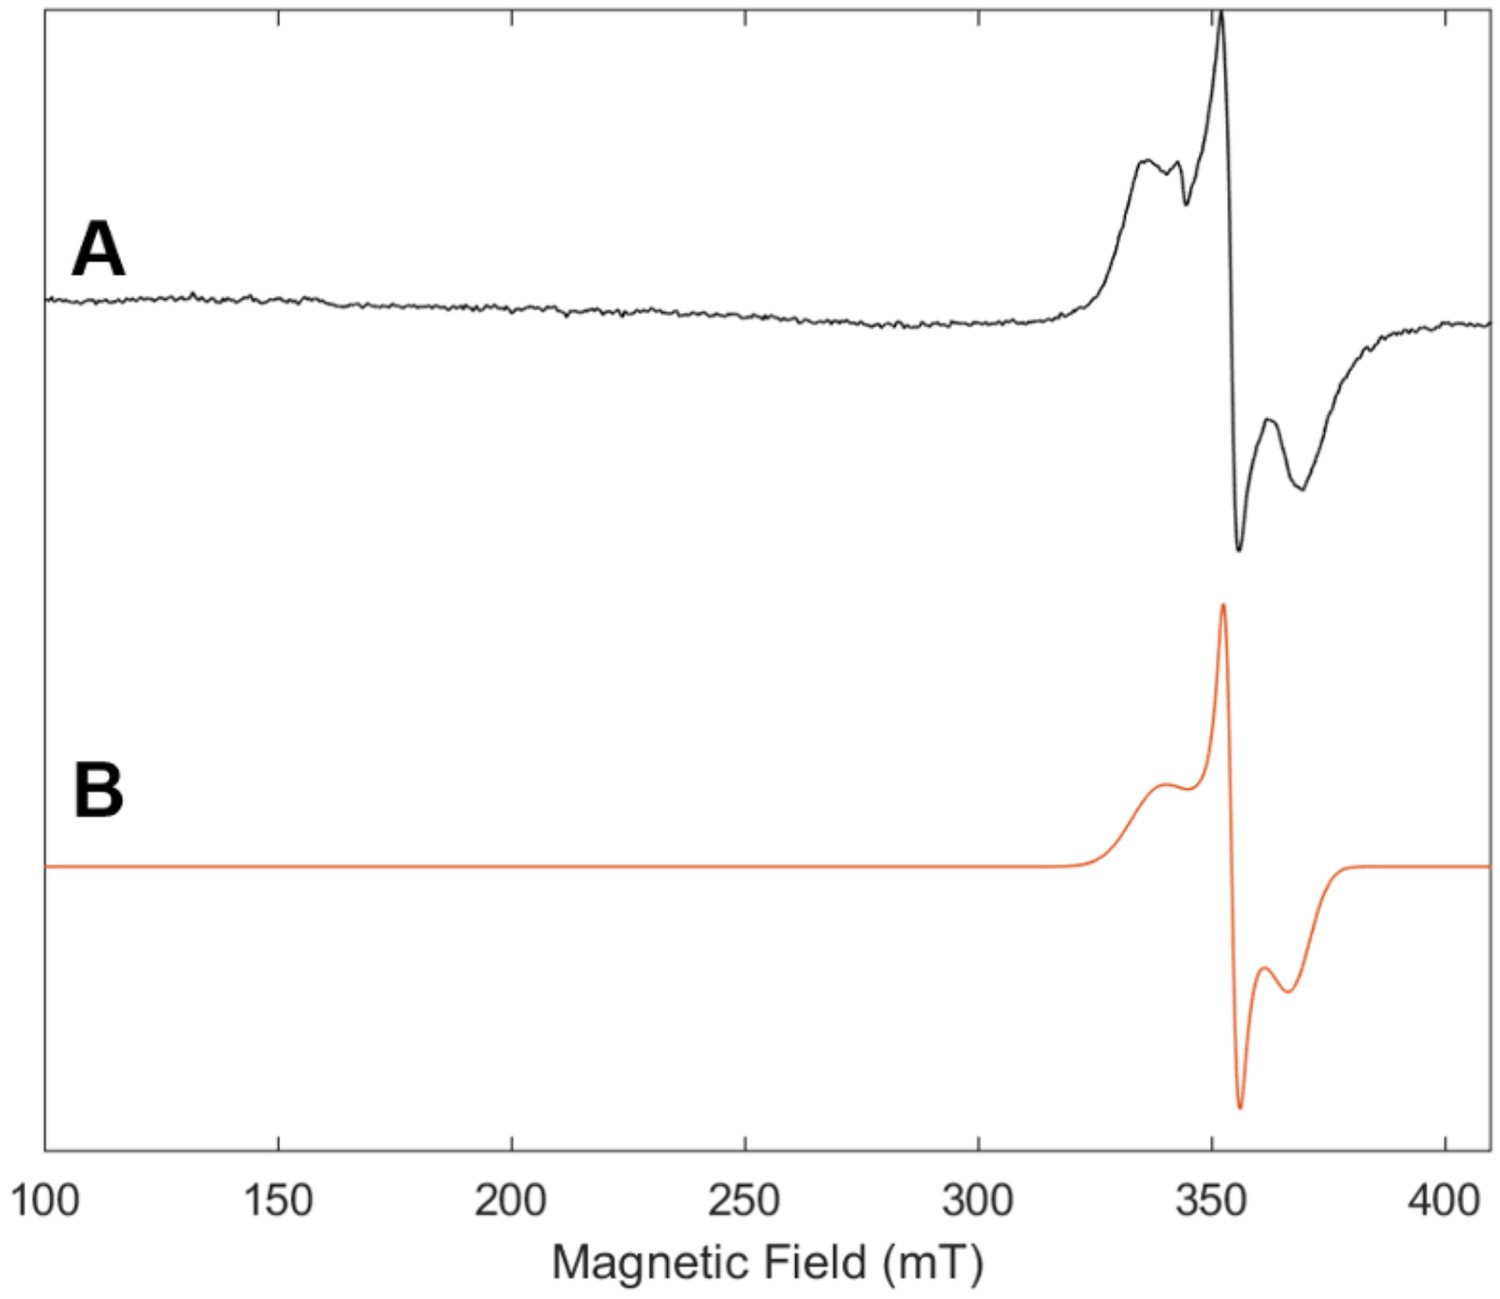
Electron paramagnetic resonance (EPR) spectrum of purified Se-incorporated Fe protein with (A) experimental data (black) and (B) simulation (orange).
The frozen solution (10K) spectrum was collected at 9.64 GHz with a microwave power of 2.2 mW, a modulation amplitude of 8.0 G, a modulation frequency of 100 KHz and conversion time of 42 ms. For EPR spectrum of Fe protein, see Figure 2—figure supplement 3.
Tables
Table 1
Summary of crystallographically determined Se occupancies for KSeCN-derived Se-incorporation at the Fe protein cluster under various conditions.
The occupancies for the X3 and X4 chalcogenide positions were determined in triplicate† by analyzing three crystals prepared from a specified set of reaction conditions. For occupancy values corresponding to individual crystals, please see Supplementary file 3.
| Entry | Brief description of reaction conditions* | X3 occupancy(average + standard deviation) | X4 occupancy(average + standard deviation) | |
|---|---|---|---|---|
| 1 | 22 mM KSeCN, w/ MoFe protein | 0.51 ± 0.09 | 0.43 ± 0.06 | |
| 2 | 22 mM KSeCN | 0.58 ± 0.03 | 0.38 ± 0.05 | |
| 3 | 11 mM KSeCN | 0.07 ± 0.02 | 0.06 ± 0.03 | |
| 4 | 1 mM KSeCN | 0.02 ± 0.01 | 0.02 ± 0.01 | |
-
*
See Methods for full description.
-
†
With the exception of entry 2 for which four crystals were analyzed.
Key resources table
| Reagent type (species) or resource | Designation | Source or reference | Identifiers | Additional information |
|---|---|---|---|---|
| Strain, strain background (Azotobacter vinelandii, Lipman) | OP | ATCC | 13705 |
Additional files
-
MDAR checklist
- https://cdn.elifesciences.org/articles/79311/elife-79311-mdarchecklist1-v3.pdf
-
Supplementary file 1
Comparison of B-factors for cluster modeled as exclusively FeS vs FeSe forms.
- https://cdn.elifesciences.org/articles/79311/elife-79311-supp1-v3.docx
-
Supplementary file 2
B-factor analysis of cluster atoms in Se-free Fe protein crystal structures.
- https://cdn.elifesciences.org/articles/79311/elife-79311-supp2-v3.docx
-
Supplementary file 3
Summary of crystallographically determined Se occupancies for KSeCN derived Se-incorporation at the Fe protein cluster under various conditions.
- https://cdn.elifesciences.org/articles/79311/elife-79311-supp3-v3.docx
-
Supplementary file 4
Data collection and refinement statistics for Se-free Fe protein crystals from various control reactions.
- https://cdn.elifesciences.org/articles/79311/elife-79311-supp4-v3.docx
-
Supplementary file 5
Data collection and refinement statistics for Se-incorporated Fe protein crystals derived from 22 mM KSeCN reaction in the presence of MoFe protein.
- https://cdn.elifesciences.org/articles/79311/elife-79311-supp5-v3.docx
-
Supplementary file 6
Data collection and refinement statistics for Se-incorporated Fe protein crystals derived from 22 mM KSeCN reaction in the absence of MoFe protein.
- https://cdn.elifesciences.org/articles/79311/elife-79311-supp6-v3.docx
-
Supplementary file 7
Data collection and refinement statistics for Se-incorporated Fe protein crystals derived from 11 mM KSeCN reaction in the absence of MoFe protein.
- https://cdn.elifesciences.org/articles/79311/elife-79311-supp7-v3.docx
-
Supplementary file 8
Data collection and refinement statistics for Se-incorporated Fe protein crystals derived from 1 mM KSeCN reaction in the absence of MoFe protein.
- https://cdn.elifesciences.org/articles/79311/elife-79311-supp8-v3.docx
-
Supplementary file 9
Data collection and refinement statistics for Fe protein crystal soaked with KSeCN.
- https://cdn.elifesciences.org/articles/79311/elife-79311-supp9-v3.docx
Download links
A two-part list of links to download the article, or parts of the article, in various formats.
Downloads (link to download the article as PDF)
Open citations (links to open the citations from this article in various online reference manager services)
Cite this article (links to download the citations from this article in formats compatible with various reference manager tools)
Selenocyanate derived Se-incorporation into the nitrogenase Fe protein cluster
eLife 11:e79311.
https://doi.org/10.7554/eLife.79311


