The Nse5/6-like SIMC1-SLF2 complex localizes SMC5/6 to viral replication centers
- Department of Molecular Medicine, The Scripps Research Institute, United States
- Institute of Molecular Biology, Germany
- Department of Integrative Structural and Computational Biology, The Scripps Research Institute, United States
- Department of Biological Chemistry, David Geffen School of Medicine, University of California, Los Angeles, United States
- Laboratory of Genome Integrity, National Cancer Institute, United States
- San Diego Biomedical Research Institute, United States
Figures
Figure 1
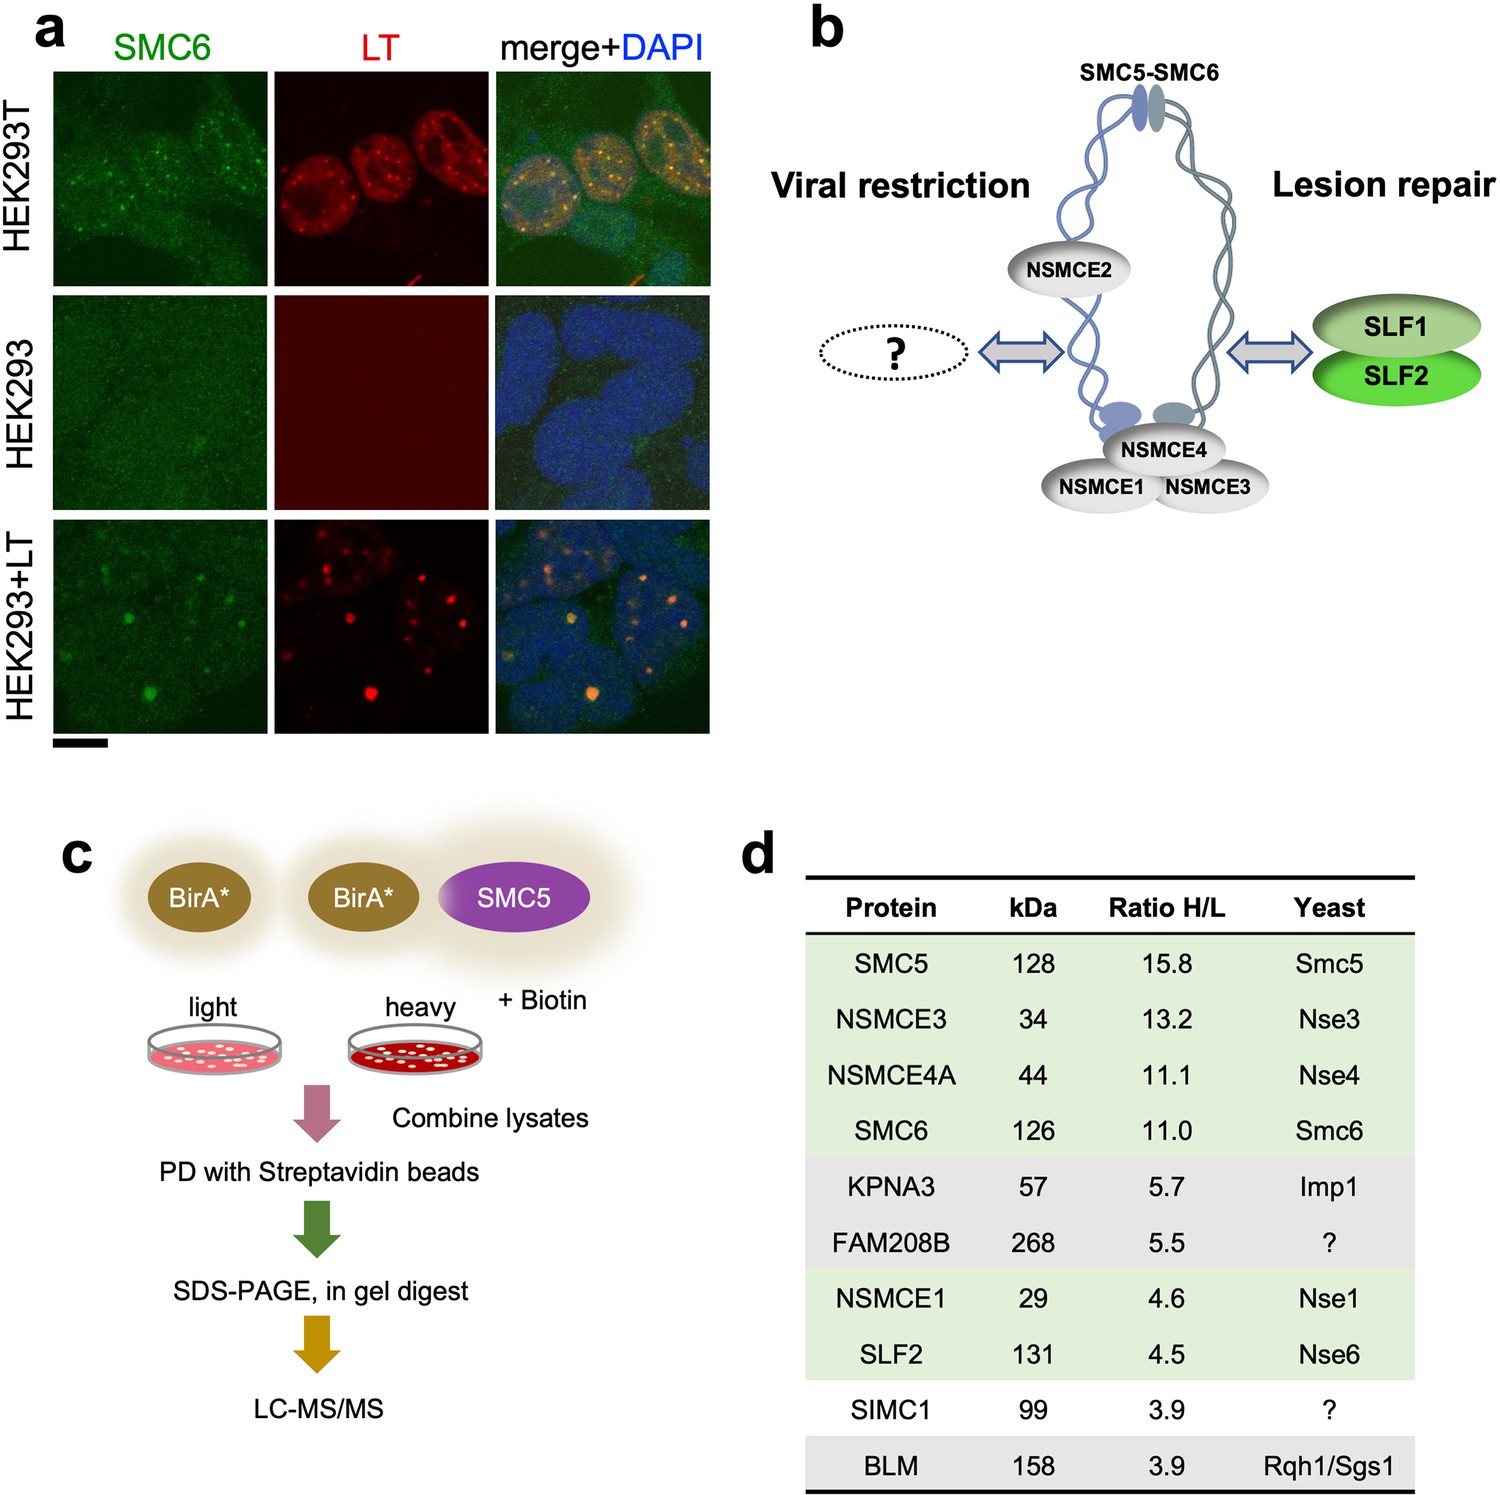
SIMC1 detected in proximity of SMC5 in LT-induced foci.
(a) Representative immunofluorescence images of HEK293T, HEK293 cell lines and HEK293 cells transiently expressing SV40 large T (LT) antigen. Cells were fixed, stained with SMC6 (green), LT (red) antibodies and DAPI (blue). Scale bar 10 μm. (b) Schematic of SMC5/6 complex subunits showing the SLF1/SLF2 cofactors recruiting the complex to DNA lesions and depicting the hypothesis of SMC5/6 cofactor involved in SV40 virus lifecycle. (c) Experimental design for human SMC5 BioID with SILAC. (d) The top SMC5 interacting proteins identified in BioID screen are listed with their ratio of heavy (H) to light (L) enrichment. Where known, fission and budding yeast orthologues are listed. The green rows contain known SMC5/6 subunits, grey ones are possible novel interactors of human SMC5. BioID datasets are available in the PRIDE database (https://www.ebi.ac.uk/pride/archive) under the accession code PRIDE PXD033923 and in Supplementary file 1.
Figure 2 with 3 supplements
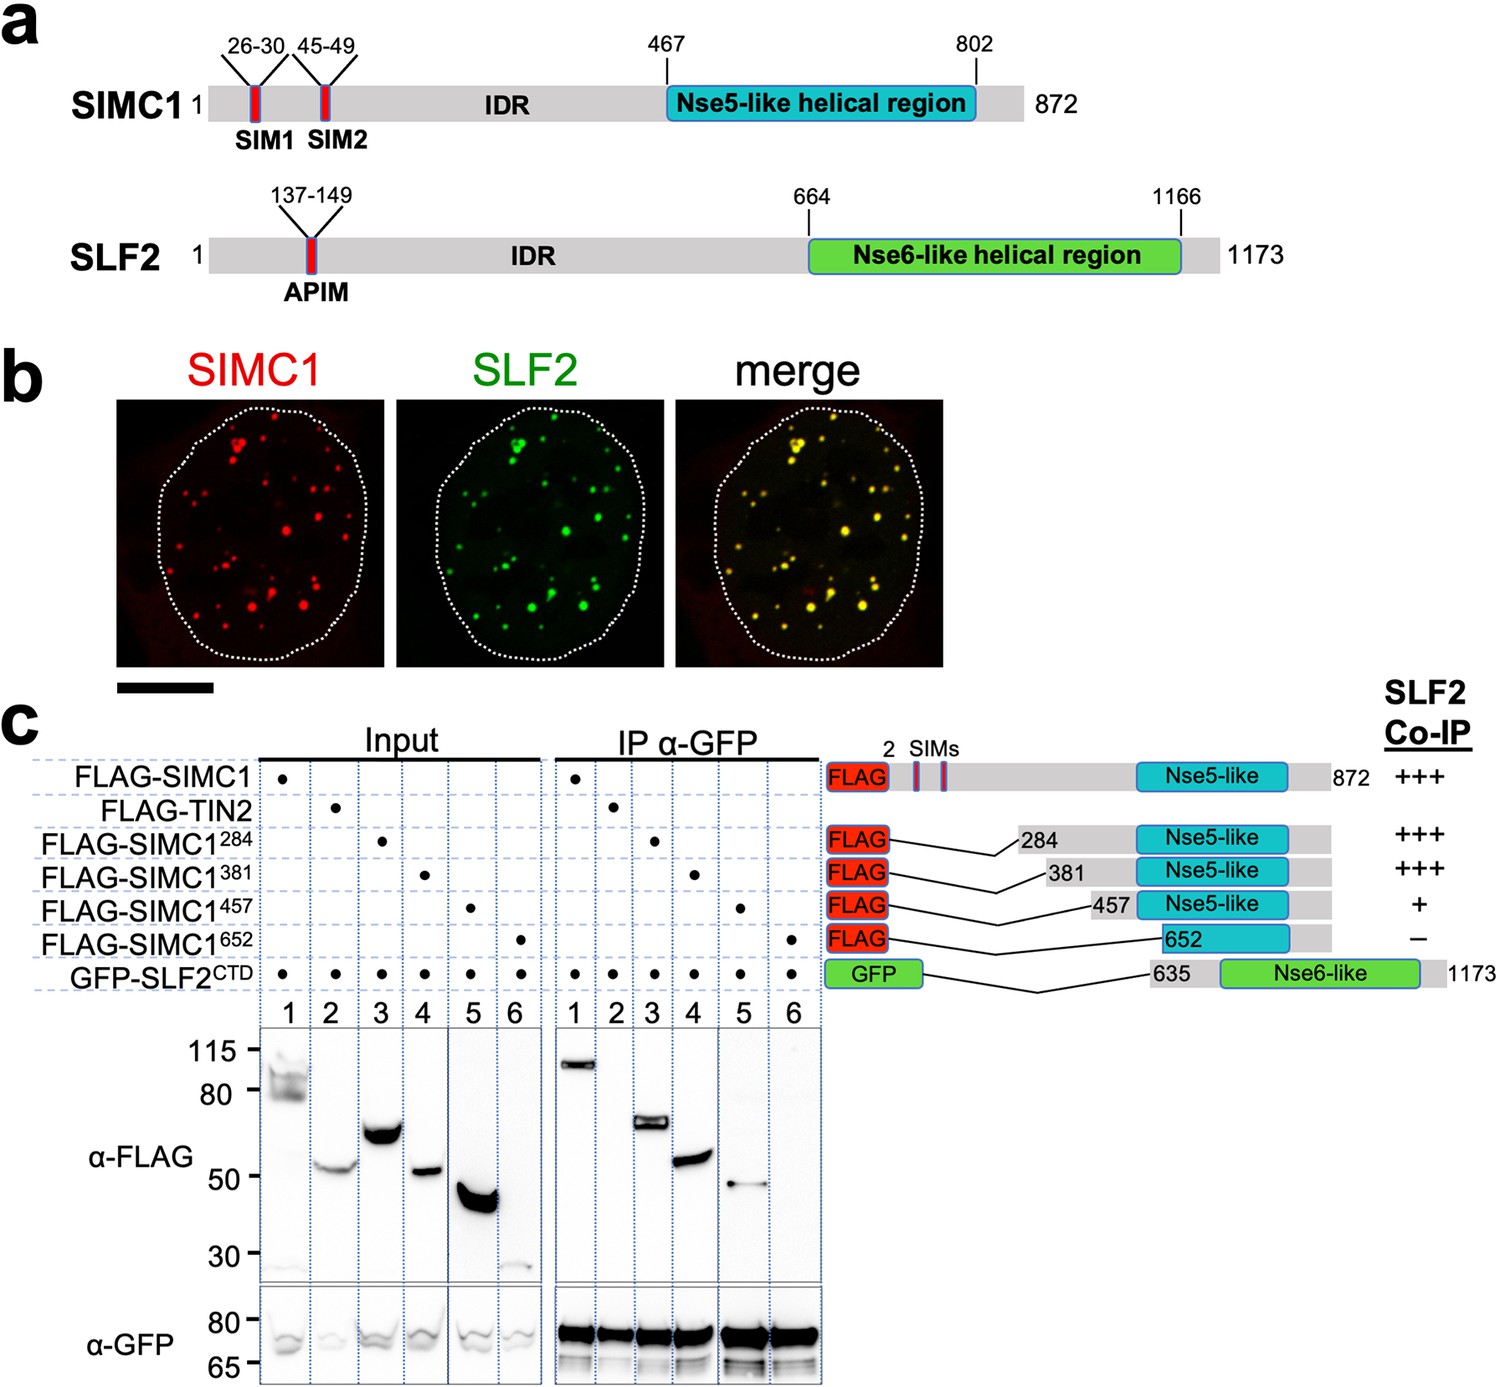
The Nse5- and Nse6-like domains of SIMC1 and SLF2 interact.
(a) Schematic representation of SIMC1 and SLF2. SIM1/2, SUMO interaction motifs; IDR, intrinsically disordered regions; APIM, AlkB homologue 2 PCNA-interacting motif. (b) Representative immunofluorescence images of U2OS cells overexpressing mCherry-SIMC1 and GFP-SLF2 that were fixed and stained with DAPI. Dotted outline marks nucleus. Scale bar 10 µm. (c) Western blot of GFP-Trap immunoprecipitation from HEK293 cells transfected with plasmids expressing the indicated combinations of proteins. Truncation constructs of SIMC1 and SLF2 are represented schematically including the status of SIMC1-SLF2 interaction that is, +++ > +, – undetectable. Full and unedited blots provided in Figure 2—source data 1.
-
Figure 2—source data 1
Full and unedited blots corresponding to panel (c).
- https://cdn.elifesciences.org/articles/79676/elife-79676-fig2-data1-v2.zip
Figure 2—figure supplement 1
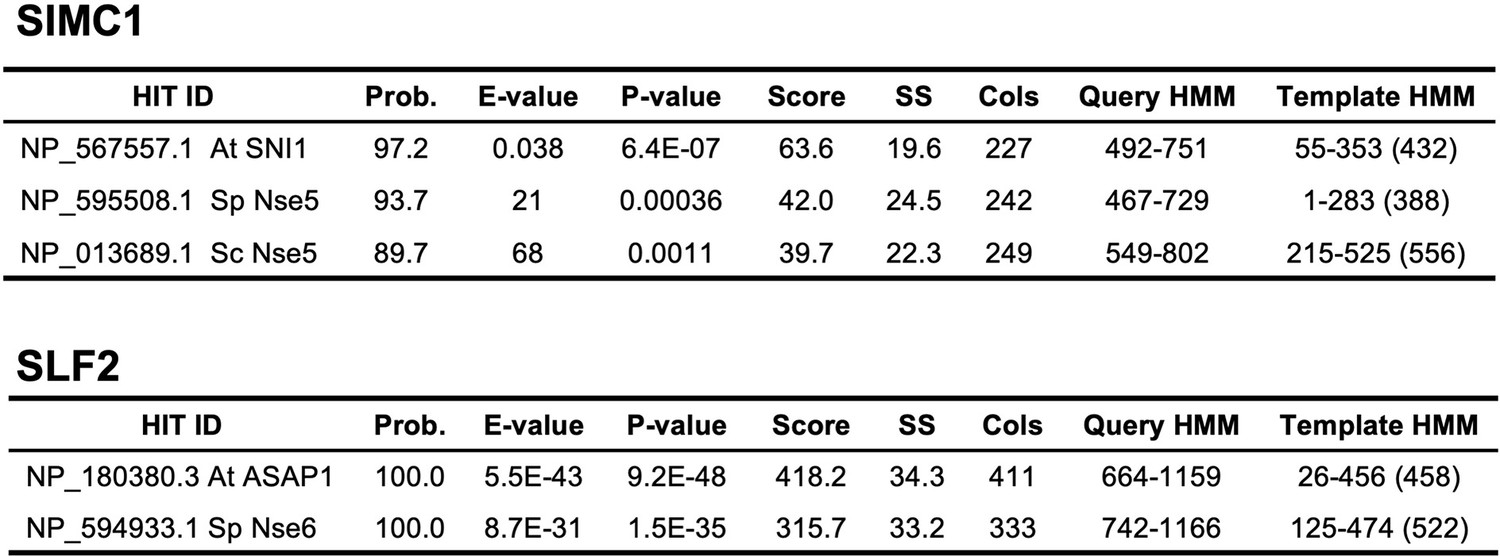
HHPred homology searches for full-length SIMC1 (Q8NDZ2) and SLF2 (Q8IX21).
Query proteomes: Arabidopsis thaliana, Saccharomyces cerevisiae, Schizosaccharomyces pombe.
Figure 2—figure supplement 2
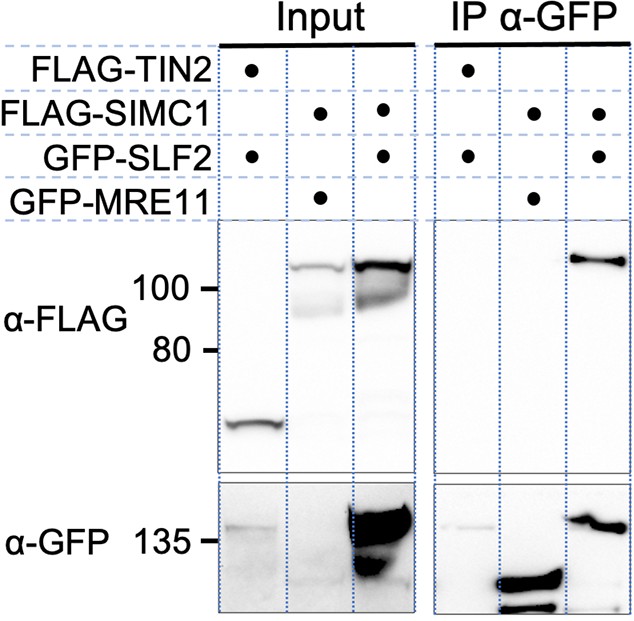
Full-length SIMC1 and SLF2 co-immunoprecipitate.
Western blot of GFP-Trap immunoprecipitation from HEK293 cells transfected with plasmids expressing the indicated combinations of proteins. Full and unedited blots provided in Figure 2—figure supplement 2—source data 1.
-
Figure 2—figure supplement 2—source data 1
Full and unedited blots.
- https://cdn.elifesciences.org/articles/79676/elife-79676-fig2-figsupp2-data1-v2.zip
Figure 2—figure supplement 3
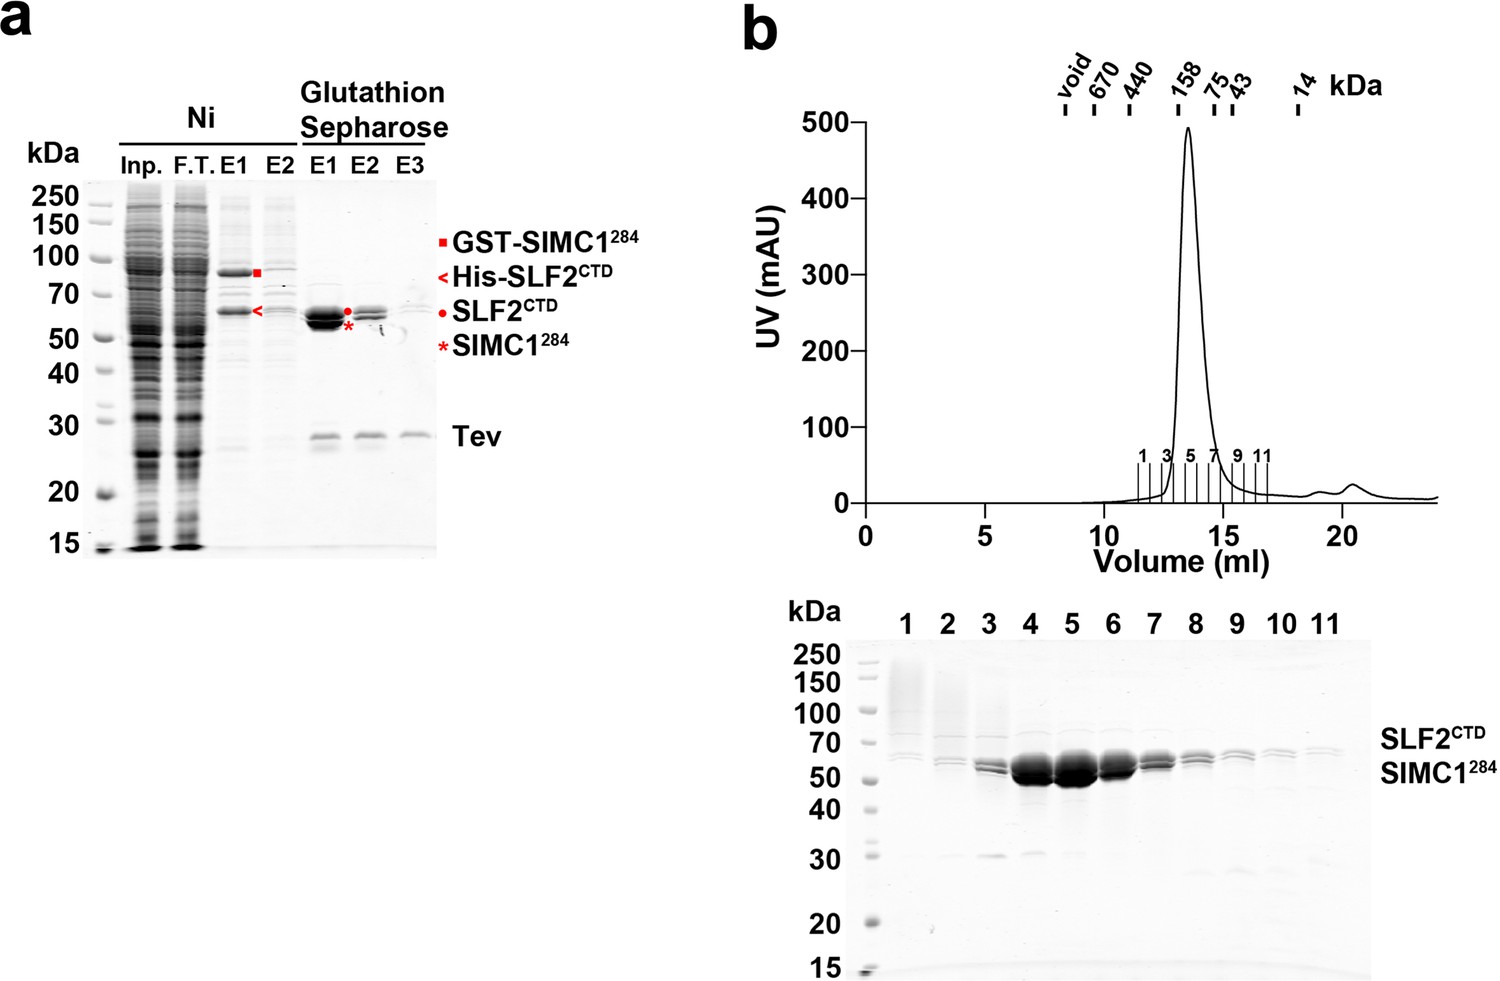
Purification of the SIMC1284-SLF2CTD complex from insect cells.
(a) SDS-PAGE analysis of Ni- and glutathione-affinity purifications. The Ni elution contained GST-SIMC1284 and His-SLF2CTD. The Ni eluate was loaded onto glutathione sepharose and proteins were eluted by Tev protease digestion. The elution fractions contained untagged SIMC1284 and SLF2CTD. (b) Superdex 200 size exclusion chromatography of the glutathione elution. SIMC1284 and SLF2CTD co-eluted in a single peak at the position corresponding to a globular domain of ~120 kDa, which matches with the mass of the complex. Full and unedited gels provided in Figure 2—figure supplement 3—source data 1.
-
Figure 2—figure supplement 3—source data 1
Full and unedited gels.
- https://cdn.elifesciences.org/articles/79676/elife-79676-fig2-figsupp3-data1-v2.zip
Figure 3

SIMC1 interacts with SMC5/6 and SUMO pathway factors.
(a, b) A subset of SIMC1 interacting proteins identified by BioID screen carried out under native (a) or denaturing (b) lysis conditions, respectively. Pink circle illustrates the biotinylation radius of BirA*. BioID datasets are available in the PRIDE database (https://www.ebi.ac.uk/pride/archive) under the accession code PRIDE PXD033923 and in Supplementary file 2. (c) Representative immunofluorescence images of U2OS cells overexpressing mCherry-SIMC1 or mCherry-SIMC1 SIM mut (mutations: FIDL to AADA (26–29 aa) and VIDL to AADA (45–48 aa)) that were stained for PML (left three panels); or were co-expressing GFP-ZNF451 (right three panels). The cells were stained with DAPI to mark nucleus (dotted lines). Scale bar 10 µm. (d) HEK293 cells overexpressing ZNF451, BirA*-SIMC1, SLF2, BirA* control in indicated combination were cultured in the presence of 50 μM supplemental biotin. The total cell extracts and streptavidin pulldown were analyzed by western blot using anti-GFP or Myc antibodies. Full and unedited blots provided in Figure 3—source data 1.
-
Figure 3—source data 1
Full and unedited blots corresponding to panel (d).
- https://cdn.elifesciences.org/articles/79676/elife-79676-fig3-data1-v2.zip
Figure 4 with 1 supplement
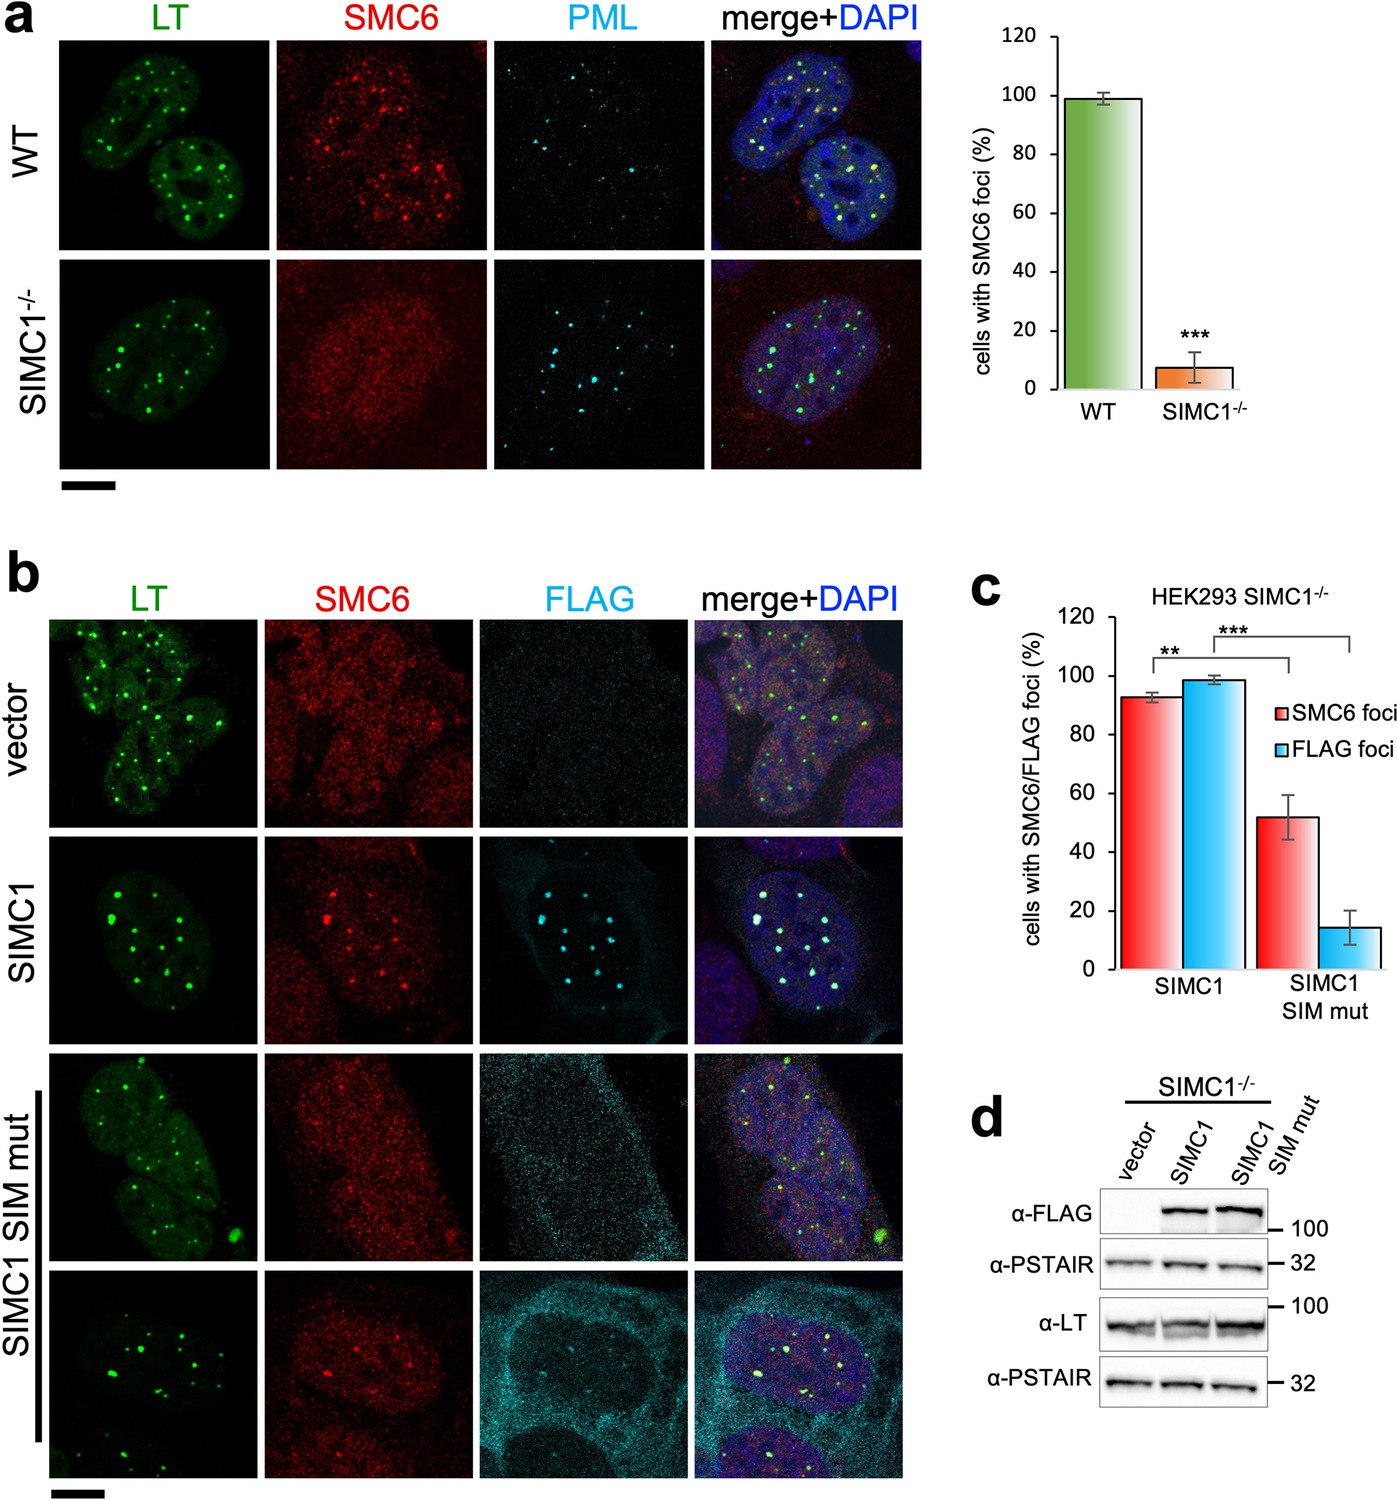
SIMC1 recruits SMC5/6 to SV40 replication centers.
(a) Representative immunofluorescence images of SV40 LT (green), SMC6 (red) and PML (light blue) in HEK293 and HEK293 SIMC1-/- cells fixed 48 h after SV40 transfection. Scale bar 10 μm. The bar graph shows relative quantification of the number of cells containing SMC6 foci. A minimum of 175 cells with at least four SV40 LT foci were counted for each cell line. Primary data for graph in panel (a) provided in Figure 4—source data 1. (b) Representative immunofluorescence images of HEK293 SIMC1-/- cells with integrated empty vector or vectors expressing FLAG-SIMC1 or FLAG-SIMC1 SIM mut, respectively, 48 hr after SV40 transfection. SV40 LT (green), SMC6 (red), FLAG (light blue); Scale bar 10 μm. (c) Relative quantification of the number of cells containing SMC6 and FLAG foci (representative images shown in panel b). A minimum of 225 cells with at least four SV40 LT foci were counted for each cell line. Primary data provided in Figure 4—source data 2. (d) Immunoblot from HEK293 SIMC1-/- cells with integrated empty vector or vector expressing FLAG-SIMC1 or SIMC1 SIM mut, respectively, and transfected with a plasmid carrying SV40 genome. Cells were harvested 48 hr after transfection. PSTAIR serves as a loading control. Full and unedited blots provided in Figure 4—source data 3. Statistics in (a, c): Means and error bars (s.d.) were derived from a minimum of three independent SV40 transfections representing biological replicates. (∗) p<0.05; (∗∗) p<0.005; (∗∗∗) p<0.0005; (n.s.) p>0.05 (two-tailed unpaired t-test).
-
Figure 4—source data 1
Primary data for graphs in panel (a).
- https://cdn.elifesciences.org/articles/79676/elife-79676-fig4-data1-v2.xlsx
-
Figure 4—source data 2
Primary data for graphs in panel (c).
- https://cdn.elifesciences.org/articles/79676/elife-79676-fig4-data2-v2.xlsx
-
Figure 4—source data 3
Full and unedited blots corresponding to panel (d).
- https://cdn.elifesciences.org/articles/79676/elife-79676-fig4-data3-v2.zip
Figure 4—figure supplement 1
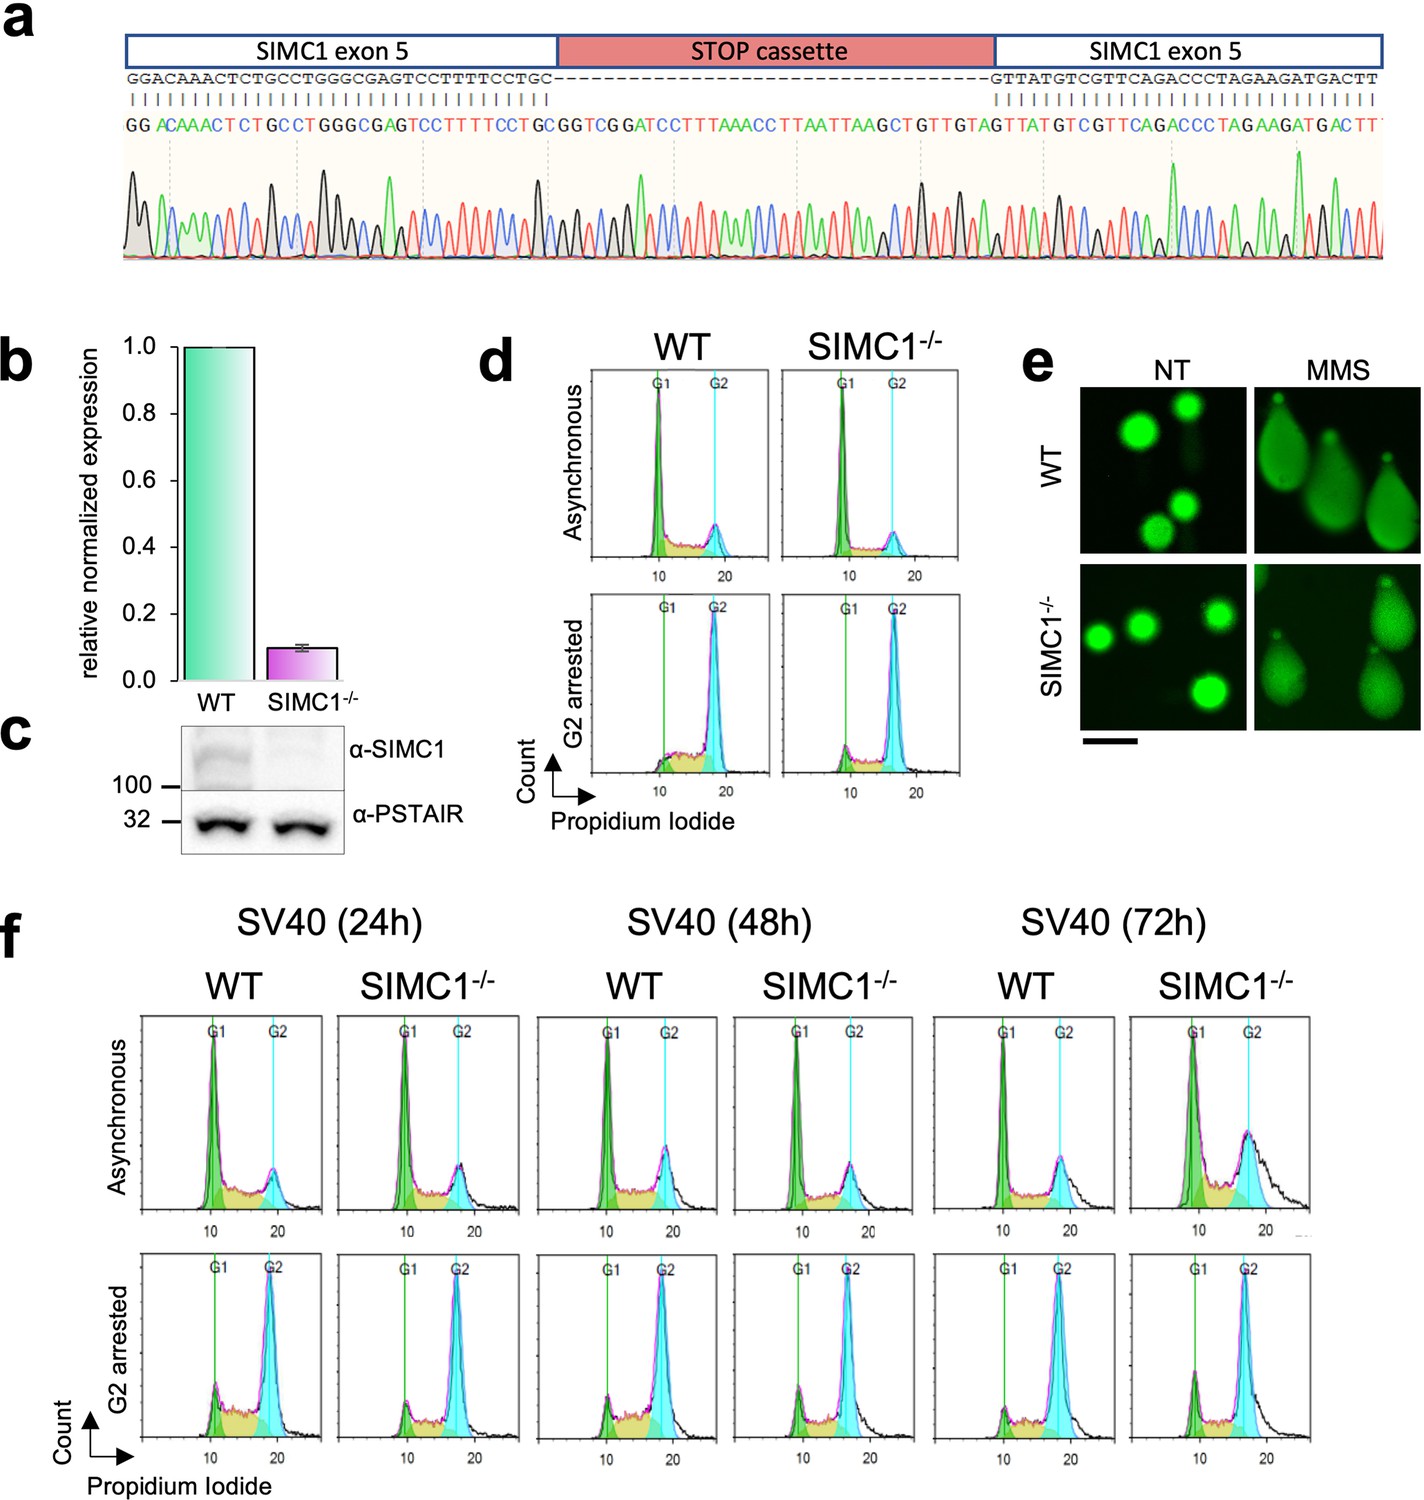
Validation of HEK293 SIMC1-/- clone.
(a) Sanger sequencing of exon 5 to verify the insertion of STOP cassette (red). (b, c) SIMC1 expression was measured by quantitative PCR and normalized to the expression of beta-actin (mean ± s.d. from n=4 independent experiments,two-tailed unpaired t-test p<0.0005) and also analyzed on western blot using PSTAIR as a loading control. Primary data for graph in panel (b) and full, unedited blots for panel (c) provided in Figure 4—figure supplement 1—source data 1, Figure 4—figure supplement 1—source data 2. (d) Flow cytometry analysis of cell cycle profile of asynchronous or G2/M nocodazole arrested cells. (e) Comet assay assessing the spontaneous DNA damage. As a control, cells were treated with 1 mM MMS for 1 hr. Scale bar 100 μm. (f) Flow cytometry analysis of cell cycle profile of asynchronous or nocodazole-treated cells arrested in G2/M in cells transfected with SV40. Cells were treated with nocodazole at the indicated time points after SV40 transfection.
-
Figure 4—figure supplement 1—source data 1
Primary data for graphs in panel (b).
- https://cdn.elifesciences.org/articles/79676/elife-79676-fig4-figsupp1-data1-v2.xlsx
-
Figure 4—figure supplement 1—source data 2
Full and unedited blots corresponding to panel (c).
- https://cdn.elifesciences.org/articles/79676/elife-79676-fig4-figsupp1-data2-v2.zip
Figure 5 with 14 supplements
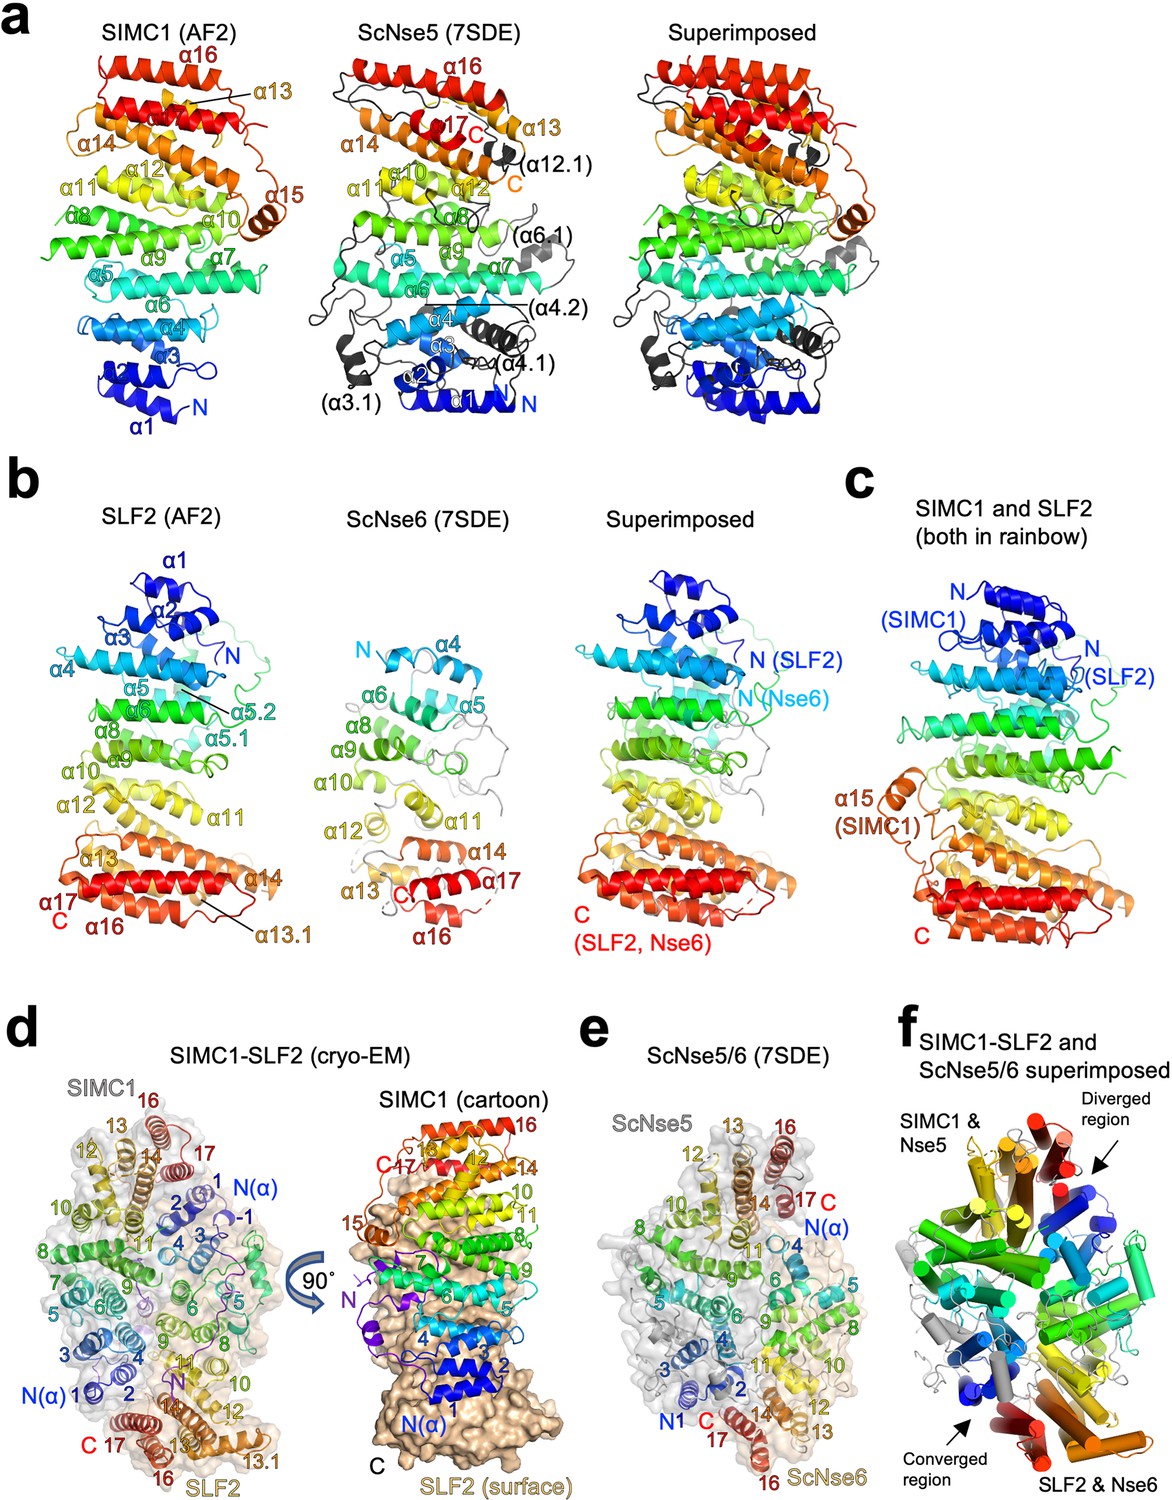
Structural analyses of the SIMC1-SLF2 complex.
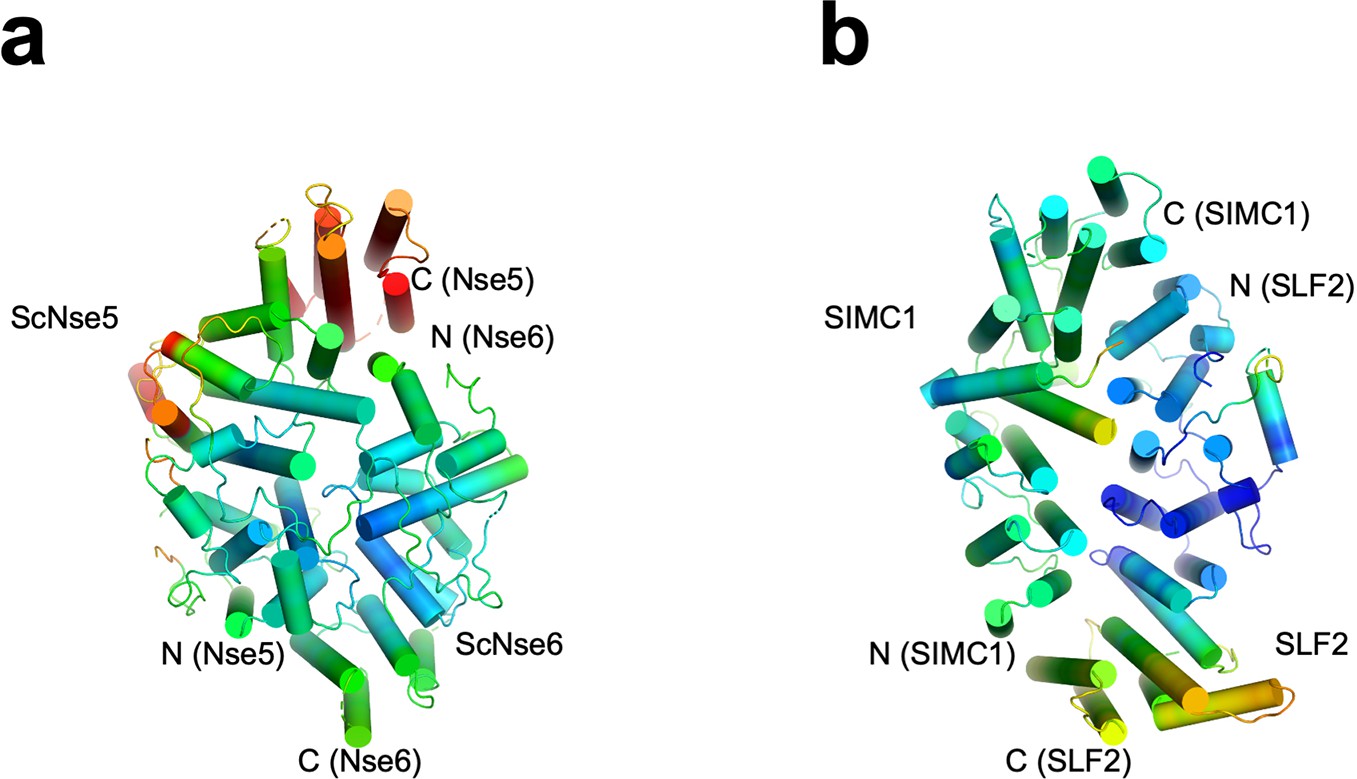
(a) The AlphaFold 2 (AF2) model of SIMC1 and its comparison to ScNse5. The C-terminal α-solenoid domain (468–858 aa) is shown on the left in the blue-red rainbow. The disordered 629–653 aa region between α8 and α9 is excluded for clarity. ScNse5 of the cryo-EM ScNse5/6 structure (PDB ID: 7SDE) is shown in the middle. Each α-helix is colored to match the corresponding α-helix of SIMC1. ScNse5’s α-helices colored in black are not found in SIMC1. The superimposition of SIMC1 and ScNse5 is shown on the right. (b) AF2 model of SLF2 and its comparison to ScNse6. The C-terminal α-solenoid domain of SLF2 (755–1158 aa) is shown on the left. ScNse6 structure (PDB ID: 7SDE) shown in the middle is colored to match the α-helices of SIMC1. The superimposition of SLF2 and ScNse6 is shown on the right. (c) Overlay of SIMC1 and SLF2 AF2 models. (d) Cryo-EM structure of the SIMC1-SLF2 complex. Both SIMC1 and SLF2 structures contain a loop-like region at their N-termini, which are colored purple. The label “N(α)” indicates the N-terminus of each α-solenoid fold. On the right panel, SIMC1’s surface is drawn only for its α-solenoid domain to clarify the N-terminal loop of SIMC1. (e) The cryo-EM structure of ScNse5/6 (PDB: 7SDE). (f) Superimposition of the SIMC1-SLF2 and ScNse5/6 complexes. Well-converged and diverged regions are indicated.
Figure 5—figure supplement 1
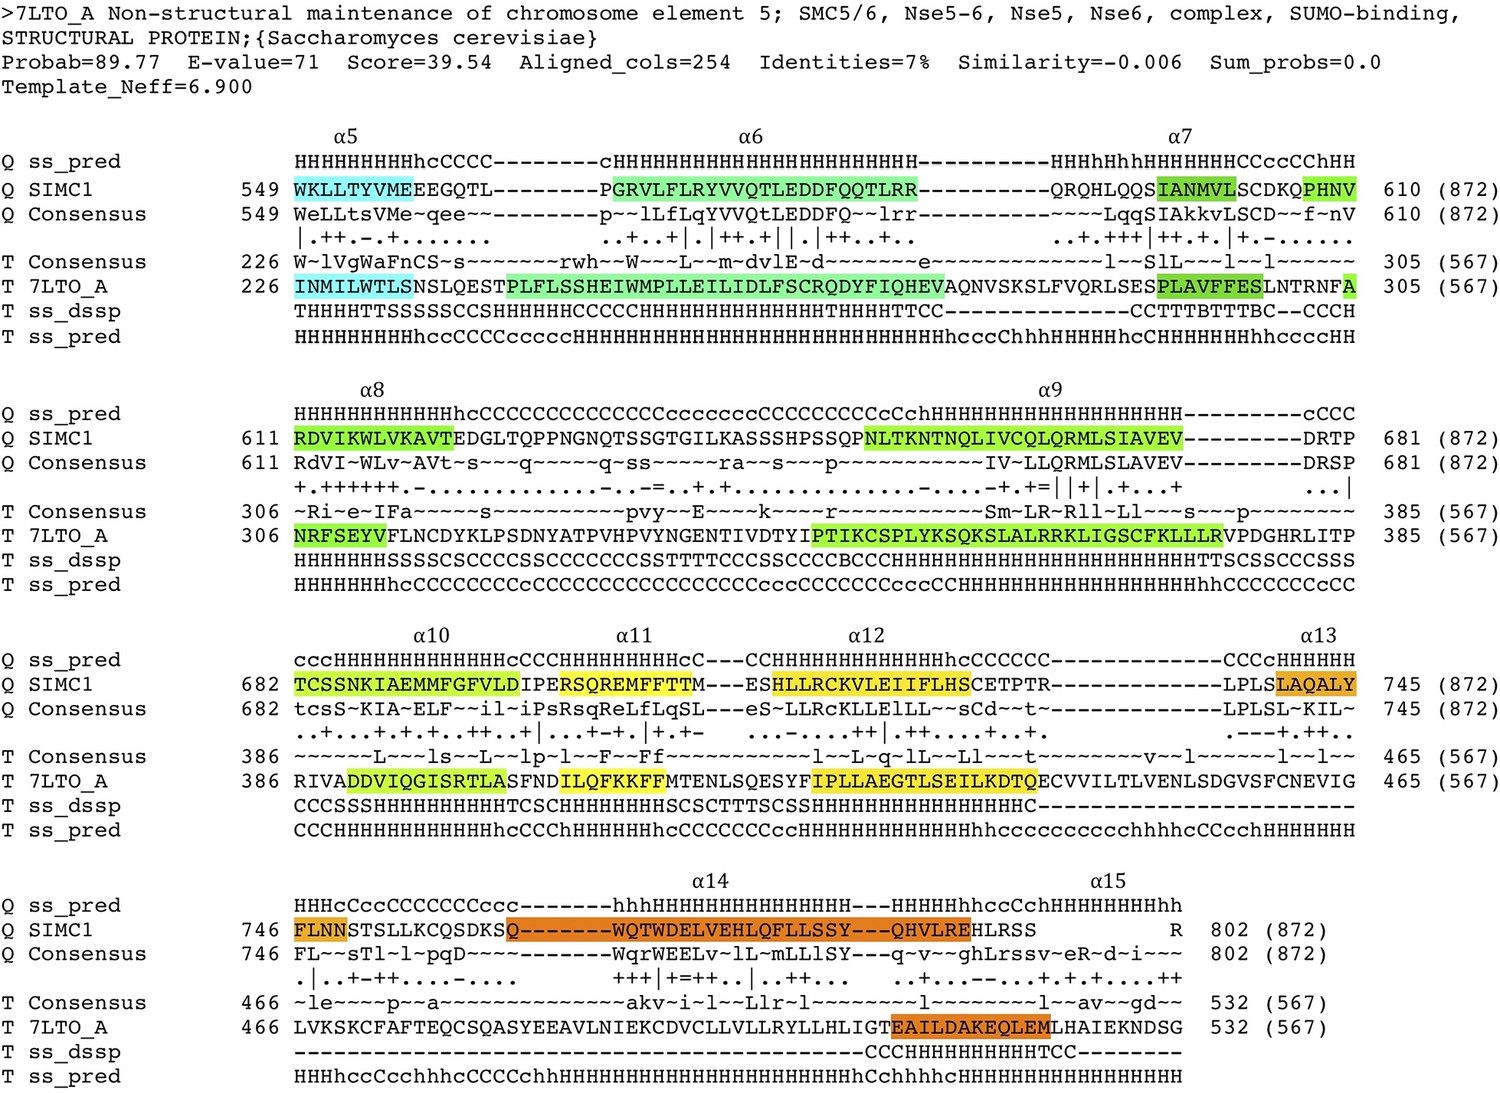
HHpred-aligned SIMC1 and ScNse5 (7LTO_A) sequences.
The α-helices determined by experimental structures are colored. The colors match the rainbow used for cartoon structures shown in Figure 5.
Figure 5—figure supplement 2
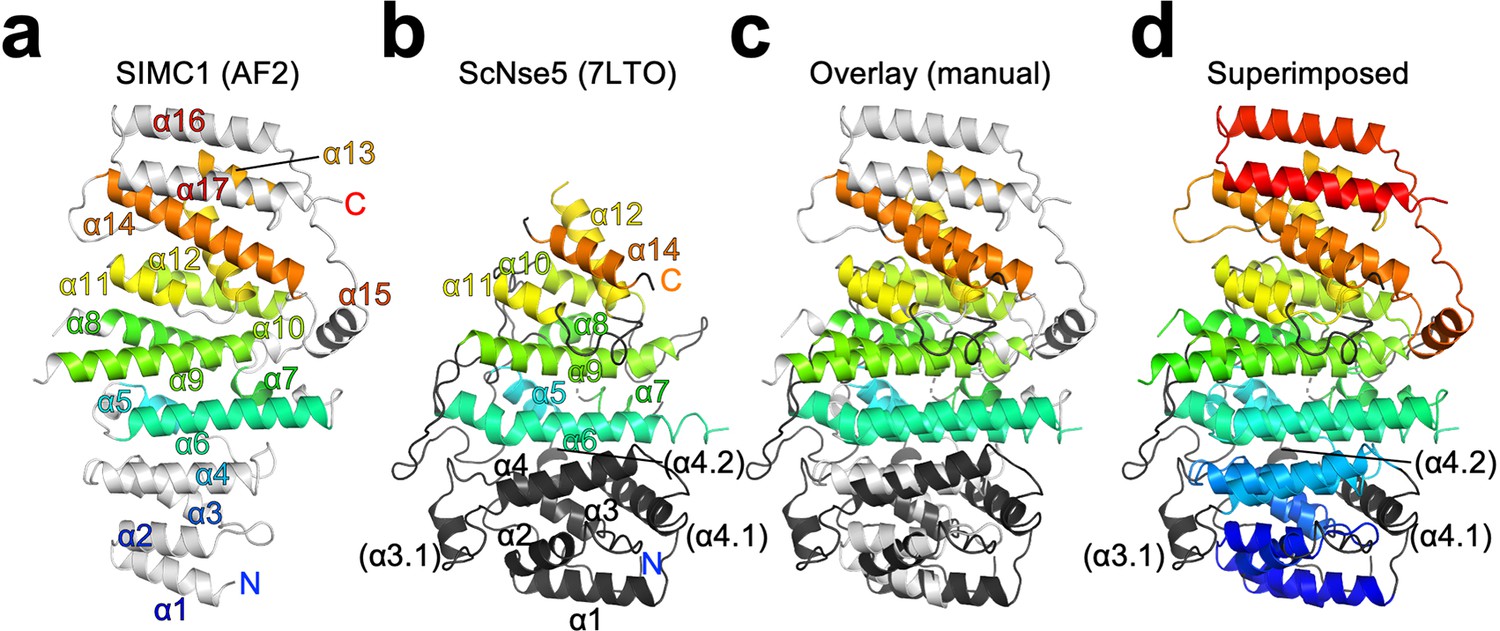
Structural alignment of SIMC1 and ScNse5.
(a, b) Remote homology mapping on the α-solenoid domain of SIMC1 AlphaFold model residues 468–858 excluding the 629–653 loop for clarity, (a) and ScNse5 structure (PDB ID: 7LTO), (b). The HHpred matches are indicated by the same color. (c) Manually aligned SIMC1 and Nse5 are shown as an overlay. (d) SIMC1 is colored in the blue-red full rainbow spectrum and Nse5 is colored by the same manner as in the middle panel. The labels ‘N’ and ‘C’ indicate the N- and C-termini, respectively, of the protein chains.
Figure 5—figure supplement 3
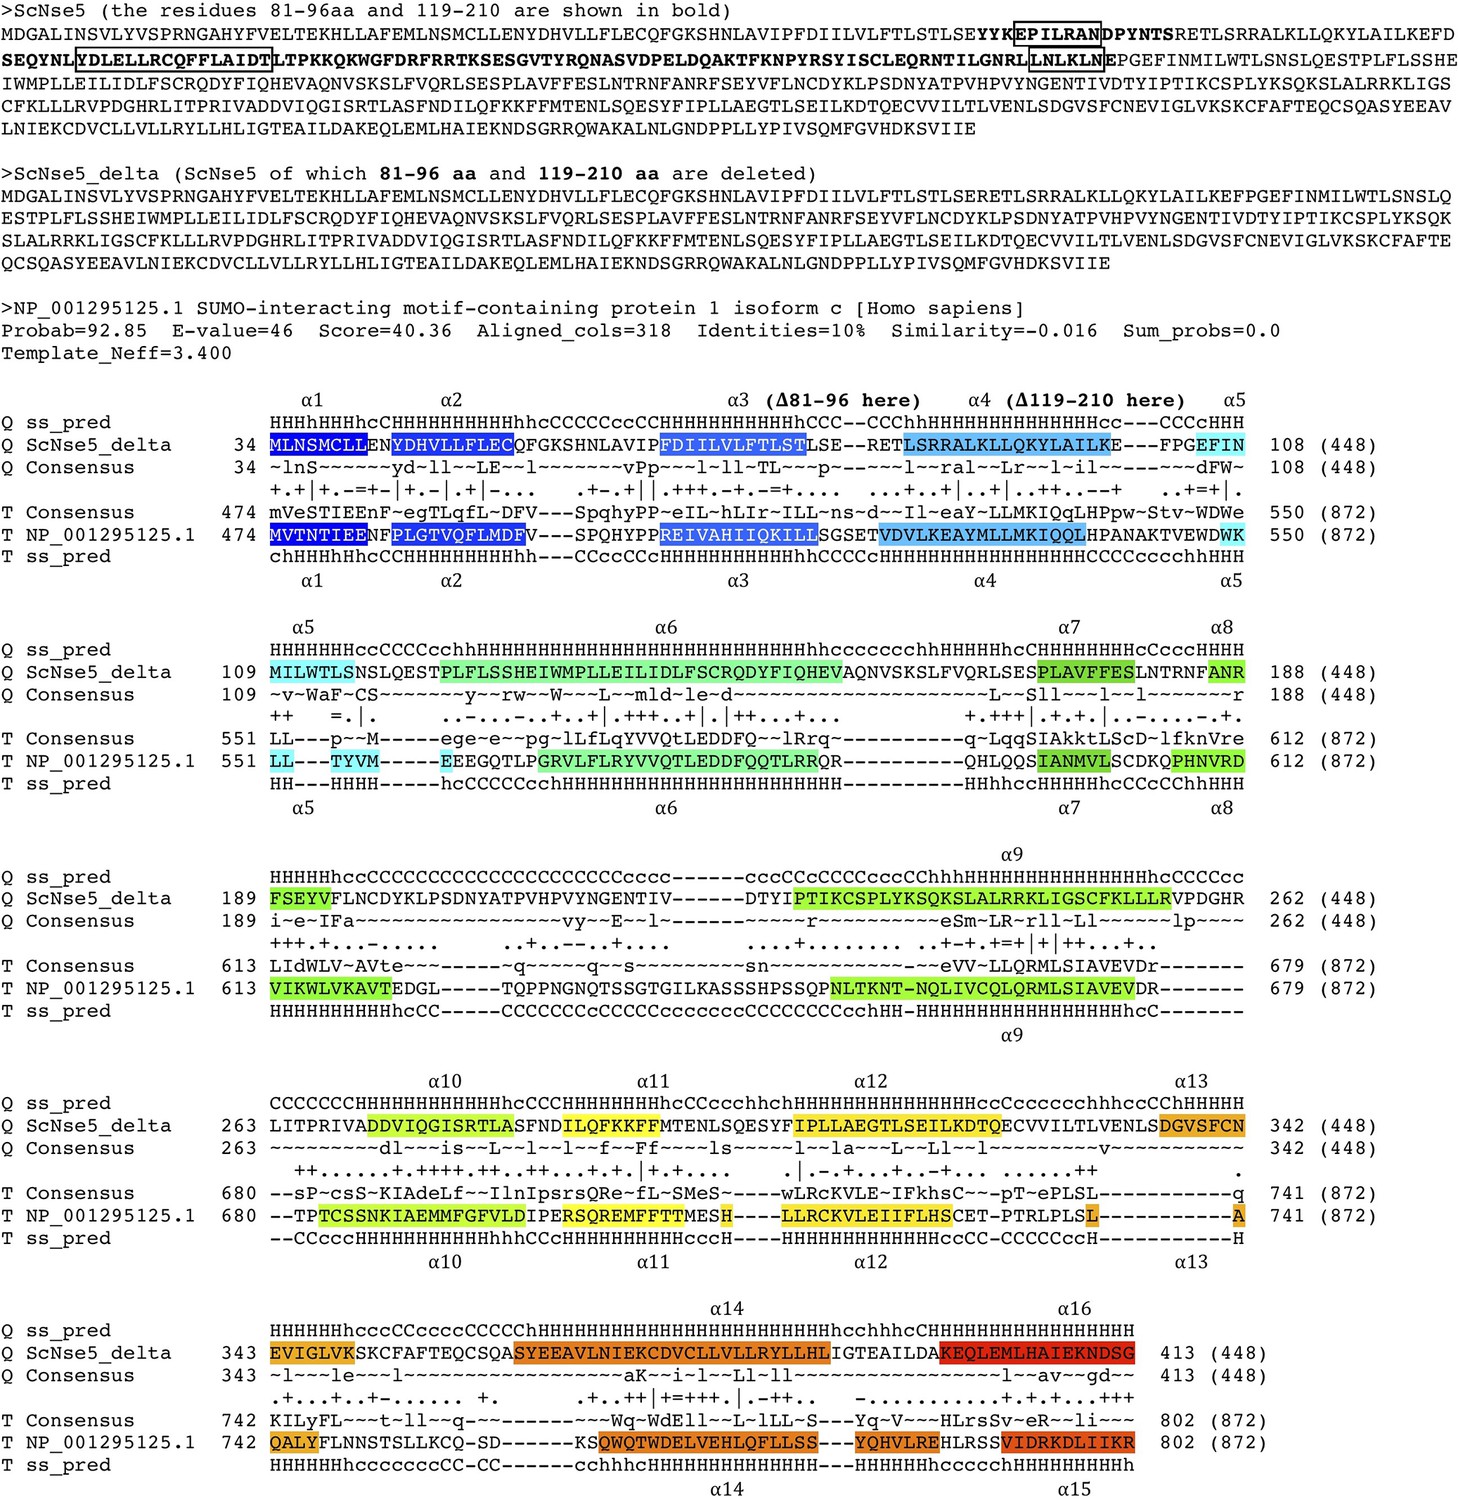
The HHpred sequence alignment of an internally truncated ScNse5 and SIMC1.
ScNse5 sequence is shown with the residues 81–96 aa and 119–210 aa in bold. The boxes indicate α-helices in the regions shown in bold. The sequence of ScNse5 lacking the residues 81–96 aa and 119–210 aa used for an HHpred search is shown as ‘ScNse5_delta’. The resulting sequence alignment covers more N- and C-terminal regions than the initial HHpred alignment shown in Figure 5—figure supplement 1.
Figure 5—figure supplement 4
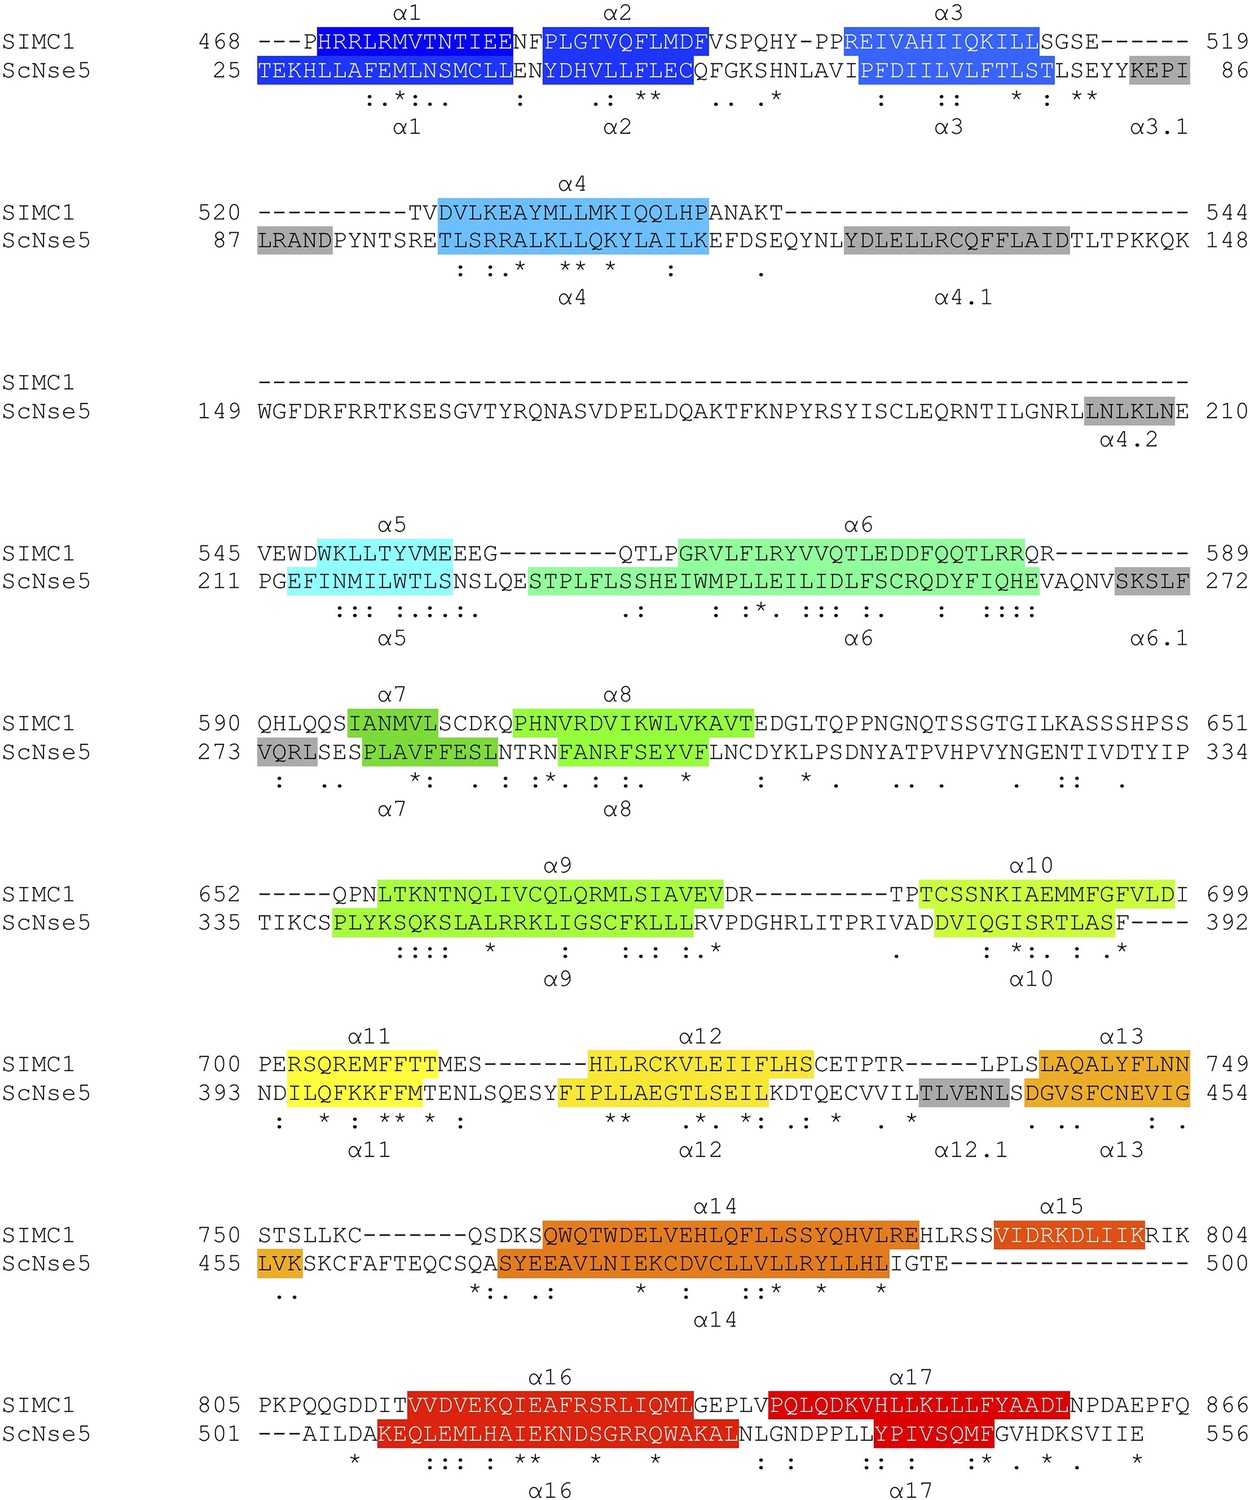
Structure-based sequence alignment of SIMC1 and ScNse5.
Secondary structures (α-helices) are colored.
Figure 5—figure supplement 5
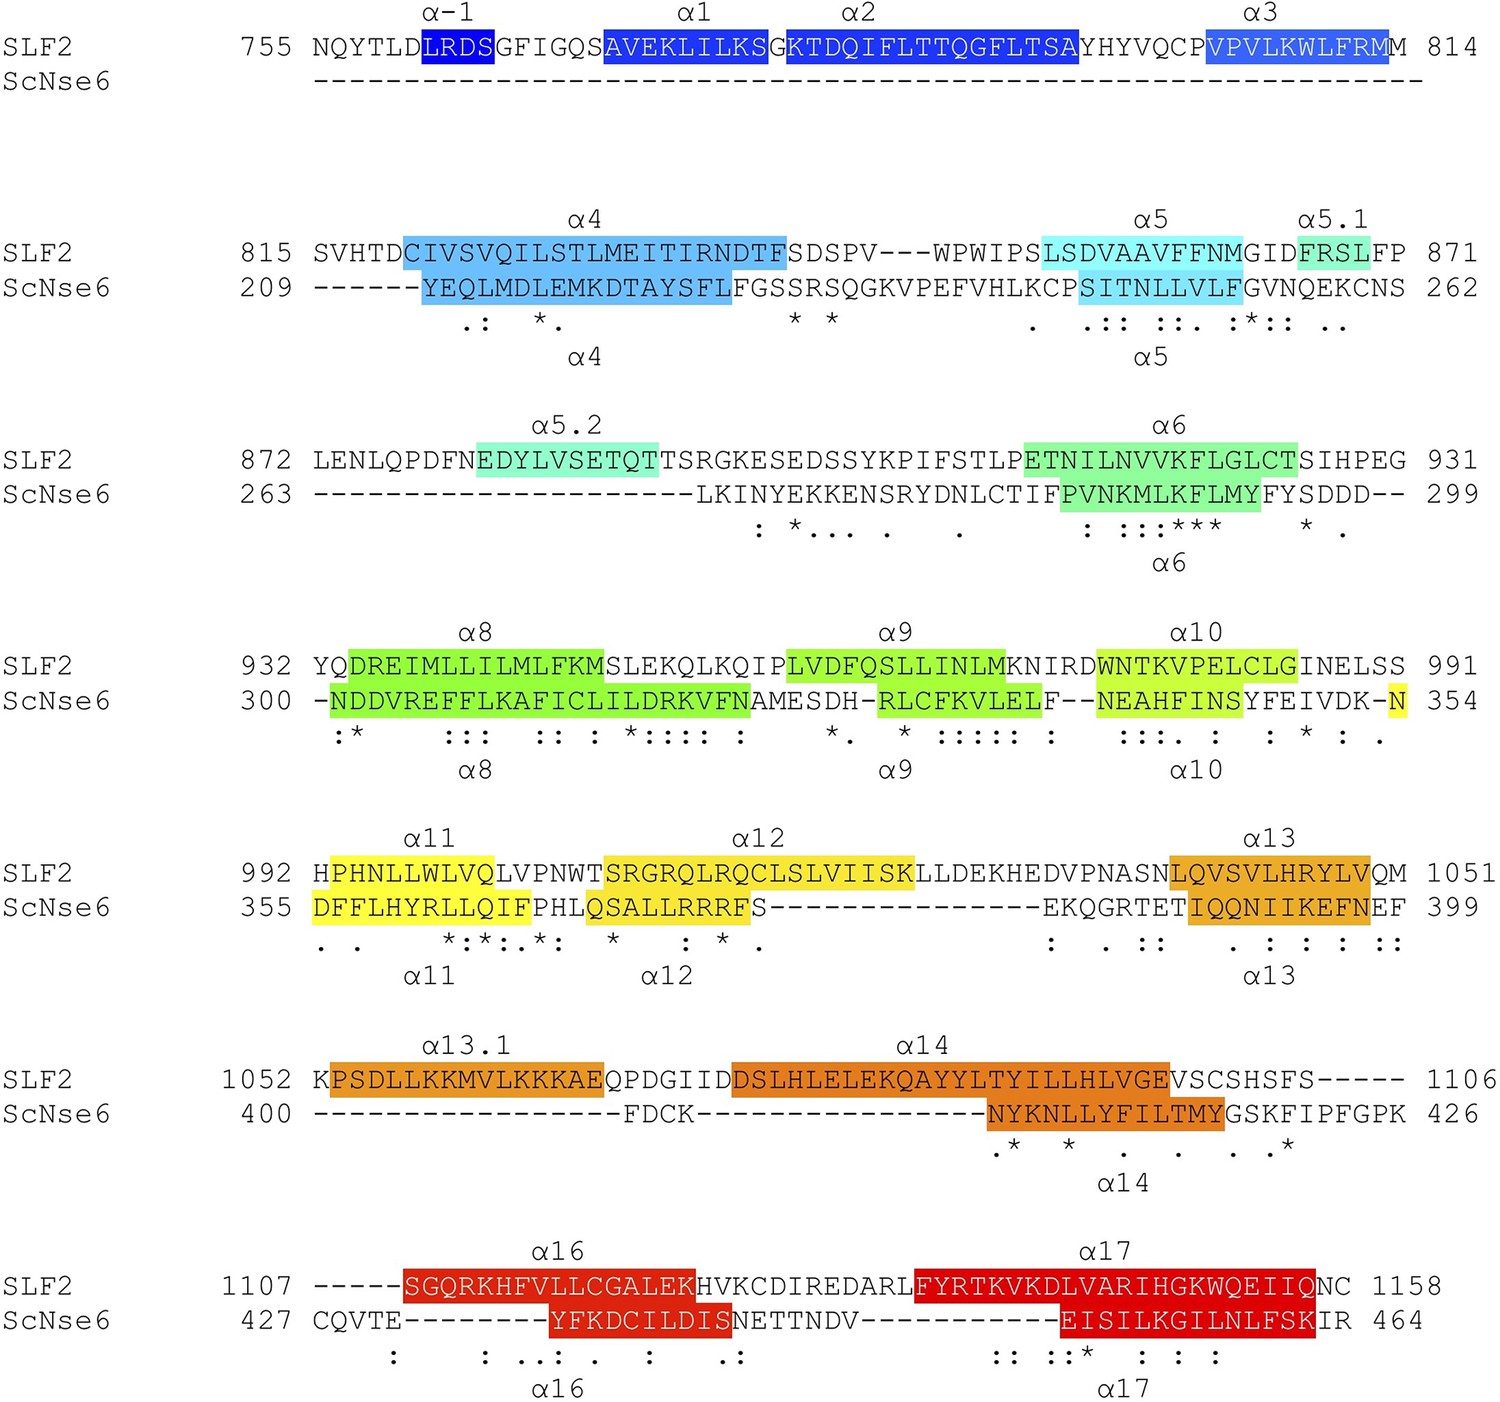
Structure-based sequence alignment of SLF2 and ScNse6.
Secondary structures (α-helices) are colored.
Figure 5—figure supplement 6
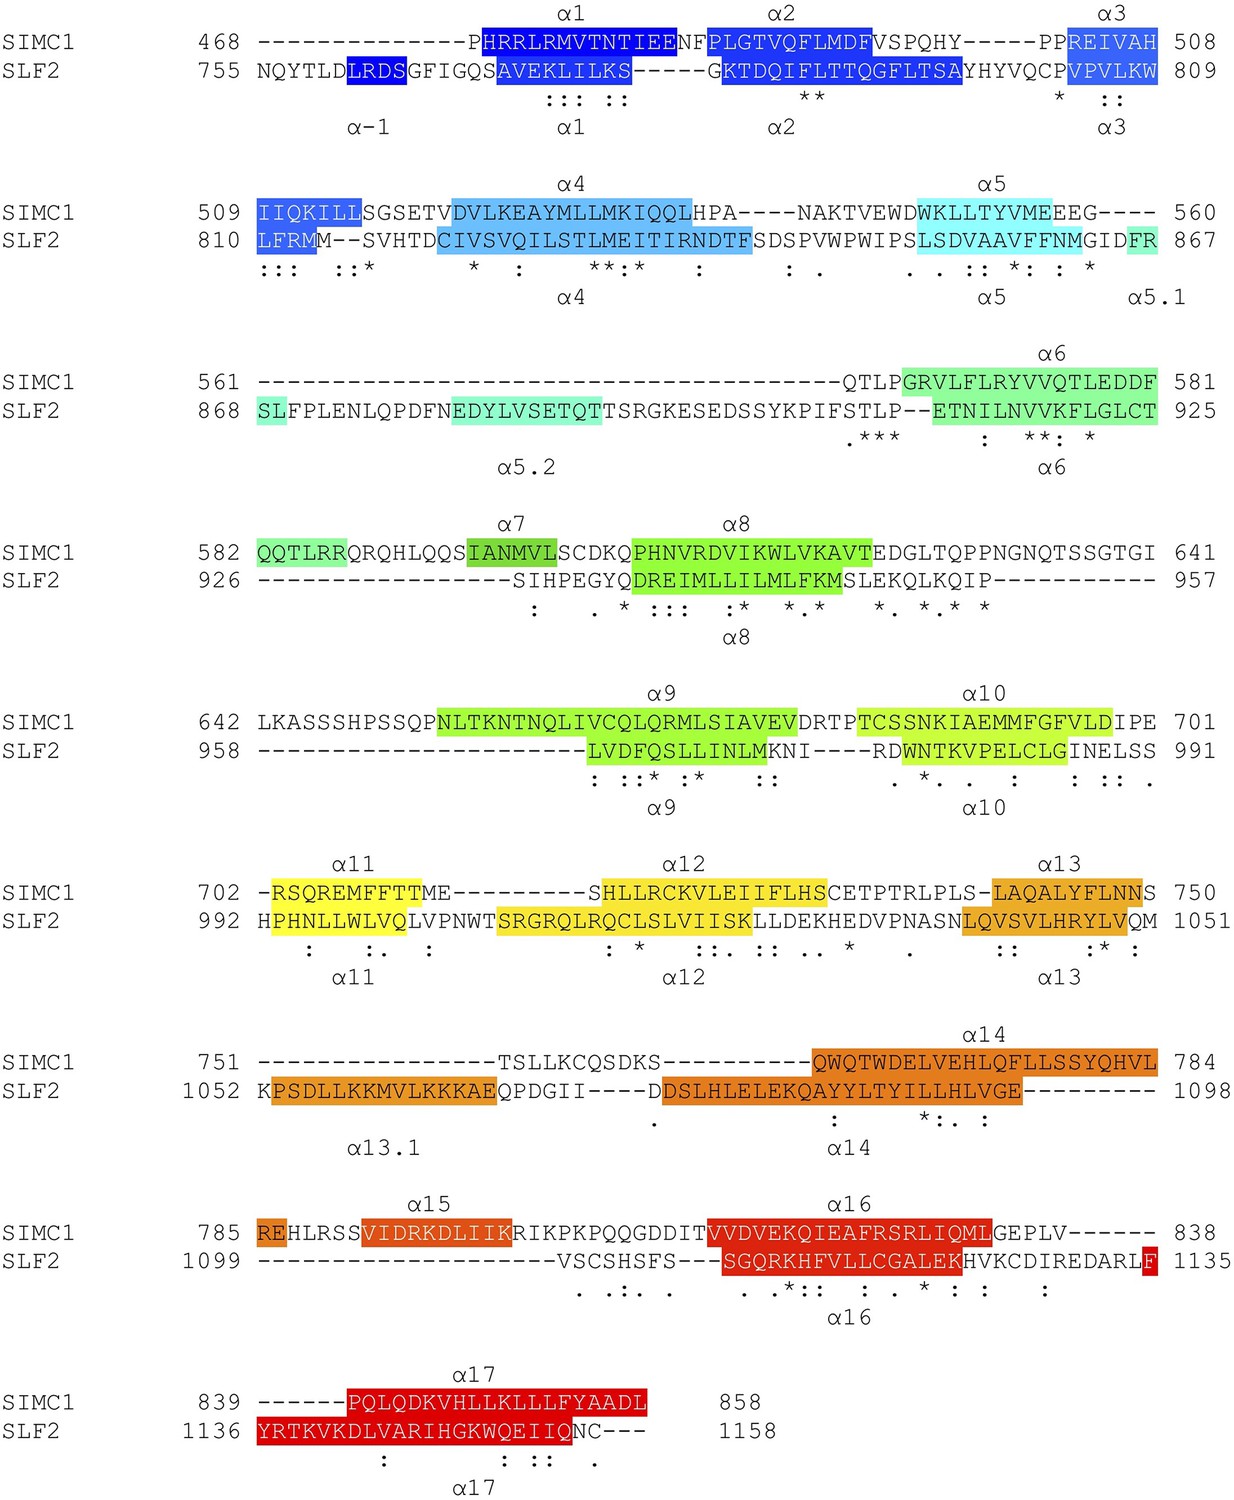
Structure-based sequence alignment of SIMC1 and SLF2.
Secondary structures (α-helices) are colored.
Figure 5—figure supplement 7
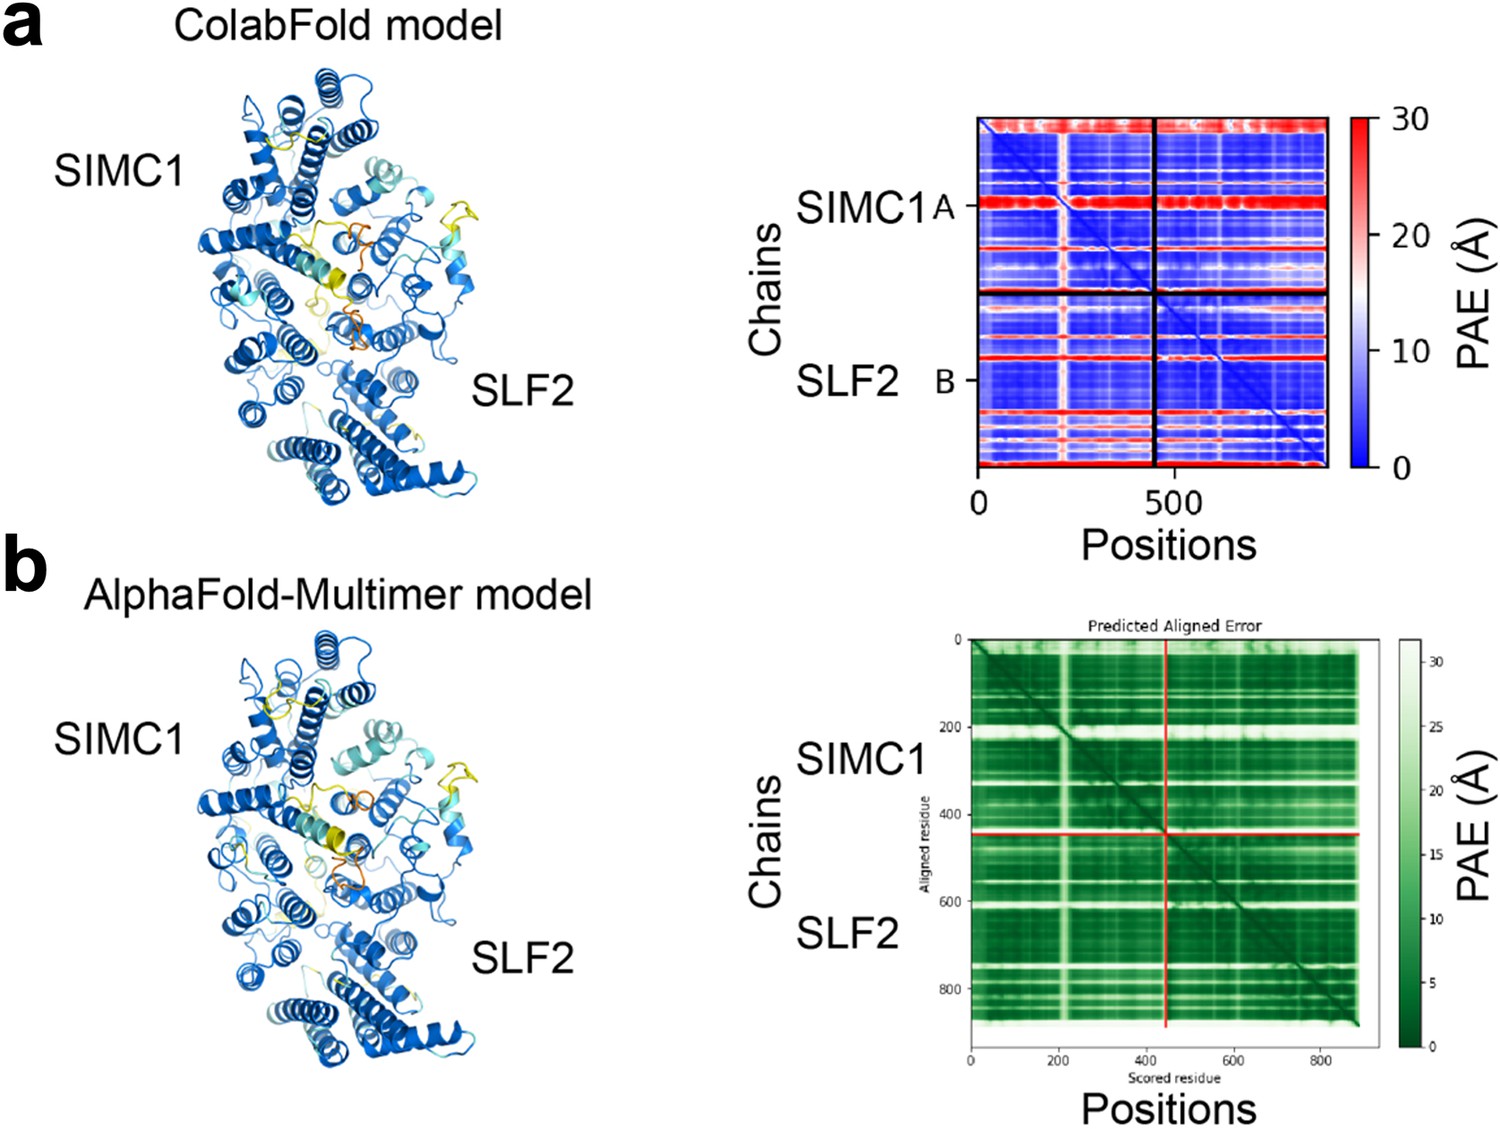
Predictions of the SIMC1-SLF2 structure by ColabFold (a) and AlphaFold-Multimer (b).
SIMC1 (425–872 aa) and SLF2 (733–1173 aa) were used. The predictions are shown on the left and colored by pLDDT. Orange, yellow, sky blue, and blue indicate very low (pLDDT <50), low (50<pLDDT < 70), confident (70<pLDDT < 90), and high (pLDDT >90) regions, respectively. PAE plots are shown on the right. Both plots show low PAE values between subunits, indicating high confidence of the predictions.
Figure 5—figure supplement 8
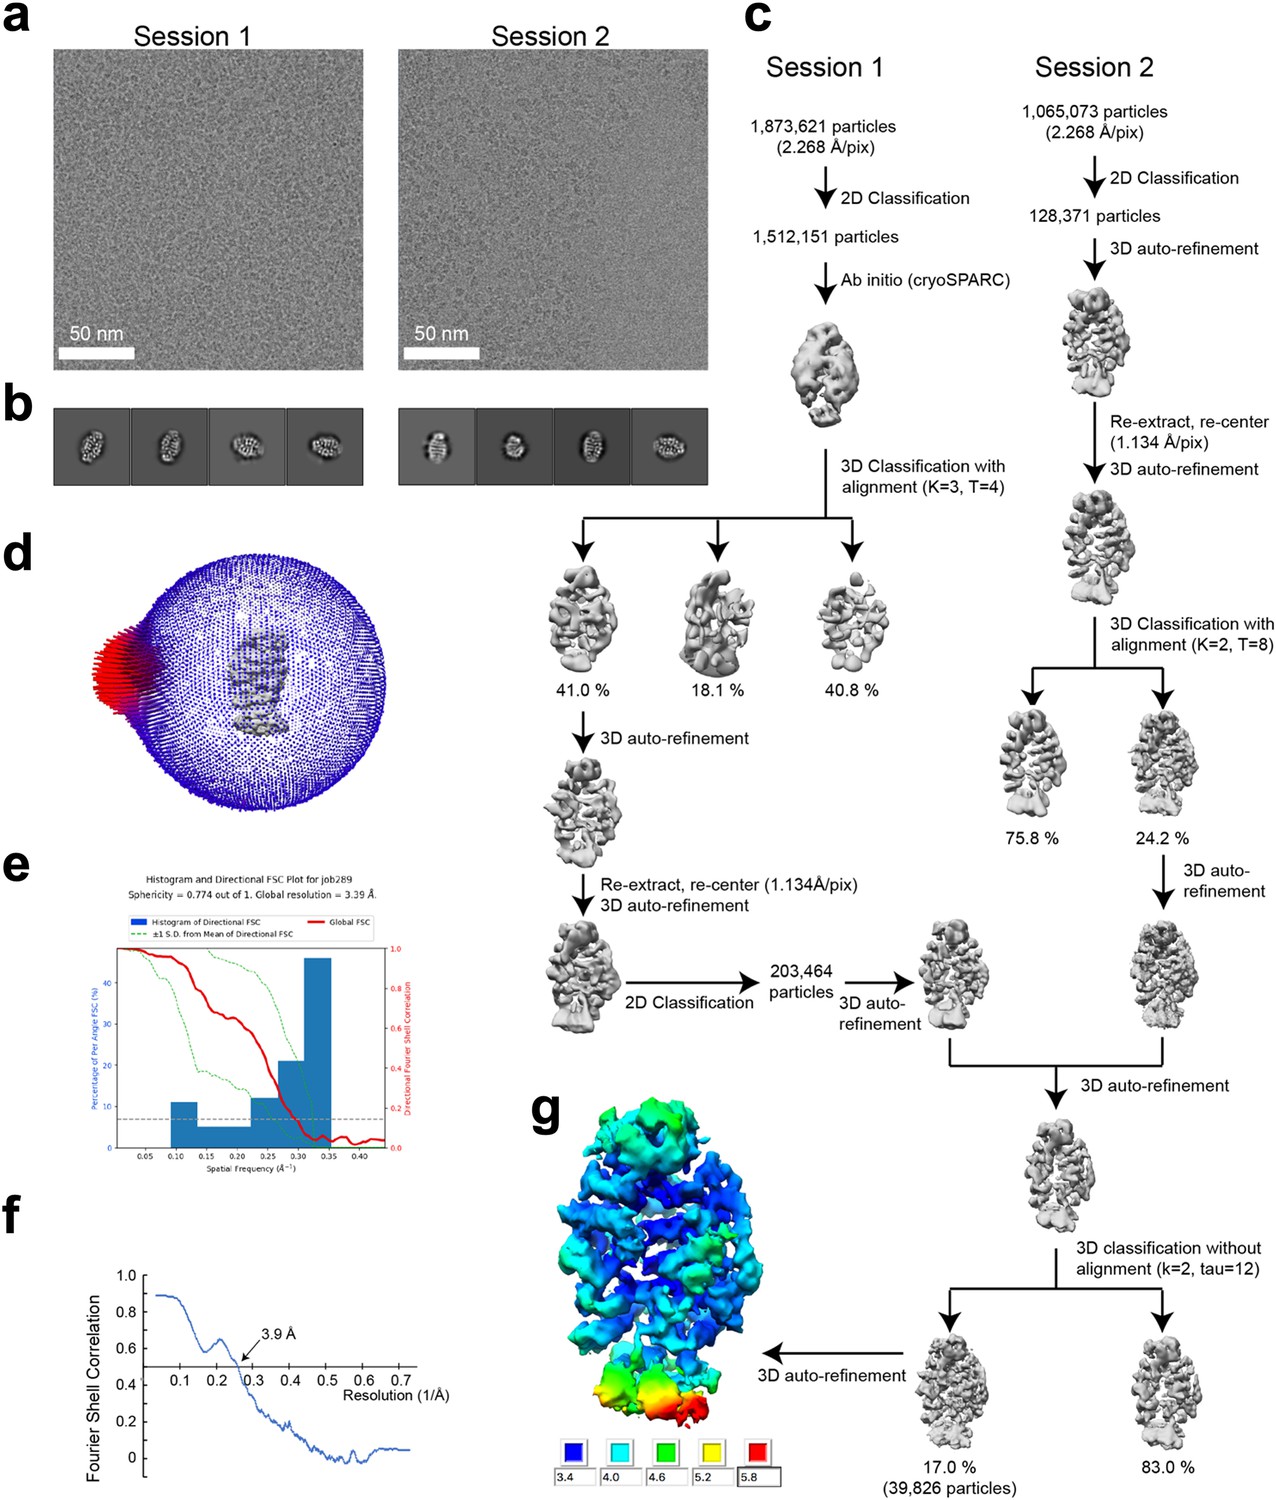
Single-particle cryo-EM data processing of the SIMC1-SLF2 complex.
(a) Representative cryo-electron micrographs from Session1 and 2. (b) Representative 2D class average images of Session 1 and 2. (c) Flow chart of 3D reconstruction. (d) Euler angle distribution of the final particle images. (e) 3D FSC plot. (f) Map-to-model FSC plot. (g) Local resolution estimation shown on the final map (unsharpened).
Figure 5—figure supplement 9
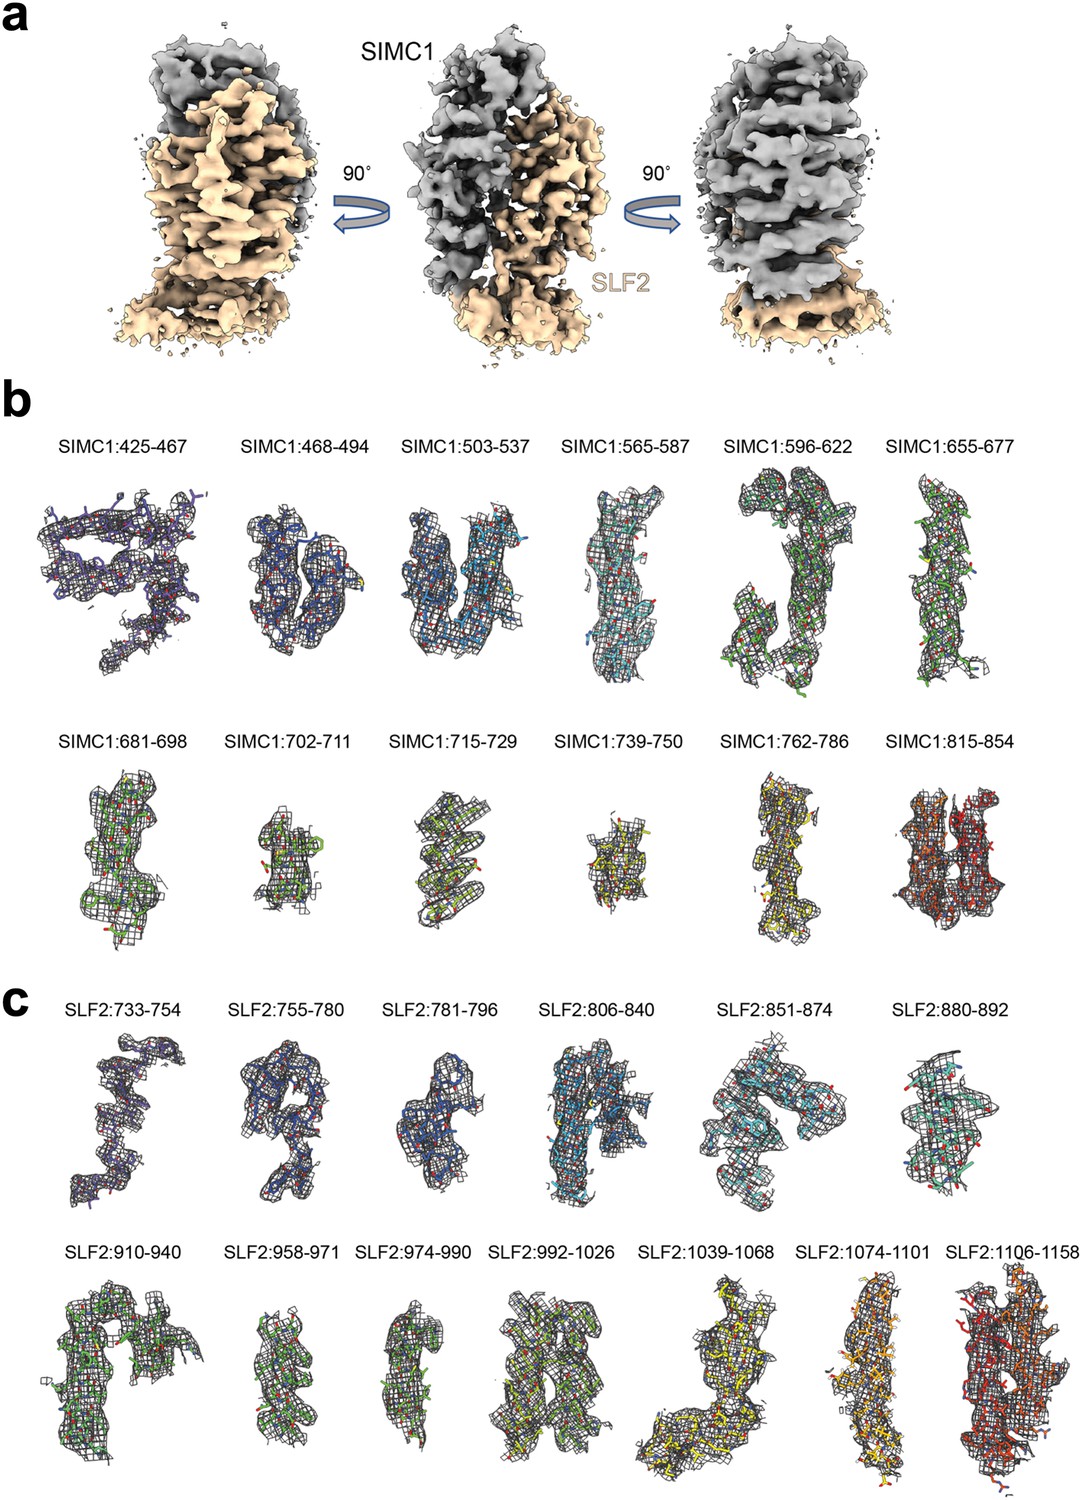
Cryo-EM density map of the SIMC1-SLF2 complex.
(a) The sharpened map. (b) SIMC1 fragments. (c) SLF2 fragments. The residue regions are indicated.
Figure 5—figure supplement 10
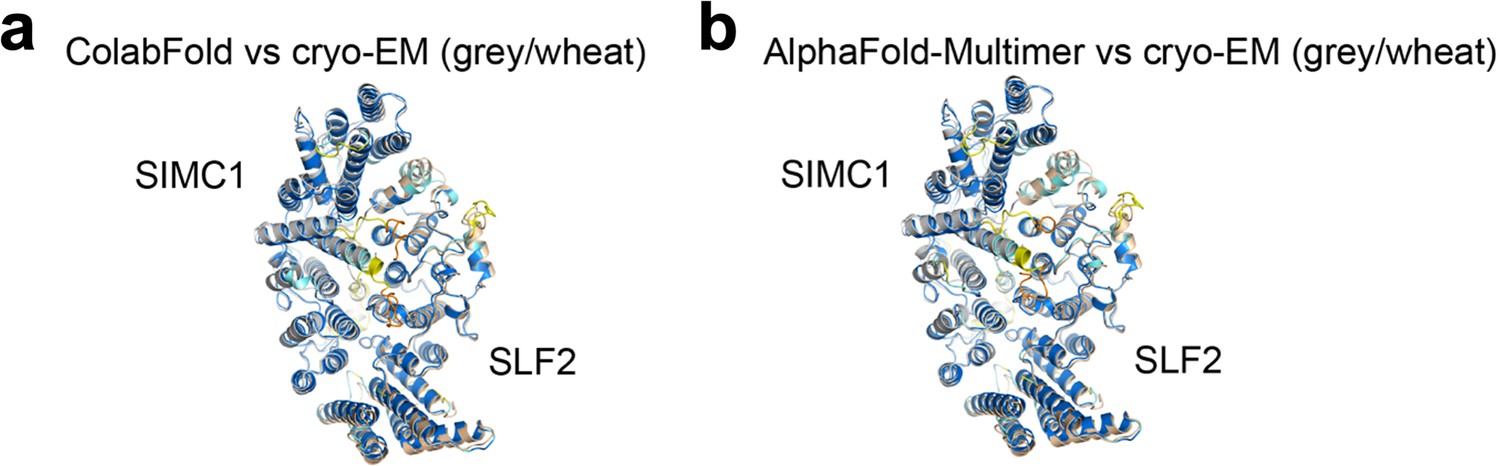
Comparison of the predicted structures and the refined cryo-EM structure.
(a, b) Structures predicted by ColabFold (a) and AlphaFold Multimer (b) are superimposed on the cryo-EM structure. Prediction structures are colored by pLDDT. SIMC1 and SLF2 of the cryo-EM structure are colored grey and wheat, respectively.
Figure 5—figure supplement 11
The structures of ScNse5/6 (a, PDB: 7SDE) and the SIMC1-SLF2 complex (b) colored by B-factors.
The blue-red rainbow indicate the B-factor range 0.0–97.0 and 99.3–213.2 in (a) and (b), respectively.
Figure 5—figure supplement 12
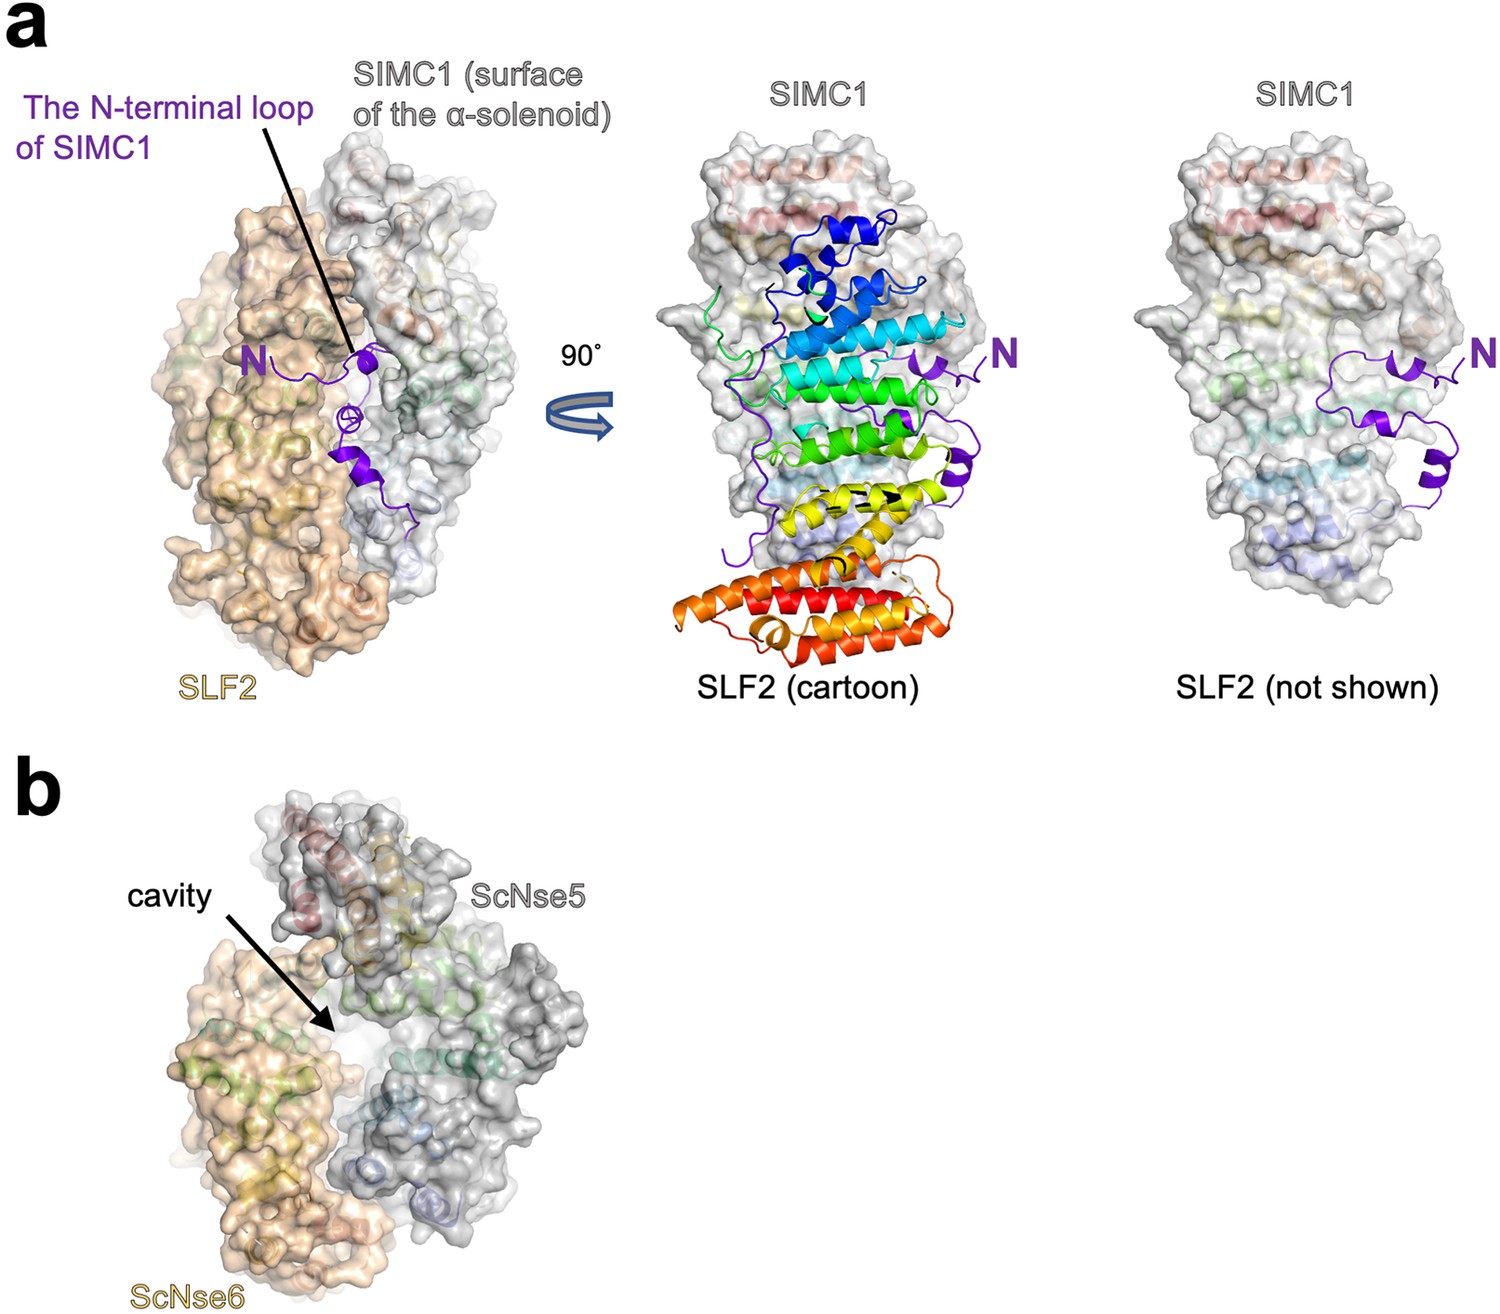
The N-terminal region to the α-solenoid of SIMC1.
(a) The cryo-EM structure of the SIMC1-SLF2 complex is shown as the ribbon model with the surfaces of the α-solenoids. The N-terminal extension is shown in purple without surface for clarity. The right panel is the same as the middle one except that SLF2 is omitted. (b) The structure of the ScNse5/6 complex (PDB: 7SDE) show in the same orientation as the SIMC1-SLF2 complex in (a).
Figure 5—figure supplement 13
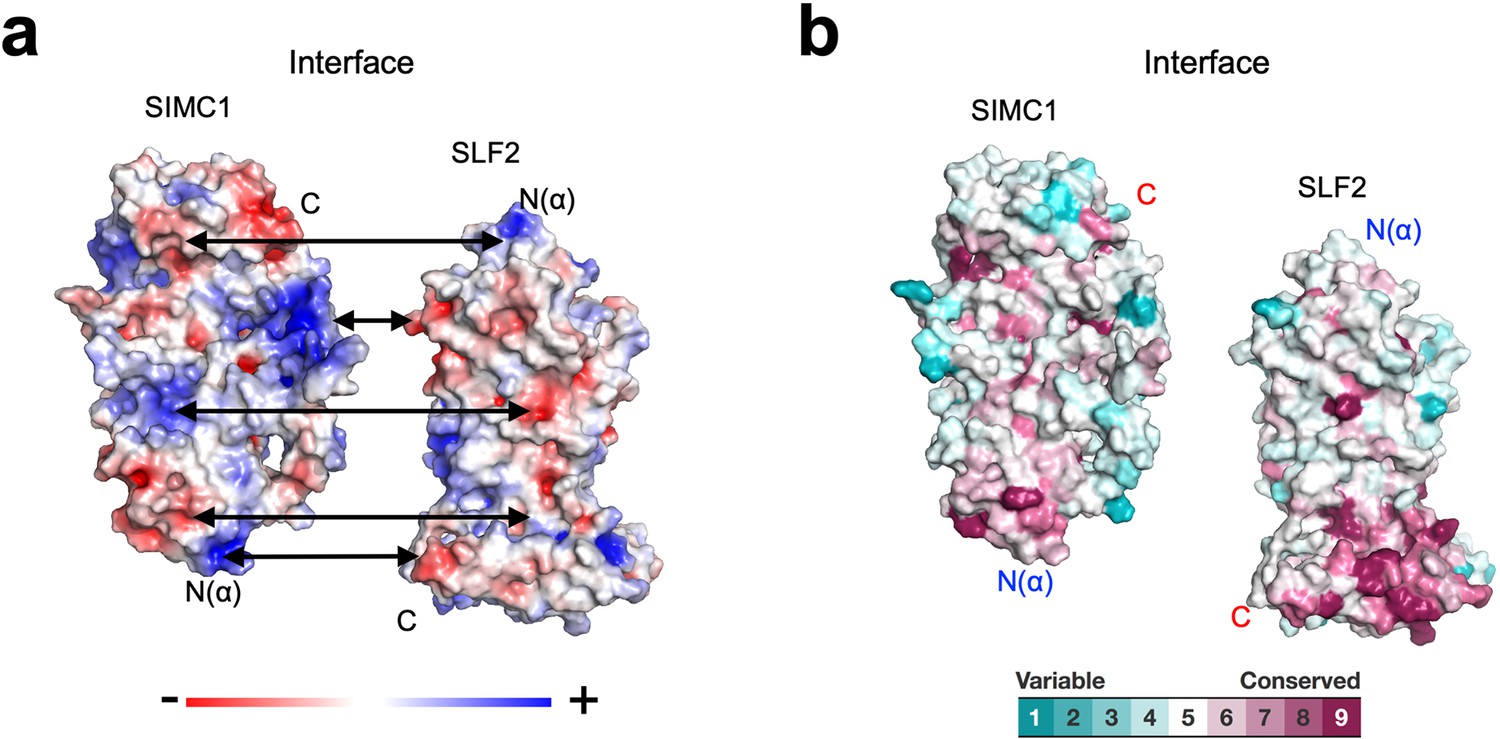
Properties of the SIMC1-SLF2 interface.
(a) Electrostatic potential of the SIMC1 and SLF2 surfaces. SIMC1 and SLF2 are oriented to show their interfaces. Double arrows point at intramolecular charge pairs. (b) Conservation mapping on the subunit interface. The conservation scores obtained from the Consurf server are shown by the color graduation as indicated.
Figure 5—figure supplement 14
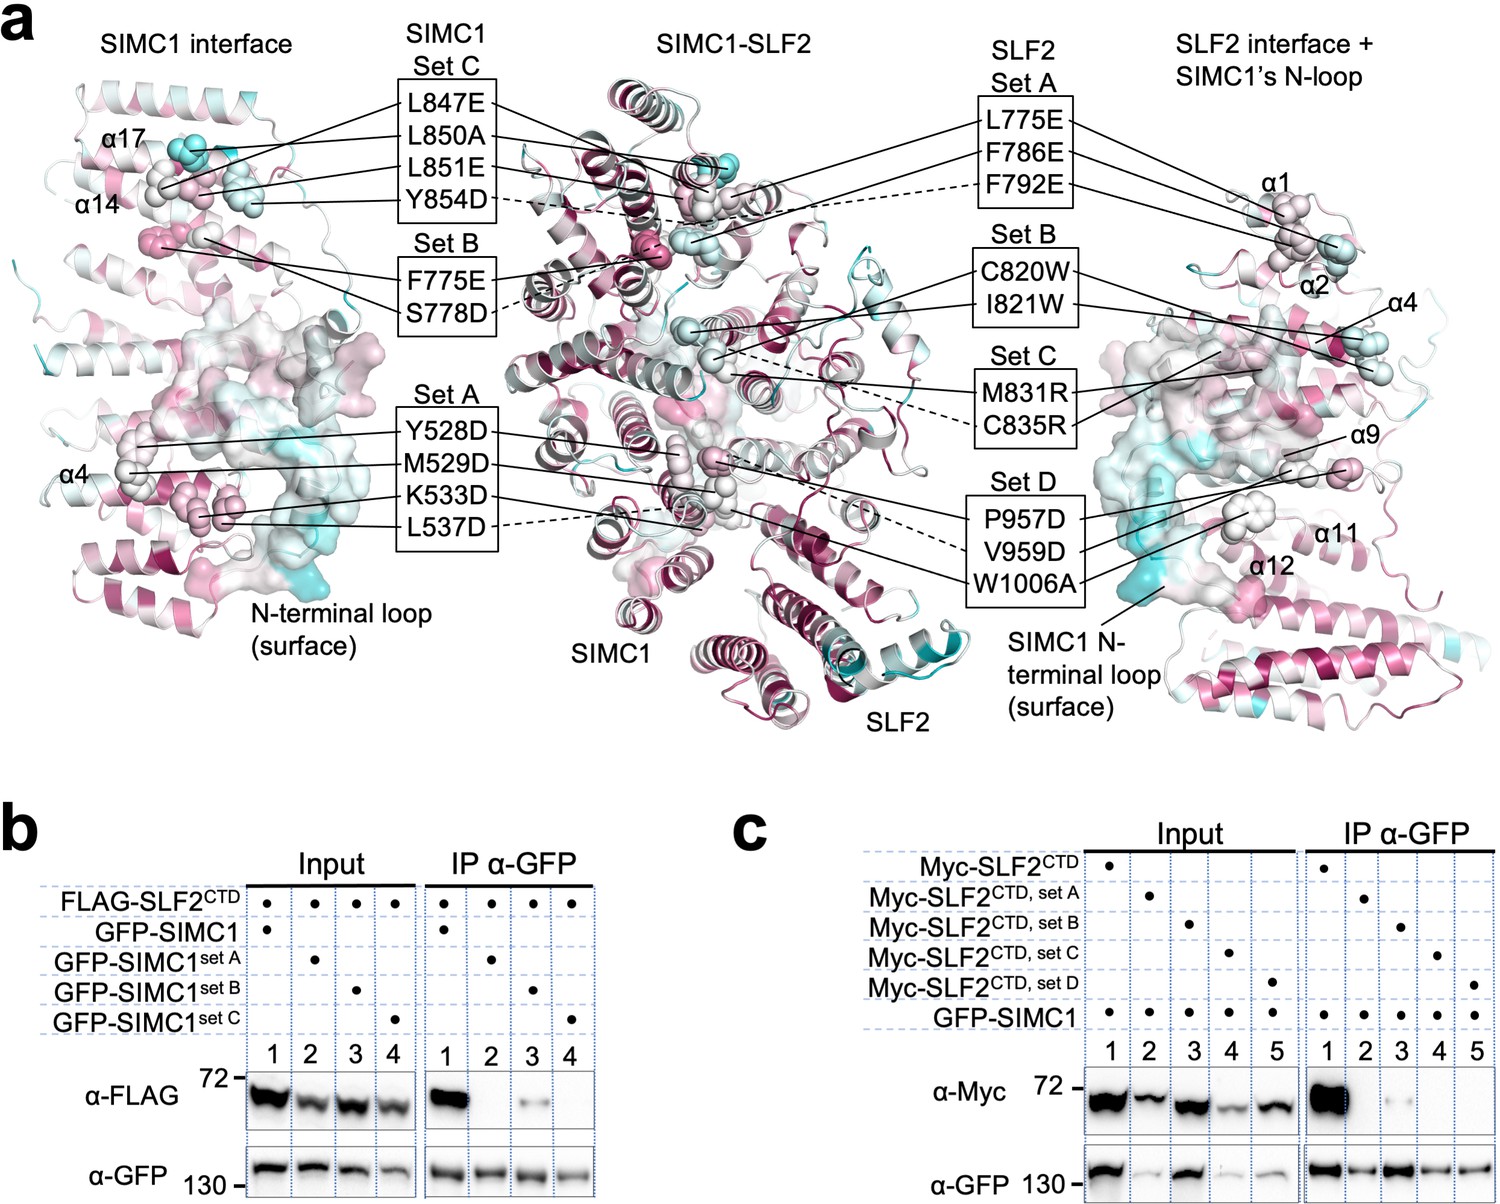
Mutational analysis of the SIMC1-SLF2 interface.
(a) Positions of the mutations on SIMC1 and SLF2. SIMC1 set A (Y528D, M529D, K533D, L537D), set B (S778D, F775E), and set C (L847E, L850A, L851E, Y854D) mutations and SLF2 set A (L775E, F786E, F792E), set B (C820W, I821W), set C (M831R, I835R), and set D (P957D, V959D, W1006A) mutations are indicated on the SIMC1 interface (left), the side view of the complex (center), and the SLF2 interface (right). SIMC1’s N-terminal loop (425–467 aa) is shown with surface. (b, c) Western blot of GFP-Trap immunoprecipitation from HEK293 cells transiently transfected with plasmids expressing GFP-SIMC1 variants and FLAG-SLF2CTD (b) or GFP-SIMC1 and Myc-SLF2CTD variants (c). Full and unedited blots of (b) and (c) are provided in Figure 5—figure supplement 14—source data 1, Figure 5—figure supplement 14—source data 2, respectively.
-
Figure 5—figure supplement 14—source data 1
Full and unedited blots corresponding to (b).
- https://cdn.elifesciences.org/articles/79676/elife-79676-fig5-figsupp14-data1-v2.zip
-
Figure 5—figure supplement 14—source data 2
Full and unedited blots corresponding to (c).
- https://cdn.elifesciences.org/articles/79676/elife-79676-fig5-figsupp14-data2-v2.zip
Figure 6
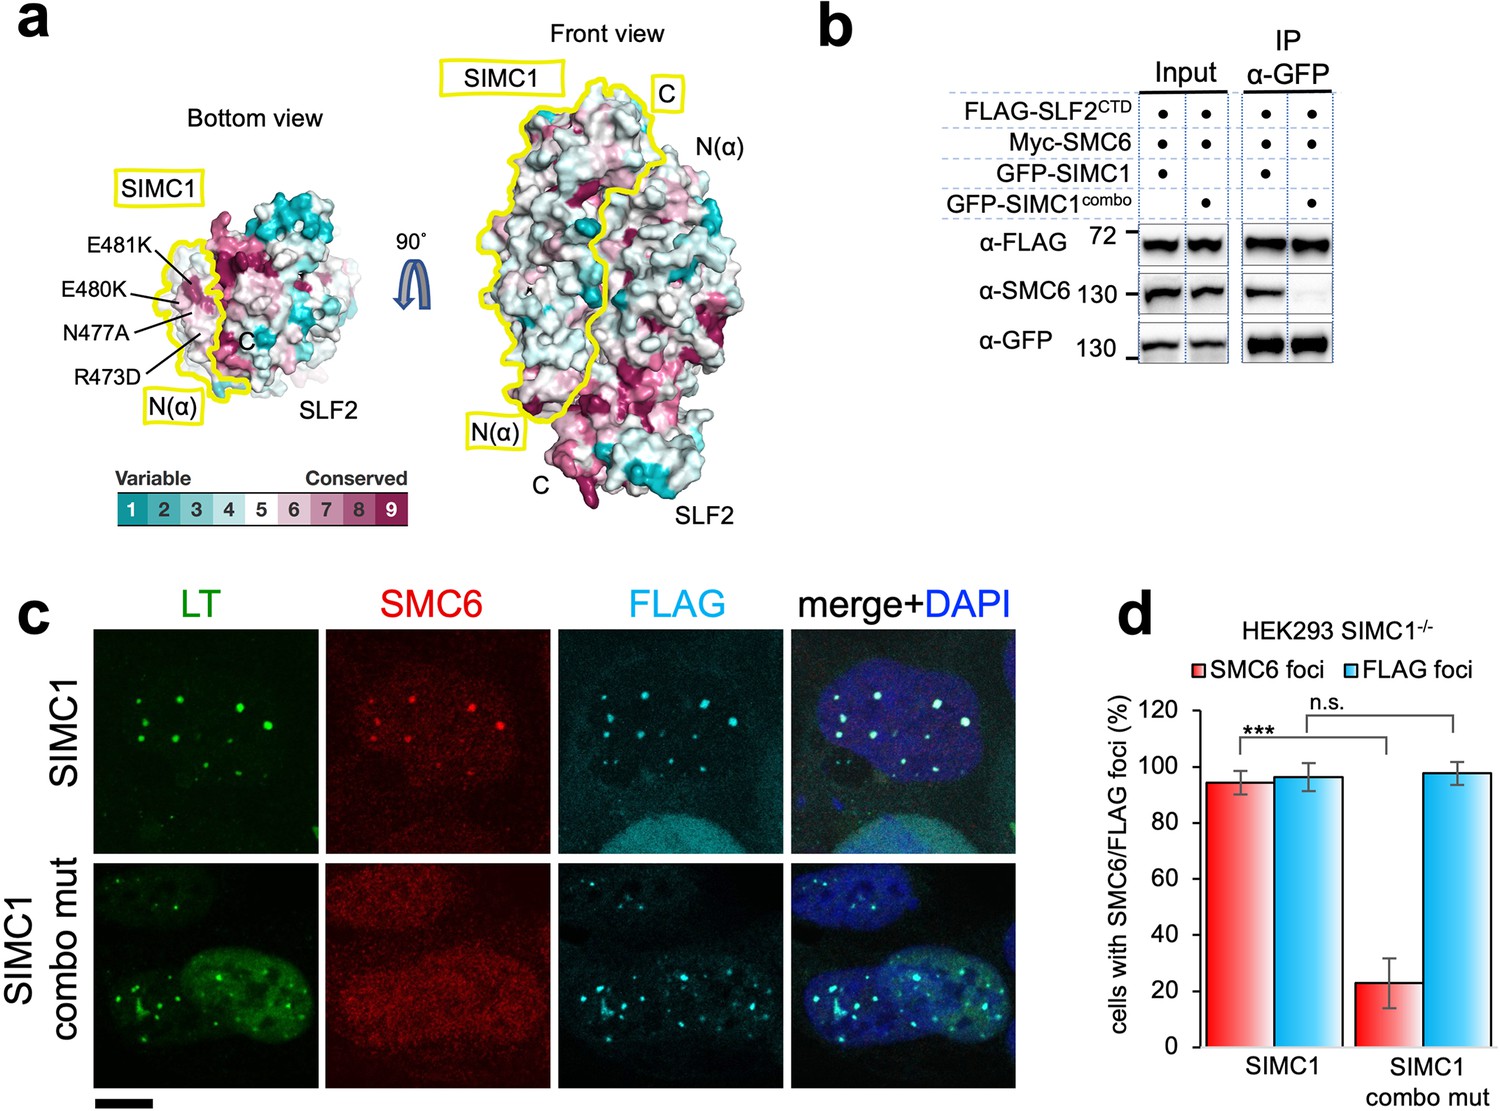
SIMC1 Nse5-like domain regulates SMC5/6 localization at PyVRCs.
(a) Conservation mapping on the surface of the SIMC1-SLF2 complex. The conservation score obtained from Consurf server are shown by the color graduation as indicated. The boundary of SIMC1’s surface is indicated by yellow lines for clarity. Mutated amino acids (R473D/N477A/E480K/E481K) in the α1 of SIMC1 α-solenoid are labeled. (b) Western blot of GFP-trap immunoprecipitation from HEK293 cells transfected with either GFP-SIMC1 or GFP-SIMC1 combo mutant in combination with FLAG-SLF2CTD and Myc-SMC6. Full and unedited blots provided in Figure 6—source data 1 (c) Representative immunofluorescence images of HEK293 SIMC1-/- cells with integrated vectors expressing FLAG-SIMC1 or FLAG-SIMC1 combo mut, respectively. Cells were fixed 48 hr after SV40 transfection and stained with SV40 LT (green), SMC6 (red), FLAG (light blue) antibodies. Scale bar 10 μm. (d) Relative quantification of the number of cells containing SMC6 and FLAG foci (representative images shown in panel c). A minimum of 210 cells with at least four SV40 LT foci were counted for each cell line. Means and error bars (s.d.) were derived from three independent SV40 transfections representing biological replicates. (∗) p<0.05; (∗∗) p<0.005; (∗∗∗) p<0.0005; (n.s.) p>0.05 (two-tailed unpaired t-test). Primary data provided in Figure 6—source data 2.
-
Figure 6—source data 1
Full and unedited blots corresponding to panel (b).
- https://cdn.elifesciences.org/articles/79676/elife-79676-fig6-data1-v2.zip
-
Figure 6—source data 2
Primary data for graphs in panel (d).
- https://cdn.elifesciences.org/articles/79676/elife-79676-fig6-data2-v2.xlsx
Figure 7 with 9 supplements
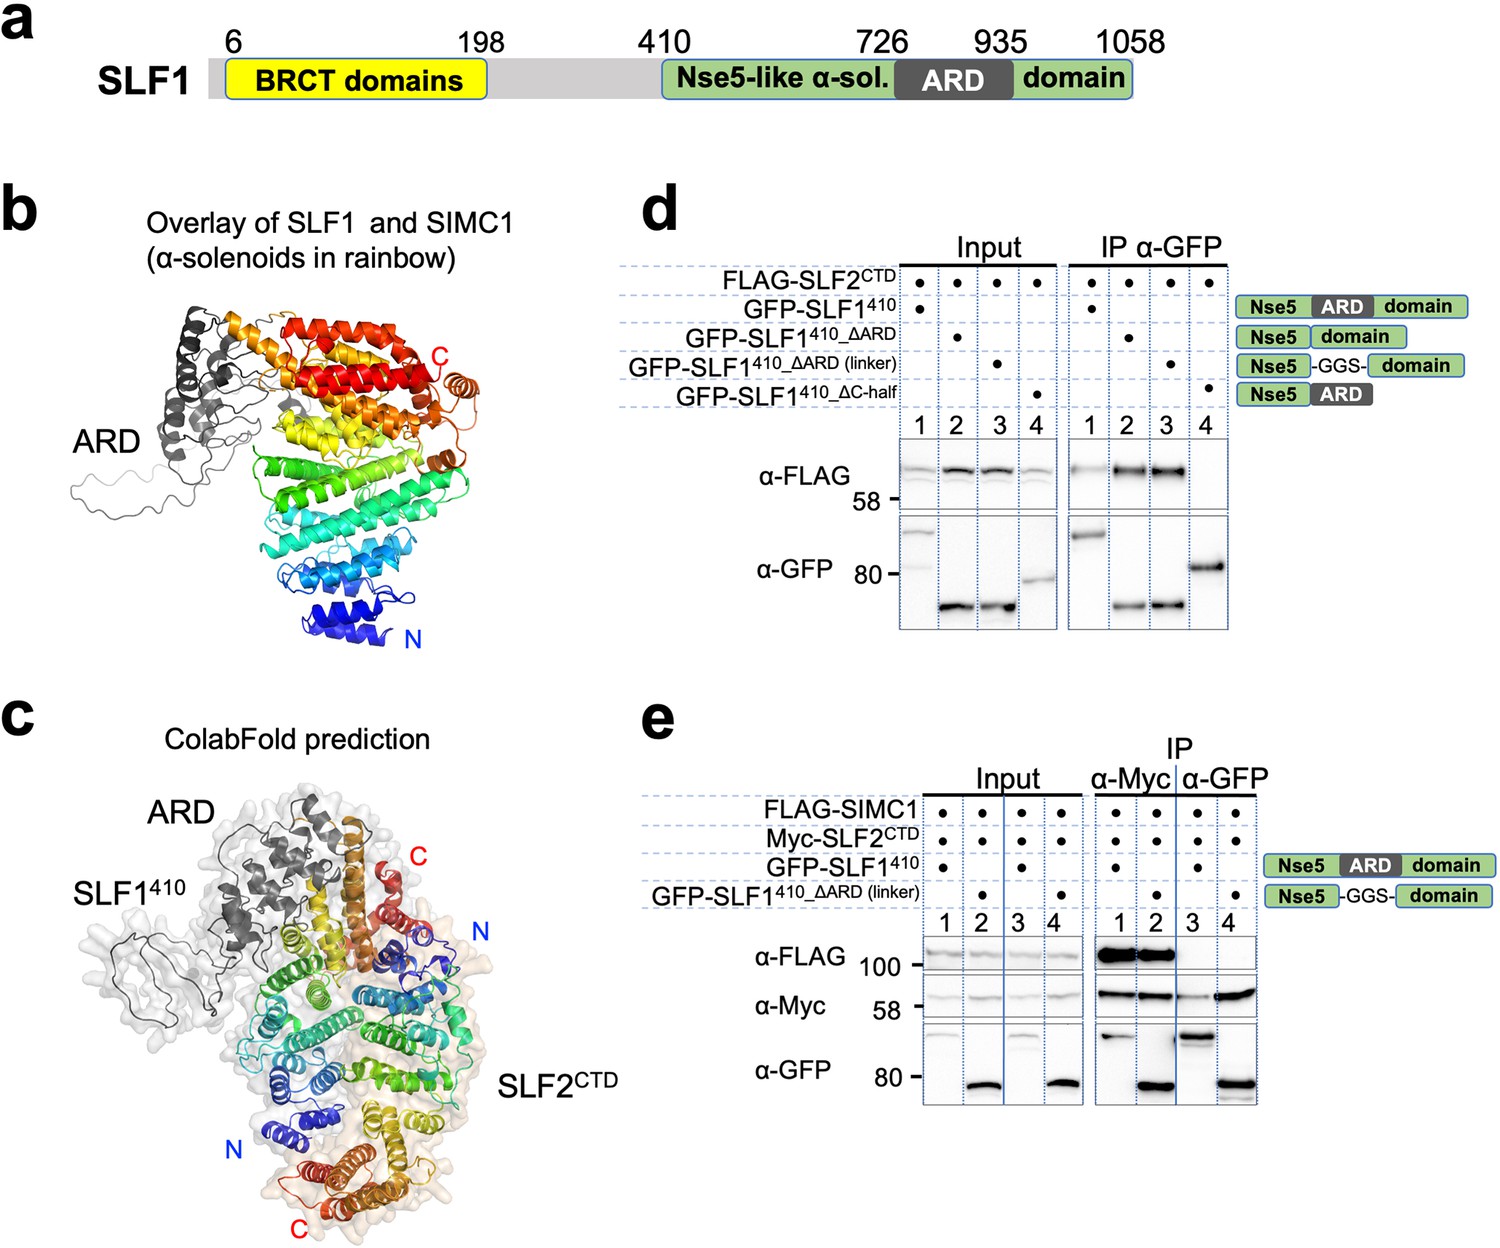
SLF1 interacts with SLF2 through its split Nse5-like domain.
(a) Schematic of SLF1 domain boundaries on the AlphaFold model. (b) Superposition of the α-solenoid domains of SLF1 and SIMC1. (c) The ColabFold-predicted structural model of the SLF1410-SLF2CTD complex. (d) Western blot of GFP-Trap immunoprecipitation from HEK293 cells transiently transfected with plasmids expressing the respective protein combination. Schematic on the right represents domains in SLF1 truncated variants. Full and unedited blots provided in Figure 7—source data 1 (e) Western blot of Myc-Trap or GFP-Trap immunoprecipitation from HEK293 cells transfected with FLAG-SIMC1, Myc-SLF2CTD and GFP-SLF1410 or GFP-SLF1410_ΔARD (linker), respectively. Domains of SLF1 constructs are shown in the scheme on the right side. Full and unedited blots provided in Figure 7—source data 2.
-
Figure 7—source data 1
Full and unedited blots corresponding to panel (d).
- https://cdn.elifesciences.org/articles/79676/elife-79676-fig7-data1-v2.zip
-
Figure 7—source data 2
Full and unedited blots corresponding to panel (e).
- https://cdn.elifesciences.org/articles/79676/elife-79676-fig7-data2-v2.zip
Figure 7—figure supplement 1
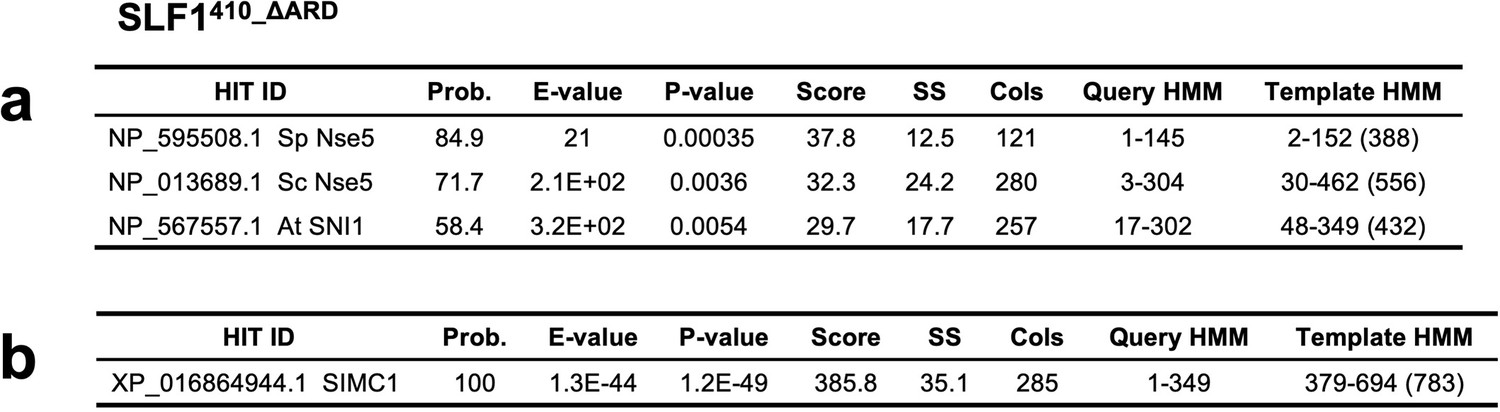
Results of an HHpred search with SLF1410_ΔARD (410–725 aa +935–1058 aa) against yeast and plant sequences (a) and human sequences (b).
Figure 7—figure supplement 2
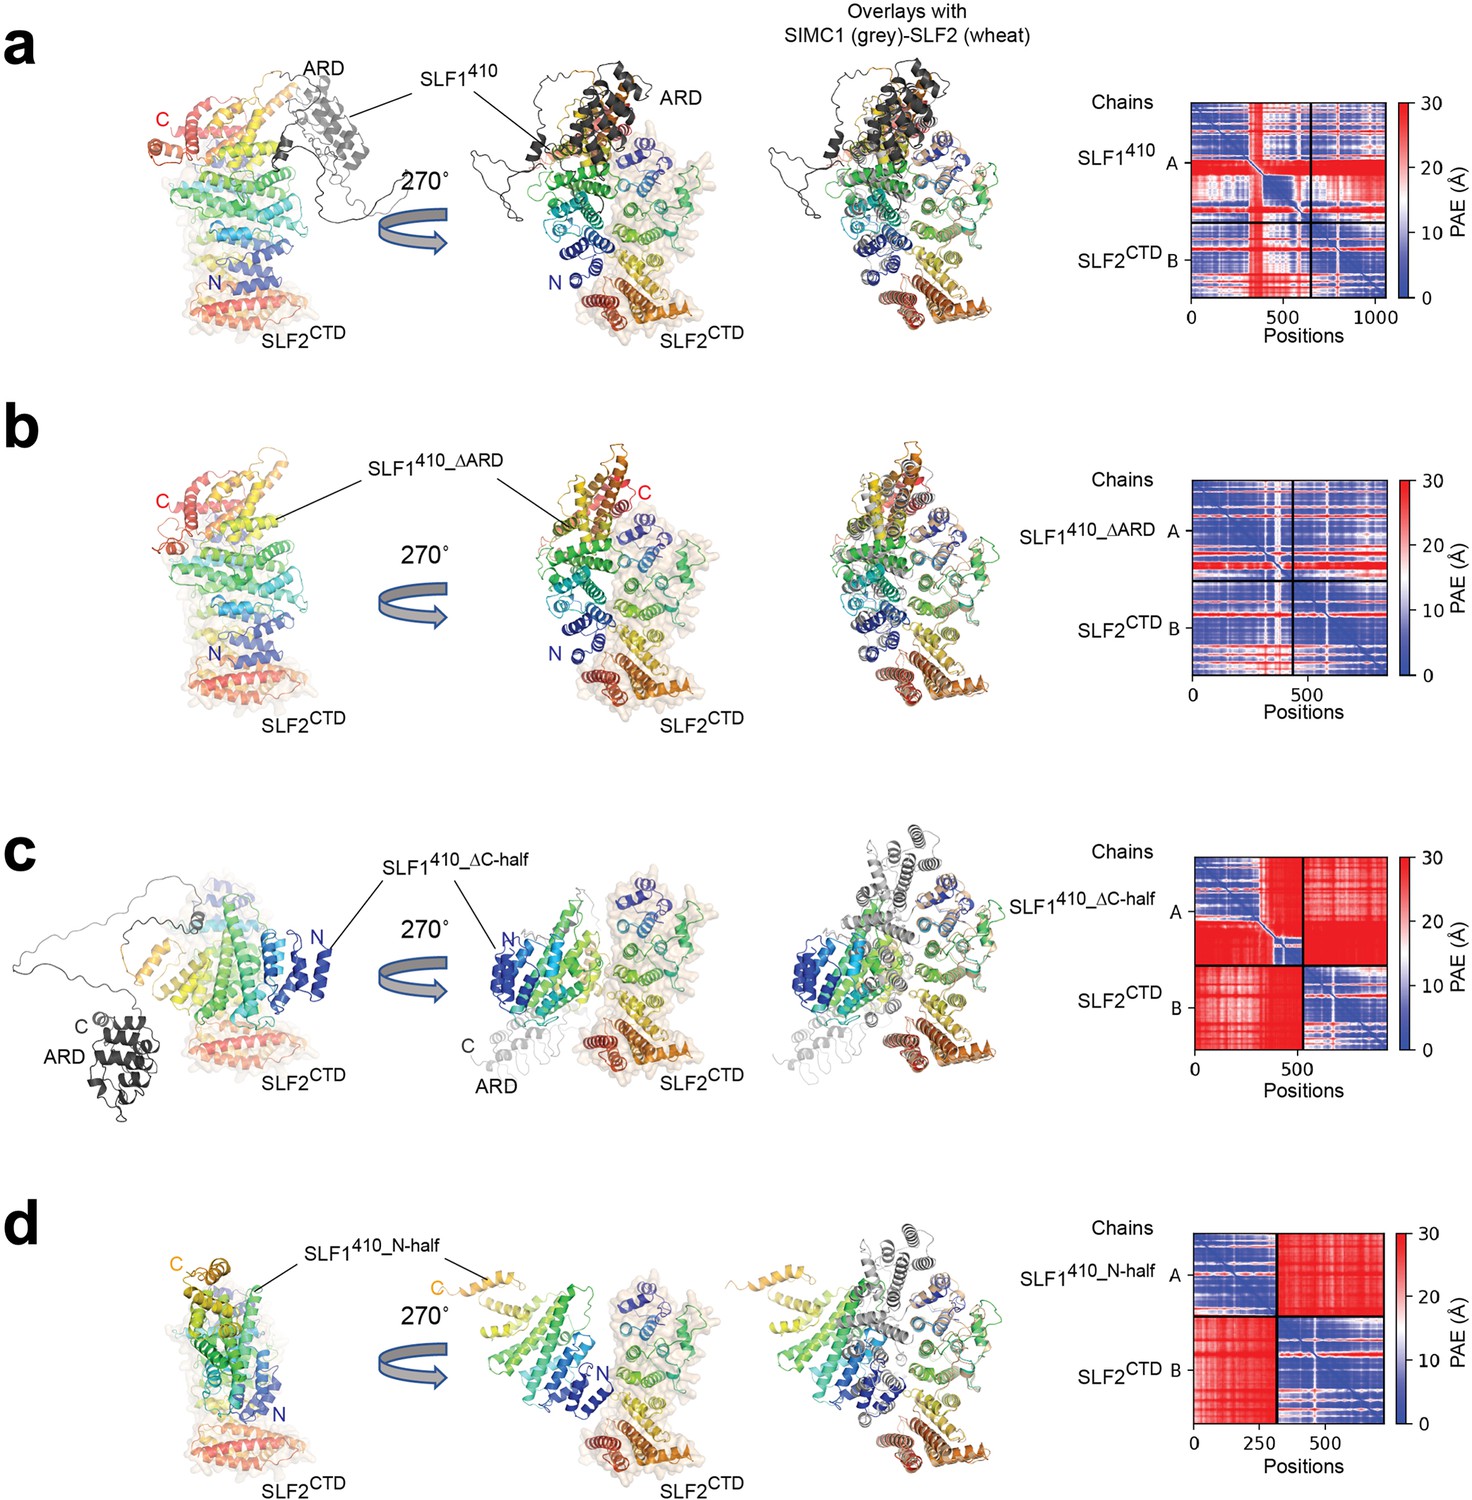
ColabFold structure prediction with SLF1 variants and SLF2CTD (755–1159 aa).
(a) SLF1410 (410–1058 aa). (b) SLF1410_ΔARD (410–725 aa +935–1058 aa). (c) SLF1410_ΔC-half (410–935 aa). (d) SLF1410_N-half (410–725 aa). The best-ranked structure of five predictions is shown for each prediction. Overlays with the SIMC1-SLF2 structure are generated by superimposing SLF2. SIMC1 and SLF2 of the SIMC1-SLF2 structure are colored by grey and wheat, respectively. SLF1 and SLF2 of the predictions are colored in rainbow. The right panels show the PAE plots. The inter-protein PAE values in (a) and (b) are low, indicating high confidence of the predictions, while those in (c) and (d) are high, indicating low confidence of the prediction.
Figure 7—figure supplement 3
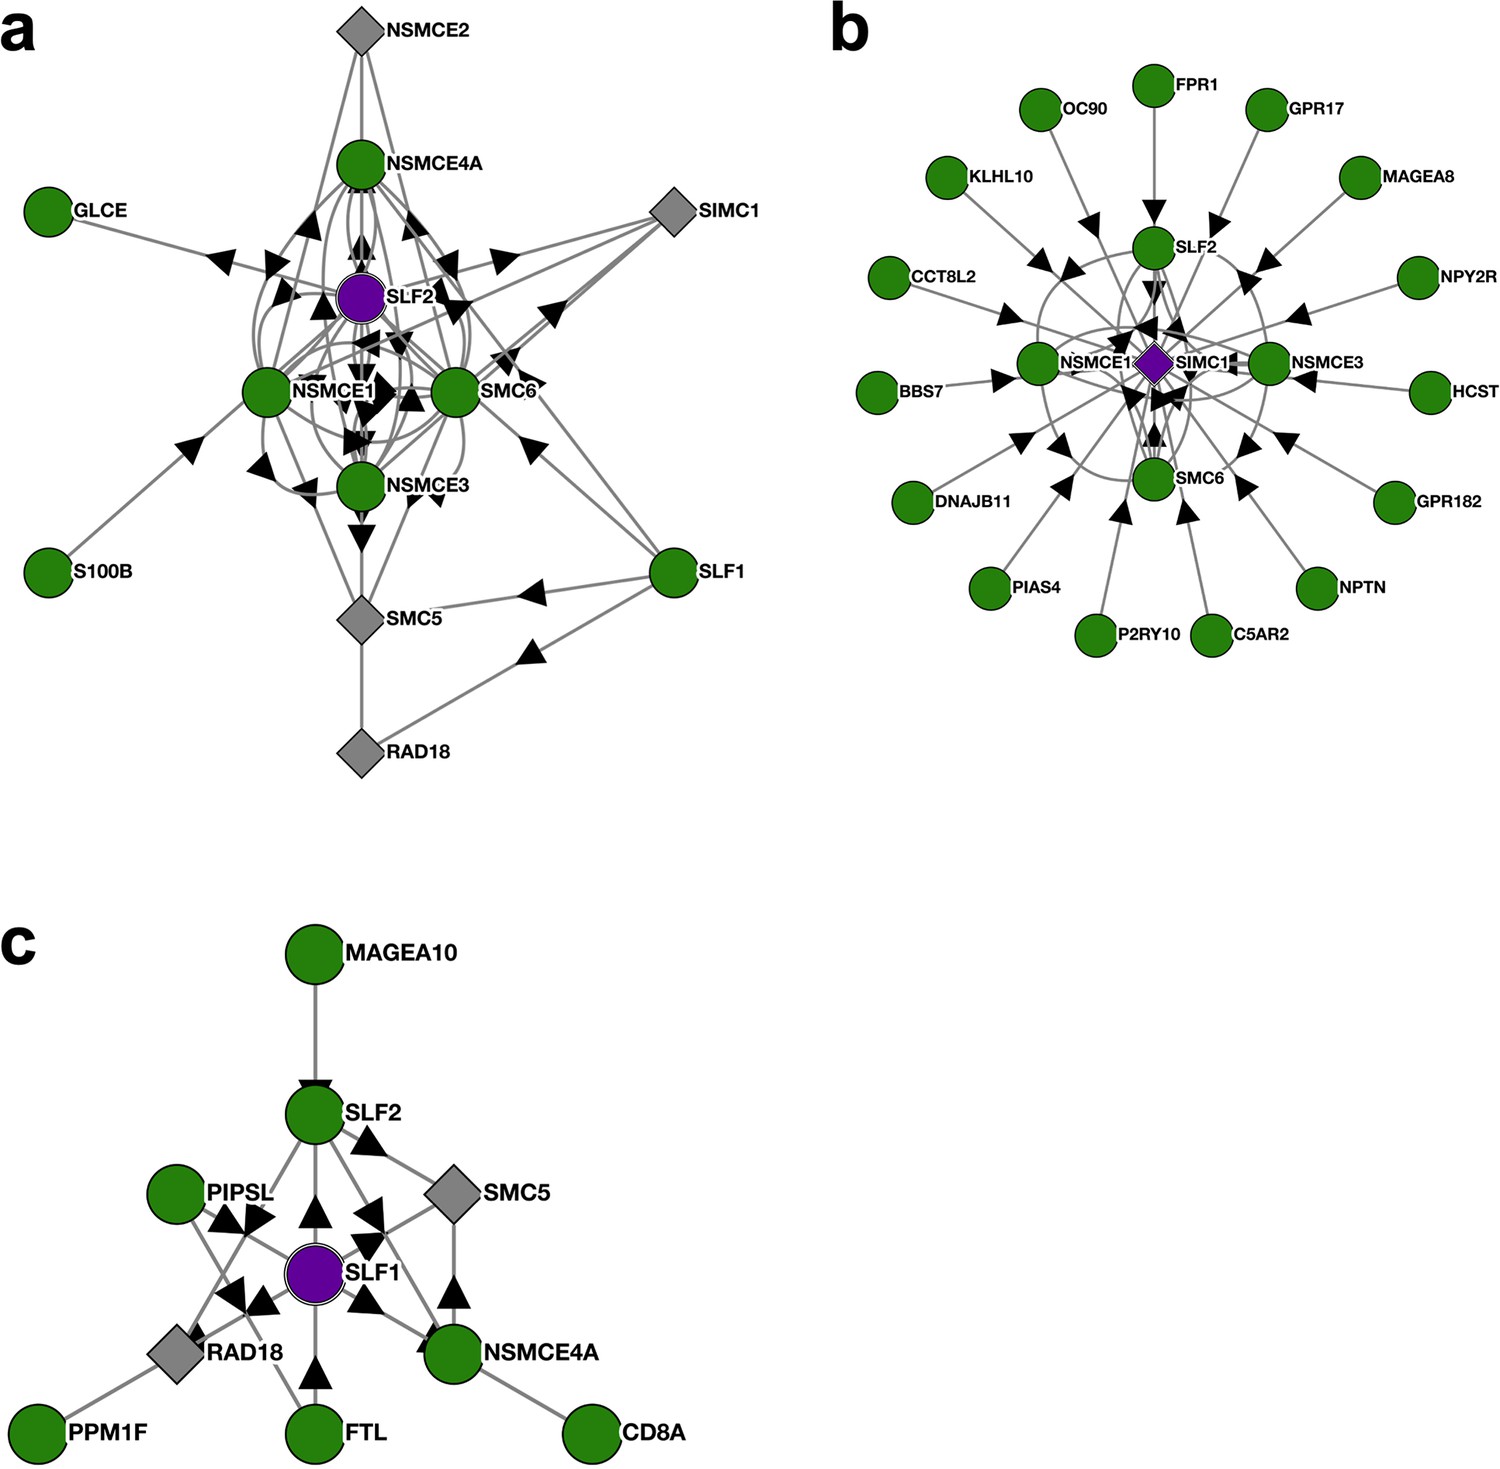
BioPlex interactome nodes for SLF2, SIMC1, and SLF1.
(a–c) Unedited SLF2, SIMC1, and SLF1 interactome nodes from the Harvard BioPlex Interactome https://bioplex.hms.harvard.edu. The “bait” protein is colored purple at the center of each node, and interacting proteins are shown around the bait with connecting arrows.
Figure 7—figure supplement 4
Structure-based sequence alignment of SIMC1 and SLF1.
Secondary structures (α-helices) are colored.
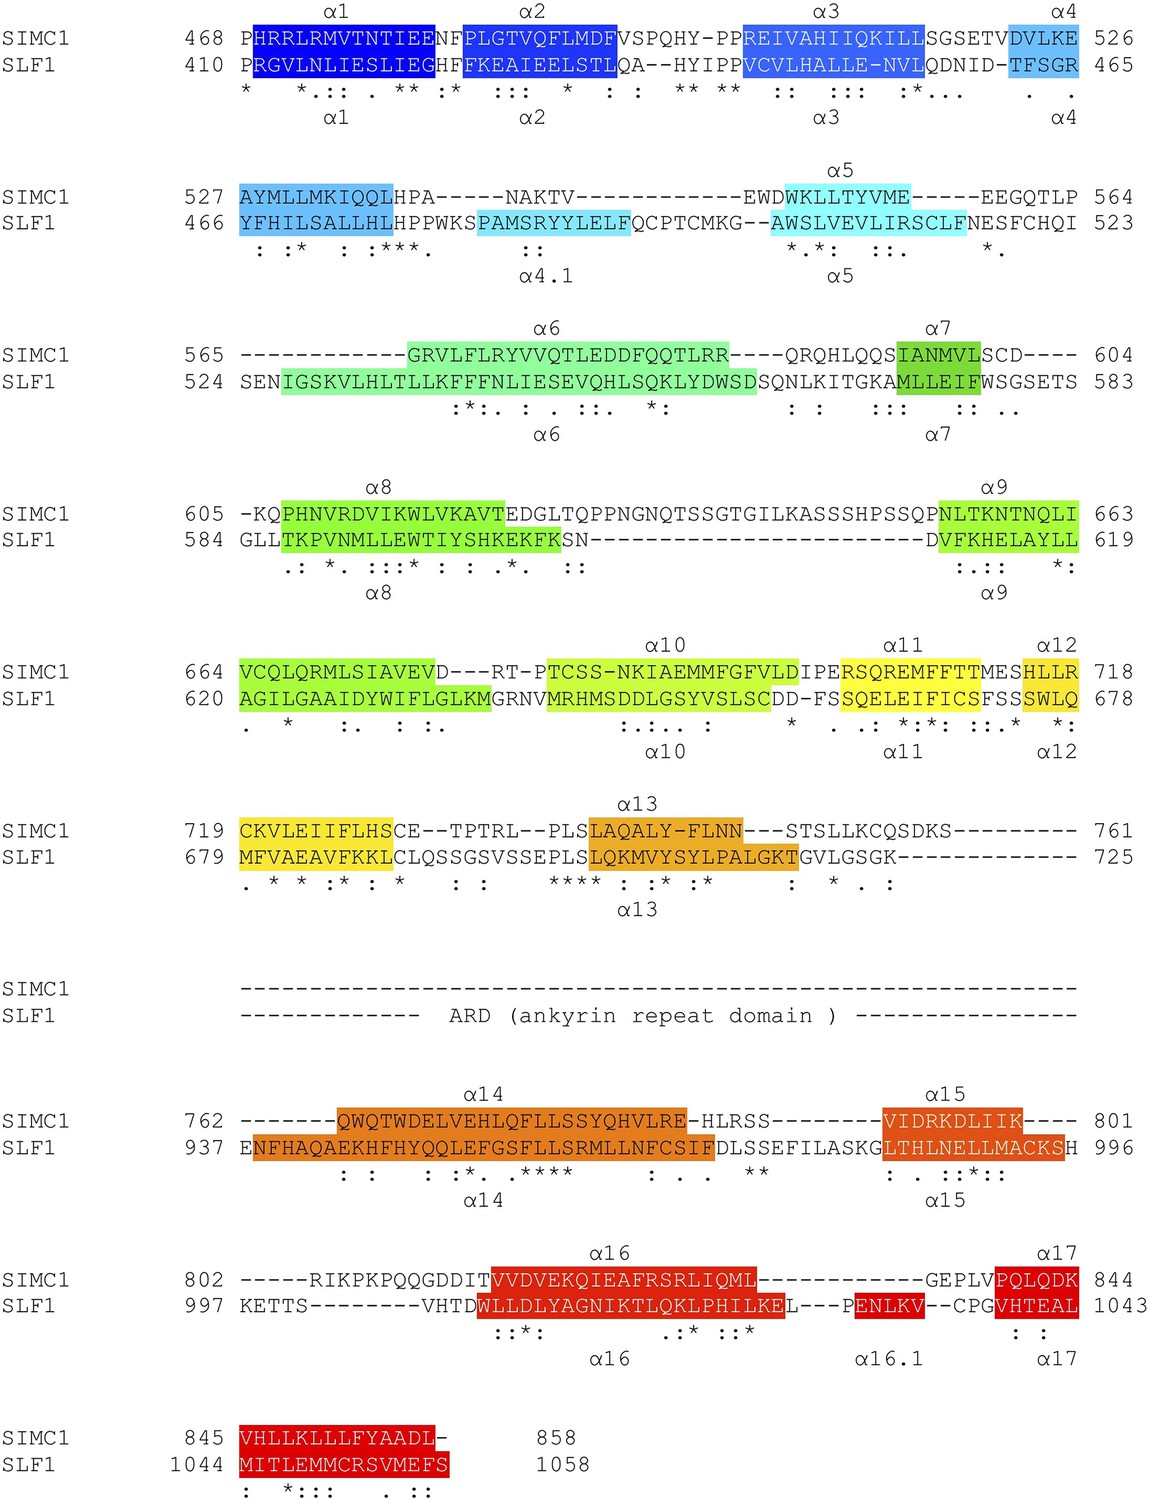
Figure 7—figure supplement 5
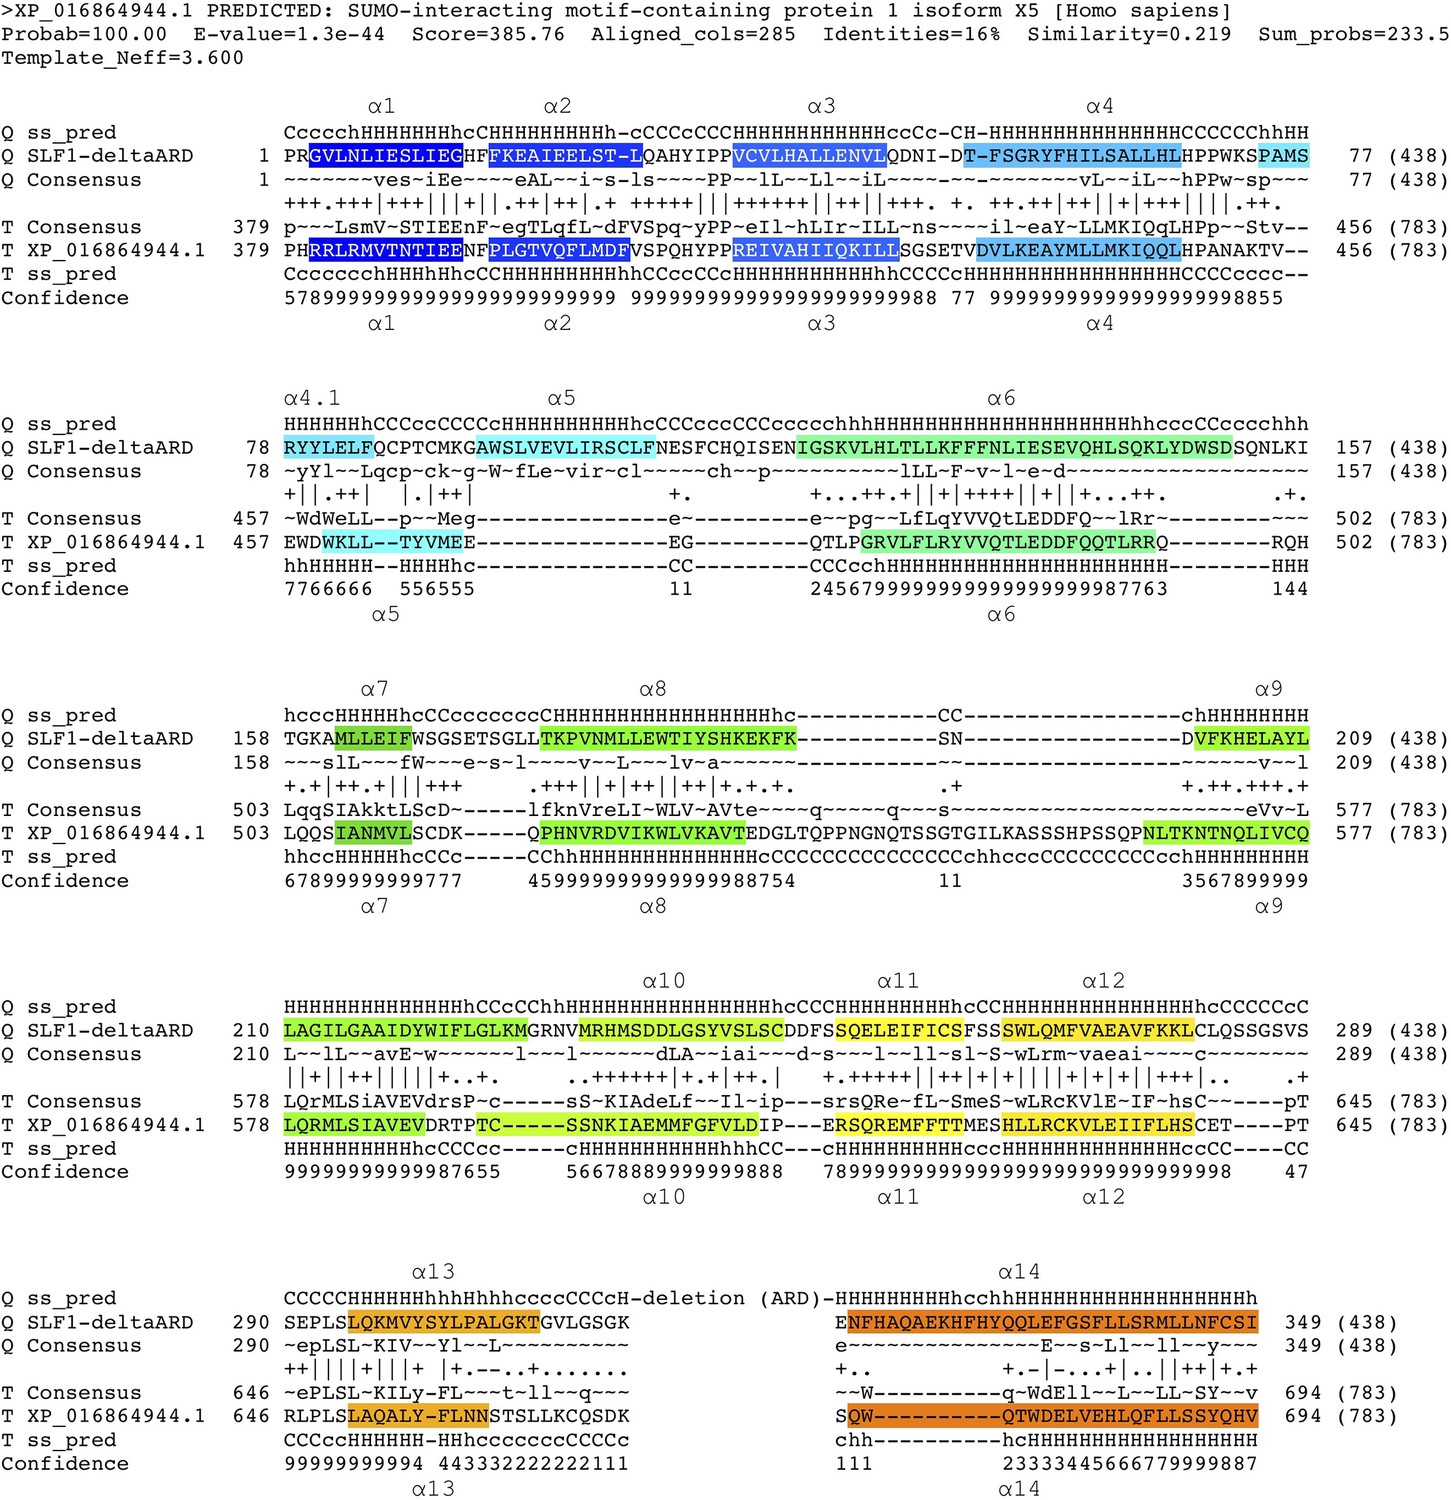
HHpred-aligned SLF1 and SIMC1 sequences.
The query was SLF1410_ΔARD (410–725 aa +937–1058 aa), and SIMC1 was the top hit. The α-helices determined by AlphaFold (for SLF1) and cryo-EM (SIMC1) are colored.
Figure 7—figure supplement 6
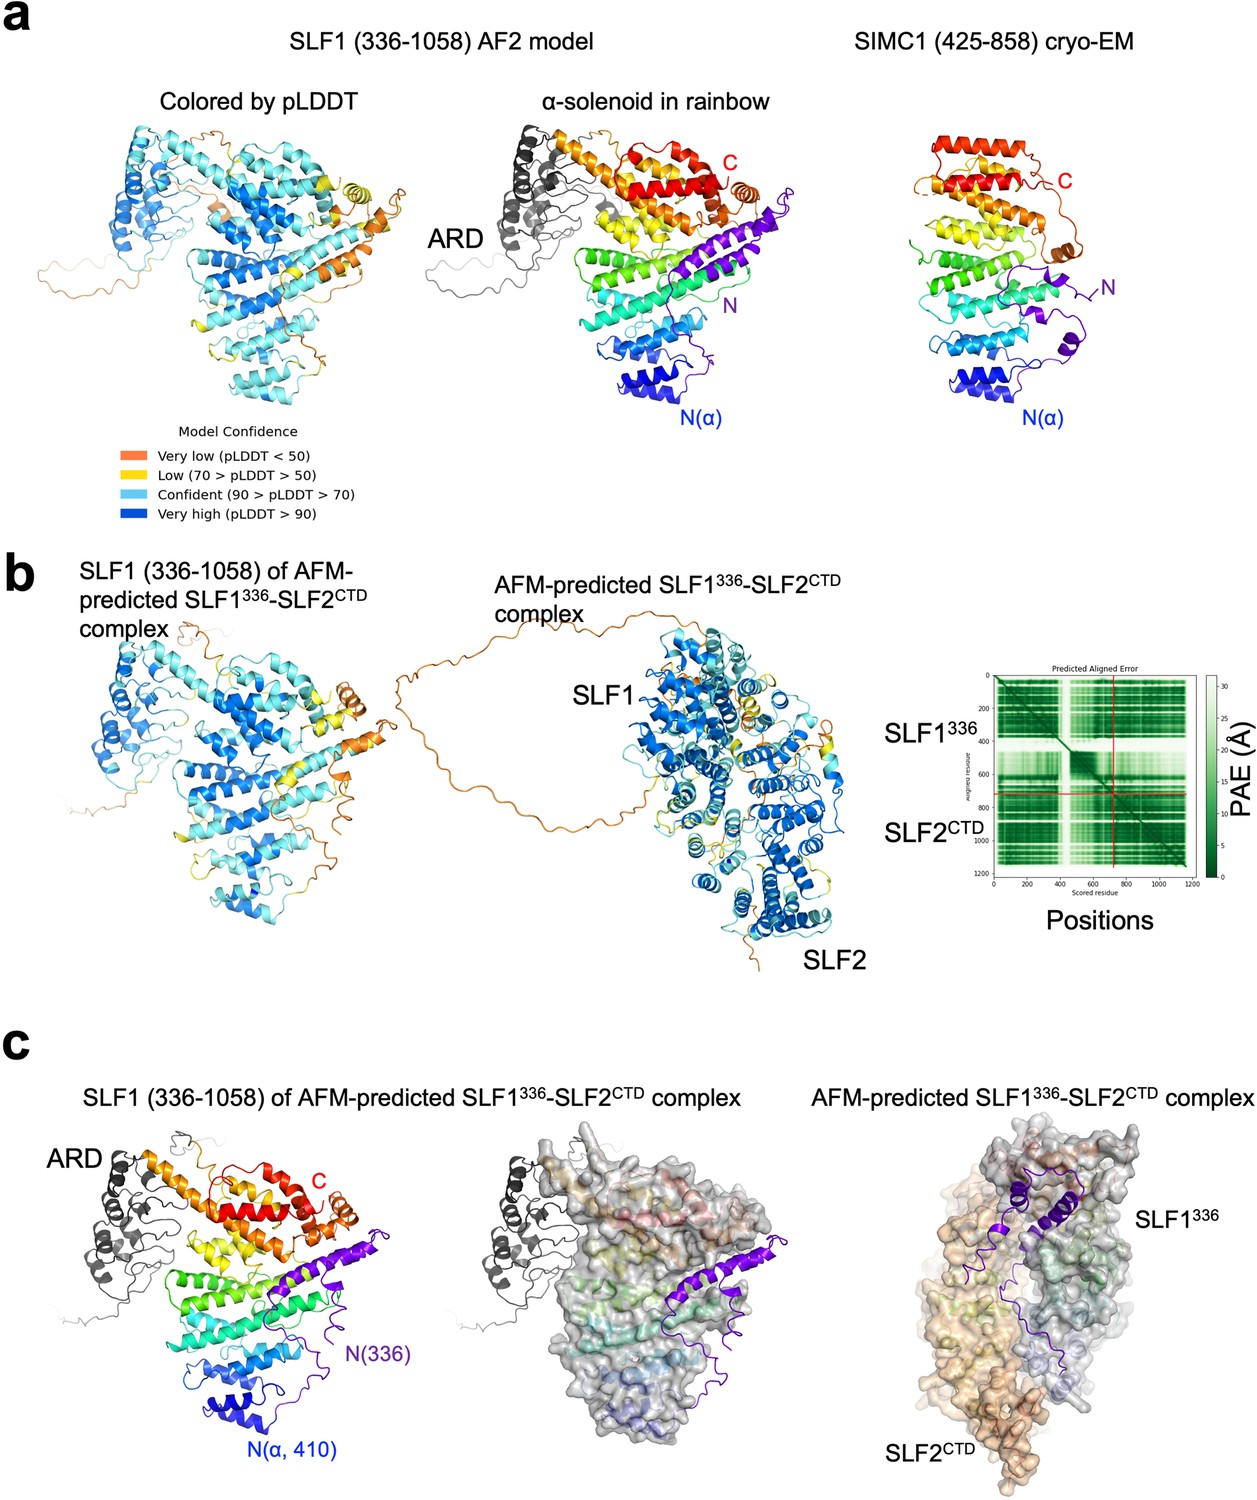
AlphaFold structural analysis of SLF1 containing the N-terminal region.
(a) The AlphaFold model of SLF1 (336–1058). The model on left is colored by pLDDT scores as indicated. The model in middle are colored in the rainbow with ARD in gray and the N-terminal region (336–410 aa) in purple. SIMC1 of the cryo-EM SIMC1-SLF2 structure is shown on right for comparison and colored in the same way as in the middle panel. (b) AlphaFold Multimer structure prediction of the SLF1/2 complex including the N-terminal region. Shown on left is the model of SLF1 (336–1058) of the SLF1/2 complex model. The middle panel shows the predicted structure of the SLF1/2 complex. The PAE table is show on right. (c) SLF1 (336–1058) of the predicted SLF1/2 complex is shown on left and middle. The α-solenoid in the middle panel is shown with its surface. The right panel is the predicted structure of the complex with the α-solenoids shown with their surface.
Figure 7—figure supplement 7
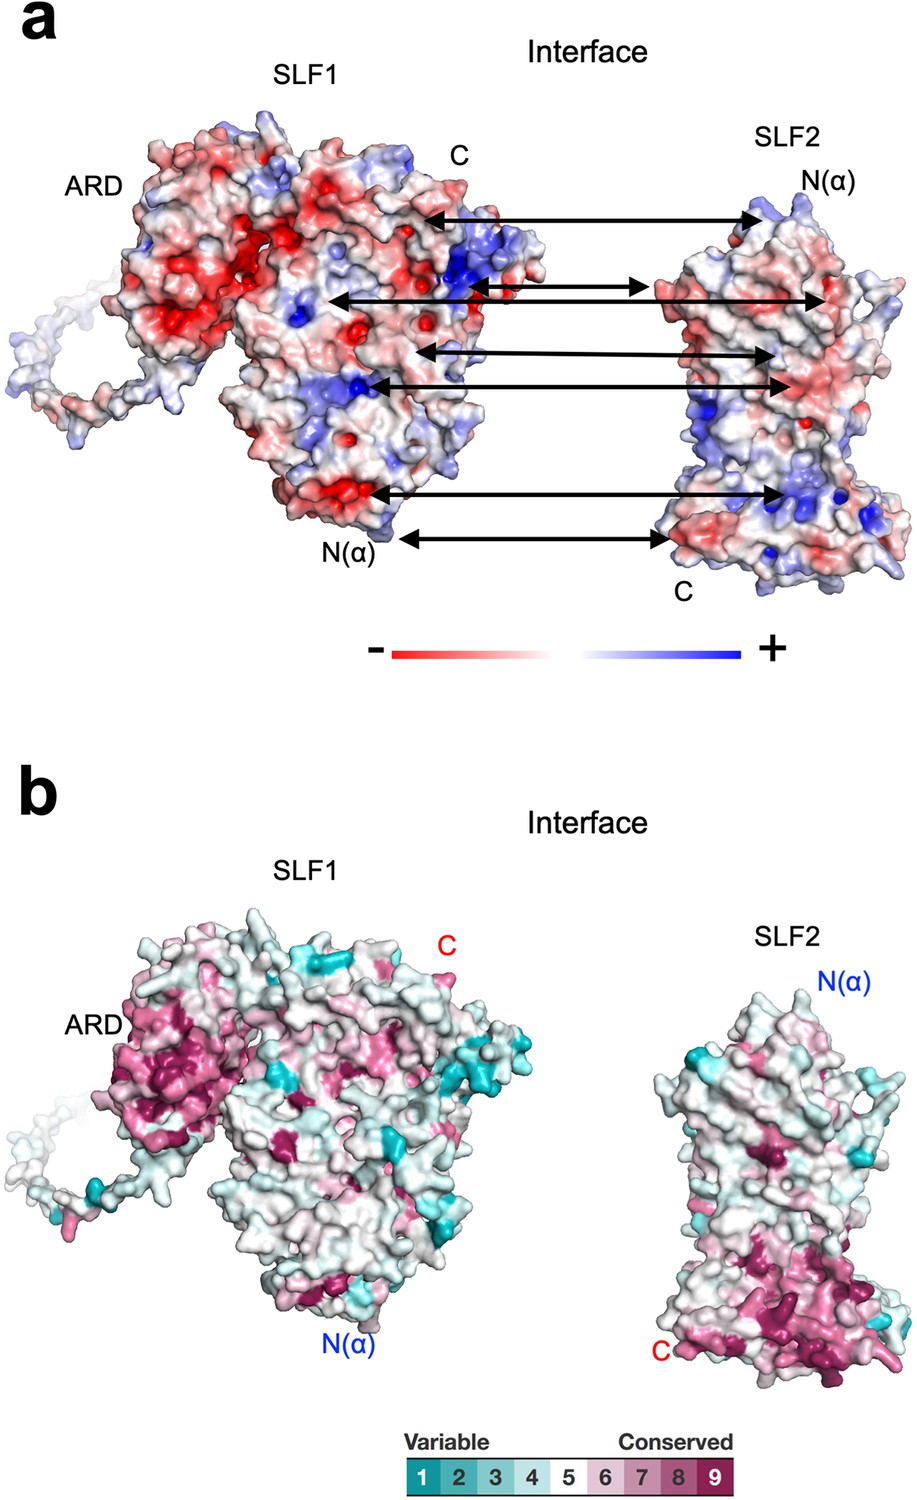
Properties of the SLF1-SLF2 interface.
(a) Electrostatic potential of the SLF1 and SLF2 surfaces. SLF1 and SLF2 are oriented to show their interfaces. Double arrows point at intramolecular charge pairs. (b) Conservation mapping on the subunit interface. The conservation scores obtained from the Consurf server are shown by the color graduation as indicated.
Figure 7—figure supplement 8
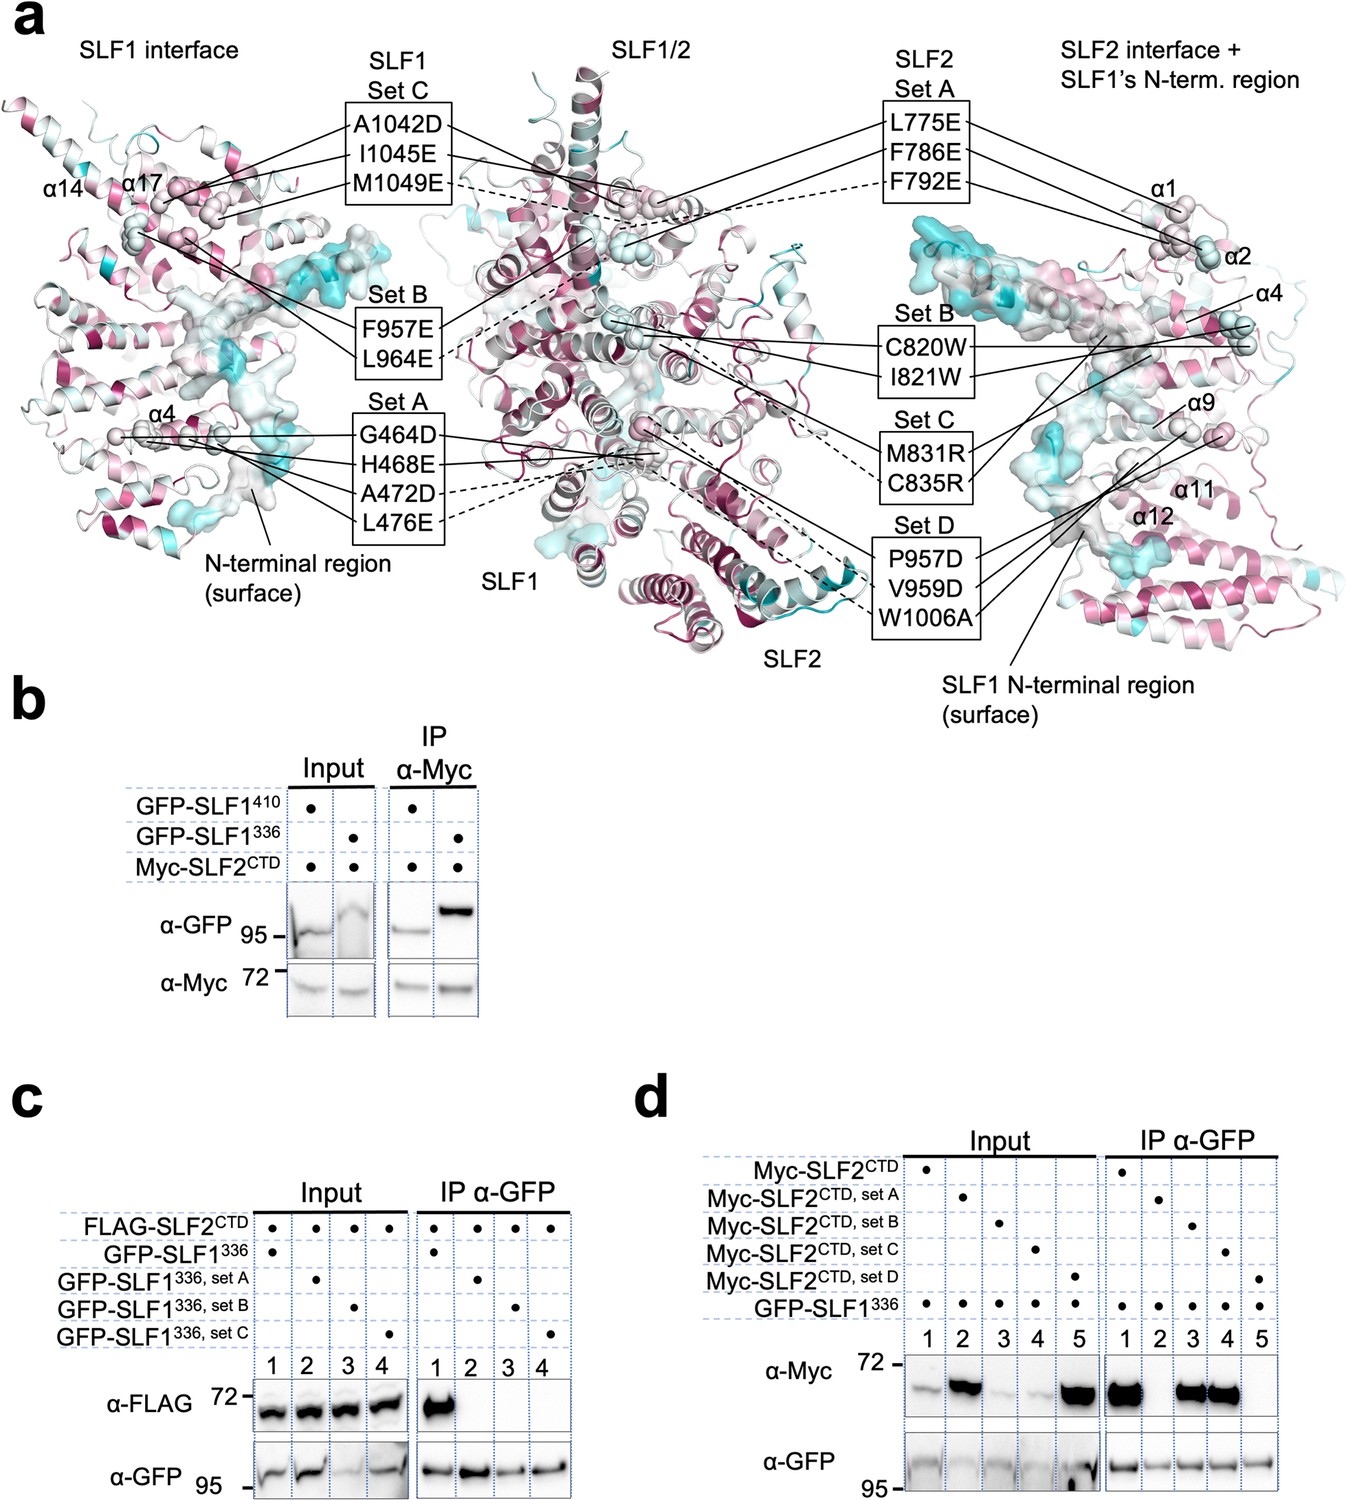
Mutational analysis of the SLF1-SLF2 interface.
(a) Positions of the mutations are indicated on SLF1336 (left), the SLF1336-SLF2CTD complex (center), and SLF2CTD (right). The ARD domain (726–934 aa) and the N-terminal disordered region (336–350 aa) are omitted for clarity. SLF1 mutations are set A (G464D, H468E, A472D, L476E), set B (F957E, L964E), and set C (A1042D, I1045E, M1049E). SLF2 mutations are same as shown in Figure 5—figure supplement 14. (b) Western blot of Myc-Trap immunoprecipitation from HEK293 cells transiently transfected with plasmids expressing Myc-SLF2CTD and GFP-SLF1 variants. (c, d) Western blot of GFP-Trap immunoprecipitation from HEK293 cells transiently transfected with plasmids expressing GFP-SLF1336 variants and FLAG-SLF2CTD (c) or GFP-SLF1336 and Myc-SLF2CTD variants (d). Full and unedited blots of (b–d) are provided in Figure 7—figure supplement 8—source data 1, Figure 7—figure supplement 8—source data 2, Figure 7—figure supplement 8—source data 3, respectively.
-
Figure 7—figure supplement 8—source data 1
Full and unedited blots corresponding to (b).
- https://cdn.elifesciences.org/articles/79676/elife-79676-fig7-figsupp8-data1-v2.zip
-
Figure 7—figure supplement 8—source data 2
Full and unedited blots corresponding to (c).
- https://cdn.elifesciences.org/articles/79676/elife-79676-fig7-figsupp8-data2-v2.zip
-
Figure 7—figure supplement 8—source data 3
Full and unedited blots corresponding to (d).
- https://cdn.elifesciences.org/articles/79676/elife-79676-fig7-figsupp8-data3-v2.zip
Figure 7—figure supplement 9
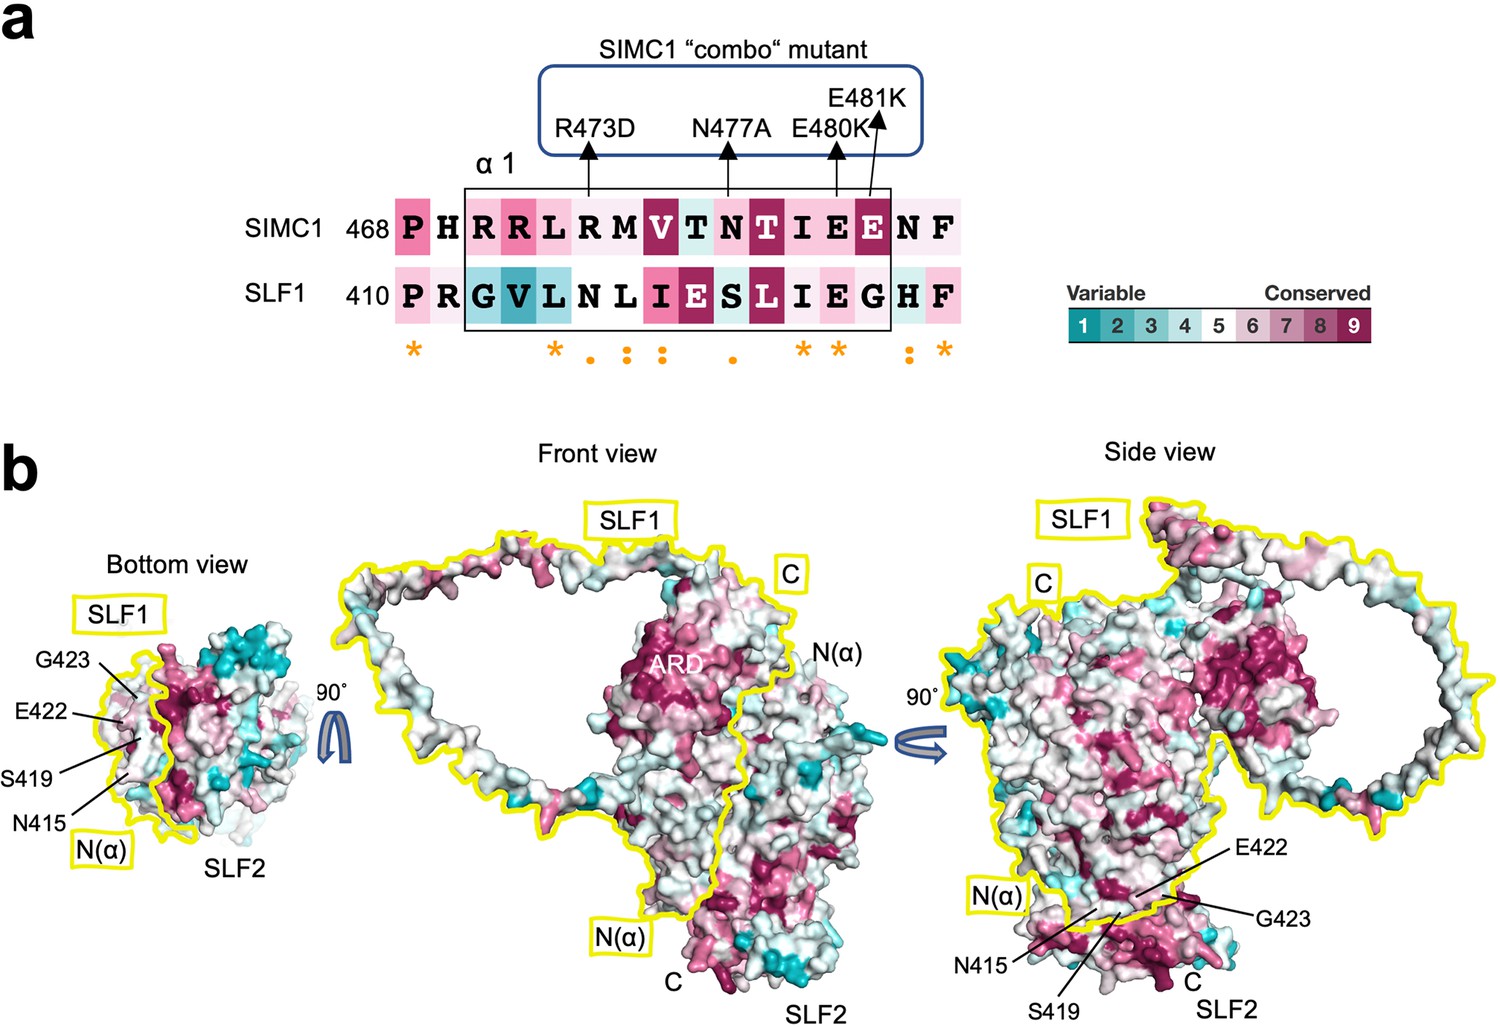
Conservation analysis of the SLF1-SLF2 complex model.
(a) The sequence alignment of the α1 of SIMC1 and SLF1 colored according to the conservation score calculated by Consurf. The mutations in the SIMC1 ‘combo’ mutant are indicated. (b) Conservation mapping on the surface of the SLF1-SLF2 complex. The boundary of SLF1’s surface is indicated by yellow line for clarity. The SLF1 residues whose corresponding residues were mutated in the SIMC1 ‘combo’ mutant (a) are labeled.
Figure 8 with 1 supplement
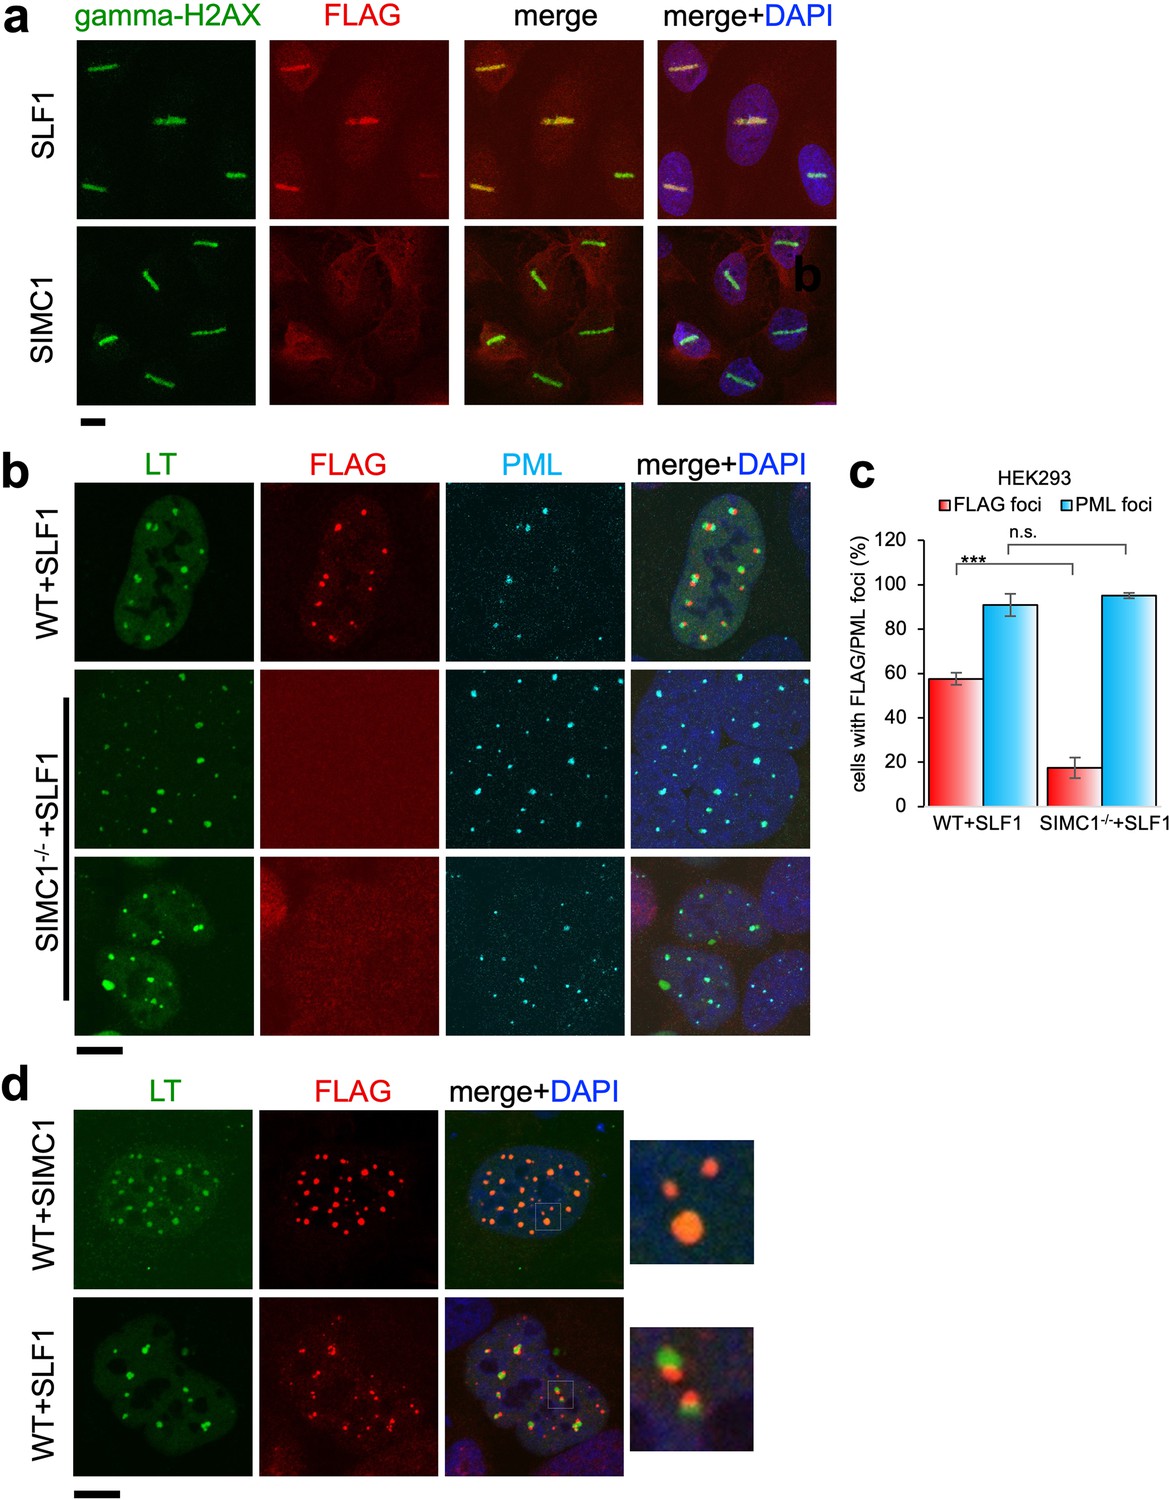
Recruitment of SLF1 but not SIMC1 to laser-induced DNA damage.
(a) U2OS cells stably expressing either FLAG-SLF1 or FLAG-SIMC1 were exposed to laser microirradiation. Cells were fixed 1 hr later and stained with gamma-H2A.X (phosphorylation of histone H2A.X Ser139) and FLAG antibodies. Scale bar 10 μm. (b) Localization of SLF1 to LT foci depends on SIMC1. Representative immunofluorescence images of HEK293 WT and SIMC1-/- cells with integrated vector expressing FLAG-SLF1. Cells were fixed 48 hr after SV40 transfection and stained with SV40 LT (green), FLAG (red), PML (light blue) antibodies. Scale bar 10 μm. (c) Relative quantification of the number of cells containing FLAG and PML foci representative images shown in panel (b). A minimum of 267 cells with at least four SV40 LT foci were counted for each cell line. Means and error bars (s.d.) were derived from three independent SV40 transfections representing biological replicates. (∗) p<0.05; (∗∗) p<0.005; (∗∗∗) p<0.0005; (n.s.) p>0.05 (two-tailed unpaired t-test). Primary data provided in Figure 8—source data 1. (d) Comparison of localization of FLAG-SIMC1 and FLAG-SLF1 (red), stably expressed from integrated vectors, and LT foci (green) in HEK293 cells. Cells fixed 48 hr after SV40 transfection. Scale bar 10 μm.
-
Figure 8—source data 1
Primary data for graph in (c).
- https://cdn.elifesciences.org/articles/79676/elife-79676-fig8-data1-v2.xlsx
Figure 8—figure supplement 1
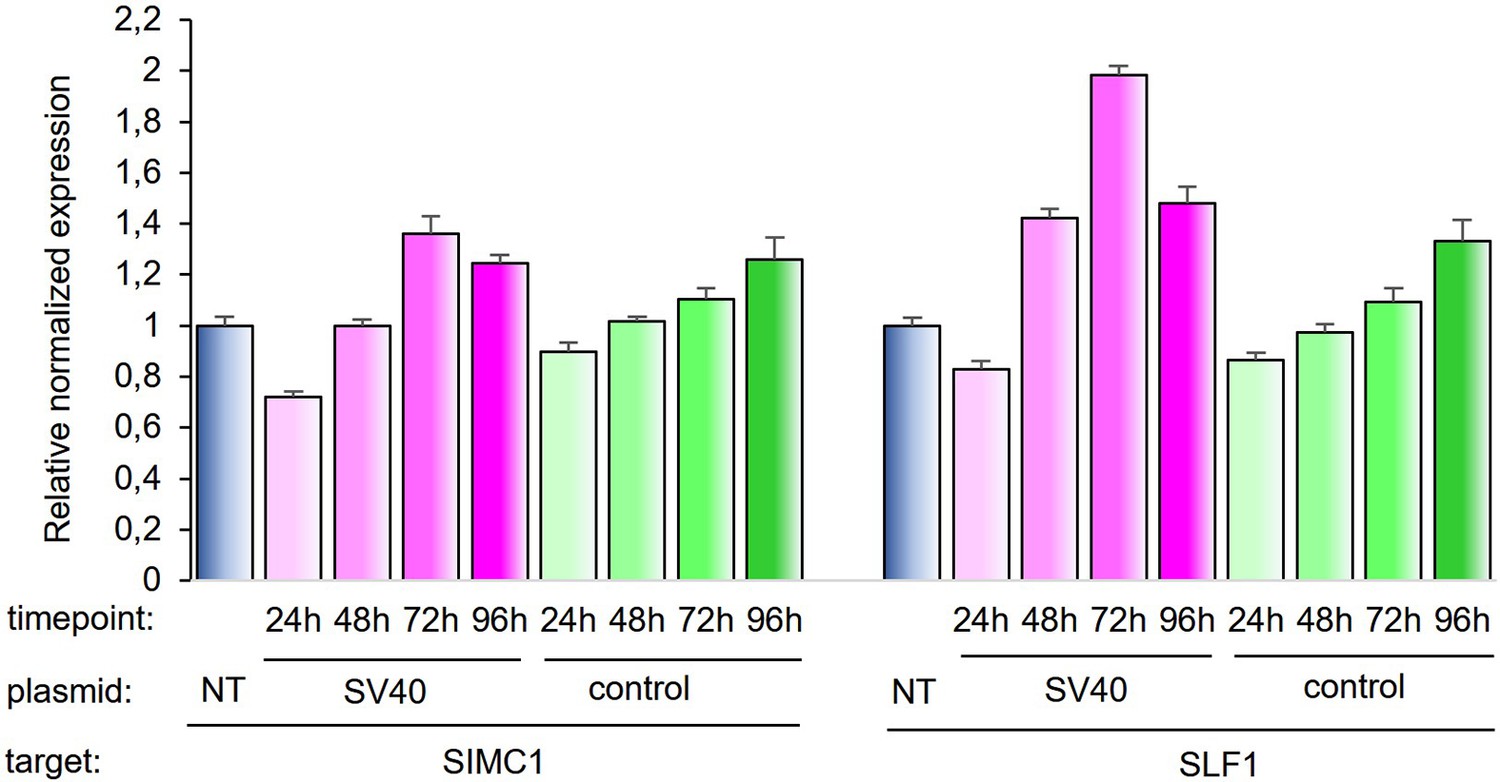
SIMC1 and SLF1 expression relative to beta-actin upon transfection of SV40 vector or control vector expressing GFP.
Expression was measured in indicated time points after transfection and normalized to non-transfected cells. Values represent 2^(-∆∆Ct) ± SEM from three technical replicates, n=1. Primary data provided in Figure 8—figure supplement 1—source data 1.
-
Figure 8—figure supplement 1—source data 1
Primary data for graph in supplement.
- https://cdn.elifesciences.org/articles/79676/elife-79676-fig8-figsupp1-data1-v2.xlsx
Figure 9
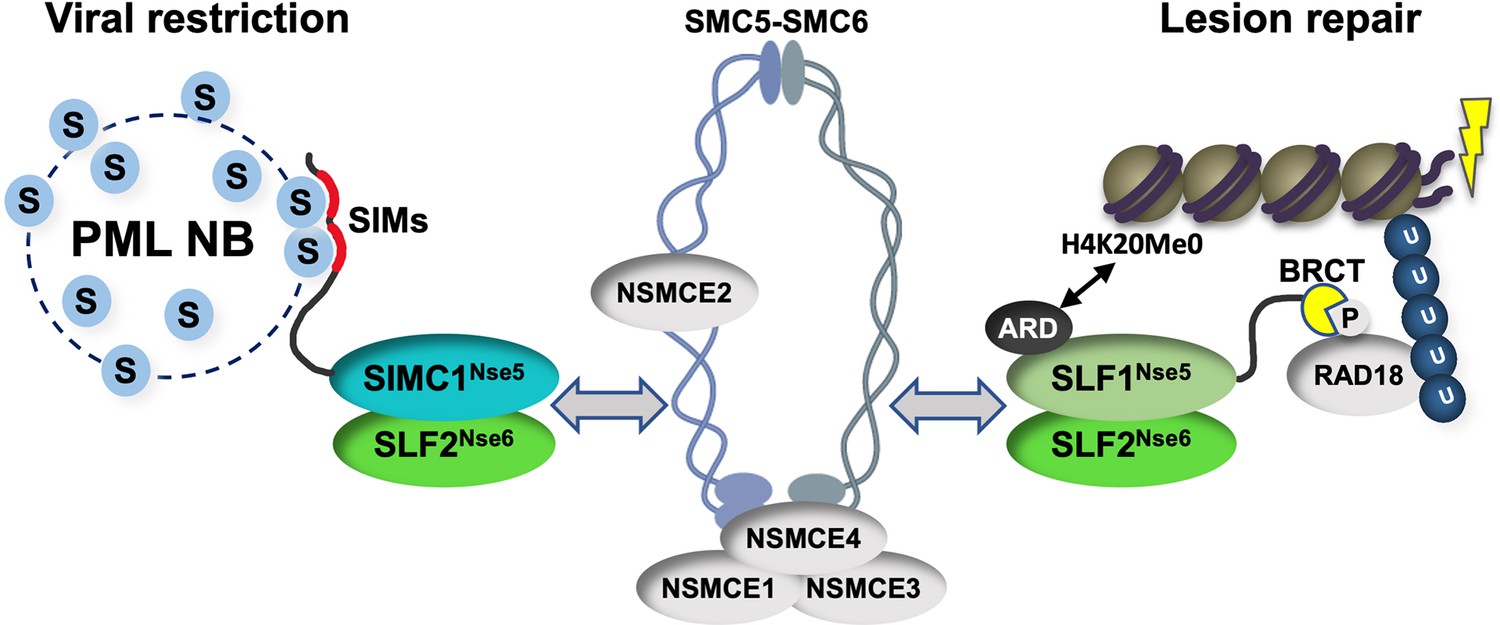
Schematic of SIMC1-SLF2 and SLF1/2 complex function.
Human orthologues of yeast Nse5, SIMC1 and SLF1, form exclusive complexes via their C-terminal Nse5-like domains with the human Nse6 ortholog SLF2. The SIMC1-SLF2 complex localizes SMC5/6 to SV40 replication centers, whereas SLF1/2 targets it to DNA lesions, likely via recognition of different post translational modifications. S stands for SUMO; U for ubiquitin.
Tables
Table 1
Cryo-EM data collection/processing and model refinement statistics.
| Sample | Human SIMC1 (284-872)-SLF2 (635–1173) (EMD-25706, PDB 7T5P) | |
|---|---|---|
| Data collection and processing | ||
| Condition | 0.4 mg/ml protein | 0.8 mg/ml protein with 0.128 mM DDM |
| Magnification | 73,000 × | 73,000 × |
| Voltage (kV) | 200 | 200 |
| Electron exposure (e-/Å2) | 66.8 | 66.9 |
| Number of frames per image | 46 | 46 |
| Defocus range (µm) | –0.5 to –1.8 | –0.5 to –1.8 |
| Pixel size (Å) | 0.567 | 0.567 |
| Symmetry imposed | C1 | C1 |
| Initial particle images (no.) | 1,873,621 | 1,065,073 |
| Final particle images (no.) | 31,383 | 8,443 |
| Map resolution (Å) FSC threshold | 3.4 0.143 | |
| Refinement | ||
| Initial model used | AlphaFold model | |
| Map resolution (Å2) FSC threshold | 3.9 0.5 | |
| Map sharpening B factor (Å2) | – | |
| Model composition | ||
| Chains | 2 | |
| Atoms | 13597 (Hydrogens: 6866) | |
| Protein residues | 822 | |
| Ligands | 0 | |
| B-factors (Å2) min/max/mean | ||
| Protein | 99.26/213.18/135.62 | |
| Ligand | – | |
| R.m.s. deviations | ||
| Bond lengths (Å2) | 0.003 | |
| Bond angles (°) | 0.591 | |
| Validation | ||
| MolProbity score | 2.00 | |
| Clashscore | 15.16 | |
| Rotamer outliers (%) | 0.26 | |
| Ramachandran plot | ||
| Favored (%) | 95.43 | |
| Allowed (%) | 4.57 | |
| Disallowed (%) | 0.00 | |
Appendix 1—key resources table
| Reagent type (species) or resource | Designation | Source or reference | Identifiers | Additional information |
|---|---|---|---|---|
| cell line (Homo-sapiens) | HEK293 | other | Cell line maintained in X. Wu lab | |
| cell line (Homo-sapiens) | HEK293 SIMC1-/- | This paper | clone A11 | Derived from HEK293 by CRISPR/ Cas9 |
| cell line (Homo-sapiens) | HEK293T; U2OS; Phoenix ampho | other | Cell lines maintained in E. Lazzerini-Denchi lab | |
| cell line (Homo-sapiens) | Flp-In–293 | ThermoFisher | R75007 | |
| cell line (Spodoptera frugiperda) | Sf9 | Expression Systems | ||
| transfected construct (human) | pOG44 Flp-Recombinase Expression Vector | ThermoFisher | V600520 | |
| transfected construct (human) | pDEST-BirA*–3FLAG-NLS-STOP | Helle Ulrich lab | pNB79; pHU4137 | FRT construct |
| transfected construct (human) | pDEST-BirA*–3FLAG-SMC5 | Helle Ulrich lab | pNB81; pHU4139 | FRT construct |
| transfected construct (human) | pLPC-myc-BirA* | Eros Lazzerini-Denchi lab | pNB176 | Retroviral vector to generate stable cell line |
| transfected construct (human) | pHAGE2-FLAG-SIMC1 | this paper | pNB185 | Lentiviral vector to generate stable cell line |
| transfected construct (human) | pLPC-Myc-BirA*-SIMC1 | this paper | pNB190 | Retroviral vector to generate stable cell line |
| transfected construct (human) | pWZL-FLAG-SLF2 | this paper | pNB195 | Retroviral vector to generate stable cell line |
| transfected construct (human) | pHAGE2 | this paper | pNB248 | Lentiviral vector to generate stable cell line |
| transfected construct (human) | pHAGE2-FLAG-SIMC1 SIM mut | this paper | pNB474 | Lentiviral vector to generate stable cell line |
| transfected construct (human) | pHAGE2-FLAG-SIMC1 combo1 mut | this paper | pNB510 | Lentiviral vector to generate stable cell line; SIMC1 mutations R473D/ N477A/ E480K/ E481K |
| transfected construct (human) | pHAGE2-FLAG-SLF1 | this paper | pNB555 | Lentiviral vector to generate stable cell line |
| antibody | anti-α-tubulin (Mouse monoclonal) | Sigma | T9026 | WB (1:10000) |
| antibody | anti-D tag (Mouse monoclonal) | ABM | G-191 | IF (1:400) |
| antibody | Anti-FLAG (Mouse monoclonal) | Sigma | F3165 | WB (1:5000) |
| antibody | Anti-GFP (Mouse monoclonal) | Santa Cruz | sc-9996 | WB (1:10000) |
| antibody | Anti-phospho-Histone H2A.X (Ser139) (Mouse monoclonal) | Sigma | 05–636 | IF (1:500) |
| antibody | Anti-Myc (Mouse monoclonal) | Scripps Antibody Core Facility | 9E10 | WB (1:3000) |
| antibody | Anti-Myc (Mouse monoclonal) | Invitrogen | MA1-980 | WB (1:2000) |
| antibody | Anti-PML (Mouse monoclonal) | Santa Cruz | sc-966 | IF (1:200) |
| antibody | Anti-PSTAIR (Mouse monoclonal) | Sigma | P7962 | WB (1:8000) |
| antibody | Anti-PSTAIR (Mouse monoclonal) | Abcam | ab10345 | WB (1:15000) |
| antibody | Anti-SIMC1 (Rabbit Polyclonal) | Abcam | ab241985 | WB (1:1000) |
| antibody | Anti-SMC6 (Rabbit Polyclonal) | Bethyl | A300-237A | IF (1:500) WB (1:1000) |
| antibody | Anti-SUMO2/3 (Mouse monoclonal) | Sigma | MABS2039 | WB (1:1000) |
| antibody | Anti-SV40 LT (Mouse monoclonal) | Abcam | ab16879 | IF (1:400) WB (1:5000) |
| antibody | Goat Anti-Rabbit IgG, HRP (Goat Polyclonal) | Invitrogen | 31460 | WB (1:5000) |
| antibody | Goat Anti-mouse IgG, HRP (Goat Polyclonal) | Invitrogen | 31430 | WB (1:5000) |
| antibody | Goat Anti-mouse IgG2a, Alexa Fluor 488 (Goat Polyclonal) | Life Technologies | A21131 | IF (1:1000) |
| antibody | Goat Anti-rabbit IgG (H+L), Alexa Fluor 555 (Goat Polyclonal) | Life Technologies | A21428 | IF (1:1000) |
| antibody | Goat Anti-mouse IgG2b, Alexa Fluor 555 (Goat Polyclonal) | Life Technologies | A21147 | IF (1:1000) |
| antibody | Goat Anti-mouse IgG, Alexa Flour 647 (Goat Polyclonal) | Jackson Labs | 115-605-006 | IF (1:1000) |
| antibody | Goat Anti-mouse IgG1, Alexa Fluor 647 (Goat Polyclonal) | Life Technologies | A21240 | IF (1:1000) |
| antibody | Goat Anti-mouse IgG2b, Alexa Fluor 647 (Goat Polyclonal) | Life Technologies | A21242 | IF (1:1000) |
| antibody | GFP-Trap magnetic agarose (Alpaca Monoclonal) | ChromoTek | gtma | IP: 25 ul slurry |
| antibody | Myc-Trap magnetic agarose (Alpaca Monoclonal) | ChromoTek | ytma | IP: 25 ul slurry |
| recombinant DNA reagent | pDEST-eGFP-Myc-SLF2 | Helle Ulrich lab | pNB062, pNZ98 | Mammalian Expression vector |
| recombinant DNA reagent | pDEST-eGFP-myc-NLS-STOP | Helle Ulrich lab | pNB68, pNZ110 | Mammalian Expression vector |
| recombinant DNA reagent | pDEST-FLAG-SIMC1 | this paper | pNB133 | Mammalian Expression vector |
| recombinant DNA reagent | pcDNA-H1-sgRNA hSIMC1 exon5 guide 1 | this paper | pNB161 | CRISPR guide |
| recombinant DNA reagent | pcDNA-H1-sgRNA hSIMC1 exon5 guide 2 | this paper | pNB162 | CRISPR guide |
| recombinant DNA reagent | pLPC-Mre11-GFP | Peiqing Sun lab | pNB168 | Mammalian Expression vector |
| recombinant DNA reagent | pMD2G | Addgene | #12259 | |
| recombinant DNA reagent | psPAX2 | Addgene | #12260 | |
| recombinant DNA reagent | pLPC-FLAG-TIN2 | Eros Lazzerini- Denchi lab | pNB174 | Mammalian Expression vector |
| recombinant DNA reagent | pDEST-FLAG-SIMC1 (284-872) | this paper | pNB175 | Mammalian Expression vector |
| recombinant DNA reagent | pLPC-Myc-SLF2 | this paper | pNB187 | Mammalian Expression vector |
| recombinant DNA reagent | pX330-hSpCas9-puro | Eros Lazzerini- Denchi lab | pNB206 | Mammalian Expression vector, CRISPR |
| recombinant DNA reagent | pcDNA3.1-NACC1-FLAG | GenScript | OHu27779D | |
| recombinant DNA reagent | pEGFP-ZNF451 | Karvonen et al., 2008 | pNB234 | |
| recombinant DNA reagent | pLPC-Myc-BirA*-SIMC1 (284-872) | this paper | pNB250 | Mammalian Expression vector |
| recombinant DNA reagent | pDEST-mCherry-SIMC1 | this paper | pNB251 | Mammalian Expression vector |
| recombinant DNA reagent | pDEST-mCherry-SLF2 | this paper | pNB256 | Mammalian Expression vector |
| recombinant DNA reagent | pDEST-mCherry-SIMC1-SIM-mut | this paper | pNB261 | SIMC1 SIM mutants FIDL to AADA and VIDL to AADA, corresponding to amino acids 26–29, and 45–48. |
| recombinant DNA reagent | pDEST-eGFP-SIMC1 | this paper | pNB263 | Mammalian Expression vector |
| recombinant DNA reagent | pBabe-SV40LT | Xiaohua Wu lab | pNB312 | Mammalian Expression vector |
| recombinant DNA reagent | pBluescript KS(+)-SV40 | James A. DeCaprio lab | pNB371 | SV40 wild type strain 776 |
| recombinant DNA reagent | pDEST-Flag-NLS-SIMC1 (381-872) | this paper | pNB433 | Mammalian Expression vector |
| recombinant DNA reagent | pDEST-Flag-NLS-SIMC1 (457-872) | this paper | pNB434 | Mammalian Expression vector |
| recombinant DNA reagent | pDEST-Flag-NLS-SIMC1 (652-872) | this paper | pNB435 | Mammalian Expression vector |
| recombinant DNA reagent | pDEST-eGFP-NLS-SLF2 (635–1173) | this paper | pNB437 | Mammalian Expression vector |
| recombinant DNA reagent | pDEST-Flag-NLS-SLF2 (635–1173) | this paper | pNB439 | Mammalian Expression vector |
| recombinant DNA reagent | pACEBac-GST-Tev-SIMC1 (284-872)-PreScission-TwinStrep | this paper | pNB458 | Baculovirus vector |
| recombinant DNA reagent | pACEBac-10xHis-Tev-SLF2 (635–1173) | this paper | pNB468 | Baculovirus vector |
| recombinant DNA reagent | pDEST-eGFP-NLS-SLF1 (410–1058) | this paper | pNB484 | Mammalian Expression vector |
| recombinant DNA reagent | pDEST-eGFP-NLS-SLF1 (410–725+936-1058) | this paper | pNB485 | Mammalian Expression vector |
| recombinant DNA reagent | pDEST-eGFP-NLS-SLF1 (410–725+GGS + 936-1058) | this paper | pNB486 | Mammalian Expression vector |
| recombinant DNA reagent | pDEST-eGFP-NLS-SLF1 (410-935) | this paper | pNB488 | Mammalian Expression vector |
| recombinant DNA reagent | pDEST-Myc-NLS-SLF2 (635–1173) | this paper | pNB489 | Mammalian Expression vector |
| recombinant DNA reagent | pDEST-GFP-SIMC1 combo1 mut | this paper | pNB497 | Mammalian Expression vector; SIMC1 mutations R473D/ N477A/ E480K/ E481K |
| recombinant DNA reagent | pDEST-Myc-SMC6 | this paper | pNB530 | Mammalian Expression vector |
| recombinant DNA reagent | pDEST-GFP-SIMC1 set A | this paper | pNB578 | Mammalian Expression vector; SIMC1 mutations Y528D/ M529D/ K533D/ L537D |
| recombinant DNA reagent | pDEST-GFP-SIMC1 set B | this paper | pNB579 | Mammalian Expression vector; SIMC1 mutations S778D/ F775E |
| recombinant DNA reagent | pDEST-GFP-SIMC1 set C | this paper | pNB580 | Mammalian Expression vector; SIMC1 mutations L847E/ L850A/ L851E/ Y854D |
| recombinant DNA reagent | pDEST-GFP-NLS-SLF1 (336–1058) | this paper | pNB581 | Mammalian Expression vector |
| recombinant DNA reagent | pDEST-GFP-NLS-SLF1 (336–1058, set A) | this paper | pNB582 | Mammalian Expression vector; SLF1 mutations G464D/ H468E/ A472D/ L476E |
| recombinant DNA reagent | pDEST-GFP-NLS-SLF1 (336–1058, set B) | this paper | pNB583 | Mammalian Expression vector; SLF1 mutations F957E/ L964E |
| recombinant DNA reagent | pDEST-GFP-NLS-SLF1 (336–1058, set C) | this paper | pNB584 | Mammalian Expression vector; SLF1 mutations A1042D/ I1045E/ M1049E |
| recombinant DNA reagent | pDEST-Myc-NLS-SLF2 (635–1173, set A) | this paper | pNB585 | Mammalian Expression vector; SLF2 mutations L775E/ F786E/ F792E |
| recombinant DNA reagent | pDEST-Myc-NLS-SLF2 (635–1173, set B) | this paper | pNB586 | Mammalian Expression vector; SLF2 mutations C820W/ I821W |
| recombinant DNA reagent | pDEST-Myc-NLS-SLF2 (635–1173, set C) | this paper | pNB587 | Mammalian Expression vector; SLF2 mutations M831R/ I835R |
| recombinant DNA reagent | pDEST-Myc-NLS-SLF2 (635–1173, set D) | this paper | pNB588 | Mammalian Expression vector; SLF2 mutations P957D/ V959D/ W1006A |
| sequence-based reagent | sgRNA1_SIMC1_F | this paper | Guide 1 for human SIMC1 CRISPR/Cas9 | AAACgcgttatgtcgttcagaccc |
| sequence-based reagent | sgRNA1_SIMC1_R | this paper | Guide 1 for human SIMC1 CRISPR/Cas9 | GATCCgggtctgaacgacataacgc |
| sequence-based reagent | sgRNA2_SIMC1_F | this paper | Guide 2 for human SIMC1 CRISPR/Cas9 | AAACgggcgagtccttttcctgcg |
| sequence-based reagent | sgRNA2_SIMC1_R | this paper | Guide 2 for human SIMC1 CRISPR/Cas9 | GATCCcgcaggaaaaggactcgccc |
| sequence-based reagent | SIMC1_STOP | this paper | donor template for human SIMC1 CRISPR/Cas9 containing the STOP cassette | TGACTTCTCATTCTTTTTCCCACagggacaaactctgcgtgggcgagtccttttcgtgcgGTCGGATCCTTTAAACCTTAATTAAGCTGTTGTAGttatgtcgttcagaccctagaagatgactttcagcagaccctgaggaggcaacggcagca |
| sequence-based reagent | beta actin_F | this paper | qPCR primer | AGGCACCAGGGCGTGAT |
| sequence-based reagent | beta actin_R | this paper | qPCR primer | GCCCACATAGGAATCCTTCTGAC |
| sequence-based reagent | SIMC1 3´UTR_F | this paper | qPCR primer | cctgccaagcactgaatgcc |
| sequence-based reagent | SIMC1 3´UTR_R | this paper | qPCR primer | ccatatttgagaacaggctaggatagg |
| peptide, recombinant protein | Benzonase | EMD Millipore | 70746 | |
| peptide, recombinant protein | cOmplete, Mini, EDTA-free Protease Inhibitor Cocktail Tablets | Sigma | 4693159001 | |
| peptide, recombinant protein | Dynabeads MyOne Streptavidin C1 | ThermoFisher | 65001 | |
| peptide, recombinant protein | Dynabeads MyOne Streptavidin T1 | ThermoFisher | 65601 | |
| peptide, recombinant protein | Endoproteinase LysC | New England BioLabs | P8109S | |
| peptide, recombinant protein | Glutathione Agarose Resin | GoldBio | G-250–100 | |
| peptide, recombinant protein | HaltTM Protease Inhibitor Cocktail, EDTA-Free (100 X) | ThermoFisher | 78437 | |
| peptide, recombinant protein | protease inhibitor cocktail | Pierce | A32963 | |
| peptide, recombinant protein | Tev protease | this paper | prepared in the lab | |
| peptide, recombinant protein | Trypsin Protease | Pierce | 90057 | |
| chemical compound, drug | arginine-0/lysine-0 (light) | Sigma | A6969 and L8662 | |
| chemical compound, drug | arginine-6/lysine-8 (heavy) | Cambridge Isotope Laboratories | CNLM-539-H-1 and CNLM-291-H-1 | |
| chemical compound, drug | Biotin | Sigma | B4501 | |
| chemical compound, drug | Cold water fish gelatin | Sigma | G7765 | |
| chemical compound, drug | 4’,6-diamidino-2-phenylindole dihydrochloride (DAPI) | Sigma | D-9542 | |
| chemical compound, drug | DMEM for SILAC | ThermoFisher | 88364 | |
| chemical compound, drug | Dimethyl sulfoxide (DMSO) | Sigma | D8418 | |
| chemical compound, drug | Gelatin (type A) | MP bio | 901771 | |
| chemical compound, drug | Hoechst 33342 | Invitrogen | H3570 | |
| chemical compound, drug | Hygromycin B | Invivogen | ant-hg | |
| chemical compound, drug | Iodoacetamide | Sigma | ||
| chemical compound, drug | Lipofectamine 2000 | ThermoFisher | 11668019 | |
| chemical compound, drug | MMS | Sigma | 129925 | |
| chemical compound, drug | Nocodazole | Fisher Scientific | NC1084348 | |
| chemical compound, drug | Normal goat serum | BioLegend | 927502 | |
| chemical compound, drug | Polyethylenimine (PEI) | Polysciences | 02371–500 | |
| chemical compound, drug | ProBond Ni affnity resin | Invitrogen | 46–0019 | |
| chemical compound, drug | Superdex 200 10/300 | GE Healthcare | 17517501 | |
| chemical compound, drug | TCEP | Pierce | 20490 | |
| chemical compound, drug | TransIT-LT1 | Mirus | MIR2300 | |
| chemical compound, drug | Triton X-100 | Sigma | T9284 | |
| chemical compound, drug | Trypsin EDTA 0.25% | ThermoFisher | 25300054 | |
| chemical compound, drug | UltraAuFoil R1.2/1.3 300-mesh grids | Quantifoil | ||
| commercial assay or kit | CometAssay | Trevigen | 4250–050 K | |
| commercial assay or kit | In-Fusion HD Cloning Plus Kits | Takara | 638910 | |
| commercial assay or kit | NuPAGE LDS Sample Loading Buffer | ThermoFisher | NP0007 | |
| commercial assay or kit | ProLong Gold Antifade | Invitrogen | P36934 | |
| commercial assay or kit | Rneasy Plus Mini Kit | QIAGEN | 74104 | |
| commercial assay or kit | Sensifast SYBR No-rox | Meridian Bioscience | BIO-98020 | |
| commercial assay or kit | Superscript III First-Strand Synthesis System for RT-PCR | Invitrogen | 18080–051 | |
| commercial assay or kit | SuperSignal West Dura Extended Duration Substrate | ThermoFisher | 34076 | |
| commercial assay or kit | West-Q Pico ECL solution | genDEPOT | W3652-020 | |
| software, algorithm | AlphaFold 2 | https://doi.org/10.1038/s41586-021-03819-2 | ||
| software, algorithm | AlphaFold-Multimer | https://doi.org/10.1101/2021.10.04.463034 | ||
| software, algorithm | ColabFold | https://doi.org/10.1038/s41592-022-01488-1 | ||
| software, algorithm | HHpred | https://doi.org/10.1016/j.jmb.2017.12.007 | ||
| software, algorithm | IP2 - Integrated Proteomics Pipeline | https://doi.org/10.1016/j.jsb.2009.01.002 |
Additional files
-
Supplementary file 1
Mass spectrometry identification of SMC5 interacting proteins labelled by SILAC and BioID.
- https://cdn.elifesciences.org/articles/79676/elife-79676-supp1-v2.xlsx
-
Supplementary file 2
Mass spectrometry identification of SIMC1 BioID.
- https://cdn.elifesciences.org/articles/79676/elife-79676-supp2-v2.xlsx
-
MDAR checklist
- https://cdn.elifesciences.org/articles/79676/elife-79676-mdarchecklist1-v2.docx
Download links
A two-part list of links to download the article, or parts of the article, in various formats.
Downloads (link to download the article as PDF)
Open citations (links to open the citations from this article in various online reference manager services)
Cite this article (links to download the citations from this article in formats compatible with various reference manager tools)
The Nse5/6-like SIMC1-SLF2 complex localizes SMC5/6 to viral replication centers
eLife 11:e79676.
https://doi.org/10.7554/eLife.79676


