Molecular mechanism of Afadin substrate recruitment to the receptor phosphatase PTPRK via its pseudophosphatase domain
- Cambridge Institute for Medical Research, University of Cambridge, United Kingdom
- Signalling Programme, Babraham Institute, United Kingdom
- Department of Pathology, University of Cambridge, United Kingdom
Figures
Figure 1 with 3 supplements
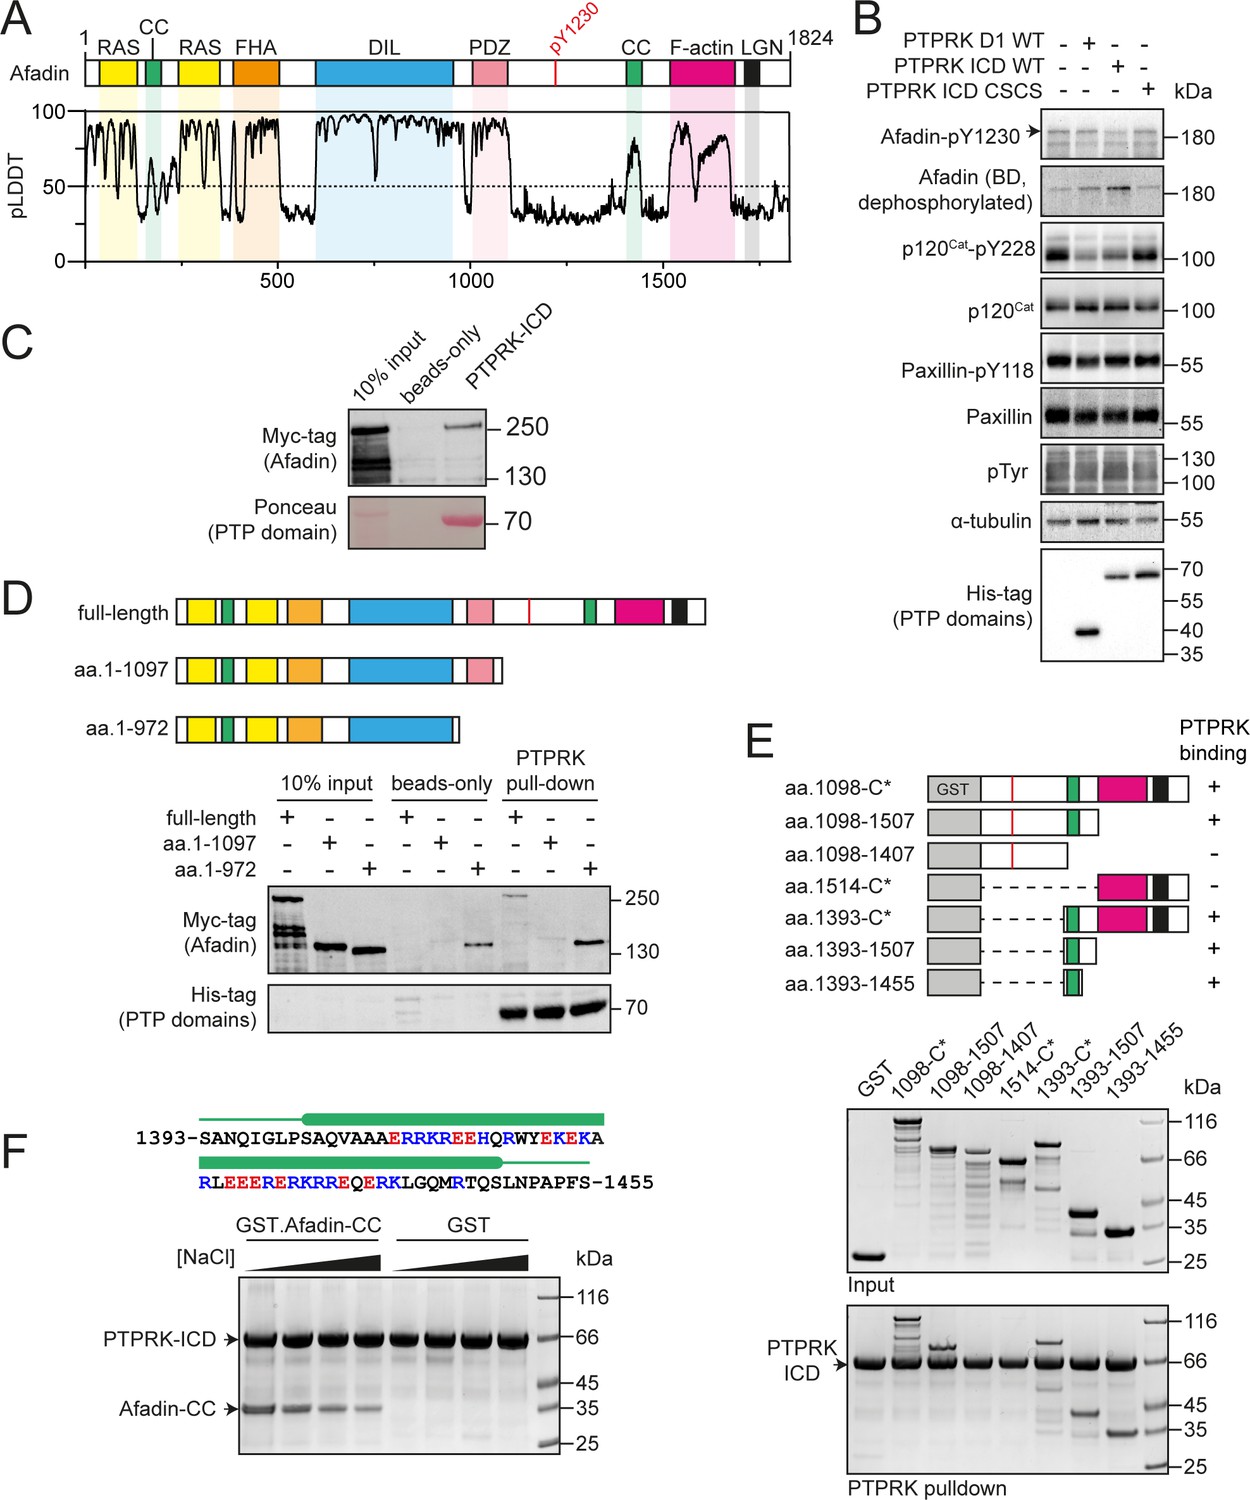
PTPRK interacts directly with the Afadin C-terminal coiled-coil (CC) region.
(A) Top: schematic of full-length human Afadin, with domain annotation based on UniProt ID P55196, showing Ras-association (RAS, yellow), CC (green), forkhead-associated (FHA, orange), dilute (DIL, blue), PDZ (pink), F-actin binding (magenta) domains, and LGN-binding peptide motif (black). The putative PTPRK target site Y1230 is also highlighted (red). Bottom: predicted local distance difference test (pLDDT) for the Afadin AlphaFold2 (AF2) prediction from the AlphaFold Protein Structure Database (P55196, retrieved 7/2/2022). A pLDDT score <50 is predictive of protein disorder (Jumper et al., 2021). (B) Immunoblot analysis of pervanadate-treated MCF10A cell lysates incubated for 45 min at 4°C with 0.3 µM of the indicated recombinant PTP domains. Note: the total Afadin antibody is sensitive to phosphorylation likely at Y1230 (antigen: Afadin 1091–1233) and therefore indicates dephosphorylated Afadin. A full time course is quantified in Figure 1—figure supplement 2E. (C) Immunoblot analysis of streptavidin bead-conjugated PTPRK-ICD pull-downs from wheat germ lysate containing full-length Afadin. (D) Top: schematic of different Afadin C-terminal truncations used in initial mapping experiments, colored as in (A). Bottom: immunoblot analysis of streptavidin bead-conjugated PTPRK-ICD pull-downs from wheat germ lysates containing C-terminal Afadin truncations. Prey proteins enriched on both beads-only and PTPRK pull-downs were considered to be nonspecific interactions. (E) Top: schematic of different Afadin C-terminal GST-fusion constructs used for interaction mapping. Bottom: pull-downs using streptavidin bead-conjugated PTPRK-ICD with purified GST-Afadin fusion proteins, followed by SDS-PAGE and Coomassie staining. (F) Top: sequence of Afadin-CC showing predicted helical region (green block) as observed in the full-length Afadin AF2 prediction. This region contains a high number of charged residues, which have been highlighted (basic, blue; acidic, red). Bottom: pull-downs using streptavidin-conjugated-PTPRK-ICDs with either GST or GST-Afadin-CC in the presence of increasing NaCl concentrations (10, 100, 250, 500 mM; left to right) followed by SDS-PAGE and Coomassie staining. Gels and blots shown in this figure are representative of n ≥ 3 independent experiments.
-
Figure 1—source data 1
Uncropped, unedited blots for Figure 1B.
- https://cdn.elifesciences.org/articles/79855/elife-79855-fig1-data1-v2.zip
-
Figure 1—source data 2
Uncropped, unedited blots for Figure 1C.
- https://cdn.elifesciences.org/articles/79855/elife-79855-fig1-data2-v2.zip
-
Figure 1—source data 3
Uncropped, unedited blots for Figure 1D.
- https://cdn.elifesciences.org/articles/79855/elife-79855-fig1-data3-v2.zip
-
Figure 1—source data 4
Uncropped, unedited gels for Figure 1E.
- https://cdn.elifesciences.org/articles/79855/elife-79855-fig1-data4-v2.zip
-
Figure 1—source data 5
Uncropped, unedited gels for Figure 1F.
- https://cdn.elifesciences.org/articles/79855/elife-79855-fig1-data5-v2.zip
Figure 1—figure supplement 1
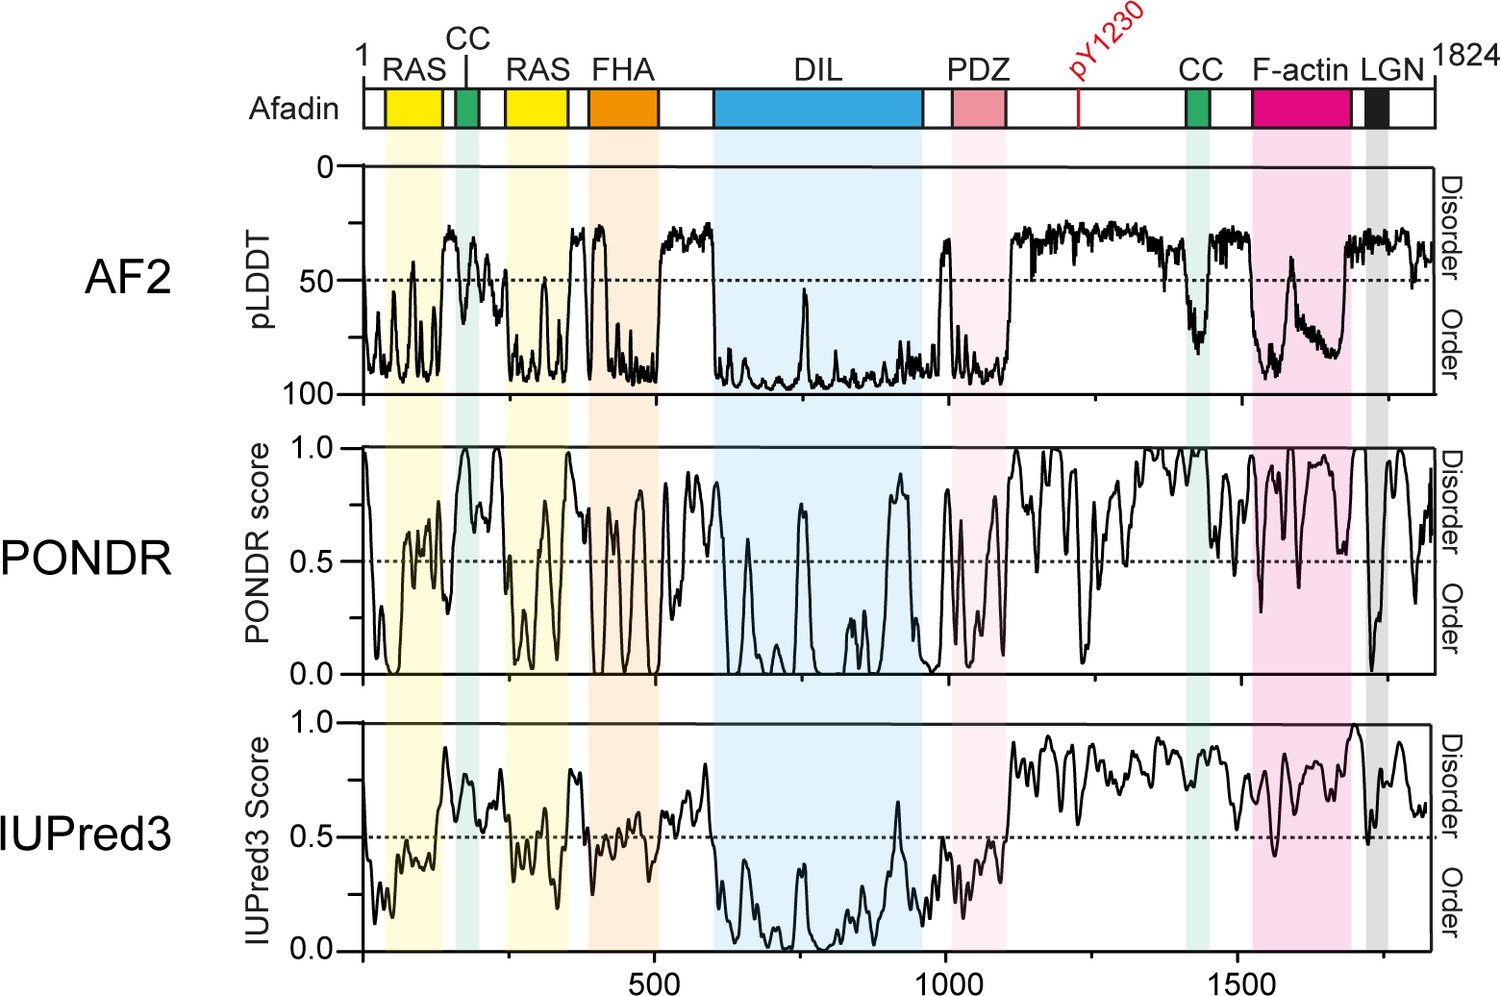
Disorder predictions for Afadin.
Top: schematic of full-length human Afadin (also known as AF6 or MLLT4), with domain annotation based on UniProt ID P55196, colored as in main Figure 1A. The predicted local distance difference test (pLDDT) for the Afadin AlphaFold2 (AF2) prediction from the AF Protein Structure Database (ID: P55196, retrieved 7/2/2022) is aligned to disorder predictions from the PONDR and IUPred3 servers, highlighting the agreement of pLDDT scores with dedicated disorder prediction methods. For clarity, the Y axis for the AF2 pLDDT plot has been inverted, so as to have predicted disorder consistently displayed in the top half of all graphs.
Figure 1—figure supplement 2
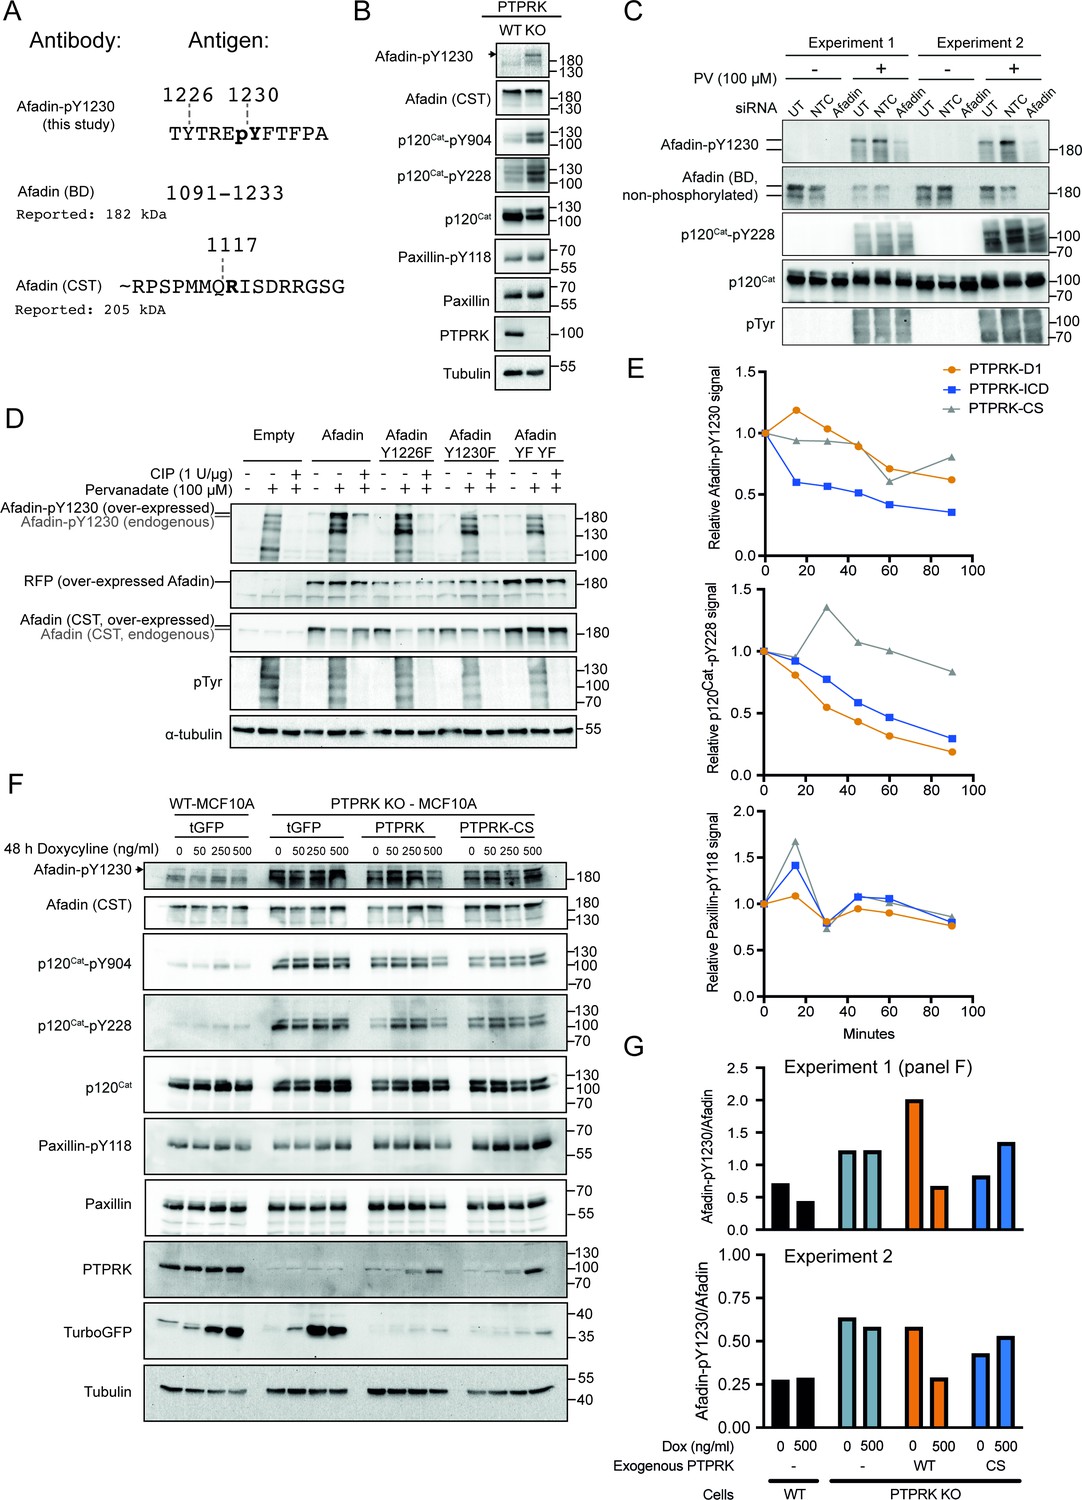
Afadin-pY1230 antibody validation.
(A) Top: phosphopeptide antigen used to generate a sheep polyclonal anti-Afadin-pY1230 antibody (tthis study). Middle: amino acid numbers of epitope used to generate a mouse monoclonal against Afadin (BD Transduction Laboratories). Note that the epitope encompasses Y1230. Bottom: approximate peptide used to generate rabbit monoclonal antibody against Afadin. Note that there is no overlap with Y1230. Numbering based on UniProt: P55196-4. (B) Lysates from confluent wildtype and PTPRK KO MCF10As were analyzed by immunoblot. (C) Replicate immunoblot analyses of MCF10A cells either untransfected (UT) or transfected with non-targeting control (NTC) and AFDN (Afadin)-targeting small interfering (si)RNAs. Tyrosine phosphorylation of cellular proteins was stimulated by treatment with 100 μM pervanadate (PV) for 30 min prior to cell lysis. Note that the anti-Afadin antibody (BD) is sensitive to tyrosine phosphorylation. (D) HEK293T cells were transfected with indicated mScarlet plasmids and treated with or without 100 μM PV. Following cell lysis, indicated samples were dephosphorylated with calf intestinal phosphatase (CIP). Lysates were then analyzed by SDS-PAGE and immunoblotting. MScarlet-Afadin and endogenous Afadin can be resolved, as indicated, using an 8% polyacrylamide gel. Note: there are multiple bands detected by Afadin pY1230. This could reflect on target detection of Afadin isoforms or off-target detection of proteins with similar peptide sequences. However, since it is clear which band is the full-length longest isoform of Afadin we have not sought their identity for this study. (E) Densitometric quantification of immunoblots in Figure 1B (45 min time point shown). Top: Afadin-pY1230 time points normalized to no protein control. Bottom: paxillin-pY118 time points normalized to no protein control. (F) Wildtype or PTPRK KO MCF10As, with stably integrated doxycycline-inducible tGFP, PTPRK, or PTPRK-C1089S, were cultured for 6 days with indicated concentrations of doxycycline supplemented for the final 48 hr, then lysed and subjected to immunoblot analysis. (G) Densitometric quantification of immunoblots from panel (F). Afadin-pY1230 signal is normalized to the total Afadin from the same experiment after reprobing the membrane, comparing 0 ng/ml and 500 ng/ml doxycycline (Dox) samples. Top: quantification of panel (F). Bottom: quantification of biological replicate experiment.
-
Figure 1—figure supplement 2—source data 1
Uncropped, unedited blots for Figure 1—figure supplement 2B.
- https://cdn.elifesciences.org/articles/79855/elife-79855-fig1-figsupp2-data1-v2.zip
-
Figure 1—figure supplement 2—source data 2
Uncropped, unedited blots for Figure 1—figure supplement 2C.
- https://cdn.elifesciences.org/articles/79855/elife-79855-fig1-figsupp2-data2-v2.zip
-
Figure 1—figure supplement 2—source data 3
Uncropped, unedited blots for Figure 1—figure supplement 2D.
- https://cdn.elifesciences.org/articles/79855/elife-79855-fig1-figsupp2-data3-v2.zip
-
Figure 1—figure supplement 2—source data 4
Densitometric quantification shown in Figure 1—figure supplement 2E.
- https://cdn.elifesciences.org/articles/79855/elife-79855-fig1-figsupp2-data4-v2.xlsx
-
Figure 1—figure supplement 2—source data 5
Uncropped, unedited blots for Figure 1—figure supplement 2F.
- https://cdn.elifesciences.org/articles/79855/elife-79855-fig1-figsupp2-data5-v2.zip
-
Figure 1—figure supplement 2—source data 6
Densitometric quantification shown in Figure 1—figure supplement 2G.
- https://cdn.elifesciences.org/articles/79855/elife-79855-fig1-figsupp2-data6-v2.xlsx
Figure 1—figure supplement 3
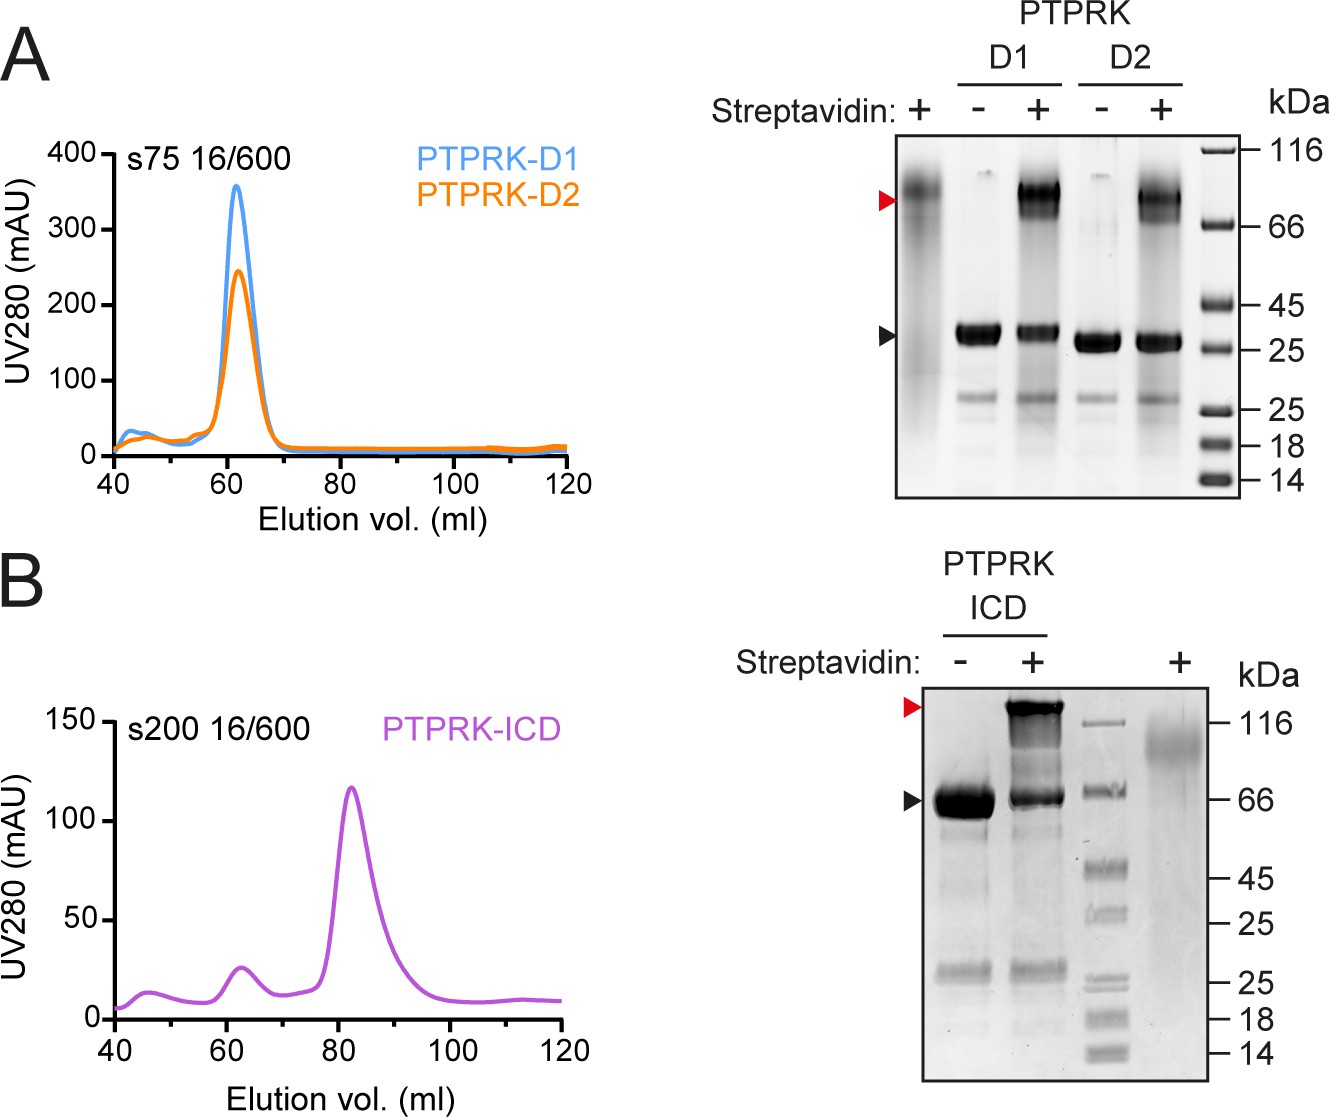
Purification of in vivo biotinylated PTP domains.
(A) Left: following Ni-NTA affinity chromatography, in vivo biotinylated PTPRK D1 and D2 domains were purified by size-exclusion chromatography (SEC) on an S75 16/600 column. Right: after SEC purification, in vivo biotinylated PTPRK D1 and D2 domains were incubated with or without streptavidin, resolved by SDS-PAGE and visualized by Coomassie staining. The mobility shift upon streptavidin binding to biotinylated protein is indicated by a red arrowhead. (B) Left: following Ni-NTA affinity chromatography, in vivo biotinylated PTPRK-ICD was purified by SEC on anS200 16/600 column. Right: after SEC purification, biotinylation of PTPRK-ICD was assessed as described in (A).
-
Figure 1—figure supplement 3—source data 1
Uncropped, unedited gels for Figure 1—figure supplement 3A.
- https://cdn.elifesciences.org/articles/79855/elife-79855-fig1-figsupp3-data1-v2.zip
-
Figure 1—figure supplement 3—source data 2
Uncropped, unedited blots for Figure 1—figure supplement 3B.
- https://cdn.elifesciences.org/articles/79855/elife-79855-fig1-figsupp3-data2-v2.zip
Figure 2 with 1 supplement
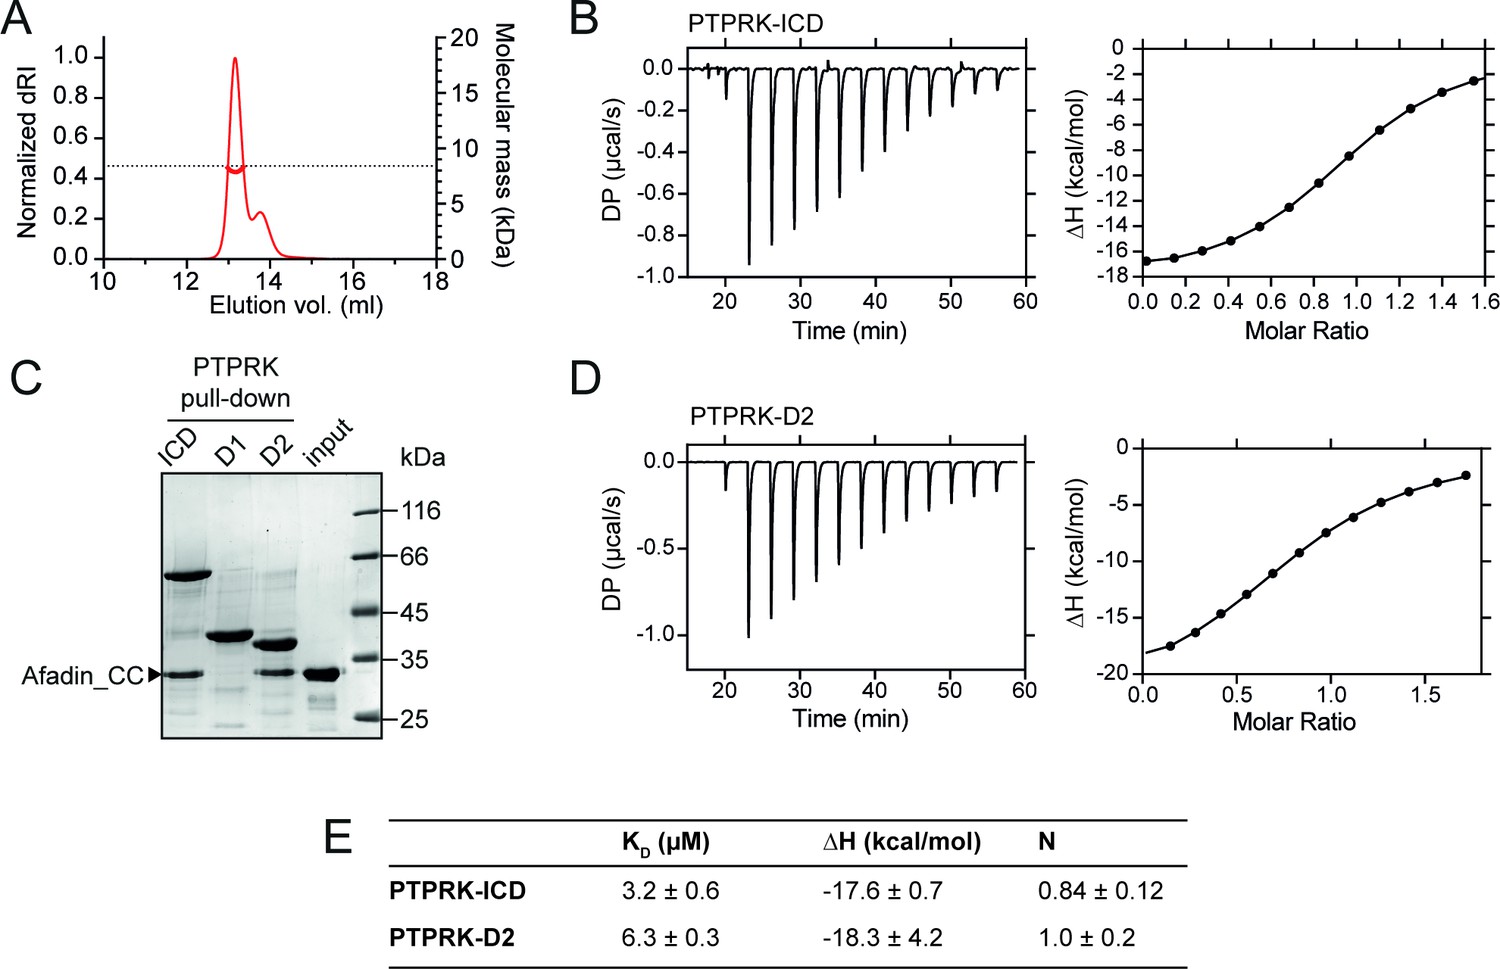
PTPRK:Afadin-CC forms an equimolar complex with micromolar affinity.
(A) Size-exclusion chromatography coupled to multi-angle light scattering (SEC-MALS) analysis of Afadin-CC. The SEC elution profile (normalized differential refractive index [dRI]; thin red line) and weight-averaged molecular mass (red thick line) are shown. The dashed horizontal line indicates the predicted mass of monomeric Afadin-CC after removal of the GST affinity tag. (B) Isothermal titration calorimetry (ITC) titration curves of the interaction between Afadin-CC and PTPRK-ICD. Left: baseline-corrected differential power (DP) plotted over time. Right: normalized binding curve showing the integrated change in enthalpy against the molar ratio. (C) PTPRK pull-downs using streptavidin bead-conjugated ICD, D1 or D2 domains against GST-Afadin-CC followed by SDS-PAGE and Coomassie staining. Gel is representative of n ≥ 3 independent experiments. (D) ITC titration curves of the interaction between Afadin-CC and PTPRK-D2. Data presented as described for (B). (E) Table showing the dissociation constant (KD), enthalpy (ΔH), and number of binding sites (N) for the ITC experiments performed in this study. Data represents the mean ± SEM of n = 2 independent experiments.
-
Figure 2—source data 1
Uncropped, unedited gels for Figure 2C.
- https://cdn.elifesciences.org/articles/79855/elife-79855-fig2-data1-v2.zip
Figure 2—figure supplement 1
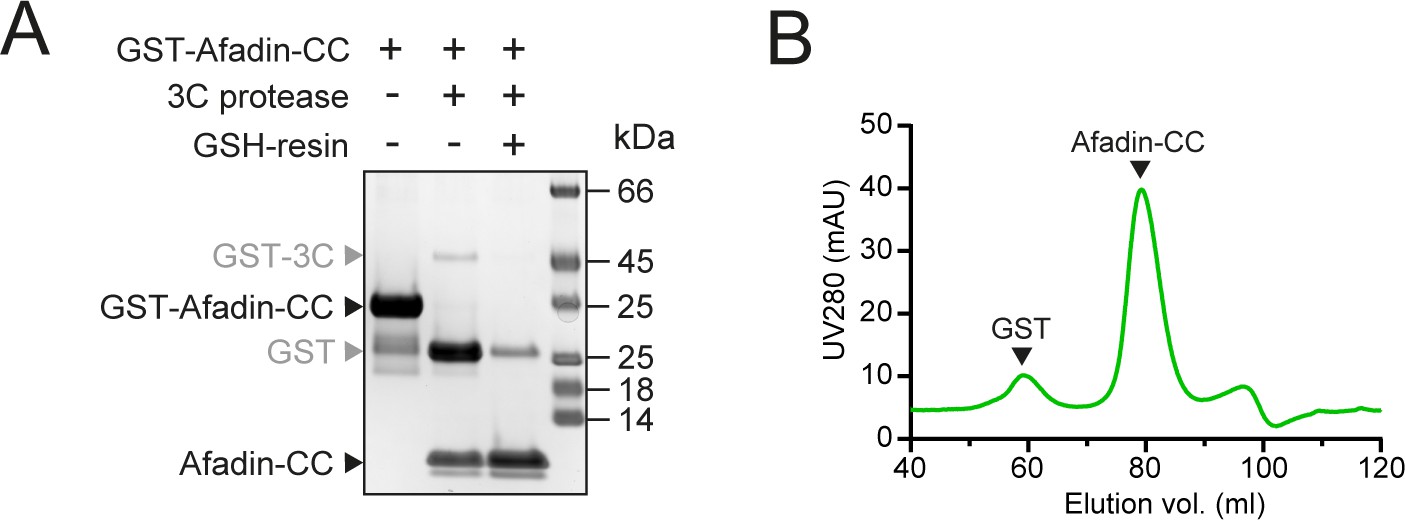
GST-tag removal from Afadin-CC for size-exclusion chromatography coupled to multi-angle light scattering (SEC-MALS) and isothermal titration calorimetry (ITC) experiments.
(A) GST was removed from GST-Afadin-CC by overnight cleavage with GST-3C protease. Cleaved GST and GST-3C were removed by incubation with GSH-sepharose 4B (GSH-resin). (B) Residual cleaved GST was removed by SEC of the Afadin-CC sample on an S75 16/600 column.
-
Figure 2—figure supplement 1—source data 1
Uncropped, unedited gels for Figure 2—figure supplement 1A.
- https://cdn.elifesciences.org/articles/79855/elife-79855-fig2-figsupp1-data1-v2.zip
Figure 3 with 3 supplements
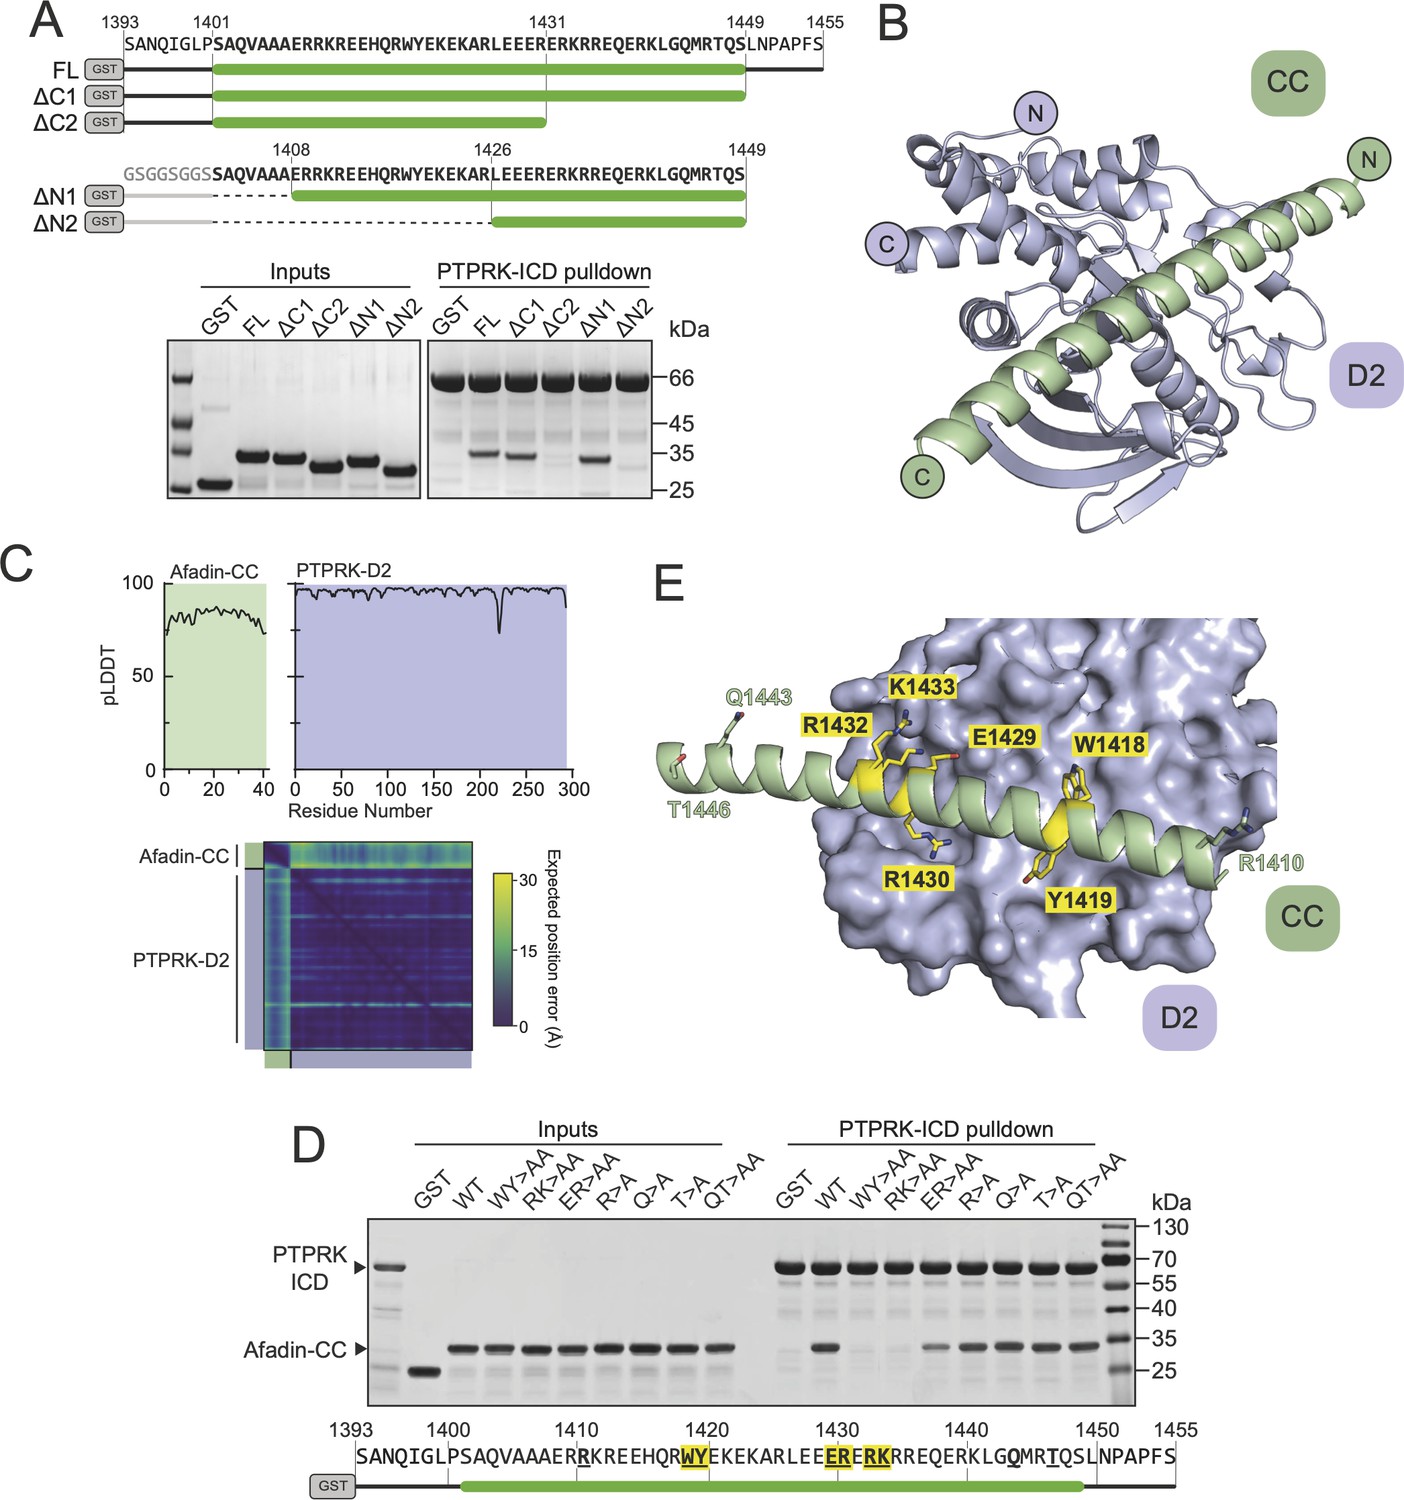
Structural prediction of the PTPRK-D2:Afadin-CC complex.
(A) Top: schematic of different GST-Afadin-CC truncations used for further interaction mapping experiments. Regions within the predicted helix are marked by a green bar. Dashed lines indicate deleted regions in N-terminal truncations. Bottom: pull-downs using streptavidin bead-conjugated PTPRK-ICD against GST-Afadin-CC truncations followed by SDS-PAGE and Coomassie staining. (B) The top model generated by AF2-Multimer of the PTPRK-D2 domain (blue) in complex with Afadin-CC (green). (C) Prediction quality analysis for the top PTPRK-D2:Afadin-CC complex model. Top: plot of predicted local distance difference test (pLDDT) for Afadin-CC (green) and PTPRK-D2 (blue). Bottom: predicted aligned error (PAE) plot for the PTPRK-D2:Afadin-CC complex. Quality analyses for all five generated models are available in Figure 3—figure supplement 3. (D) PTPRK pull-downs using streptavidin bead-conjugated PTPRK-ICD against GST-Afadin-CC point mutants followed by SDS-PAGE and Coomassie staining. Residue numbering of the Afadin-CC sequence is shown below. Residues that were mutated are in bold underline, with mutations that alter Afadin-CC binding highlighted in yellow. (E) Molecular surface representation of PTPRK-D2 (blue) in complex with Afadin-CC (green ribbons). The sidechains of Afadin-CC residues that were mutated in (D) are shown in stick representation, with residues that were shown to be critical for PTPRK binding highlighted in yellow. Gels shown in this figure are representative of n ≥ 3 independent experiments.
-
Figure 3—source data 1
Uncropped, unedited gels for Figure 3A.
- https://cdn.elifesciences.org/articles/79855/elife-79855-fig3-data1-v2.zip
-
Figure 3—source data 2
Uncropped, unedited gel images for Figure 3D.
- https://cdn.elifesciences.org/articles/79855/elife-79855-fig3-data2-v2.zip
Figure 3—figure supplement 1
Structural prediction of the PTPRK-D2:Afadin-CC complex.
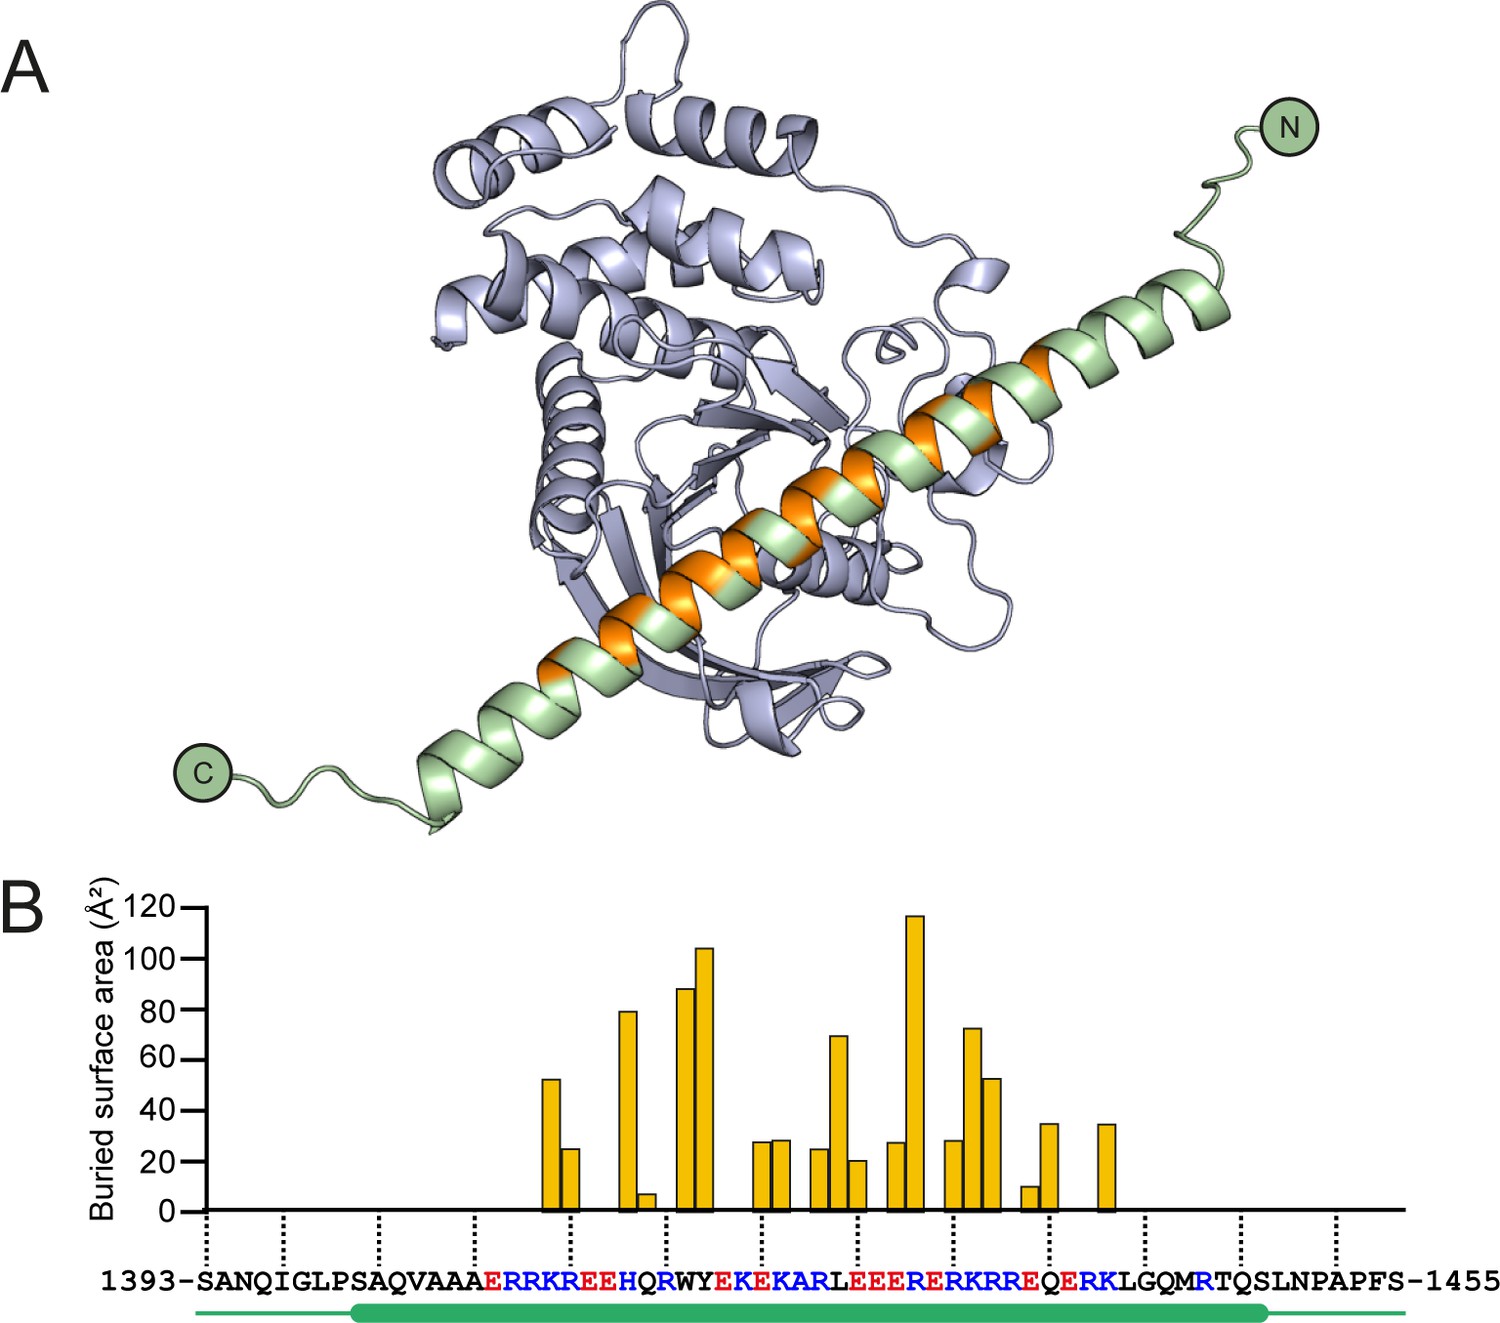
(A) Ribbon diagram of the AF2-Multimer prediction for the PTPRK-D2 domain (blue) in complex with the full Afadin-CC (aa. 1393–1455, green). Afadin-CC residues that contribute to the interaction interface are highlighted in orange. (B) Graph of buried surface area (Å2) per residue of Afadin-CC for the PTPRK-D2:Afadin-CC complex. All residues that contribute to the interface are within the core sequence of charged residues (highlighted red/blue for acidic/basic, respectively) within the helical region of Afadin-CC (highlighted by green cylinder). Buried surface area calculations were performed using the ‘Protein interfaces, surfaces and assemblies’ service (PISA) at the European Bioinformatics Institute (Krissinel and Henrick, 2007).
Figure 3—figure supplement 2
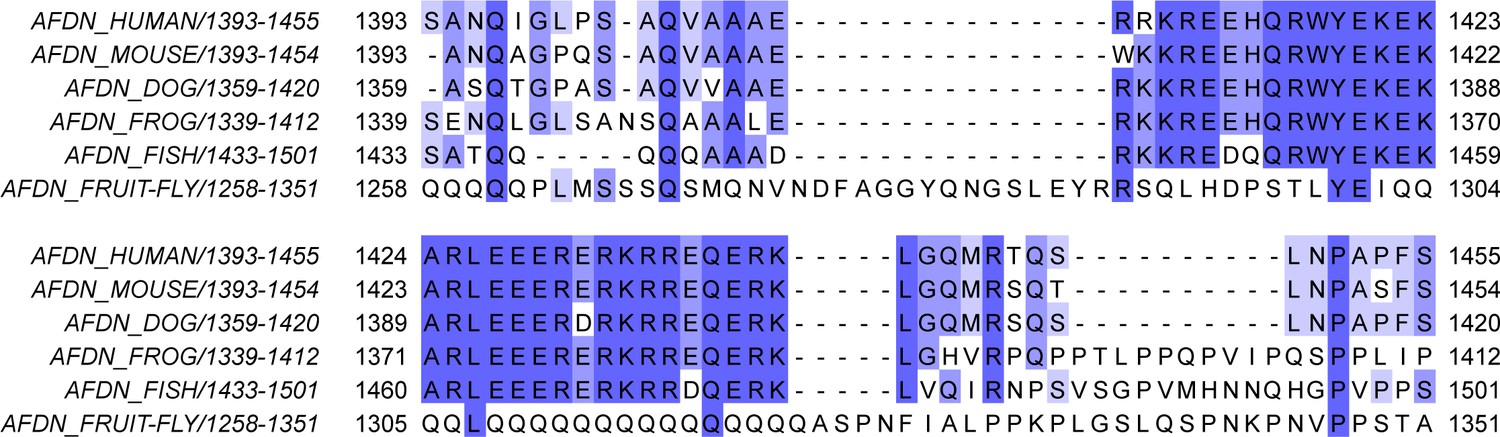
Species conservation of Afadin-CC.
Multiple-sequence alignment of the equivalent Afadin-CC region (hsAFDN aa. 1393–1455) from human (Homo sapiens), mouse (Mus musculus), dog (Canis familiaris), frog (Xenopus laevis), zebrafish (Danio rerio), and fruit fly (Drosophila melanogaster).
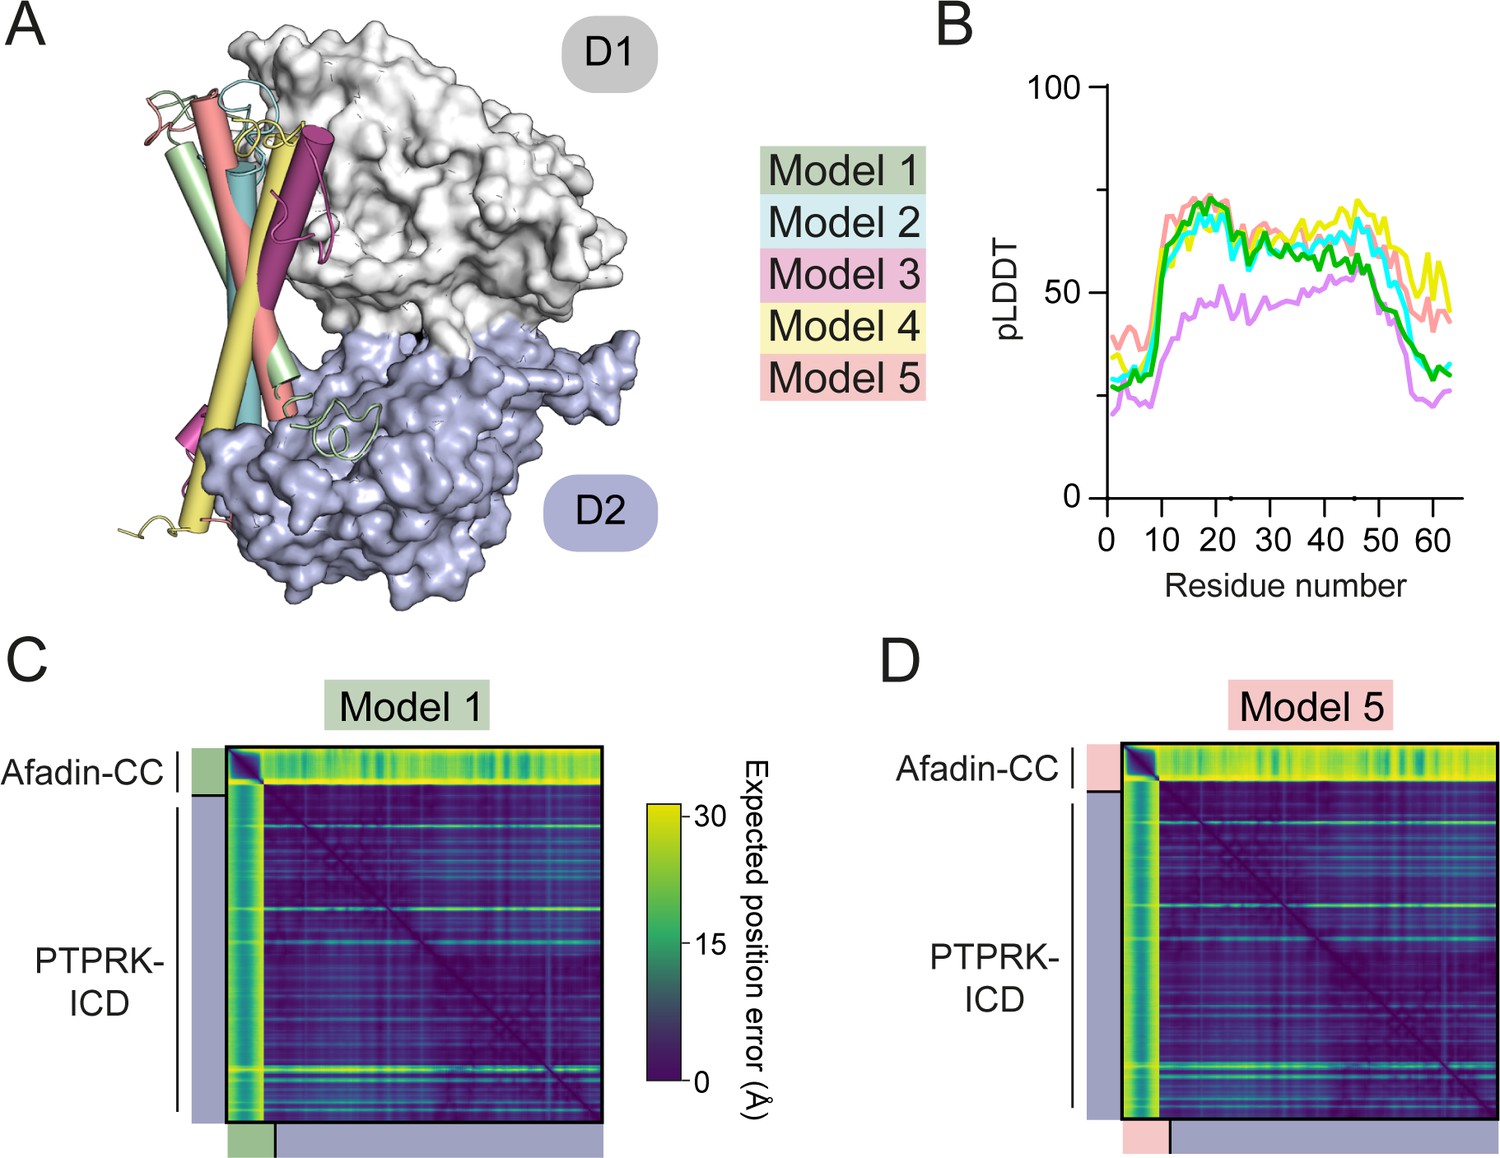
Figure 3—figure supplement 3
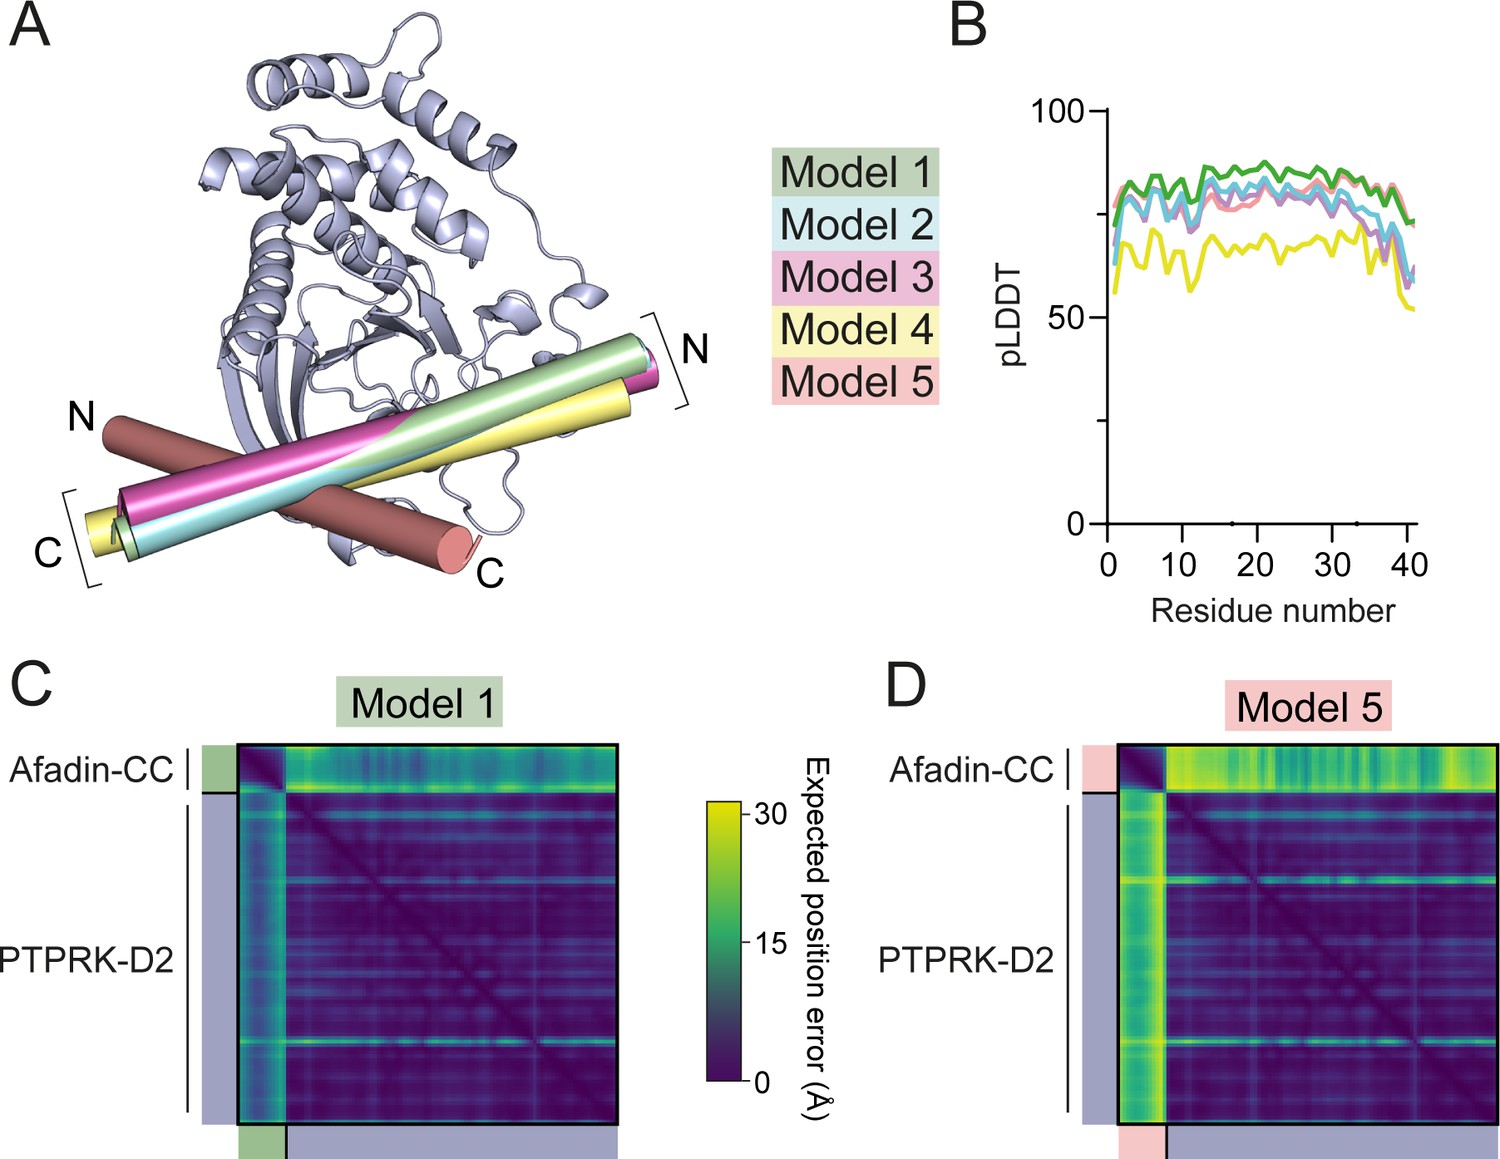
Prediction quality analysis of AF2 multimer-generated PTPRK-D2:Afadin-CC complex models.
(A) The five AF2-Multimer-generated PTPRK-D2:Afadin-CC models were superposed using the PTPRK-D2 chain only. The Afadin-CC chains of each ranked model are shown as cylinders (colored as indicated) with N- and C-termini highlighted. (B) Plot of predicted local distance difference test (pLDDT) for the Afadin-CC chain of each ranked PTPRK-D2:Afadin-CC model, colored as in (A). (C, D) Predicted aligned error (PAE) plot for highest (C, model 1) and lowest (D, model 5) ranked models for the PTPRK-D2:Afadin-CC complex. The high expected position error for Afadin-CC vs. PTPRK-D2 residues in model 5 indicates a low confidence in the relative positioning of these domains for the lower-ranked models versus that observed for model 1.
Figure 4 with 4 supplements

PTPRK binds Afadin-CC via an acidic pocket distal from the D2 ‘active’ site.
(A) Conservation mapping of the PTPRK-D2:Afadin-CC interface. PTPRK-D2 is shown (blue surface representation) in complex with Afadin-CC (green ribbons). Residues that are conserved in both PTPRK/PTPRU but not PTPRM are potentially involved in Afadin binding specificity and are highlighted on the PTPRK-D2 surface in red. Cα atoms of Afadin-CC residues identified as critical for PTPRK binding (see Figure 3D and E) are highlighted by yellow spheres. For clarity and orientation, the D1 domain of PTPRK has been modeled in transparent surface representation (white) and both D1 and D2 ‘active’ sites highlighted in purple and dotted circles. Three orientations rotated by 90° are shown. (B) Inset shows the molecular detail of key residues at the highlighted region on the PTPRK-D2 surface. Equivalent residues for the highlighted region are shown for PTPRK (blue) and PTPRM (wheat) in stick representation. (C) Electrostatic properties of PTPRK (left) and PTPRM (right) D2 domains, colored by electrostatic potential (–5 to +5 kT, as red and blue, respectively). Domains are oriented as shown in (B). The key PTPRM substitutions highlighted in (B) result in altered surface topology and electrostatic potentials compared to PTPRK. (D) Pull-downs using streptavidin bead-conjugated WT, G1273H, or L1335R PTPRK-D2 domains against GST-Afadin-CC followed by SDS-PAGE and Coomassie staining. (E) Pull-downs using streptavidin bead-conjugated WT and G1273H/L1335R double mutant (DM) PTPRK-ICD and D2 domains against GST-Afadin-CC followed by SDS-PAGE and Coomassie staining. (F) Isothermal titration calorimetry (ITC) data showing a lack of interaction between Afadin-CC and PTPRK-D2 DM. Left: baseline-corrected differential power (DP) plotted over time. Right: normalized binding curve showing the integrated change in enthalpy against the molar ratio. To highlight lack of binding, DM data (black) is shown superimposed onto the data for the WT D2 domain (gray), which is also shown in Figure 2D. (G) Immunoblot analysis of streptavidin bead-conjugated PTPRK pull-downs from wheat germ lysate containing full-length Afadin. Both WT and DM PTPRK-ICD and D2 domains were assayed for their ability to bind full-length Afadin. (H) GST pull-downs using GST-Afadin-CC against PTPRK-ICD and D2 WT, DM, F1225A, and M-loop, followed by SDS-PAGE and Coomassie staining. Gels and blots shown in this figure are representative of n ≥ 3 independent experiments.
-
Figure 4—source data 1
Uncropped, unedited gel for Figure 4D.
- https://cdn.elifesciences.org/articles/79855/elife-79855-fig4-data1-v2.zip
-
Figure 4—source data 2
Uncropped, unedited gel for Figure 4E.
- https://cdn.elifesciences.org/articles/79855/elife-79855-fig4-data2-v2.zip
-
Figure 4—source data 3
Uncropped, unedited blot for Figure 4G.
- https://cdn.elifesciences.org/articles/79855/elife-79855-fig4-data3-v2.zip
-
Figure 4—source data 4
Uncropped, unedited gel images for Figure 4H.
- https://cdn.elifesciences.org/articles/79855/elife-79855-fig4-data4-v2.zip
Figure 4—figure supplement 1
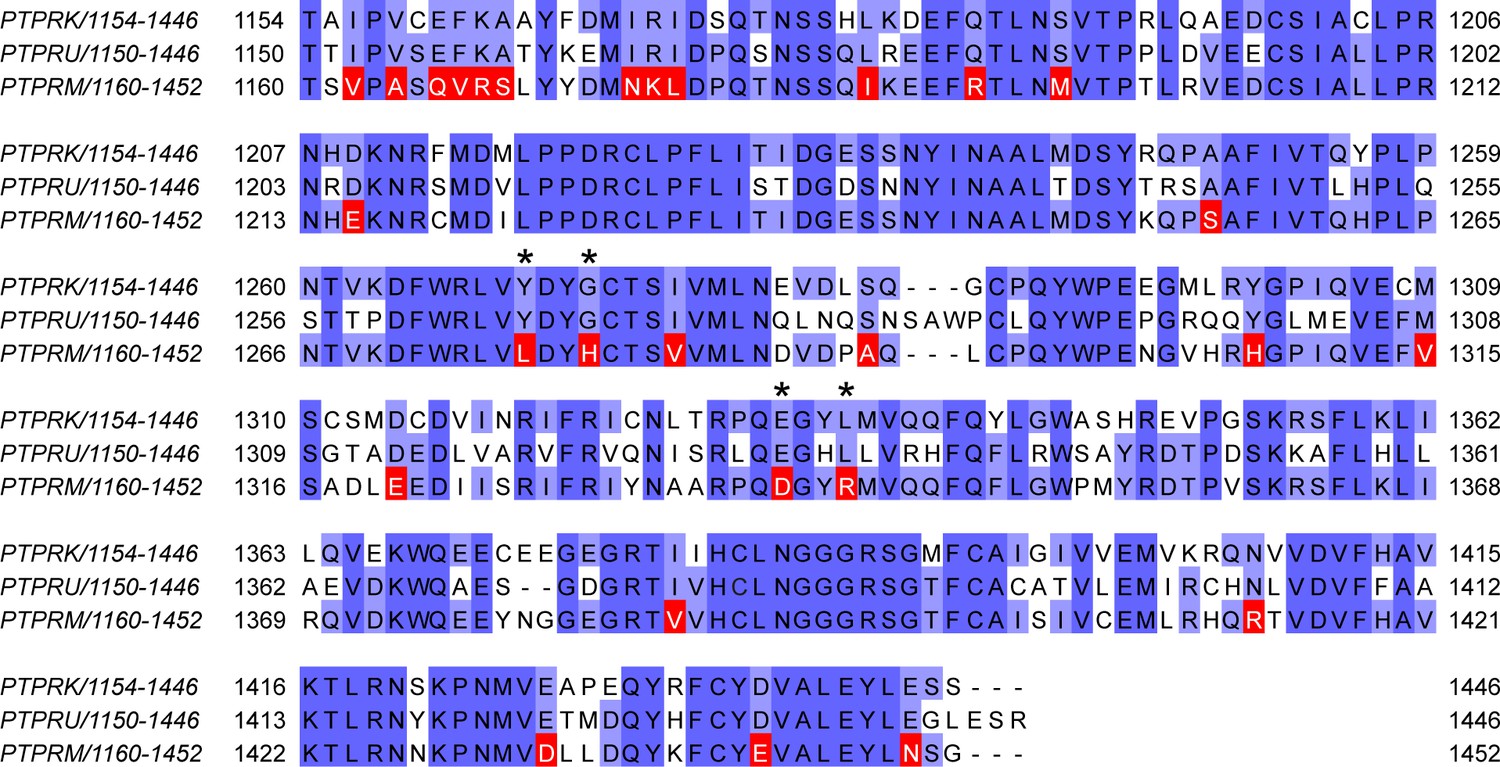
Mapping of unique PTPRM residues.
Multiple-sequence alignment of human PTPRK, PTPRU, and PTPRM D2 domain sequences. Residues that are conserved in both PTPRK and PTPRU, but differ in PTPRM, which were used for interaction site mapping, are highlighted in red. Asterisks denote divergent PTPRM residues present at the PTPRK-D2:Afadin-CC interface, as illustrated in Figure 3D and E.
Figure 4—figure supplement 2
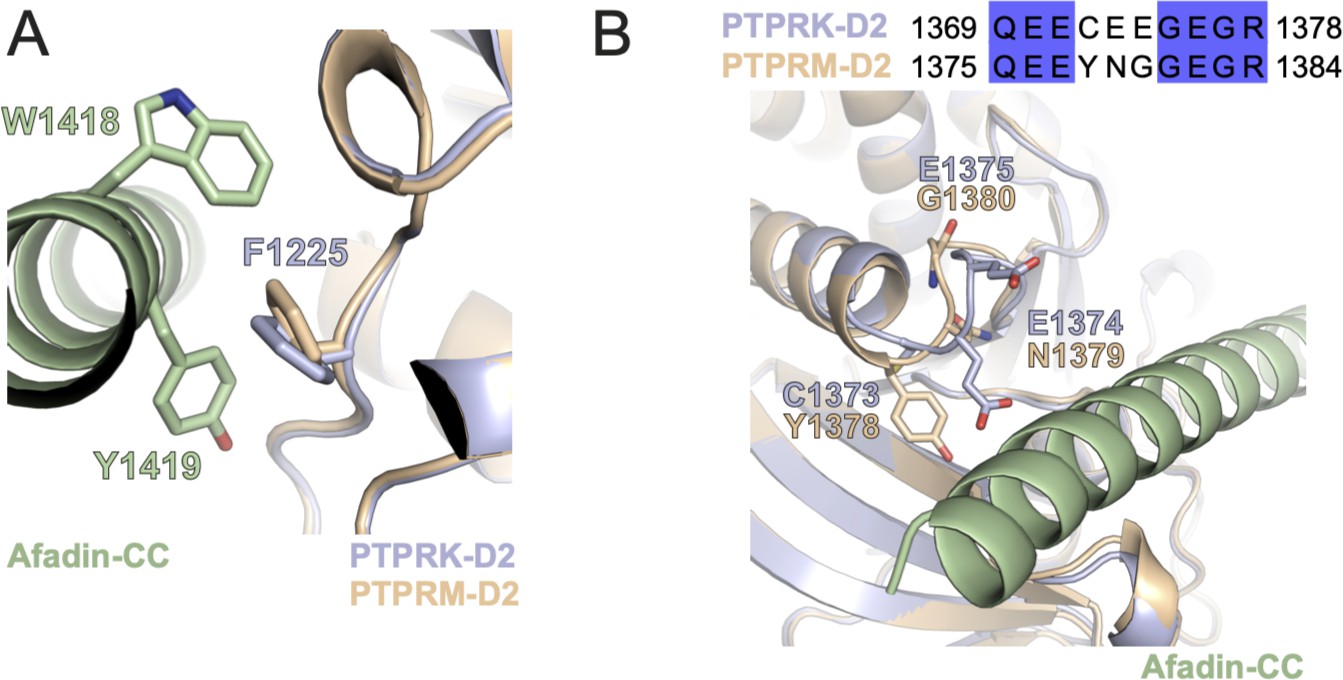
Localization of additional PTPRK D2 mutations.
(A) Ribbon diagram of PTPRK-D2 (blue) and PTPRM-D2 (wheat) in complex with Afadin-CC (green). PTPRK-F1225 stacks with hydrophobic W1418-Y1419 residues of Afadin-CC and this residue is conserved in PTPRM. (B) Sequence alignment of an acidic loop in PTPRK (aa. 1369–1378) with corresponding PTPRM sequence, colored by % identity. The M-loop mutant of PTPRK used in Figure 4H has been mutated to the PTPRM sequence indicated here. This acidic loop in both PTPRK (blue) and PTPRM (wheat) is located adjacent to the Afadin-CC (green) binding interface.
Figure 4—figure supplement 3
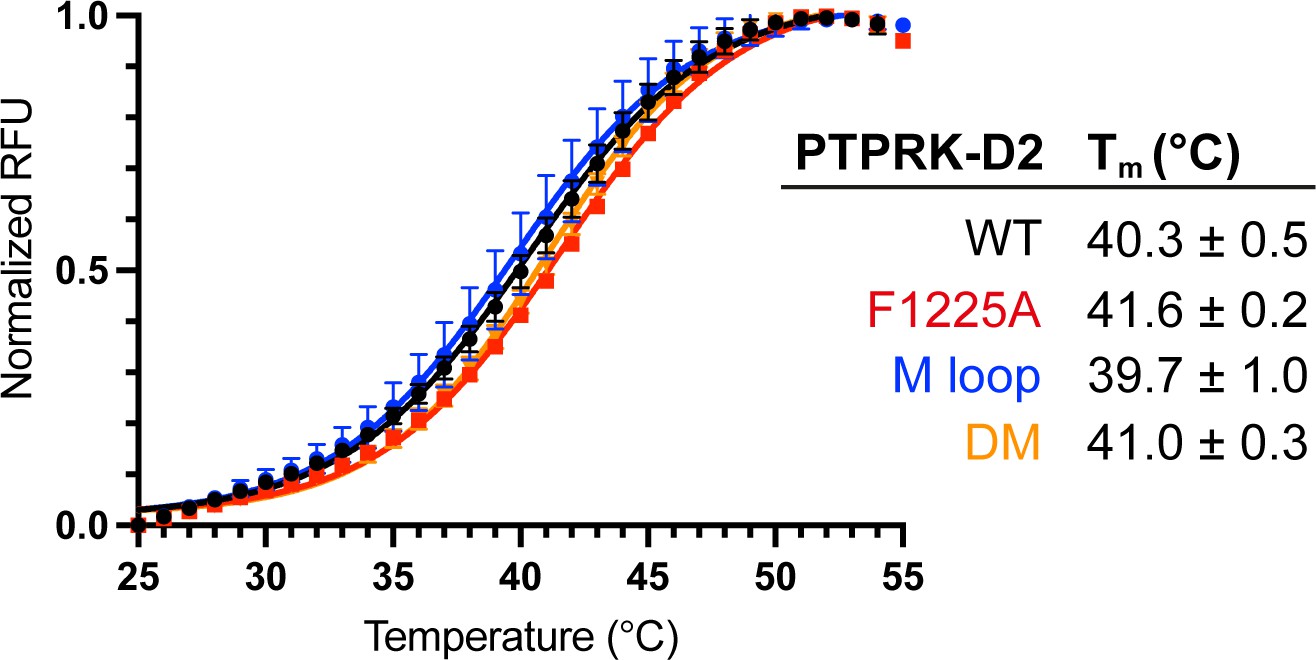
Thermal stability of PTPRK-D2 mutants.
Differential scanning fluorimetry of PTPRK-D2 WT (black), F1255A (red), M-loop (blue), and double mutant (DM, yellow) recombinant proteins. Curves and melting temperature (Tm) values shown represent the mean ± SD of n = 4 technical replicates.
Figure 4—figure supplement 4
Prediction quality of models prior to biochemical mapping.
(A) The 5 AF2-Multimer generated PTPRK-ICD:Afadin-CC models were superposed using the PTPRK-ICD chain only. The Afadin-CC chains of each ranked model are shown as cylinders (colored as indicated). (B) Plot of predicted local distance difference test (pLDDT) for the Afadin-CC chain of each ranked PTPRK-ICD:Afadin-CC model, colored as in (A). These scores are markedly lower than that for the model generated using the PTPRK-D2 (see Figure 3—figure supplement 2). (C–, D) Predicted aligned error (PAE) plot for highest (C, model 1) and lowest (D, model 5) ranked models for the PTPRK-D2:Afadin-CC complex. Both top- and bottom-ranked models generated using the PTPRK-ICD have worse PAE scores when compared to the PTPRK-D2 models (see Figure 3—figure supplement 2).
Figure 5 with 1 supplement

Mutation of residues at the interaction interface inhibit dephosphorylation of Afadin by PTPRK.
(A) Time course of pNPP dephosphorylation by WT (black) and double mutant (DM, red) PTPRK-ICD. Error bars represent ± SEM of n = 2 independent experiments. (B) Immunoblot analysis of pervanadate-treated MCF10A lysates incubated for 1.5 hr at 4°C with 0.3 µM of PTPRK-ICD WT or DM. (C) Immunoblot analysis of pervanadate-treated MCF10A lysates incubated for 1.5 hr at 4°C with 0.3 µM of PTPRK-ICD WT or DM followed by pTyr immunoprecipitation (IP). Dephosphorylated proteins are depleted from pTyr-IPs and/or enriched in supernatants (sup.). Gels and blots shown in this figure are representative of n ≥ 3 independent experiments.
-
Figure 5—source data 1
Uncropped, unedited blots for Figure 5B.
- https://cdn.elifesciences.org/articles/79855/elife-79855-fig5-data1-v2.zip
-
Figure 5—source data 2
Uncropped, unedited blots for Figure 5C.
- https://cdn.elifesciences.org/articles/79855/elife-79855-fig5-data2-v2.zip
Figure 5—figure supplement 1
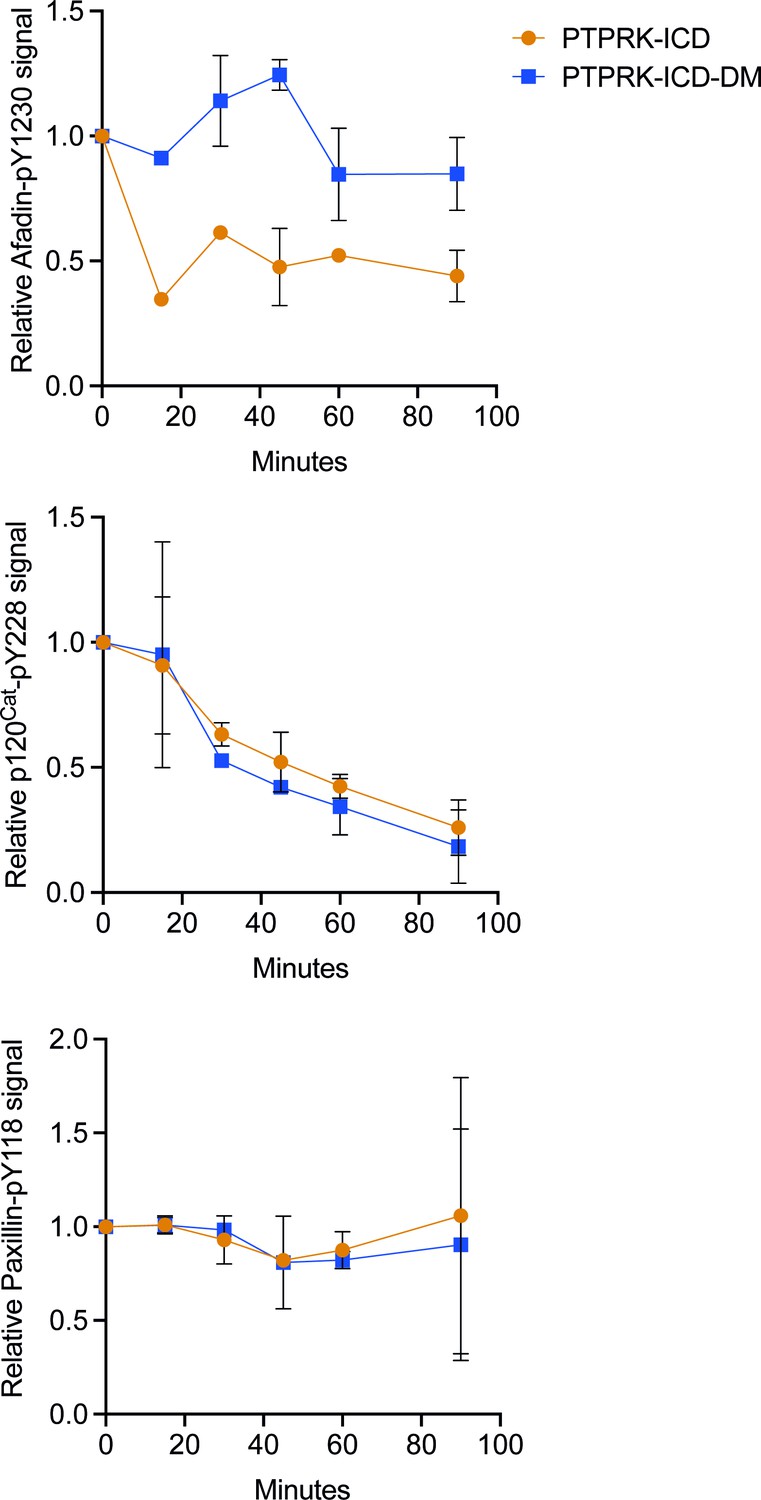
PTPRK-ICD-DM displays impaired dephosphorylation of Afadin-pY1230, but not p120Cat-pY228.
Densitometric quantification of immunoblots in Figure 5B (90 min time point shown) at indicated time points. Top: Afadin-pY1230 normalized against no protein control. Middle: p120Cat-pY228 normalized against no protein control. Bottom: paxillin-pY118 normalized against no protein control. Error bars represent mean ± SD, n = 2.
-
Figure 5—figure supplement 1—source data 1
Densitometric quantification of Figure 5—source data 1, shown in Figure 5—figure supplement 1.
- https://cdn.elifesciences.org/articles/79855/elife-79855-fig5-figsupp1-data1-v2.xlsx
Tables
Appendix 1—key resources table
| Reagent type (species) or resource | Designation | Source or reference | Identifiers | Additional information |
|---|---|---|---|---|
| Gene (human) | PTPRK | ENSEMBL: ENSG00000152894 | ||
| Gene (human) | AFDN | ENSEMBL: ENSG00000130396 | ||
| Cell line (human) | MCF10A | ATCC | CRL-10317 | |
| Cell line (human) | HEK293T | D. Ron | N/A | |
| Transfected construct (human) | MCF10A PTPRK KO pooled.tGFP | Fearnley et al., 2019 | N/A | Lentivirally transduced stable cell line |
| Transfected construct (human) | MCF10A PTPRK KO pooled.tGFP. P2A.PTPRK | Fearnley et al., 2019 | N/A | Lentivirally transduced stable cell line |
| Transfected construct (human) | MCF10A PTPRK KO pooled.tGFP.P2A. PTPRK.C1089S | Fearnley et al., 2019 | N/A | Lentivirally transduced stable cell line |
| Transfected construct (human) | MCF10A tGFP | Fearnley et al., 2019 | N/A | Lentivirally transduced stable cell line |
| Antibody | Anti-PTPRK (rabbit monoclonal) | Fearnley et al., 2019 | 2.H4 | Western blot: 1:1000 |
| Antibody | Anti-Afadin-pY1230 (sheep polyclonal) | This study | N/A | Characterized in Figure 1—figure supplement 2 Western blot: 1 µg/ml (with 10 µg/ml non-phosphopeptide) Available on request from Sharpe lab, Babraham Institute |
| Antibody | Anti-Afadin (mouse monoclonal) | BD Transduction Laboratories | Cat#610732 | Western blot: 1:1000 |
| Antibody | Anti-p120 catenin (mouse monoclonal) | BD Transduction Laboratories | Cat#610133 | Western blot: 1:1000 |
| Antibody | Anti-RFP (mouse monoclonal) | Thermo Fisher Scientific | Cat#MA5-15257 | Western blot: 1:1000 |
| Antibody | Anti-Turbo-GFP (mouse monoclonal) | OriGene | TA150041 | Western blot: 1:1000 |
| Antibody | Anti-Afadin (rabbit monoclonal) | Cell Signaling Technology | Cat#13531 | Western blot: 1:1000 |
| Antibody | Anti-His (mouse monoclonal) | Cell Signaling Technology | Cat#2366 | Western blot: 1:1000 |
| Antibody | Anti-phospho-tyrosine (P-Tyr-1000) (rabbit monoclonal) | Cell Signaling Technology | Cat#8954 | Western blot: 1:2000 |
| Antibody | Anti-paxillin (rabbit monoclonal) | Cell Signaling Technology | Cat#12065 (D9G12) | Western blot: 1:1000 |
| Antibody | Anti-phospho-p120 catenin (Y904) (rabbit polyclonal) | Cell Signaling Technology | Cat#2910 | Western blot: 1:1000 |
| Antibody | Anti-phospho-p120 catenin (Y228) (rabbit polyclonal) | Cell Signaling Technology | Cat#2911 | Western blot: 1:1000 |
| Antibody | Anti-phospho- paxillin (Y118) | Cell Signaling Technology | Cat#2541 | Western blot: 1:1000 |
| Antibody | Anti-Tubulin (alpha) (mouse monoclonal) | Sigma | Cat#T6199 | Western blot: 1:1000 |
| Antibody | HRP-conjugated- donkey anti-goat IgG | Jackson ImmunoResearch | Cat#705-035-147 | Western blot: 1:5000 |
| Antibody | HRP-conjugated- donkey anti-rabbit IgG | Jackson ImmunoResearch | Cat#711-035-152 | Western blot: 1:5000 |
| Antibody | HRP-conjugated- donkey anti-mouse IgG | Jackson ImmunoResearch | Cat#711-035-152 | Western blot: 1:5000 |
| Antibody | HRP-conjugated-mouse anti- rabbit IgG (conformation specific) | Cell Signaling Technology | Cat#5127S | Western blot: 1:2000 |
| Recombinant DNA reagent | pET15b | J. Deane | N/A | |
| Recombinant DNA reagent | pET15b.His.TEV.Avi | Fearnley et al., 2019 | N/A | |
| Recombinant DNA reagent | pET15b.His.TEV.Avi. PTPRK.ICD | Fearnley et al., 2019 | UniProt: Q15262-3 | |
| Recombinant DNA reagent | pET15b.His.TEV.Avi. PTPRK.ICD.D1057A | Fearnley et al., 2019 | UniProt: Q15262-3 | |
| Recombinant DNA reagent | pET15b.His.TEV.Avi. PTPRK.ICD.C1089S | Fearnley et al., 2019 | UniProt: Q15262-3 | |
| Recombinant DNA reagent | pET15b.His.TEV.Avi. PTPRK.D1 | Fearnley et al., 2019 | UniProt: Q15262-3 | |
| Recombinant DNA reagent | pET15b.His.TEV.Avi. PTPRK.D2 | Fearnley et al., 2019 | UniProt: Q15262-3 | |
| Recombinant DNA reagent | PET15b.His.TEV.Avi. PTPRK.D2.G1273H | This study | UniProt: Q15262-3 | Mutations: G1273H See Figure 4 |
| Recombinant DNA reagent | pET15b.His.TEV.Avi. PTPRK.D2.L1335R | This study | UniProt: Q15262-3 | Mutations: L1335R See Figure 4D |
| Recombinant DNA reagent | pET15b.His.TEV.Avi. PTPRK.ICD.DM | This study | UniProt: Q15262-3 | Mutations: G1273H L1335R See Figure 4E |
| Recombinant DNA reagent | pET15b.His.TEV.Avi. PTPRK.D2.DM | This study | UniProt: Q15262-3 | Mutations: G1273H L1335R See Figure 4E |
| Recombinant DNA reagent | pET15b.His.TEV.Avi. PTPRK.D2.F1225A | This study | UniProt: Q15262-3 | Mutation: F1225A See Figure 4H |
| Recombinant DNA reagent | pET15b.His.TEV.Avi. PTPRK.D2.M-loop | This study | UniProt: Q15262-3 | Mutations: C1372Y E1373N E1374G See Figure 4H |
| Recombinant DNA reagent | pGEX-6P-1 | J. Deane | N/A | |
| Recombinant DNA reagent | pGEX-6P-Afadin-1098-C* | This study | UniProt: P55196-4 | See Figure 1E |
| Recombinant DNA reagent | pGEX-6P-Afadin-1098-1507 | This study | UniProt: P55196-4 | See Figure 1E |
| Recombinant DNA reagent | pGEX-6P-Afadin-1098-1407 | This study | UniProt: P55196-4 | See Figure 1 |
| Recombinant DNA reagent | pGEX-6P-Afadin-1514-C* | This study | UniProt: P55196-4 | See Figure 1E |
| Recombinant DNA reagent | pGEX-6P-Afadin-1393-C* | This study | UniProt: P55196-4 | See Figure 1E |
| Recombinant DNA reagent | pGEX-6P-Afadin-1393-1507 | This study | UniProt: P55196-4 | See Figure 1E |
| Recombinant DNA reagent | pGEX-6P-Afadin-CC | This study | UniProt: P55196-4 | Encoding amino acids: 1393–1455 See Figure 1F |
| Recombinant DNA reagent | pGEX-6P-Afadin-CC-WY>AA | This study | UniProt: P55196-4 | Mutations: W1418A Y1419A See Figure 3D |
| Recombinant DNA reagent | pGEX-6P-Afadin-CC-ER>AA | This study | UniProt: P55196-4 | Mutations: E1429A R1430A See Figure 3D |
| Recombinant DNA reagent | pGEX-6P-Afadin-CC-RK>AA | This study | UniProt: P55196-4 | Mutations: R1432A K1433A See Figure 3D |
| Recombinant DNA reagent | pGEX-6P-Afadin-CC-Q>A | This study | UniProt: P55196-4 | Mutations: Q1443A See Figure 3D |
| Recombinant DNA reagent | pGEX-6P-Afadin-CC-T>A | This study | UniProt: P55196-4 | Mutations: T1446A See Figure 3D |
| Recombinant DNA reagent | pGEX-6P-Afadin-CC-QT>AA | This study | UniProt: P55196-4 | Mutations: Q1443A T1446A See Figure 3D |
| Recombinant DNA reagent | pmScarlet-C1 | Z. Kadlecova | N/A | |
| Recombinant DNA reagent | pmScarlet-Afadin | This study | UniProt: P55196-4 | See Figure 1—figure supplement 2D |
| Recombinant DNA reagent | pmScarlet-Afadin-Y1226F | This study | UniProt: P55196-4 | Mutation: Y1226F See Figure 1—figure supplement 2D |
| Recombinant DNA reagent | pmScarlet-Afadin-Y1230F | This study | UniProt: P55196-4 | Mutation: Y1230F See Figure 1—figure supplement 2D |
| Recombinant DNA reagent | pmScarlet-Afadin-YF YF | This study | UniProt: P55196-4 | Mutations: Y1226F Y1230F See Figure 1—figure supplement 2D |
| Sequence-based reagent | ON-TARGETplus Human AFDN siRNA: | Dharmacon, GE Healthcare | L-020075-02-0005 | |
| Sequence-based reagent | ON-TARGETplus Non-targeting pool siRNA: | Dharmacon, GE Healthcare | Cat#D-001810-10-05 | |
| Peptide, recombinant protein | Catalase | Sigma | Cat#C134514 | |
| Peptide, recombinant protein | Cholera toxin | Sigma | Cat#C-8052 | |
| Peptide, recombinant protein | Insulin | Sigma | Cat#I-1882 | |
| Peptide, recombinant protein | Epidermal growth factor | PeproTech | Cat#AF-100-15-1MG | |
| Commercial assay or kit | Q5 High-Fidelity DNA Polymerase | New England Biolabs | Cat#M0491S | |
| Commercial assay or kit | Phusion Hot Start II DNA polymerase | Thermo Fisher Scientific | Cat#F549L | |
| Commercial assay or kit | EZ-ECL substrate | Geneflow | Cat#K1-0170 | |
| Commercial assay or kit | InstantBlue | Expedeon | Cat#ISB1L | |
| Commercial assay or kit | Phosphatase inhibitor cocktail | Roche | Cat#04906845001 | |
| Commercial assay or kit | TaqMan Universal Master Mix II | Applied Biosystems | Cat#4440040 | |
| Chemical compound, drug | Hydrogen peroxide | Thermo Fisher Scientific | Cat#H/1750/15 | |
| Chemical compound, drug | Sodium orthovanadate | Alfa Aesar | Cat#J60191 | |
| Chemical compound, drug | 250 kDa-FITC-dextran | Sigma | Cat#FD250S-100MG | |
| Chemical compound, drug | Para-Nitrophenol- phosphate (pNPP) | New England Biolabs | Cat#P0757 | |
| Chemical compound, drug | IPTG | Generon | Cat#GEN-S-02122 | |
| Chemical compound, drug | D-biotin | Sigma | Cat#B4639 | |
| Chemical compound, drug | l-Glutamine | Sigma | Cat#G7513 | |
| Chemical compound, drug | Hydrocortisone | Sigma | Cat#H-0888 | |
| Chemical compound, drug | NH4OH | Acros Organics | Cat#460801000 | |
| Chemical compound, drug | Methanol-free 16% (w/v) paraformaldehyde (PFA) | Thermo Fisher Scientific | Cat#28906 | |
| Software, algorithm | FIJI/ImageJ | Laboratory for Optical and Computational Instrumentation | University of Wisconsin-Madison | |
| Software, algorithm | GraphPad | Prism | ||
| Software, algorithm | Chimera | UCSF | ||
| Strain, strain background (Escherichia coli) | STABLE competent E. coli | NEB | Cat#C3040I | |
| Strain, strain background (E. coli) | DH5alpha competent E. coli | Invitrogen | Cat#18265017 | |
| Strain, strain background (E. coli) | BL21 DE3 Rosetta E. coli | J. Deane | N/A | |
| Other | DMEM | Thermo Fisher Scientific | Cat#41965-039 | Component of cell culture media |
| Other | Ham's F-12 | Sigma | Cat#N4888 | Component of cell culture media |
| Other | Horse serum | Thermo Fisher Scientific | Cat#16050-122 | Component of cell culture media |
| Other | HRP-conjugated streptavidin | Thermo Fisher Scientific | Cat#434323 | For detection of biotinylated proteins |
| Other | Fetal bovine serum | Sigma | Cat#F7524-500ml | Component of cell culture media |
| Other | Trypsin-EDTA solution | Sigma | Cat#T3924 | Reagent used to lift cells from culture vessel |
| Other | GeneJuice | Merck Millipore | Cat#70967-3 | Transfection reagent |
| Other | EDTA-free protease inhibitors | Roche | Cat#11836170001 | Component of cell lysis buffer |
| Other | Lipofectamine RNAiMAX | Invitrogen | Cat#13778075 | Transfection reagent |
| Other | OptiMEM | Thermo Fisher Scientific | Cat#31985070 | Component of cell culture media |
| Other | Protein G agarose beads | Merck Millipore | Cat#16-266 | Affinity reagent for immunoprecipitations |
| Other | Ni-NTA agarose | QIAGEN | Cat#1018244 | Affinity reagent for His-tag purification |
| Other | Streptavidin-coated magnetic beads | New England Biolabs | Cat#S1420S | Affinity reagent for Avi-tag pull-downs |
| Other | Streptavidin agarose | Thermo Fisher Scientific | Cat#20357 | Affinity reagent for Avi-tag pull-downs |
| Other | Superdex 200 16/600 column | GE Healthcare | Cat#28-9893-35 | Chromatography column |
| Other | Superdex 75 16/600 column | GE Healthcare | Cat#28-9893-33 | Chromatography column |
| Other | Ultracel-3K regenerated cellulose centrifugal filter | Merck Millipore | Cat#UFC900324 | Chromatography column |
| Other | Ultracel-10K regenerated cellulose centrifugal filter | Merck Millipore | Cat#UFC901024 | Used for protein concentration |
| Other | Ultracel-30K regenerated cellulose centrifugal filter | Merck Millipore | Cat#UFC903024 | Used for protein concentration |
| Other | NuPAGE 4–12% Bis-Tris gel | Thermo Fisher Scientific | Cat#NP0321BOX | SDS PAGE electrophoresis gel |
| Other | Slide-A-Lyzer 20K MWCO | Thermo Fisher Scientific | Cat#66003 | Dialysis cassette |
| Other | SYPRO Orange dye | Thermo Fisher Scientific | Cat#S6650 | Used for thermal shift assays |
| Other | MycoAlert PLUS Mycoplasma Detection Kit | Lonza | #LT07-705 | Used for testing cell lines |
| Other | MycoProbe Mycoplasma Detection Kit | R&D Systems | #CUL001B | Used for testing cell lines |
Additional files
Download links
A two-part list of links to download the article, or parts of the article, in various formats.
Downloads (link to download the article as PDF)
Open citations (links to open the citations from this article in various online reference manager services)
Cite this article (links to download the citations from this article in formats compatible with various reference manager tools)
Molecular mechanism of Afadin substrate recruitment to the receptor phosphatase PTPRK via its pseudophosphatase domain
eLife 11:e79855.
https://doi.org/10.7554/eLife.79855


