Dendritic cell Piezo1 directs the differentiation of TH1 and Treg cells in cancer
- Key Laboratory of Cell Proliferation and Regulation Biology, Ministry of Education, College of Life Sciences, Beijing Normal University, China
- Department of Immunology, School of Basic Medical Sciences, Fudan University, China
- State Key Laboratory of Pathogen and Biosecurity, Beijing Institute of Microbiology and Epidemiology, China
Figures
Figure 1 with 5 supplements
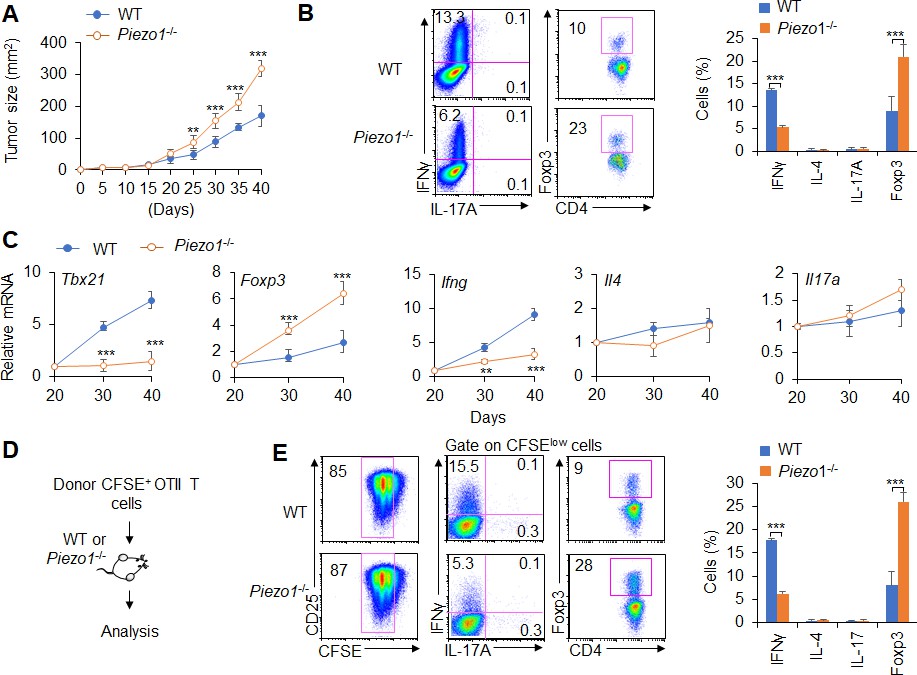
Dendritic cell (DC)-specific Piezo1 regulates T cell differentiation in cancer.
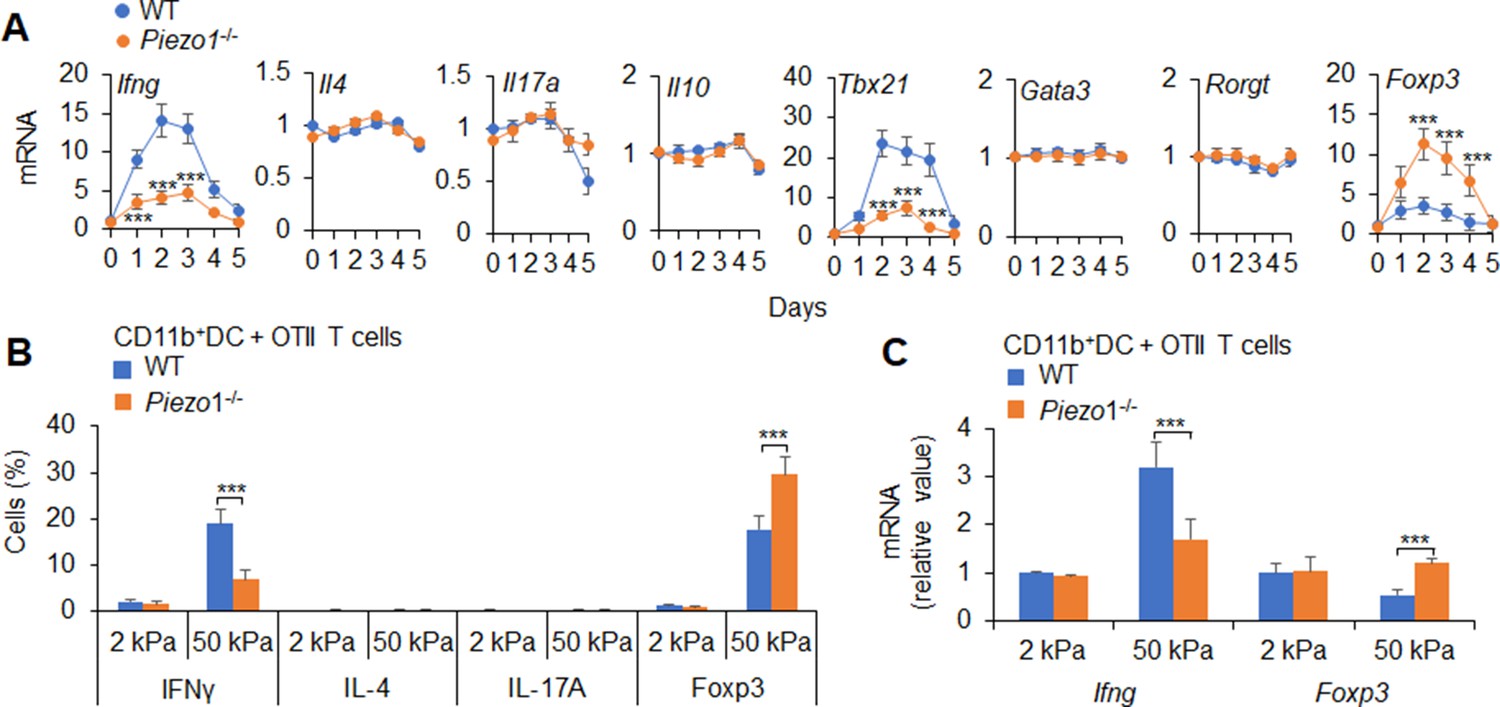
(A) MC38 tumor cells were implanted subcutaneously in WT and Piezo1-/- mice (n=10) and tumor size was measured every 5 days for 40 days. (B) Intracellular staining of IFNγ, IL-4, IL-17A, and Foxp3 expression by CD4+ T cells sorting from the tumor of WT and Piezo1-/- tumor-bearing mice at day 40. (C) mRNA expression of the indicated genes by CD4+ T cells isolated from the draining lymph nodes (dLNs) of tumor from WT and Piezo1-/- tumor-bearing mice on the indicated days (the levels in WT mice at day 20 were set to 1). (D) MC38 OVA tumor cells were implanted subcutaneously in WT and Piezo1-/- mice (n=10) and at day 20, the CD45.1+ donor CFSE+OTII CD4+T cells were transferred into WT and Piezo1-/- tumor-bearing mice for 10 days. The CD45.1+ CFSE+ donor T cells from tumors were analyzed and the intracellular staining of IFNγ, IL-4, IL-17A, and Foxp3 expression among CFSElow donor T cells. The data are representative of three to four independent experiments (mean ± s.d.; n=4). **p<0.01 and ***p<0.001, compared with the indicated groups.
-
Figure 1—source data 1
Tumor size in WT and Piezo1-/- tumor-bearing mice.
- https://cdn.elifesciences.org/articles/79957/elife-79957-fig1-data1-v2.xlsx
Figure 1—figure supplement 1

Piezo1 expressions of dendritic cells (DCs) following innate stimuli.
Il12b and Tgfb1 mRNA (A and C) and Piezo1 mRNA (B) expression of splenic DCs from C57BL/6 or/and Piezo1-/- mice with the indicated treatment (lipopolysaccharide [LPS], 10 ng/ml or conditioned with 2 or 50 kPa hydrogels plate). Levels in the vehicle group were set to 1. Data are representative of three to four independent experiments (mean ± s.d.; n=3–4). ***p<0.001, compared with the indicated groups.
Figure 1—figure supplement 2
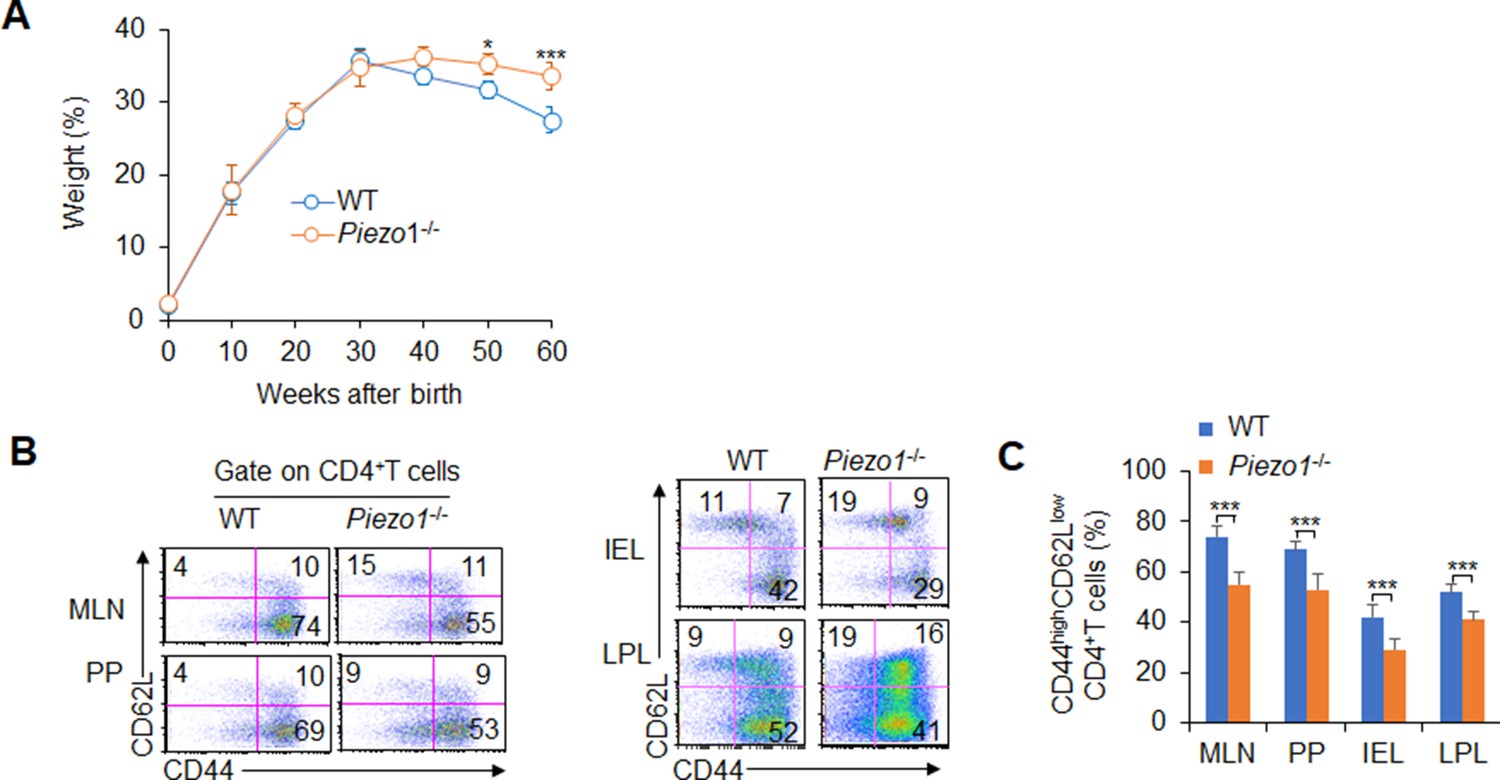
Dendritic cell (DC)-specific Piezo1 deficiency reduced T cell activities in aged mice.
(A) Body weights of WT and Piezo1-/- mice are shown (n=20). (B–C) Piezo1 deficiency in DCs resulted in less CD44highCD62Low cells in the CD4+ T cell population than WT DCs. A typical figure shown in B and data summarized in C. The data are representative of three independent experiments (mean ± s.d.; n=4–20). *p<0.05 and ***p<0.001, compared with the indicated groups.
Figure 1—figure supplement 3
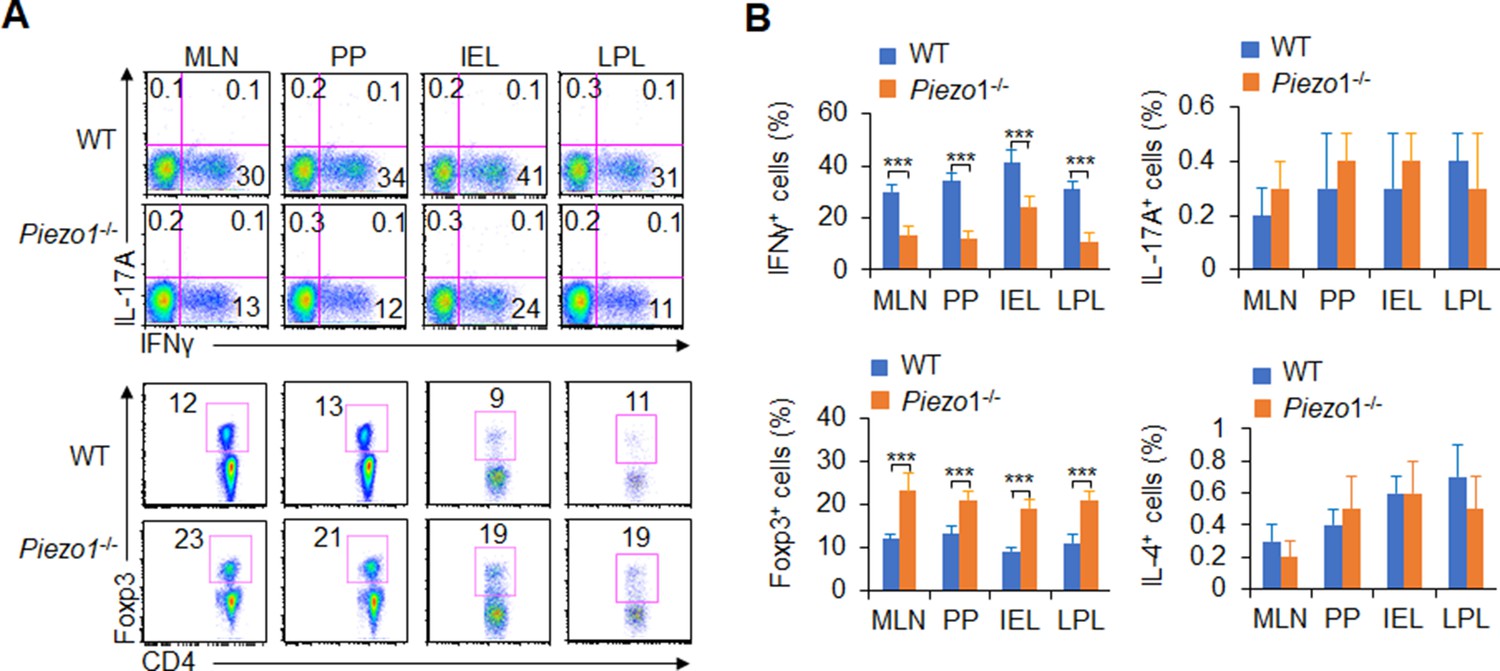
Dendritic cell (DC)-specific Piezo1 deficiency alters T cell differentiation in the aged mice.
Intracellular IFNγ, IL-4, IL-17A, and Foxp3 expression by CD4+ T cells from the mesenteric lymph node (MLN), Peyer’s patche (PP), intraepithelial lymphocyte (IEL), and lamina propria lymphocyte (LPL) in WT and Piezo1-/- mice. A representative figure shown (A), and the percentage of positive cells summarized (B). The data are representative of three independent experiments (mean ± s.d.; n=4–5). ***p<0.001, compared with the indicated groups.
Figure 1—figure supplement 4

Dendritic cell (DC)-specific Piezo1 regulates T cell differentiation in cancer.
MC38 tumor cells were implanted subcutaneously in WT and Piezo1-/- mice (n=10). (A) CD8+T cell number in tumor of WT and Piezo1-/- tumor-bearing mice at day 40. (B) Intracellular staining of IFNγ expression of CD8+ T cells from the tumor of WT and Piezo1-/- tumor-bearing mice at day 40. The representative data from flow cytometry analysis shown (left), and statistical results summarized (right). (C) mRNA expression of the indicated genes by CD4+ T cells isolated from the draining lymph nodes (dLNs) of tumor from WT and Piezo1-/- tumor-bearing mice on the indicated days (the levels in WT mice at day 20 were set to 1). The data are representative of three independent experiments (mean ± s.d.; n=4). n.s., not significant.
Figure 1—figure supplement 5
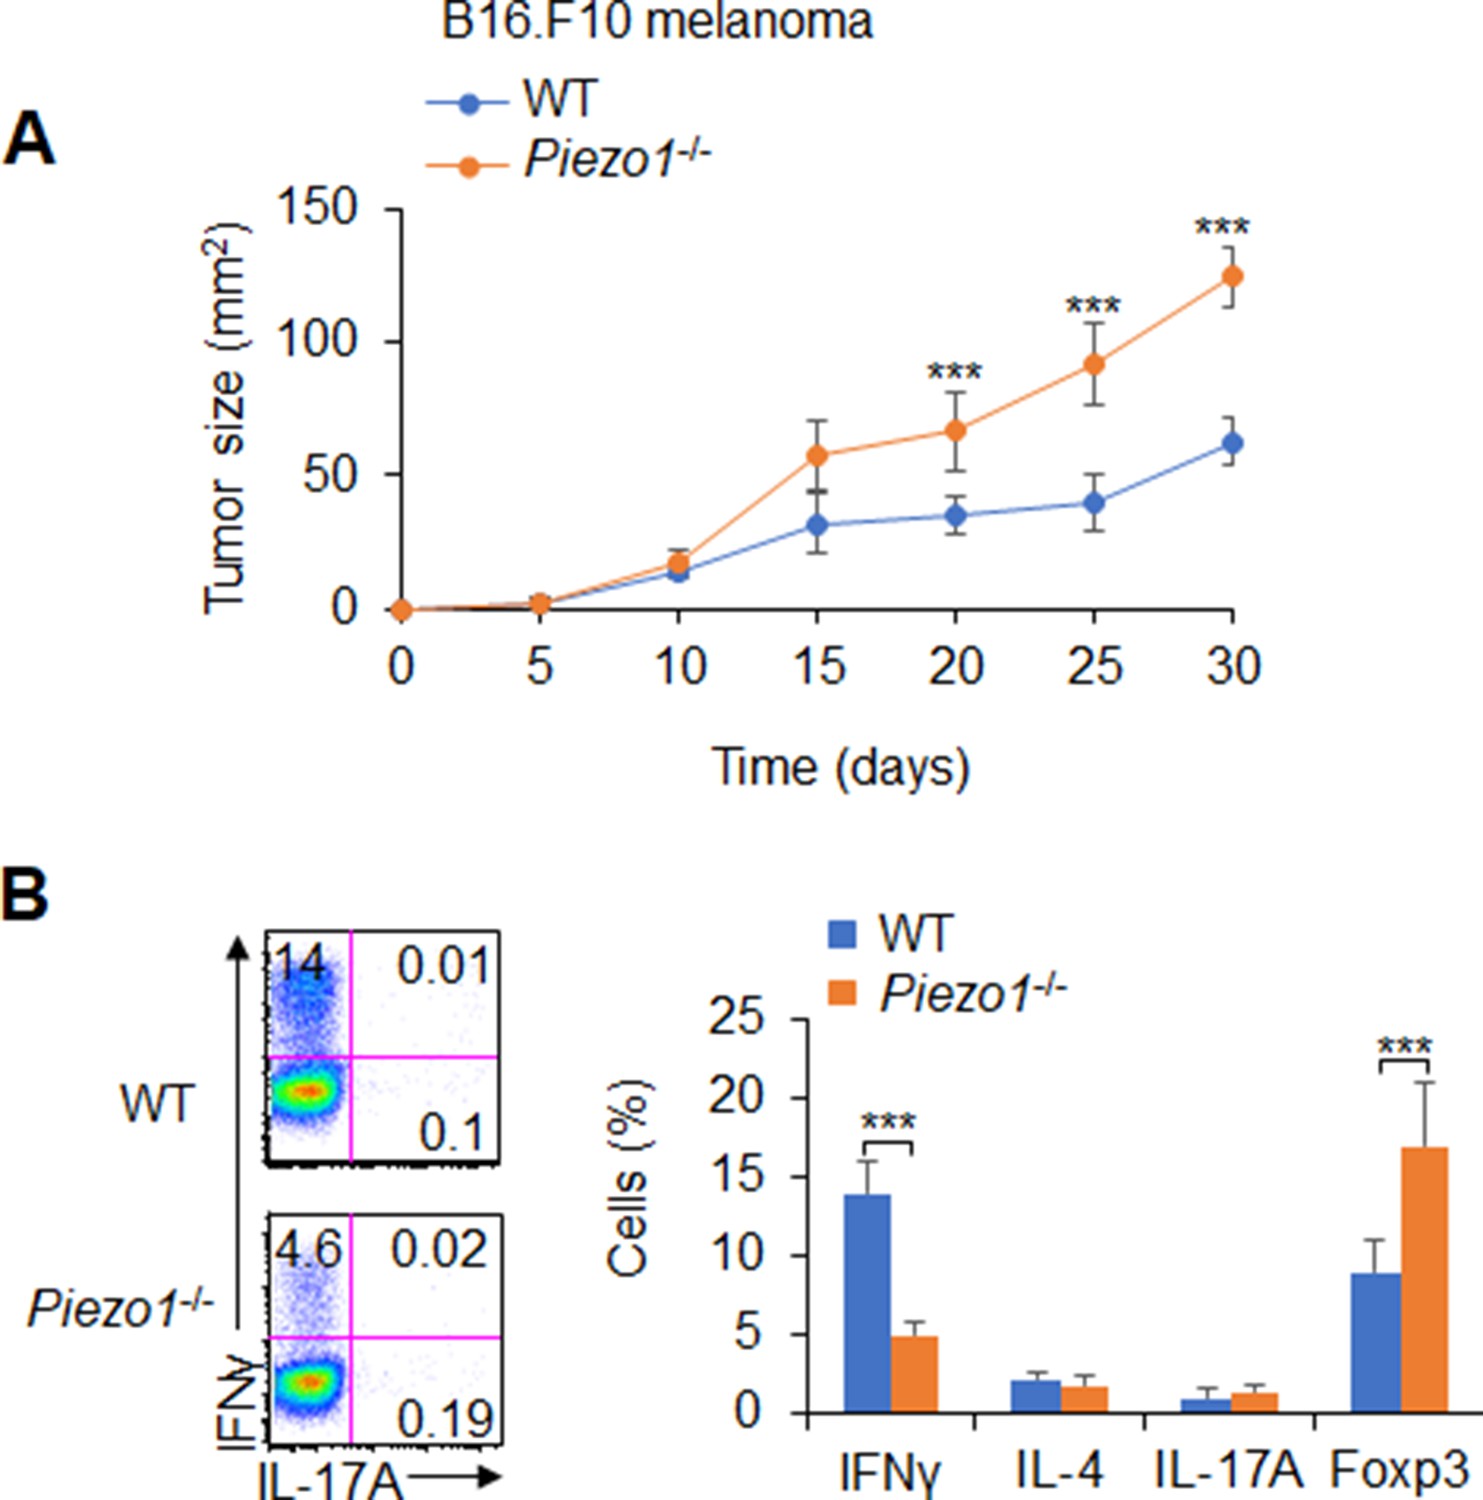
Dendritic cell (DC)-specific Piezo1 regulates T cell differentiation in cancer.
(A) B16.F10 tumor cells were implanted subcutaneously in WT and Piezo1-/- mice (n=10) and tumor size was measured every 5 days for 30 days. (B) Intracellular staining of IFNγ, IL-4, IL-17A, and Foxp3 expression of CD4+ T cells sorted from the tumor of WT and Piezo1-/- tumor-bearing mice at day 30. The representative data from flow cytometry analysis shown (left), and statistical results summarized (right). The data are representative of three to four independent experiments (mean ± s.d.; n=4). ***p<0.001, compared with the indicated groups.
Figure 2
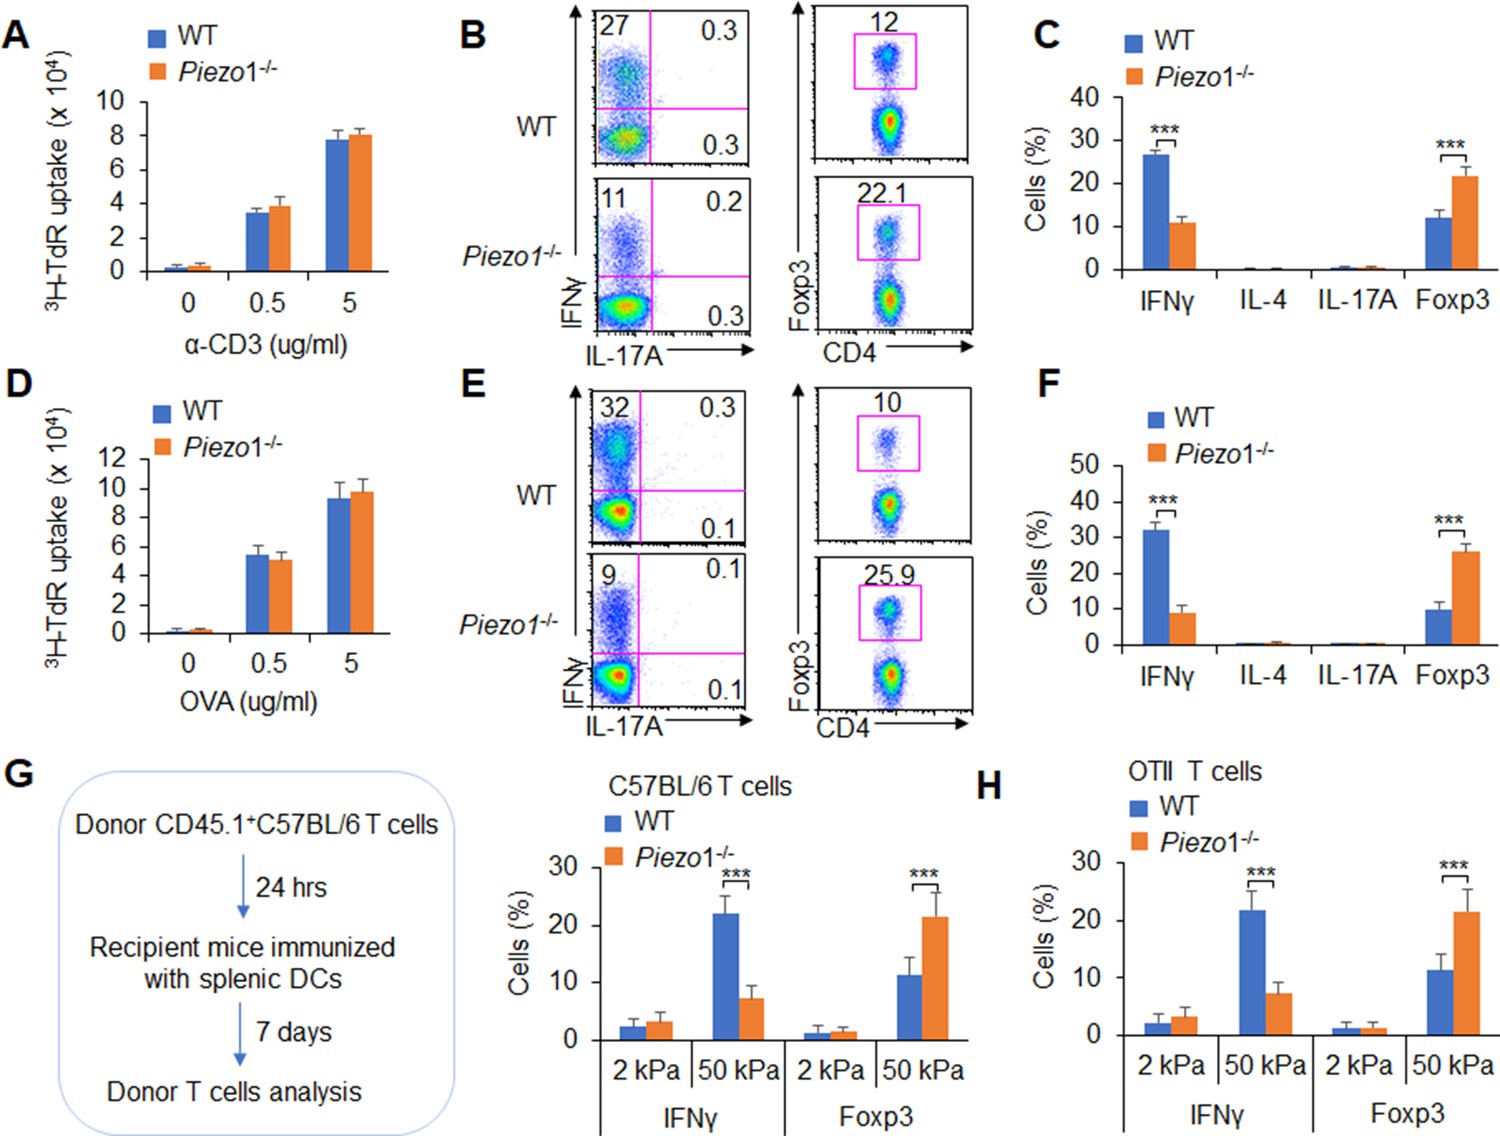
Dendritic cell (DC)-specific Piezo1 expression directs the differentiation of TH1 and Treg cells in vivo.
(A–C) Naïve CD45.2+ T cells were transferred into CD45.1+ C57BL/6 WT mice, and the mice were immunized with WT and Piezo1-/- splenic DCs and lipopolysaccharide (LPS). DLN cells were analyzed at day 7 after immunization. (A) Donor CD45.2+ T cell proliferation after stimulation with anti-CD3 (2 µg/ml) and anti-CD28 (2 μg/ml) antibodies. (B–C) Intracellular staining of IFNγ, IL-4, IL-17A, and Foxp3 expression in donor-derived (CD45.2+) CD4+ T cells after PMA and ionomycin stimulation. A representative figure shown in B, and the data summarized in C. (D–F) Naïve OTII T cells were transferred into CD45.1+ C57BL/6 WT mice, and the mice were immunized with WT and Piezo1-/- splenic DCs and OVA+CFA. DLN cells were analyzed at day 7 after immunization. (D) Donor CD45.2+ T cell proliferation after stimulation with OVA. (E–F) Intracellular staining of IFNγ, IL-4, IL-17A, and Foxp3 in donor-derived (CD45.2+) CD4+ T cells after OVA stimulation. A representative figure shown in E, and the data summarized in F. (G–H) Splenic DCs isolated from WT and Piezo1-/- mice were plated on 2 and 50 kPa hydrogels and incubated for 24 hr. (G) Naïve T cells were transferred into CD45.1+ C57BL/6 WT mice, and the mice were immunized with 2 and 50 kPa hydrogel-conditioned DCs. DLN cells were analyzed at day 7 after immunization. Intracellular staining of IFNγ, IL-4, and IL-17A in donor-derived (CD45.2+) CD4+ T cells after PMA and ionomycin stimulationand data summarized. (H) Naïve OTII T cells were transferred into CD45.1+ C57BL/6 WT mice, and the mice were immunized with 2 or 50 kPa hydrogel-conditioned DCs and OVA+CFA. DLN cells were analyzed at day 7 after immunization. Intracellular staining of IFNγ, IL-4, and IL-17A in donor-derived (CD45.2+) CD4+ T cells after OVA stimulation and data summarized. The data are representative of three to four independent experiments (mean ± s.d.; n=3–4). ***p<0.001, compared with the indicated groups.
Figure 3 with 4 supplements
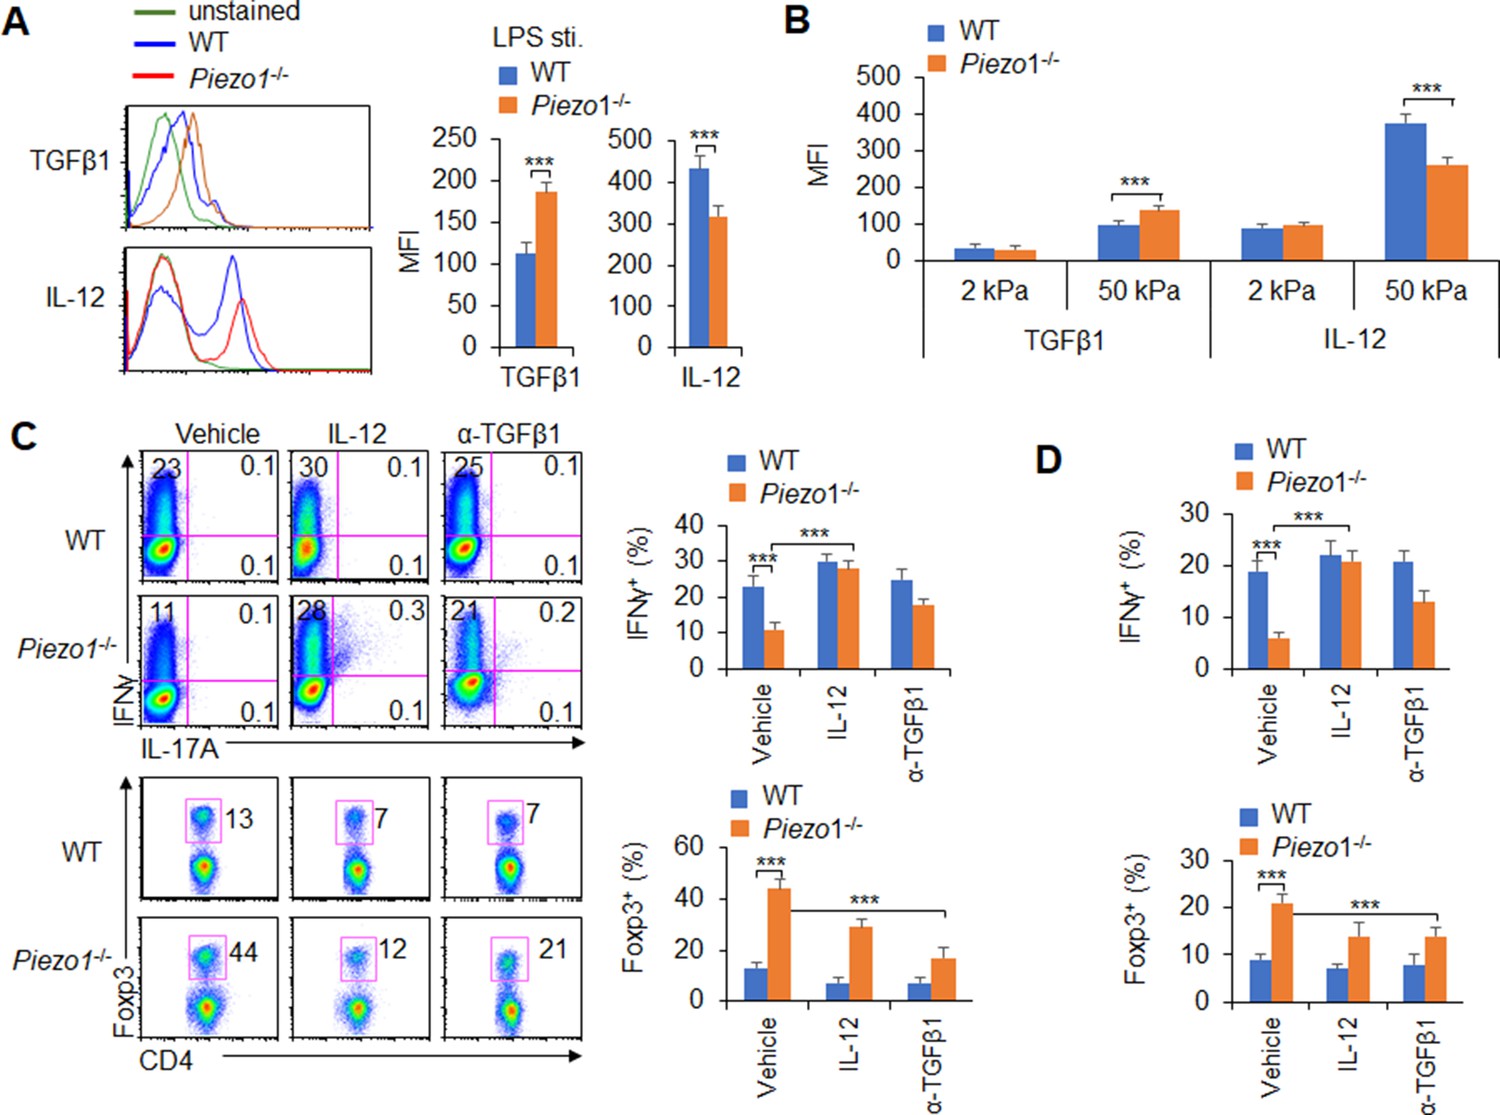
Piezo1 regulates IL-12 and TGFβ1 production by dendritic cells (DCs) to direct TH1 and Treg cell differentiation.
(A–B) Intracellular staining of IL-12p40 and TGFβ1 expression in WT and Piezo1-/- splenic DCs after 5 hr of treatment with lipopolysaccharide (LPS) (A; 10 ng/ml) or culture on 2 and 50 kPa hydrogels (B). A representative figure shown on the left, and the data summarized on the right. (C) Intracellular staining of IFNγ and Foxp3 in T cells cocultured with WT and Piezo1-/- splenic DCs in the presence of the indicated treatments (IL-12, Peprotech, 10 μg/ml or anti-TGFβ1, R&D Systems, 20 μg/ml) for 5 days. A representative figure shown on the left, and the data summarized on the right. (D) Intracellular staining of IFNγ (upper panel) and Foxp3 (lower panel) in T cells cocultured with WT and Piezo1∆DC splenic DCs conditioned with 50 kPa hydrogel and the indicated treatments for 5 days and data summarized. The data are representative of three independent experiments (mean ± s.d.; n=3–5). ***p<0.001, compared with the indicated groups.
Figure 3—figure supplement 1
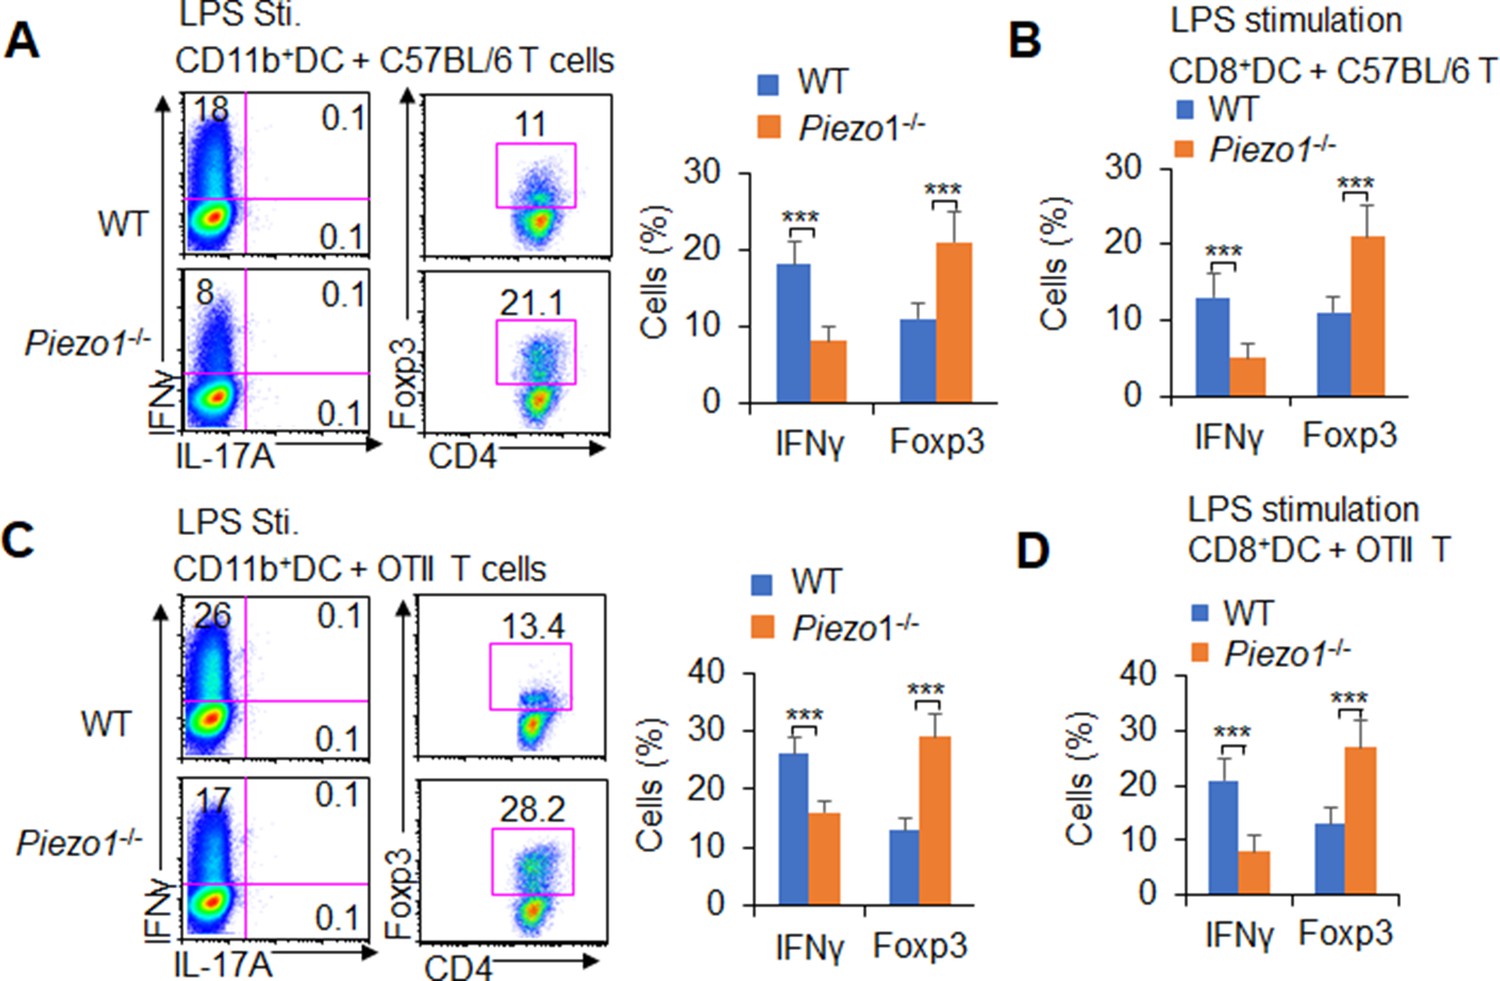
Dendritic cell (DC)-specific Piezo1 expression directs TH1 and Treg differentiation in vitro.
(A–B) C57BL/6 naïve CD4+ T cells were cocultured with lipopolysaccharide (LPS)-pulsed splenic CD11b+ DCs (A) or CD8+ DCs (B) from WT and Piezo1-/- mice for 5 days. Intracellular staining of IFNγ and Foxp3 in T cells. A representative figure shown on the left, and the data summarized on the right. (C–D) Naïve CD4+ T cells from OTII mice were cocultured with LPS-pulsed splenic CD11b+ DCs (C) or CD8+ DCs (D) from WT and Piezo1-/- mice for 5 days. Intracellular staining of IFNγ and Foxp3 in T cells. A representative figure shown on the left, and the data summarized on the right. The data are representative of three independent experiments (mean ± s.d.; n=3–6). ***p<0.001, compared with the indicated groups.
Figure 3—figure supplement 2
Dendritic cell (DC)-specific Piezo1 expression directs TH1 and Treg differentiation in vitro.
(A) Naïve T cells from C57BL/6 mice were cocultured with splenic DCs from WT and Piezo1-/- mice for 5 days in the presence of anti-CD3 (2 ng/ml) and lipopolysaccharide (LPS) (10 ng/ml). The relative mRNA expression of the indicated genes in T cells was determined with qPCR. The levels in the WT group and on day 0 were set to 1. (B) splenic CD11b+ DCs isolated from WT and Piezo1-/- mice were plated on 2 and 50 kPa hydrogels (1×10⁵ cells/well) for 24 hs. Naïve CD4+ T cells from OTII mice were cocultured with 2 and 50 kPa hydrogel-conditioned DCs in the presence of OVA (5 μg/ml) for 5 days. Intracellular staining of IFNγ, IL-4, IL-17A, and Foxp3 in T cells. (C) Naïve T cells from OTII mice were cocultured with 2 and 50 kPa hydrogel-conditioned splenic CD11b+ DCs in the presence of OVA (5 μg/ml) for 5 days. The relative mRNA expression of the indicated genes in T cells was determined with qPCR. The levels in the WT group with 2 kPa were set to 1. The data are representative of three independent experiments (mean ± s.d.; n=4–6). ***p<0.001, compared with the indicated groups.
Figure 3—figure supplement 3
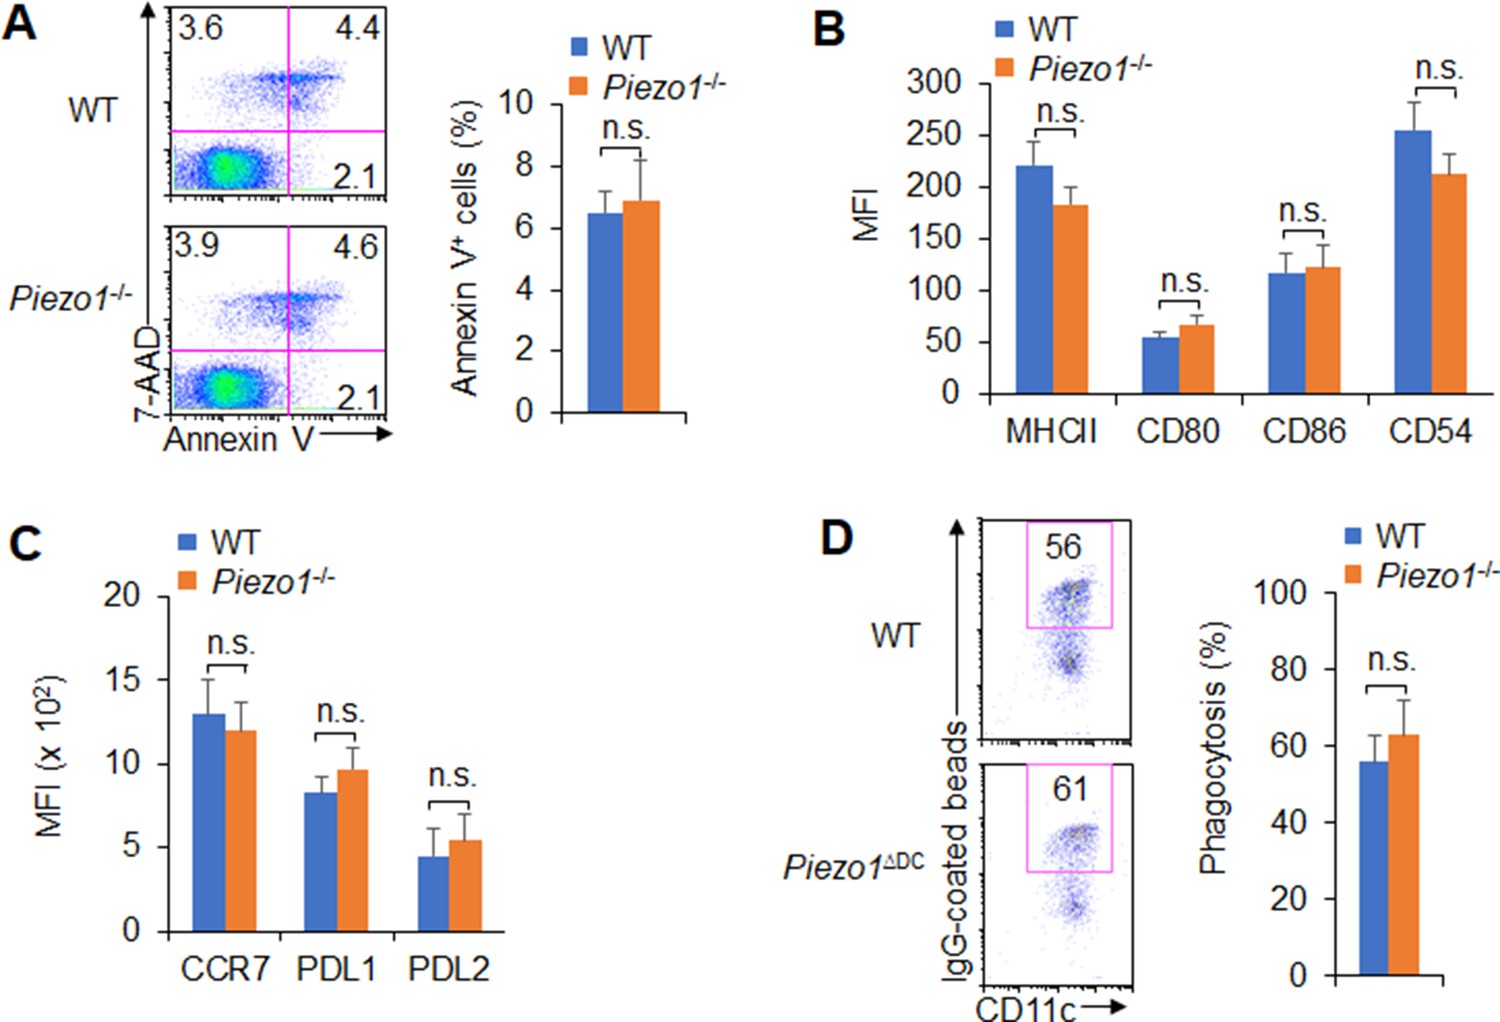
Piezo1 regulates dendritic cell (DC) homeostasis and function.
(A) 7-AAD and Annexin V staining in WT and Piezo1-/- splenic DCs. The representative data from flow cytometry analysis shown (left), and data summarized (right). (B–C) Expression of indicated molecules in WT and Piezo1-/- splenic DCs in the presence of lipopolysaccharide (LPS) (10 ng/ml) from flow cytometry analysis. (D) Phagocytosis of WT and Piezo1-/- splenic DCs to IgG-coated beads in the presence of LPS (10 ng/ml). The representative data from flow cytometry shown (left), and data summarized (right). Data are representative of three independent experiments (mean ± s.d.; n=3). n.s., not significant.
Figure 3—figure supplement 4
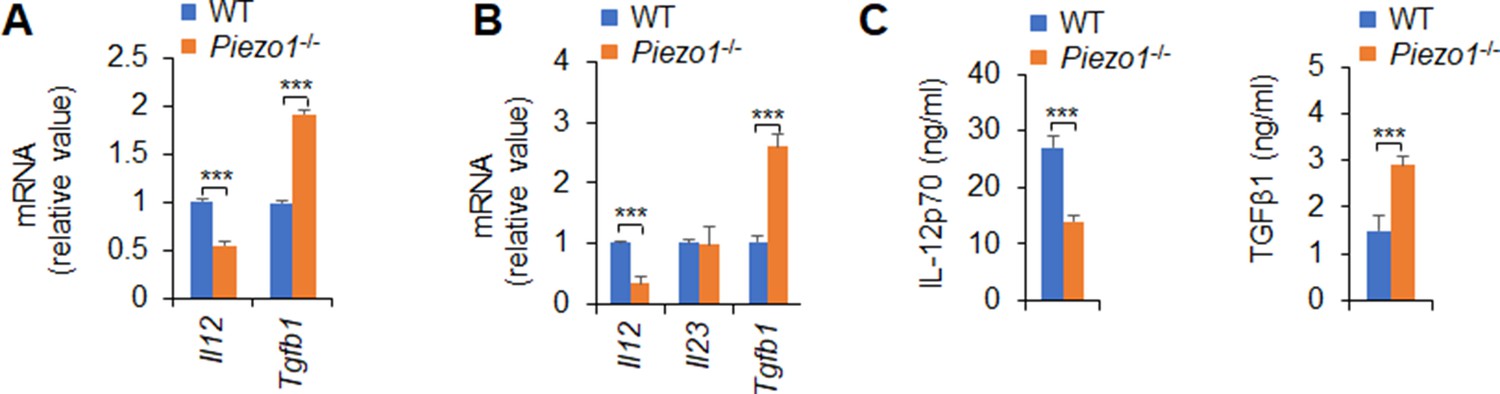
Piezo1 regulates dendritic cell (DC) cytokine production.
(A) mRNA expressions of Il12 (p70) and Tgfb1 expression in WT and Piezo1-/- mesenteric lymph node (MLN) DCs. (B) mRNA expressions of Il12 (p70), Il23, and Tgfb1 expression in WT and Piezo1-/- splenic DCs treated with lipopolysaccharide (LPS) (10 ng/ml) for 5 hr. (C) Production of IL-12p70 (left panel) and TGFβ1 (right panel) in culture supernatant in WT and Piezo1-/- splenic DCs treated with LPS (10 ng/ml) for 5 hr. The data are representative of three independent experiments (mean ± s.d.; n=3). ***p<0.001, compared with the indicated groups.
Figure 4 with 2 supplements
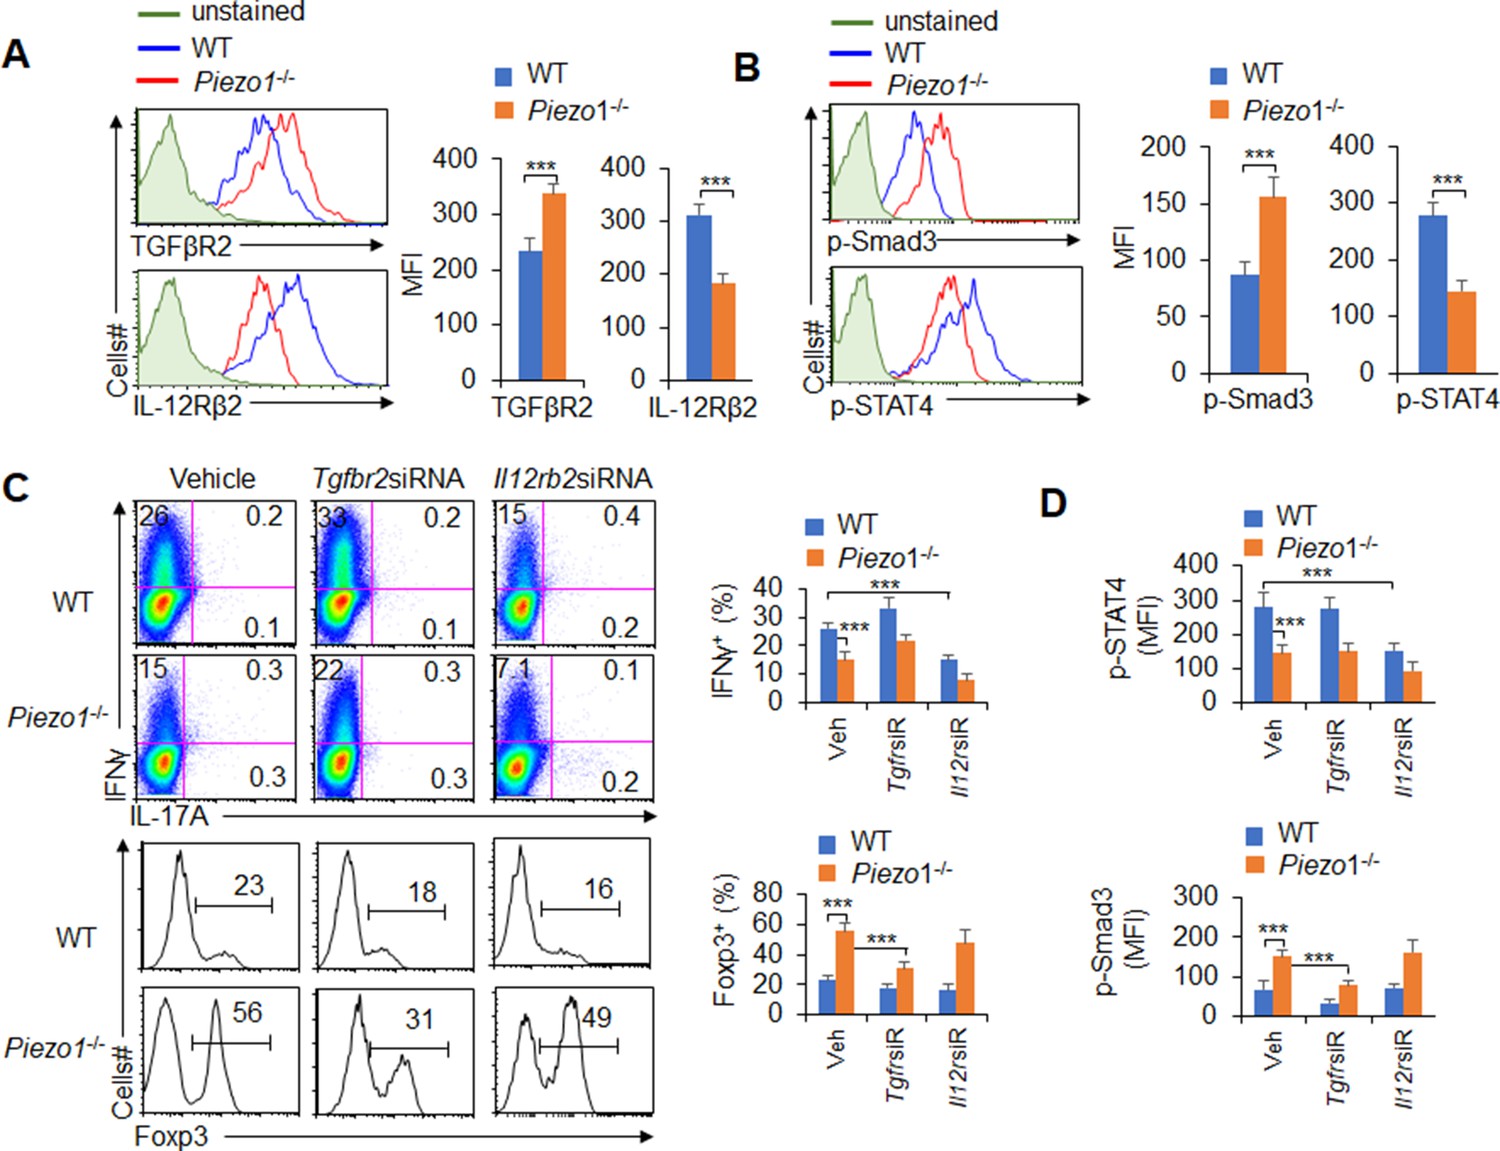
TGFβR2-pSmad3 and IL-12Rβ2-pSTAT4 are required for the T cell differentiation induced by dendritic cell (DC)-specific Piezo1 expression.
(A) Expression of TGFβR2 and IL-12Rβ2 in T cells cocultured with WT or Piezo1-/- splenic DCs for 5 days. A representative figure shown on the left, and the data summarized on the right. (B) Intracellular staining of p-Smad3 and p-STAT4 in T cells cocultured with WT or Piezo1-/- splenic DCs for 5 days. A representative figure shown on the left, and the data summarized on the right. (C–D) Sorted naïve T cells were transfected with control, Tgfbr2 short hairpin RNA (shRNA) vector, or Il12rb2 shRNA vector and cocultured with WT or Piezo1-/- DCs for 5 days. Intracellular staining of IFNγ (C; upper panel) and Foxp3 (C; lower panel) in T cells. A representative figure shown on the left, and the data summarized on the right. (D) Intracellular staining of p-Smad3 and p-STAT4 in T cells and data summarized. The data are representative of three independent experiments (mean ± s.d.; n=4). ***p<0.001, compared with the indicated groups.
Figure 4—figure supplement 1
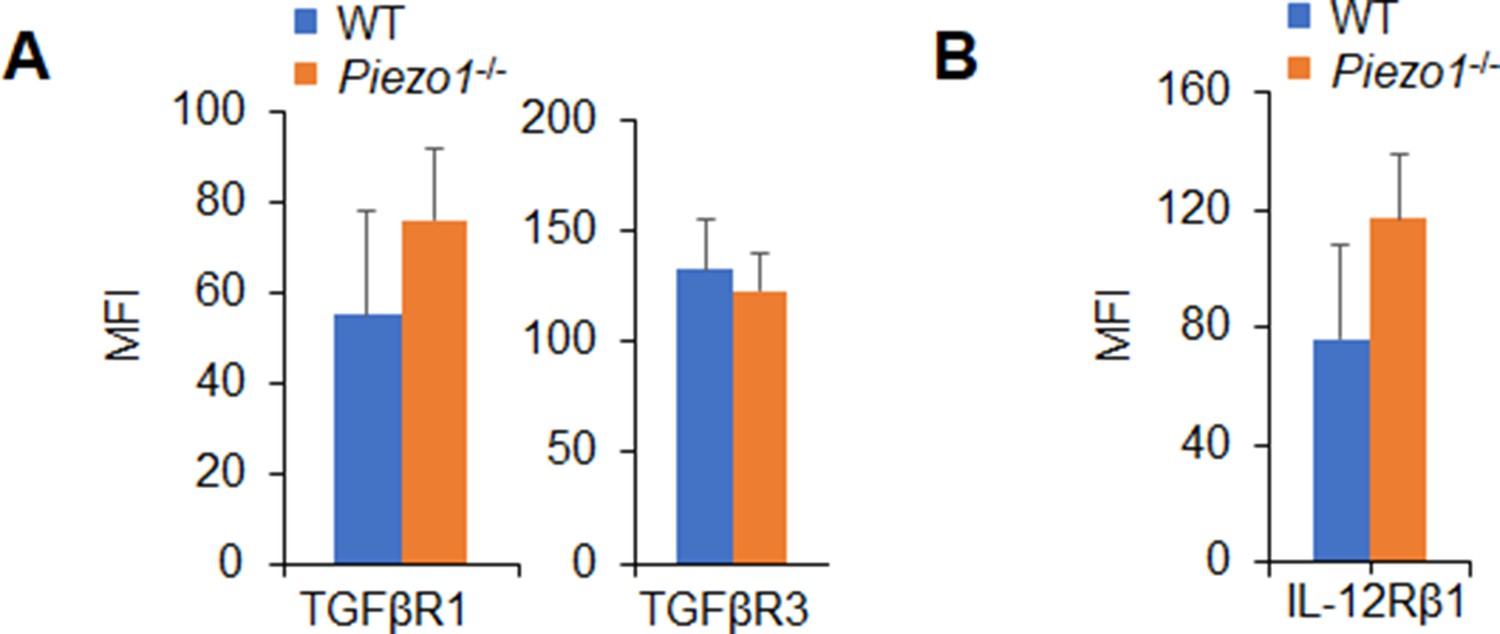
Expressions of TGFβR1/2 and IL-12Rβ1 in T cells induced by Piezo1-/- dendritic cells (DCs).
Expression of TGFβR1, TGFβR3 (A), and IL-12Rβ1 (B) in T cells cocultured with WT or Piezo1-/- splenic DCs for 5 days. Data are representative of three independent experiments (mean ± s.d.; n=4).
Figure 4—figure supplement 2
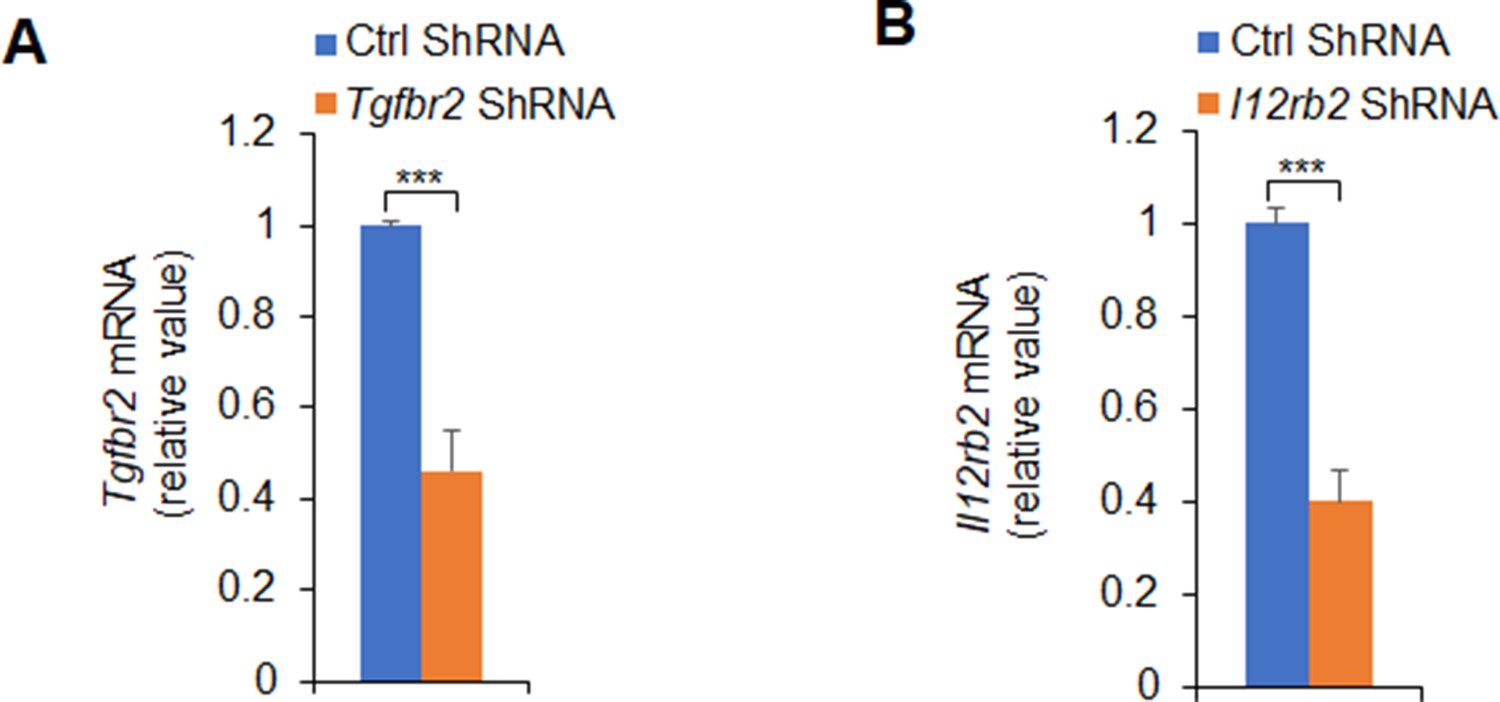
Knockdown of Tgfbr2 short hairpin RNA (shRNA) and Il12rb2 shRNA in T cells.
Sorted CD4+ T cells were transfected with control or Tgfbr2 shRNA vector (A) or Il12rb2 shRNA vector (B) and stimulated with WT or Piezo1-/- splenic dendritic cells (DCs) for 5 days in the presence of lipopolysaccharide (LPS) (10 ng/ml). Expression of indicated mRNA (A or B) was determined with qPCR (levels of Ctrl siRNA were set to 1). Data are representative of three independent experiments (mean ± s.d.; n=3). ***p<0.001, compared with the indicated groups.
Figure 5 with 5 supplements
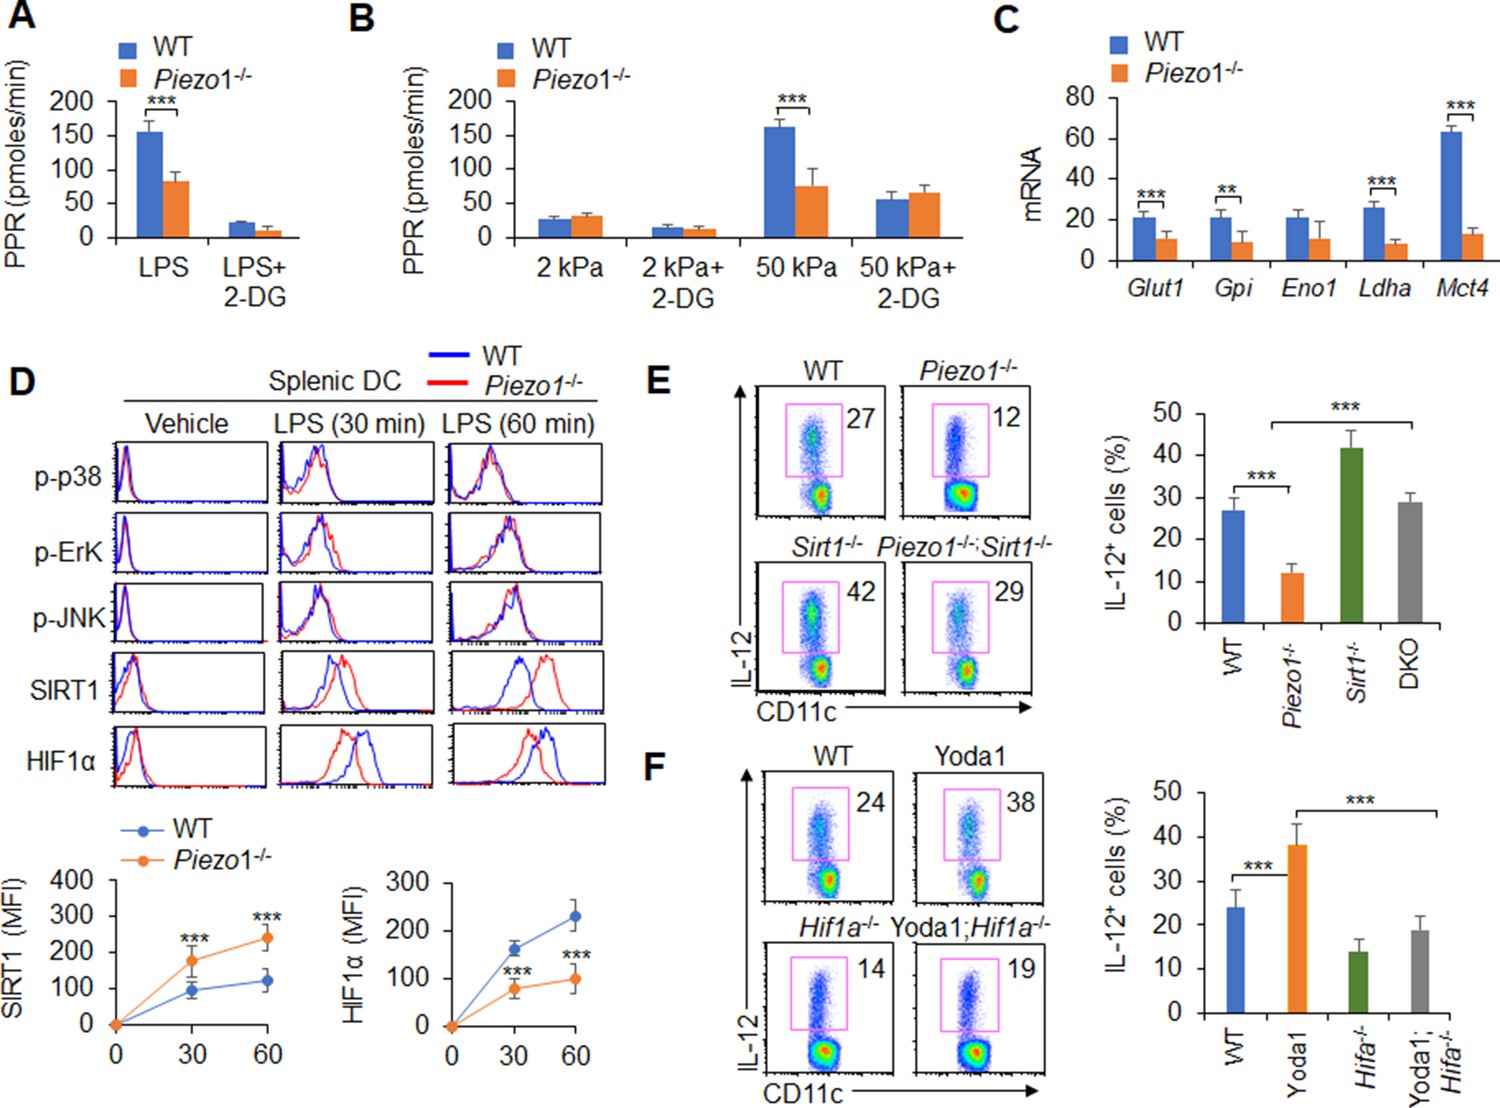
Piezo1 regulates TGFβ1 and IL-12 production through the SIRT1-HIF1α-glycolysis pathway.
(A–B) Sorted splenic dendritic cells (DCs) from WT or Piezo1-/- mice were stimulated with lipopolysaccharide (LPS) (10 ng/ml; A) or with 2 or 50 kPa hydrogels (B) for 24 hr in the presence or absence of 2-deoxy-D-glucose (2-DG) (1 mmol/l). The proton production rate (PPR) was analyzed as a readout for glycolysis. (C) mRNA expression of glycolytic molecules in splenic DCs from WT or Piezo1-/- mice treated with LPS (10 ng/ml) for 12 hr. The levels in the WT control group were set to 1. (D) Intracellular staining of p38, Erk, and JNK phosphorylation and SIRT1 and HIF1α expression in splenic DCs from WT or Piezo1-/- mice. A representative figure shown in the upper panel, and the data summarized in the lower panel. (E) Splenic DCs from WT, Piezo1-/- , Sirt1-/-, and Piezo1/Sirt1 double knockout (DKO; Piezo1-/-Sirt1-/-) mice were stimulated with LPS (10 ng/ml). Intracellular staining of IL-12p40. A representative figure shown on the left, and the data summarized on the right. (F) Splenic DCs from WT or Hif1a-/- mice were stimulated with LPS (10 ng/ml) in the presence or absence of Yoda1 (25 μM). Intracellular staining of IL-12p40. A representative figure shown on the left, and the data summarized on the right. The data are representative of three independent experiments (mean ± s.d.; n=3–4). **p<0.01 and ***p<0.001, compared with the indicated groups.
Figure 5—figure supplement 1

Piezo1 alters glycolytic metabolic signaling activities of dendritic cells (DCs).
Sorted splenic DCs from WT mice were stimulated with lipopolysaccharide (LPS) (10 ng/ml) or with 2 or 50 kPa hydrogels conditions for 24 hr in the presence or absence of 2-deoxy-D-glucose (2-DG) (1 mM) or Yoda1 (25 μM). (A) The proton production rate (PPR) was analyzed as a readout for glycolysis. (B) The oxygen consumption rate (OCR) was analyzed as a readout for oxidative phosphorylation (OXPHOS). (C) mRNA expression of glycolytic molecules in splenic DCs from WT mice in the presence of LPS (10 ng/ml) and Yoda1 (25 μM). Levels in the vehicle treatment at Glut1 group were set to 1. Data are representative of three independent experiments (mean ± s.d.; n=4). ***p<0.001, compared with the indicated groups.
Figure 5—figure supplement 2
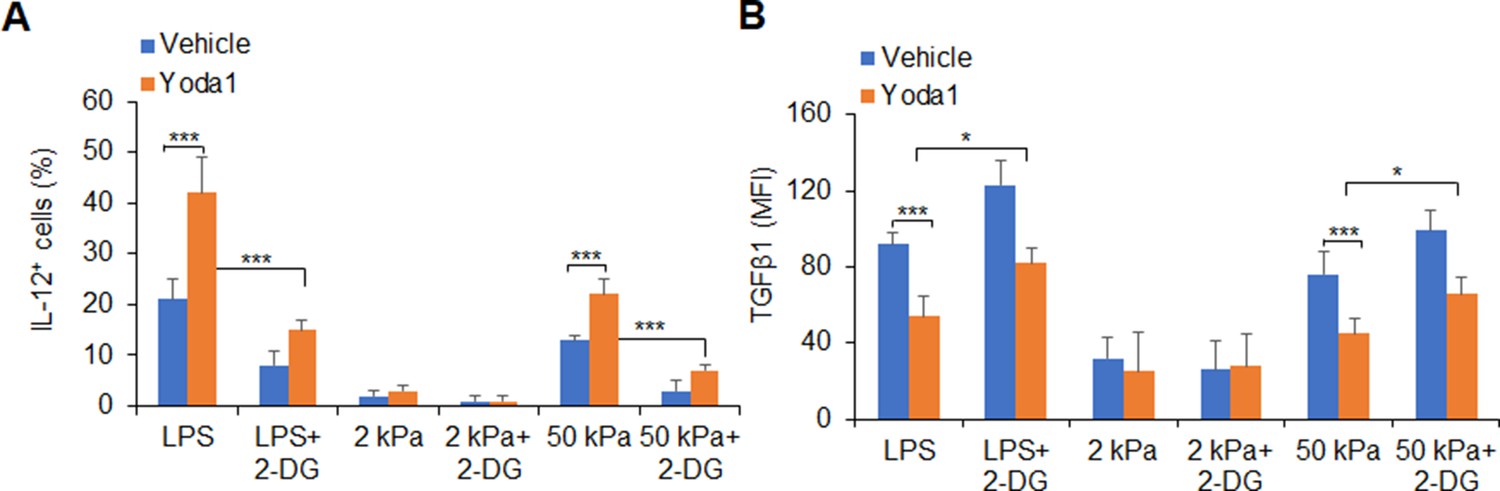
Glycolysis activities are required for IL-12 and TGFβ1 production in dendritic cells (DCs) induced by Yoda1 treatment.
(A–B) Sorted splenic DCs from WT mice were stimulated with lipopolysaccharide (LPS) (10 ng/ml) or with 2 or 50 kPa hydrogels conditions for 24 hr in the presence or absence of 2-deoxy-D-glucose (2-DG) (1 mM) or Yoda1 (25 μM). Intracellular staining of IL-12p40 (A) and TGFβ1 (B) expression with indicated treatment. Data are representative of three independent experiments (mean ± s.d.; n=3). *p<0.05 and ***p<0.001, compared with the indicated groups.
Figure 5—figure supplement 3

Glycolytic metabolism activities are required for IL-12 and TGFβ1 production in dendritic cells (DCs) induced by Piezo1 deficiency.
(A) Sorted splenic DCs from WT or Piezo1-/- mice were stimulated with lipopolysaccharide (LPS) (10 ng/ml) or 2 or 50 kPa hydrogels for 24 hr in the presence or absence of succinate (5 mM). The oxygen consumption rate (OCR) was analyzed as a readout for oxidative phosphorylation (OXPHOS). (B–C) Sorted splenic DCs from WT or Piezo1-/- mice were stimulated with LPS (10 ng/ml) or with 50 kPa hydrogels conditions for 24 hr in the presence or absence of 2-DG (1 mM). Intracellular staining of IL-12p40 (B) and TGFβ1 (C) expression with indicated treatment. Data are representative of three independent experiments (mean ± s.d.; n=3). ***p<0.001, compared with the indicated groups.
Figure 5—figure supplement 4

TGFβ1, HIF1α, and glycolysis activity alteration in dendritic cells (DCs) induced by Piezo1 and SIRT1 deficiency.
Splenic DCs from WT, Piezo1-/-, Sirt1-/-, and Piezo1/Sirt1 double knockout (DKO) mice were stimulated with lipopolysaccharide (LPS) (10 ng/ml). (A) Intracellular staining of TGFβ1. (B) Intracellular staining of HIF1α. (C) Proton production rate (PPR) was analyzed as a readout for glycolysis. Data are representative of three independent experiments (mean ± s.d.; n=3–4). ***p<0.001, compared with the indicated groups.
Figure 5—figure supplement 5
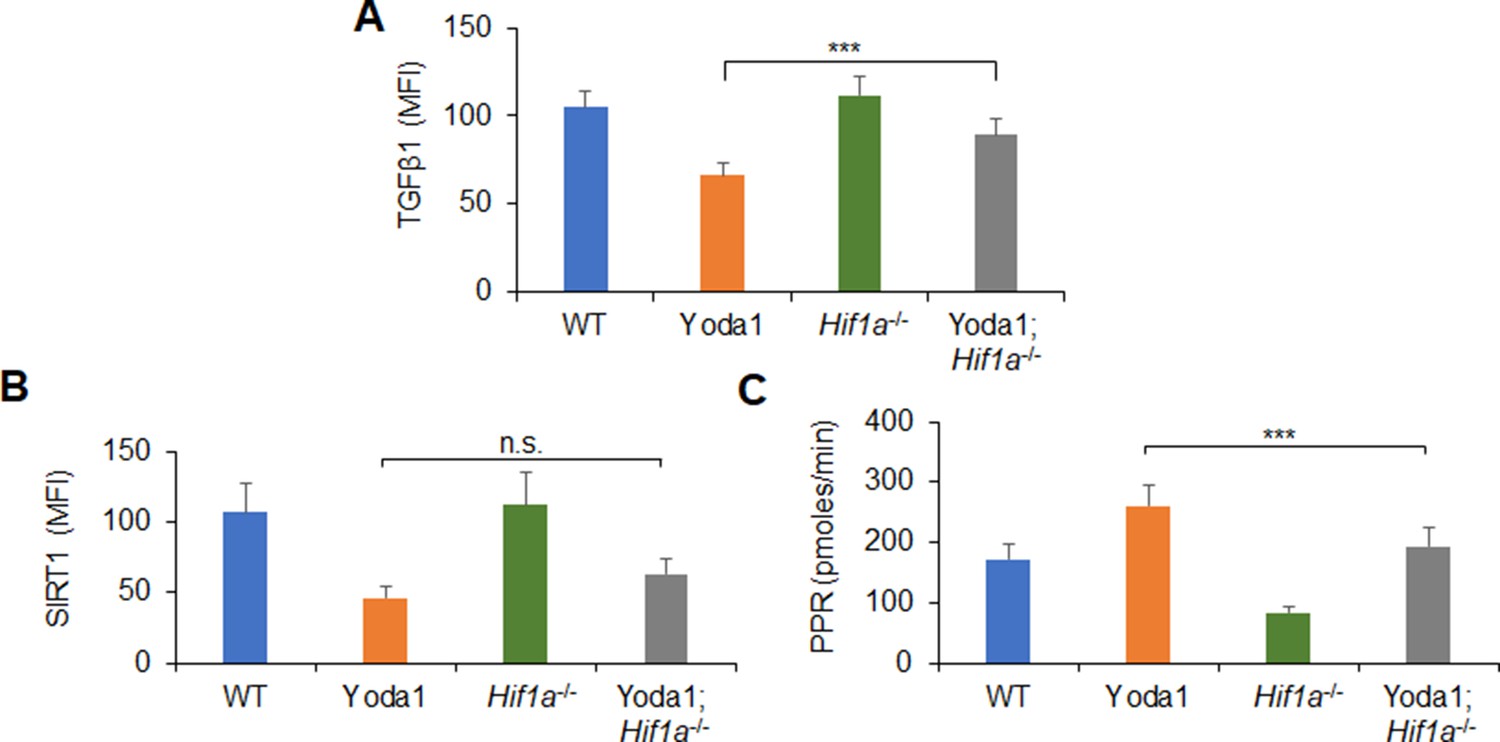
TGFβ1, SIRT1, and glycolysis activity alteration in dendritic cells (DCs) induced by Piezo1-HIF1α signaling.
Splenic DCs from WT or Hif1a-/- mice were stimulated with lipopolysaccharide (LPS) (10 ng/ml) in the presence or absence of Yoda1 (25 μM). (A) Intracellular staining of TGFβ1. (B) Intracellular staining of SIRT1. (C) Proton production rate (PPR) was analyzed as a readout for glycolysis. Data are representative of three independent experiments (mean ± s.d.; n=3–4). ***p<0.001, compared with the indicated groups.
Figure 6 with 2 supplements
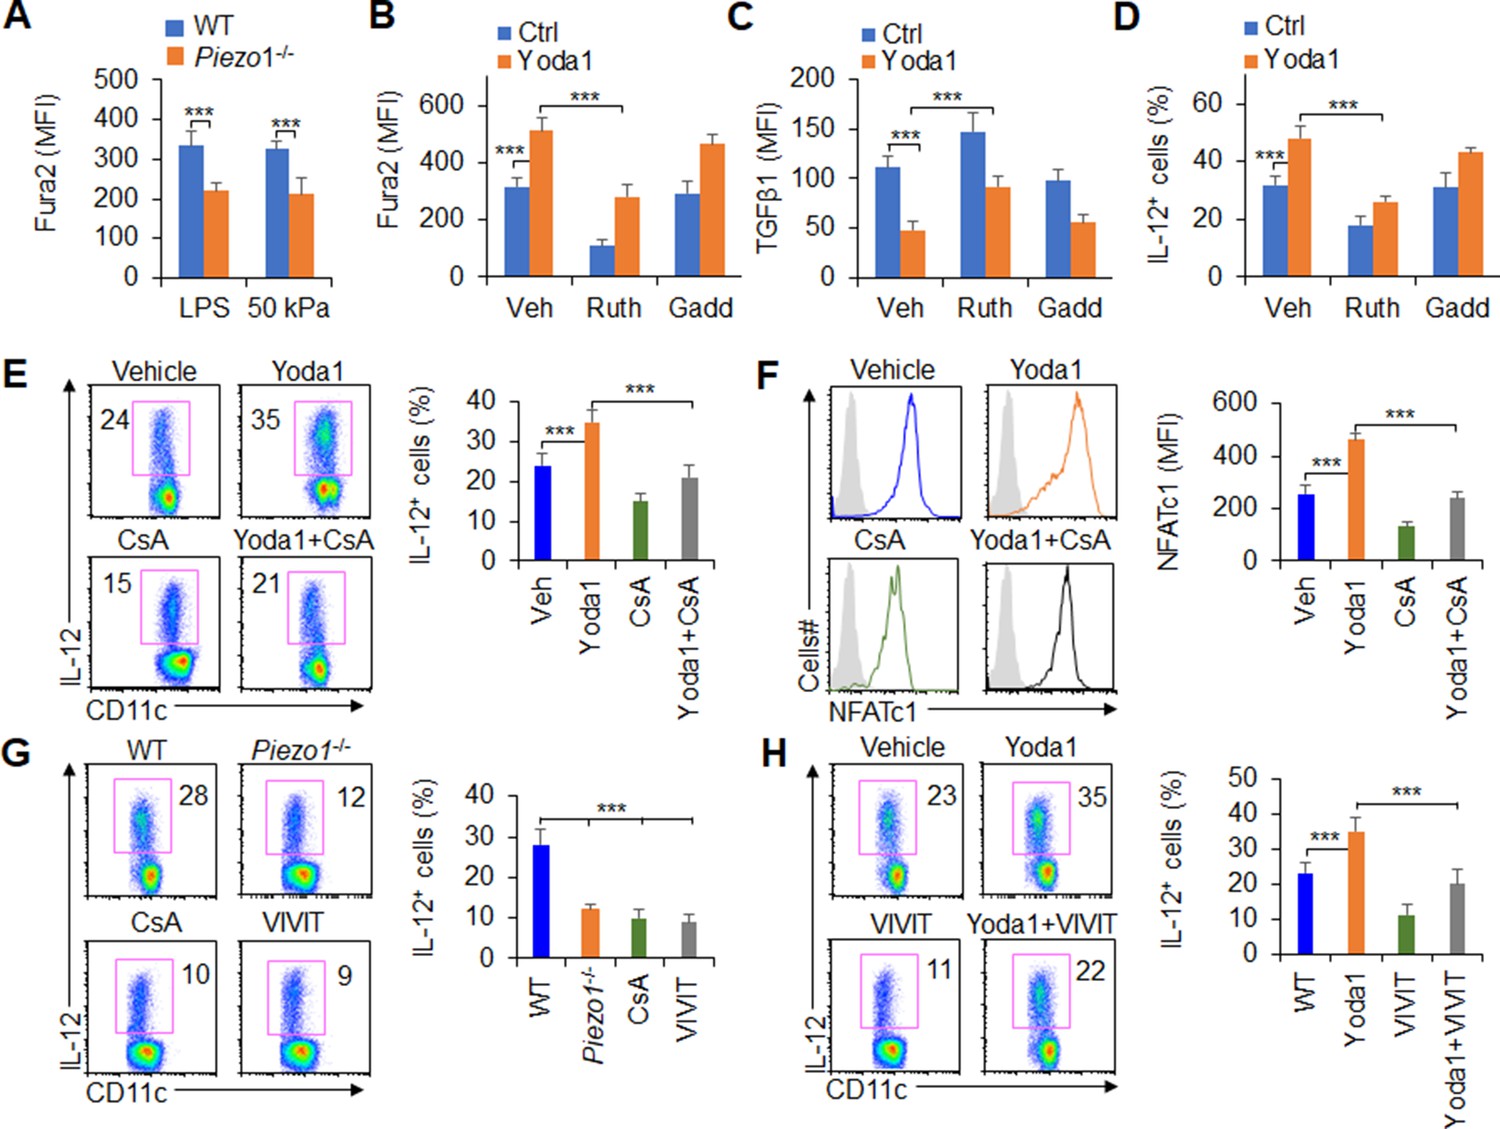
Piezo1 regulates TGFβ1 and IL-12 production through the calcium-calcineurin-NFAT axis.
(A) Measurement of intracellular Ca2+ concentrations with Fura2 dye in splenic dendritic cells (DCs) from WT or Piezo1-/- mice treated with lipopolysaccharide (LPS) (10 ng/ml) or cultured on plates containing 50 kPa hydrogels. (B) Intracellular Ca2+ concentrations measured with Fura2 in splenic DCs from WT mice after the indicated treatment (Yoda1, 25 μM, MCE; ruthenium red, 30 μM, Sigma; gadolinium chloride, 10 μM, Sigma). (C–D) Intracellular staining of TGFβ1 (C) and IL-12p40 (D) in splenic DCs from WT mice after the indicated treatments. (E) Intracellular staining of IL-12p40 in splenic DCs from WT mice after the indicated treatments. A representative figure shown on the left, and the data summarized on the right. (F) Intracellular staining of NFATc1 in splenic DCs from WT mice after the indicated treatments (CsA, 10 nM). A representative figure shown on the left, and data summarized on the right. (G–H) Intracellular staining of IL-12p40 in splenic DCs from WT or Piezo1-/- mice after the indicated treatments (Yoda1, 25 μM, MCE; 11R-VIVIT, 100 nM, MCE; CsA, 10 nM, Sigma). A representative figure shown on the left, and data summarized on the right. The data are representative of three to four independent experiments (mean ± s.d.; n=3–4). ***p<0.001, compared with the indicated groups.
Figure 6—figure supplement 1

Piezo1 regulates TGFβ1 and IL-12 production through calcium signaling.
(A) Intracellular Ca2+ using Fura2 in splenic dendritic cells (DCs) from WT or Piezo1-/- mice with indicated treatment (Yoda1, 25 μM; ruthenium red, 30 μM; gadolinium chloride, 10 μM). (B–C) Intracellular staining of TGFβ1 (B) and IL-12p40 (C) in splenic DCs from WT or Piezo1-/- mice with indicated treatments. Data are representative of three independent experiments (mean ± s.d.; n=3). ***p<0.001, compared with the indicated groups. n.s., not significant.
Figure 6—figure supplement 2
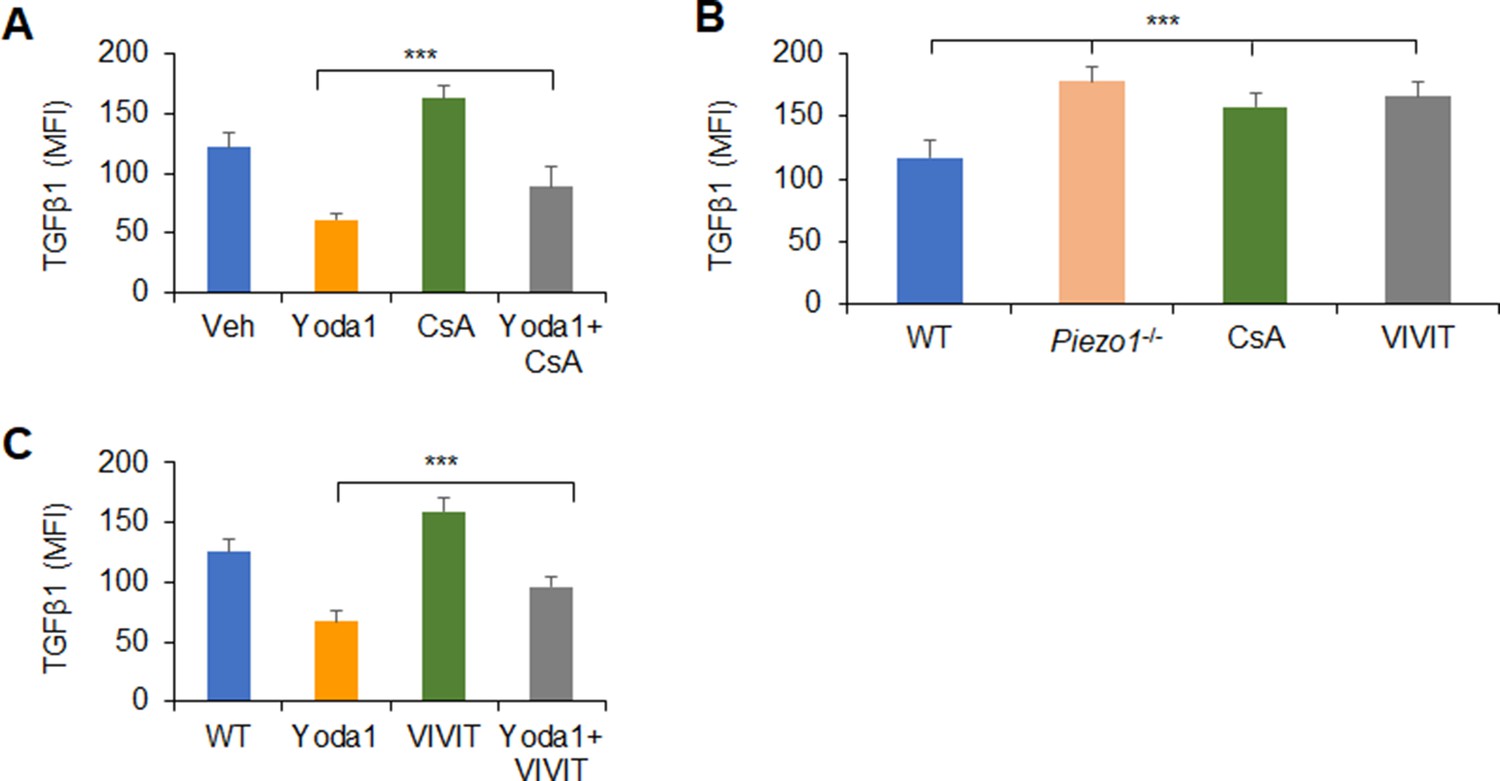
Piezo1 regulates TGFβ1 production through calcium-calcineurin-NFAT axis.
(A or C) Intracellular staining of TGFβ1 in splenic dendritic cells (DCs) from WT mice with indicated treatments. (B) Intracellular staining of TGFβ1 in splenic DCs from WT or Piezo1-/- mice with indicated treatments (Yoda1, 25 μM; 11R-VIVIT, 100 nM; CsA, 10 nM). Data are representative of three to four independent experiments (mean ± s.d.; n=3–5). ***p<0.001, compared with the indicated groups.
Figure 7 with 1 supplement
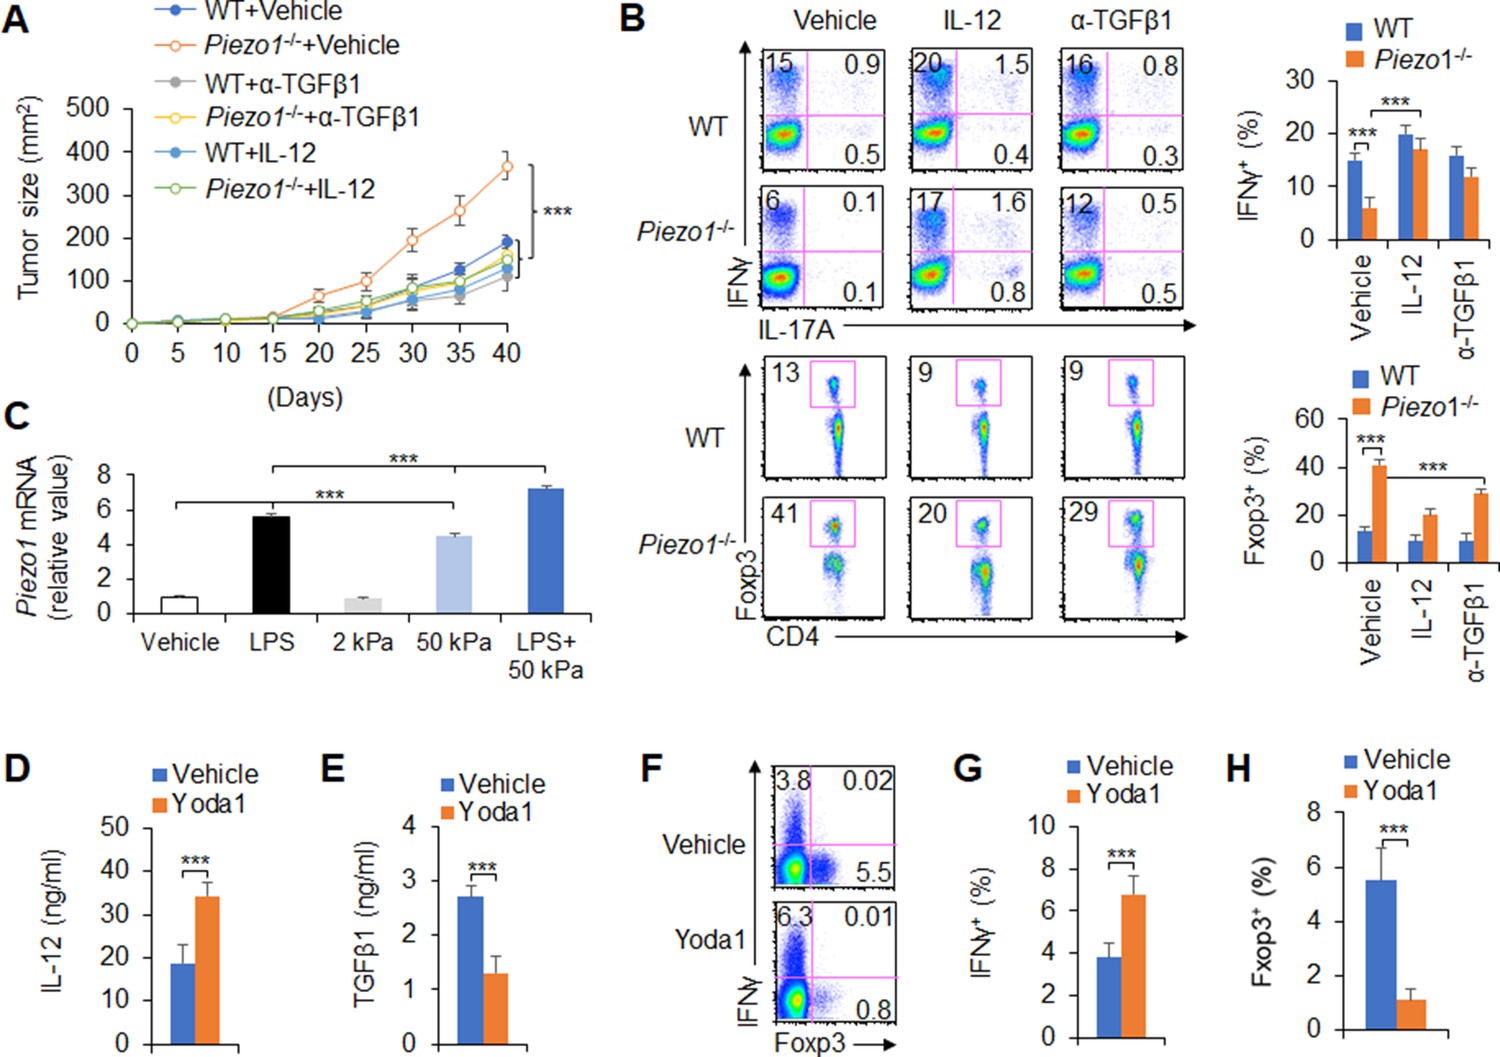
IL-12 and TGFβ1 are critical for dendritic cell (DC) piezo1-dependent T cell differentiation in promoting cancer growth.
(A) MC38 tumor cells were implanted subcutaneously in WT and Piezo1-/- mice (n=10), IL-12 100 ng or anti-TGFβ1 mAb 200 ng per mouse in 50 µl volume or vehicle (PBS) was locally injected into tumor once a week and tumor size was measured every 5 days for 40 days. (B) Intracellular staining of IFNγ, IL-17A, and Foxp3 expression in CD4+ T cells from the tumor of WT and Piezo1-/- tumor-bearing mice at day 40. (C) Piezo1 mRNA expression of human DCs with the indicated treatment (lipopolysaccharide [LPS], 10 ng/ml or conditioned with 2 or 50 kPa hydrogels plate or LPS+50 kPa hydrogels plate). Levels in the vehicle group were set to 1. (D–E) IL-12p70 (D) and TGFβ1 (E) production of human DCs treated by LPS (10 ng/ml) for 5 hr. (F–H) Human DCs pulsed with LPS (10 ng/ml) were cocultured with human T cells for 5 days, in the absence or presence of Yoda1 (25 μM). The intracellular staining of IFNγ and Foxp3 in T cells. ***p<0.001 compared with the indicated groups. Data are representative of three independent experiments (mean ± s.d.; n=3–4). ***p<0.001, compared with the indicated groups.
Figure 7—figure supplement 1
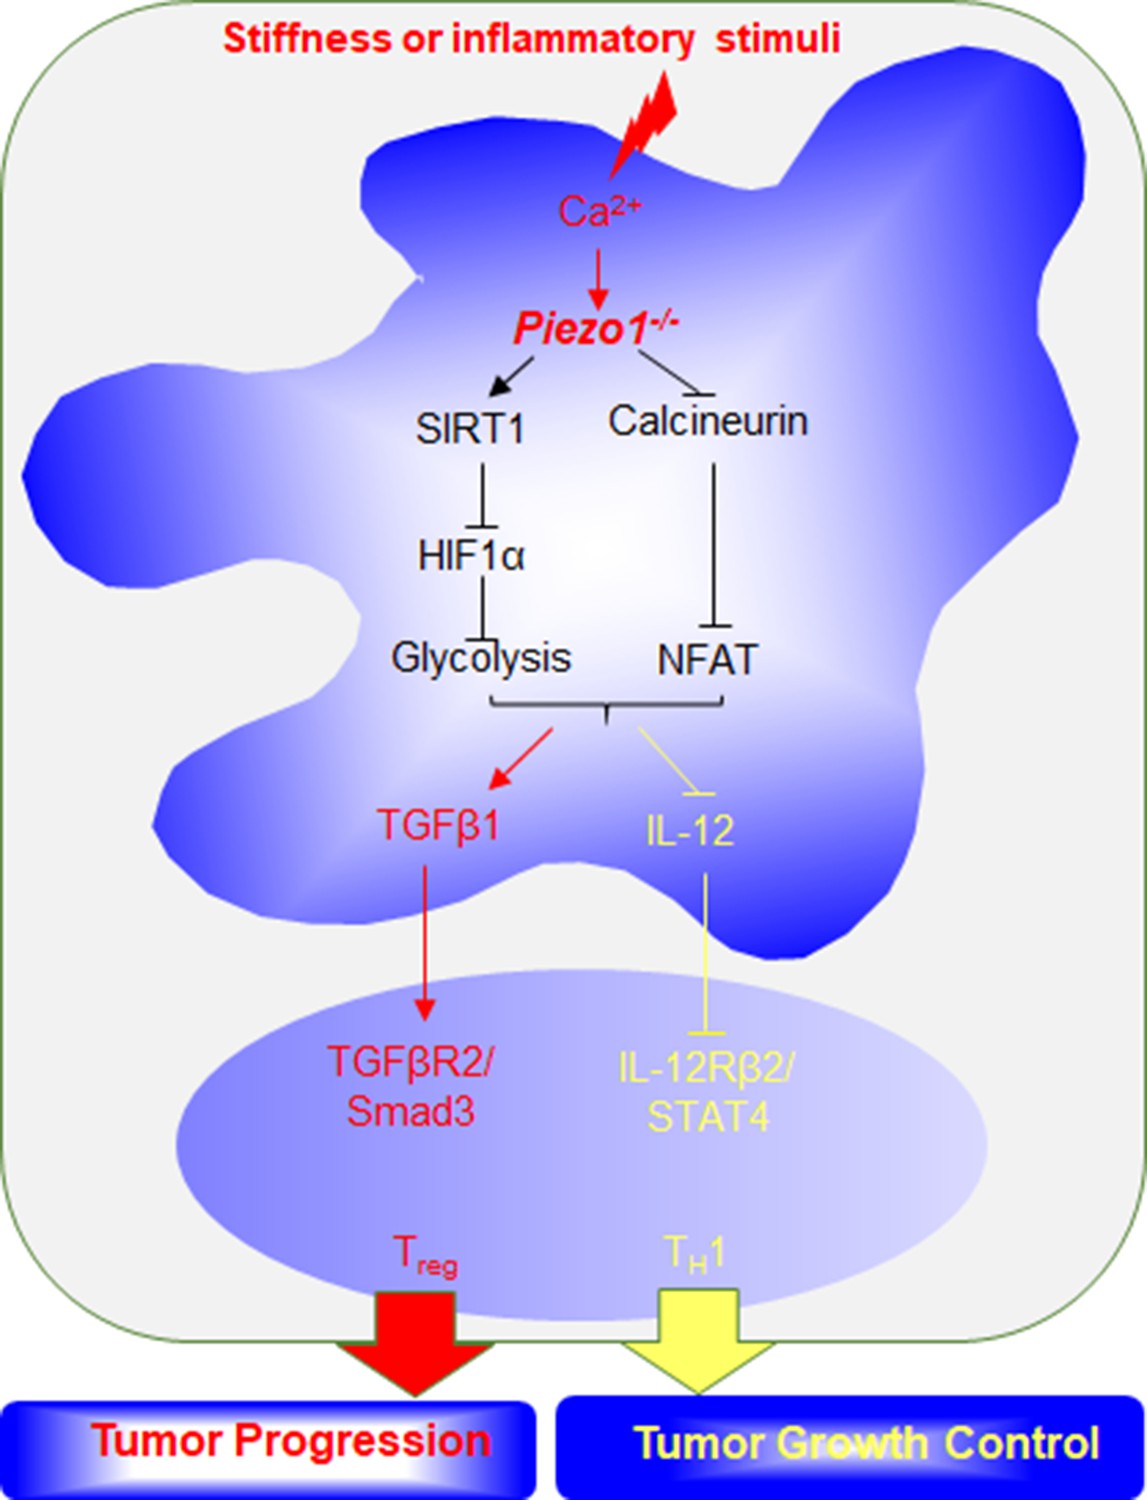
Dendritic cell (DC) Piezo1 controls the differentiation of TH1 and Treg cells in cancer.
Proposed model of how Piezo1 in DCs responses to inflammatory stimuli or stiffness signals to regulate the differentiation of TH1 and Treg cell populations in regulating cancer growth.
Tables
Key resources table
| Reagent type (species) or resource | Designation | Source or reference | Identifiers | Additional information |
|---|---|---|---|---|
| Genetic reagent (Mus musculus) | Mouse: C57BL/6J (CD45.1 and CD45.2) | Jackson Laboratory | RRID:IMSR_JAX:000664 | |
| Genetic reagent (Mus musculus) | Mouse: Piezo1flox/flox | Jicuiyaokang company of China | ||
| Genetic reagent (Mus musculus) | Mouse: Cd11c-Cre | Nanfangmoshi biological company of China | ||
| Genetic reagent (Mus musculus) | Mouse: Piezo1-/- | Jicuiyaokang company of China | ||
| Genetic reagent (Mus musculus) | Mouse: Sirt1flox/flox | Jackson Laboratory | ||
| Genetic reagent (Mus musculus) | Mouse: Hif1aflox/flox | Jackson Laboratory | ||
| Genetic reagent (Mus musculus) | Mouse: Cd4-Cre | Jackson Laboratory | ||
| Genetic reagent (Mus musculus) | Mouse: OTII TCR-transgenic mice | Jicuiyaokang company of China | ||
| Biological sample (Mus musculus) | Primary mouse splenocyte cells | Beijing Normal University | Freshly isolated from mice | |
| Biological sample (Mus musculus) | Primary mouse bone marrow cells | Beijing Normal University | Freshly isolated from mice | |
| Biological sample (Mus musculus) | Primary mouse serum | Beijing Normal University | Freshly isolated from mice | |
| Cell line | Mouse colon cancer cell line MC-38 | China cell bank ATCC Center | MC38 | |
| Cell line | Mouse melanoma cell line B16.F10 | China cell bank ATCC Center | B16.F10 | |
| Cell line | Human DC | Lonza | CC-2701 | |
| Cell line | Human cord blood CD4+ T cells | Lonza | 2C-200 | |
| Antibody | Rat monoclonal anti-mouse CD11c FITC | Thermo Fisher Scientific | Cat # MHCD11C01; RRID: AB_10373970 | FCS (1:100) |
| Antibody | Rat monoclonal anti-mouse CD11c APC eFluor780 | Thermo Fisher Scientific | Cat# 47-0116-42 | FCS (1:100) |
| Antibody | Rat monoclonal anti-mouse CD11c PE | Thermo Fisher Scientific | Cat# 12-0114-81 | FCS (1:100) |
| Antibody | Rat monoclonal anti-mouse CD4 APC-Cy7 | BD Bioscience | Cat#130-109-536 | FCS (1:100) |
| Antibody | Rat monoclonal anti-mouse CD8α FITC | Thermo Fisher Scientific | Cat# 11-0081-82 | FCS (1:100) |
| Antibody | Rat monoclonal anti-mouse CD11b FITC | Thermo Fisher Scientific | Cat# 11-0112-82 | FCS (1:100) |
| Antibody | Rat monoclonal anti-mouse Ly6G PE | Thermo Fisher Scientific | Cat# 12-9668-82 | FCS (1:100) |
| Antibody | Rat monoclonal anti-mouse F4/80 PE | Thermo Fisher Scientific | Cat# 12-4801-82 | FCS (1:100) |
| Antibody | Rat monoclonal anti-mouse CD19 PE | Thermo Fisher Scientific | Cat# 12-0199-42 | FCS (1:100) |
| Antibody | Rat monoclonal anti-mouse TCR FITC | Thermo Fisher Scientific | Cat# TCR2730 | FCS (1:100) |
| Antibody | Rat monoclonal anti-mouse CD44 FITC | Thermo Fisher Scientific | Cat# 11-0441-82 | FCS (1:100) |
| Antibody | Rat monoclonal anti-mouse CD62L APC | Thermo Fisher Scientific | Cat# 11-0621-82 | FCS (1:100) |
| Antibody | Rat monoclonal anti-mouse CD80 APC | Thermo Fisher Scientific | Cat# 17-0801-82 | FCS (1:100) |
| Antibody | Rat monoclonal anti-mouse CD54 FITC | Thermo Fisher Scientific | Cat# 17-0549-42 | FCS (1:100) |
| Antibody | Rat monoclonal anti-mouse MHCII APC | Thermo Fisher Scientific | Cat# 17-5320-82 | FCS (1:100) |
| Antibody | Rat monoclonal anti-mouse CD45 APC | Thermo Fisher Scientific | Cat# 17-0459-42 | FCS (1:200) |
| Antibody | Rat monoclonal anti-mouse NK1.1 PE | Thermo Fisher Scientific | Cat# 25-5941-82 | FCS (1:200) |
| Antibody | Rat monoclonal Anti-mouse CCR7 APC | Thermo Fisher Scientific | Cat# A18389 | FCS (1:200) |
| Antibody | Mouse monoclonal anti-mouse PDL1 PE | Thermo Fisher Scientific | Cat# 12-5982-82 | FCS (1:200) |
| Antibody | Mouse monoclonal anti-mouse PDL2 PE | Thermo Fisher Scientific | Cat# 12-5986-82 | FCS (1:200) |
| Antibody | Mouse monoclonal anti-mouse IFNγ PE | Thermo Fisher Scientific | Cat# 12-7311-82 | FCS (1:100) |
| Antibody | Mouse monoclonal anti-mouse IL-4 PE | Thermo Fisher Scientific | Cat# 12-7041-82 | FCS (1:100) |
| Antibody | Rat monoclonal anti-mouse Foxp3 PE | Thermo Fisher Scientific | Cat# 12-5773-82 | FCS (1:100) |
| Antibody | Rat monoclonal anti-mouse IL-12p40 | Thermo Fisher Scientific | Cat# 12-7123-82 | FCS (1:100) |
| Antibody | Rat monoclonal anti-mouse TGFβ1 | Thermo Fisher Scientific | Cat# 12-9829-42 | FCS (1:100) |
| Commercial assay or kit | Fixation/Permeabilization Solution Kit | BD Bioscience | Cat# 554714 | |
| Commercial assay or kit | RNeasy Mini Kit | Qiagen | Cat# 74106 | |
| Commercial assay or kit | FastQuant RT Kit | Tiangen | Cat# KR106-02 | |
| Commercial assay or kit | Mouse IL-12 p70 Quantikine ELISA Kit | R&D Systems | Cat# M1270 | |
| Commercial assay or kit | Mouse TGF-beta 1 DuoSet ELISA | R&D Systems | Cat# DY1679 | |
| Commercial assay or kit | SuperReal PreMix Plus SYBR Green | Tiangen | Cat# FP205-02 | |
| Chemical compound, drug | Cyclosporin A | Signa-Aldrich | Cat# 59865-13-3 | |
| Chemical compound, drug | Yoda1 | MCE | Cat# HY-18723 | |
| Chemical compound, drug | 11R-VIVIT | MCE | Cat# HY-P1430 | |
| Chemical compound, drug | Gadolinium chloride | Sigma-Aldrich | Cat# 19423-81-5 | |
| Chemical compound, drug | Ruthenium red | Sigma-Aldrich | Cat# 12790-48-6 | |
| Chemical compound, drug | 2-Deoxy-D-glucose | Sigma-Aldrich | Cat# 29702-43-0 | |
| Chemical compound, drug | Diethyl succinate | Sigma-Aldrich | Cat# 123-25-1 | |
| Chemical compound, drug | IL-4 | R&D Systems | Cat# 204-IL | |
| Chemical compound, drug | IL-12 | Peprotech | Cat# 210–12 | |
| Chemical compound, drug | Fibronectin | Sigma-Aldrich | Cat# ECM001 | |
| Chemical compound, drug | Carbonyl cyanide-4-[trifluoromethoxy] phenylhydrazone | Sigma-Aldrich | Cat# SML2959 | |
| Chemical compound, drug | Rotenone | Sigma-Aldrich | Cat# R8875 | |
| Chemical compound, drug | Fura2 AM | Sigma-Aldrich | Cat# 47989 | |
| Chemical compound, drug | LPS | Sigma-Aldrich | Cat# 2630 | |
| Chemical compound, drug | Freund’s Adjuvant, Complete | Sigma–Aldrich | Cat# F5881 | |
| Chemical compound, drug | PMA | Sigma-ALdrich | Cat# P8139 | |
| Chemical compound, drug | Ionomycin | Sigma-Aldrich | Cat# I0634 | |
| Chemical compound, drug | GM-CSF | R&D Systems | Cat# 7954GM-010/CF | |
| Chemical compound, drug | Collagenase D | Worthington | Cat# LS005273 | |
| Chemical compound, drug | Deoxyribonuclease I | Beyotime Biotechnology | Cat# D7076 | |
| Chemical compound, drug | Percoll | GE Health | Cat# 17-0891-01 | |
| Software, algorithm | Adobe Illustrator | Adobe | RRID:SCR_010279 | |
| Other | One-micrometer latex microspheres | Polysciences, Inc | Cat# 19821 | |
| Other | 7-AAD | BD Bioscience | Cat# 559925 RRID: AB_2869266 | A dye for identifying cell death |
| Other | Streptavidin-APC/eFluor 780 | Thermo Fisher Scientific | Cat# 47-4317-82; RRID:AB_10366688 | A secondary antibody for indirect staining to detect biotinylated primary antibody; FCS (1:500) |
| Other | Streptavidin-eFluor 450 | Streptavidin-eFluor 450 | Cat# 48-4317-82; RRID:AB_10359737 | A secondary antibody for indirect staining to detect biotinylated primary antibody; FCS (1:500) |
| Other | SYLGARD 527 A&B Silicone Dielectric Gel | Dow | Silicone Dielectric Gel |
Additional files
Download links
A two-part list of links to download the article, or parts of the article, in various formats.
Downloads (link to download the article as PDF)
Open citations (links to open the citations from this article in various online reference manager services)
Cite this article (links to download the citations from this article in formats compatible with various reference manager tools)
Dendritic cell Piezo1 directs the differentiation of TH1 and Treg cells in cancer
eLife 11:e79957.
https://doi.org/10.7554/eLife.79957


