A selective LIS1 requirement for mitotic spindle assembly discriminates distinct T-cell division mechanisms within the T-cell lineage
- Toulouse Institute for Infectious and Inflammatory Diseases (Infinity), INSERM UMR1291, CNRS UMR5051, University Toulouse III, France
Figures
Figure 1 with 1 supplement
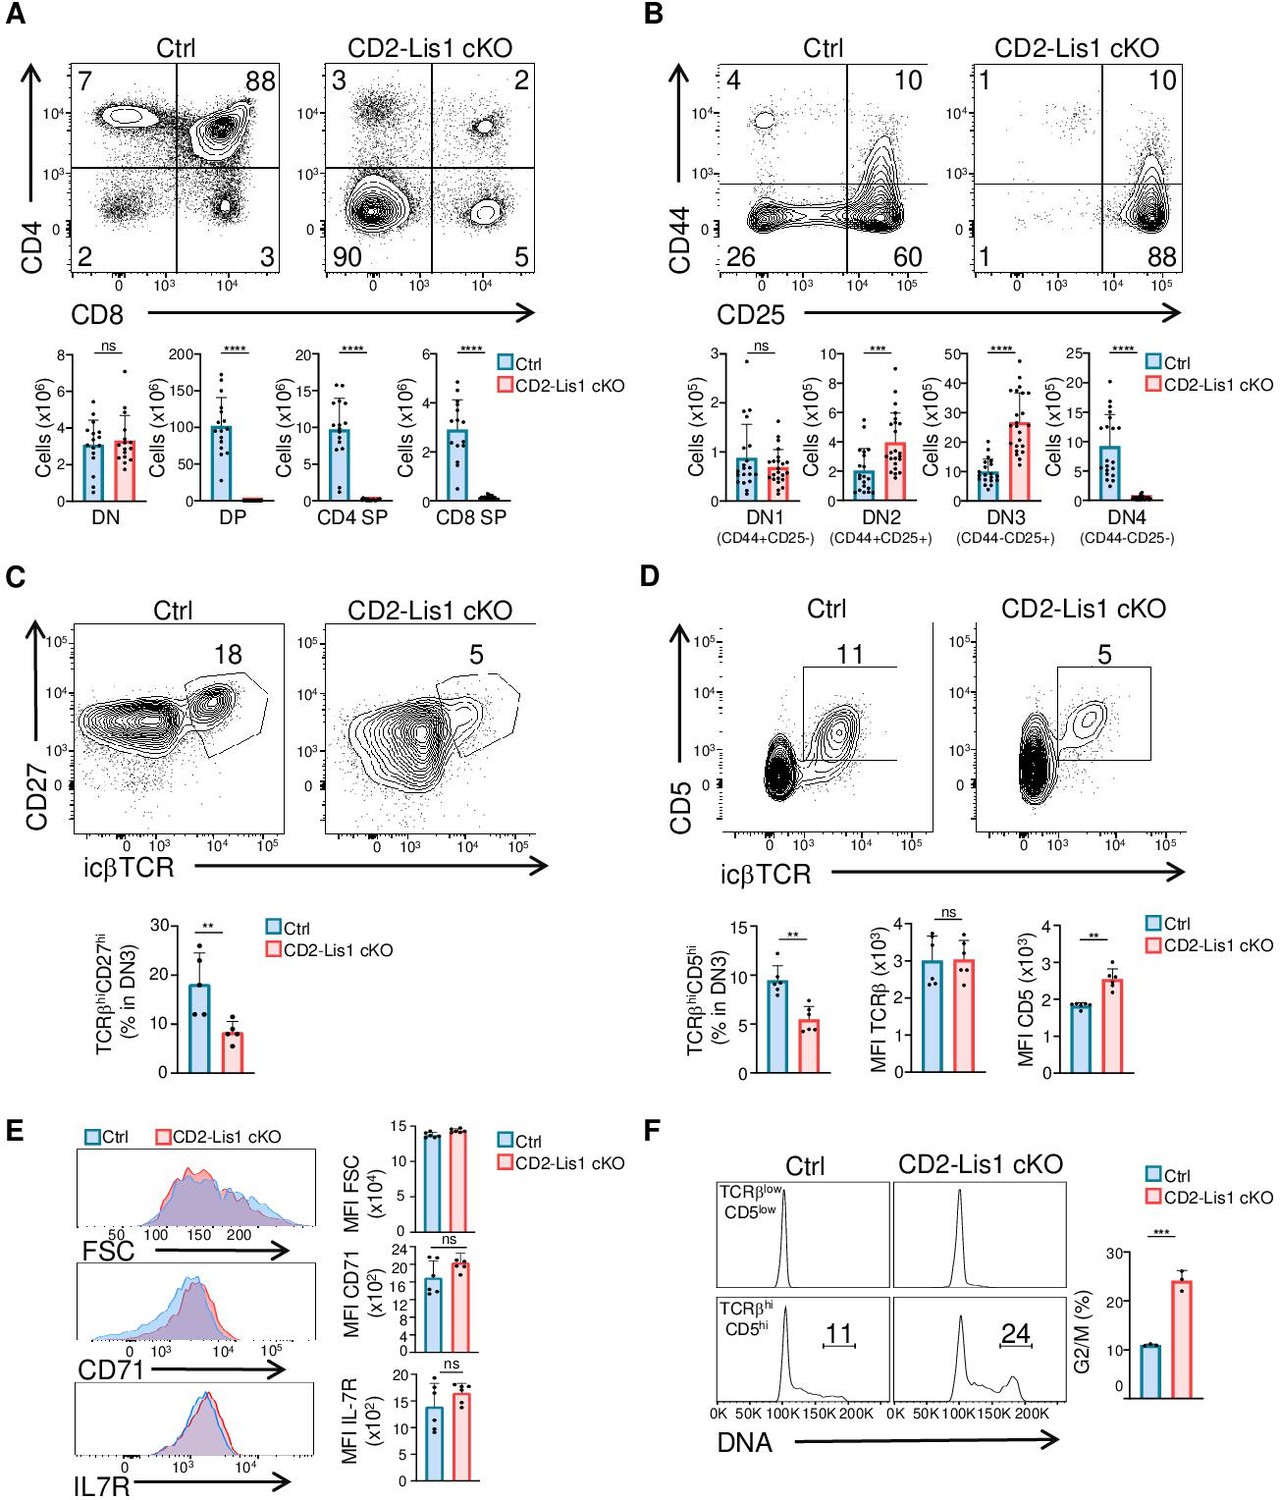
LIS1 is required for T-cell development following the β-selection checkpoint.
Phenotypic analyses of thymocytes from control and CD2-Lis1 cKO mice. (A) Dot plots show CD4 versus CD8 surface staining on thymocytes from control and CD2-Lis1 cKO mice. Histogram bars represent the numbers of thymocytes in each indicated subset from mice of the indicated genotype. Data are mean ± SD and represent a pool of four independent experiments each including n = 3–4 mice per group. (B) Dot plots show CD44 versus CD25 surface staining on CD4-CD8- [DN] thymocytes from control and CD2-Lis1 cKO mice. Histogram bars represent the numbers of thymocytes in each indicated subset from mice of the indicated genotype. Data are mean ± SD and represent a pool of five independent experiments each including n = 4–5 mice per group. (C) Dot plots show CD27 versus TCRβ intracellular staining on DN3 thymocytes from control and CD2-Lis1 cKO mice. Histogram bars represent the percentages of TCRβhiCD27hi thymocytes in DN3 thymocytes. Data are mean ± SD and represent a pool of two independent experiments each including n = 2–3 mice per group. (D) Dot plots show CD5 versus TCRβ intracellular staining on DN3 thymocytes from control and CD2-Lis1 cKO mice. Histogram bars represent the percentages of TCRβhiCD5hi thymocytes in DN3 thymocytes and the MFI of TCRβ and CD5 in DN3 TCRβhiCD5hi thymocytes from mice of the indicated genotype. Data are mean ± SD and represent a pool of two independent experiments each including n = 3 mice per group. (E) Histogram graphs show IL-7R, CD71 surface staining and forward-scatter (FSC) on DN3 thymocytes expressing the TCRβ chain. Histogram bars represent the MFI of IL-7R, CD71, and FSC in the indicated DN3 thymocytes subsets. Data are mean ± SD and represent a pool of two independent experiments each including n = 3 mice per group. (F) Histogram graphs show DNA intracellular staining on DN3 thymocytes from the indicated subsets. The percentages represent cells in the G2/M phase of cell cycle. Histogram bars represent the percentages of DN3 TCRβhiCD5hi thymocytes in the G2/M phase of cell cycle. Data are mean ± SD and represent a pool of three independent experiments each including n = 1 mouse per group. Unpaired two-tailed Mann–Whitney t tests were performed for all analyses. **p<0.01; ***p<0.001; ****p<0.0001.
-
Figure 1—source data 1
LIS1 is required for T-cell development following the β-selection checkpoint.
- https://cdn.elifesciences.org/articles/80277/elife-80277-fig1-data1-v2.zip
Figure 1—figure supplement 1
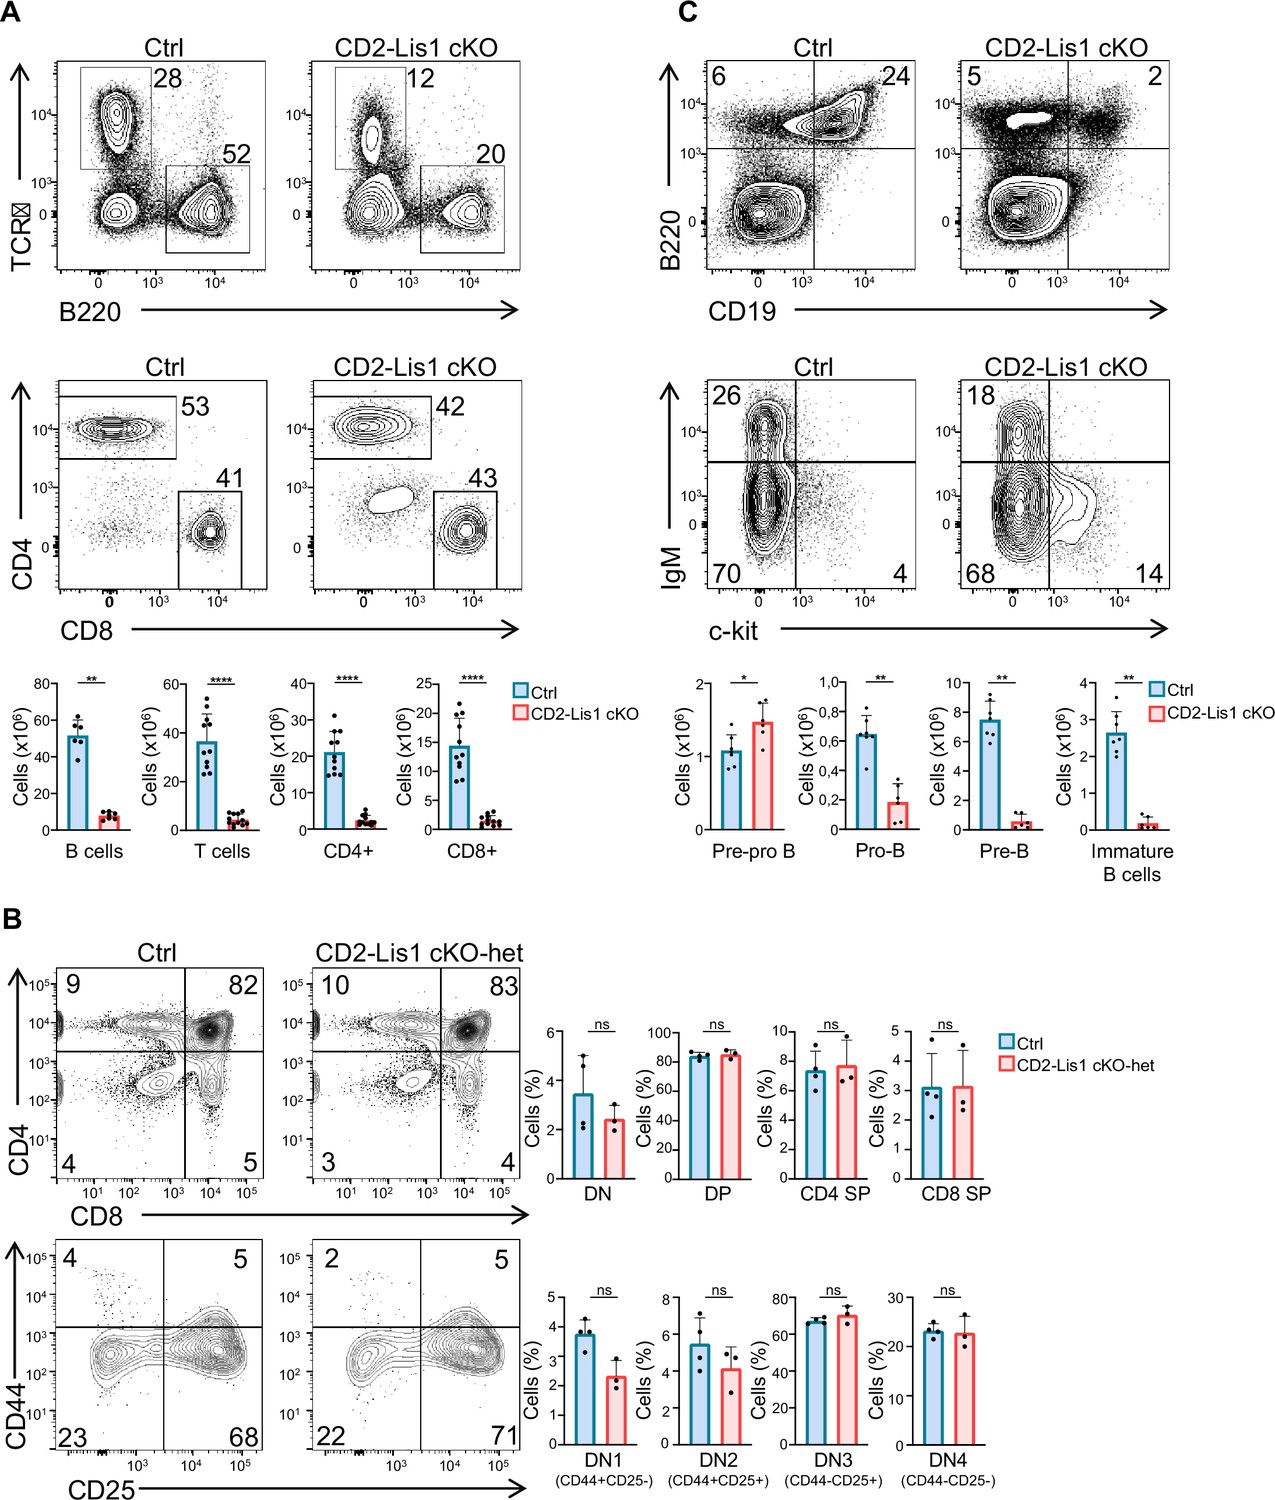
LIS1 is required for B-cell development and is effective at single-gene dosage during T-cell development.
(A) Dot plots show TCR versus B220 and CD4 versus CD8 surface staining on splenocytes from control and CD2-Lis1 cKO mice. Histogram bars represent the numbers of thymocytes in each indicated subset from mice of the indicated genotype. Data are mean ± SD and represent four independent experiments each including n = 3–4 mice per group. (B) Dot plots show CD4 versus CD8 surface staining on total thymocytes and CD44 versus CD25 surface staining on CD4-CD8- [DN] thymocytes from control (Pafah1b1flox/+) and CD2-Lis1 cKO-het mice. Histogram bars represent the percentages of thymocytes in each indicated subset from mice of the indicated genotype. Data are mean ± SD and represent a pool of two independent experiments each including n = 1–2 mice per group. (C) Upper dot plots show B220 versus CD19 on bone marrow cells from control and CD2-Lis1 cKO mice. Lower dot plots show IgM versus c-Kit staining on B220+CD19+ bone marrow cells from control and CD2-Lis1 cKO mice. Histogram bars represent the numbers of cells in each indicated subset from mice of the indicated genotype. Data are mean ± SD and represent two independent experiments each including n = 3–4 mice per group. Unpaired two-tailed Mann–Whitney t tests were performed. *p<0.05; **p<0.01; ***p<0.001; ****p<0.0001.
-
Figure 1—figure supplement 1—source data 1
LIS1 is required for B-cell development and is effective at single-gene dosage during T-cell development.
- https://cdn.elifesciences.org/articles/80277/elife-80277-fig1-figsupp1-data1-v2.zip
Figure 2
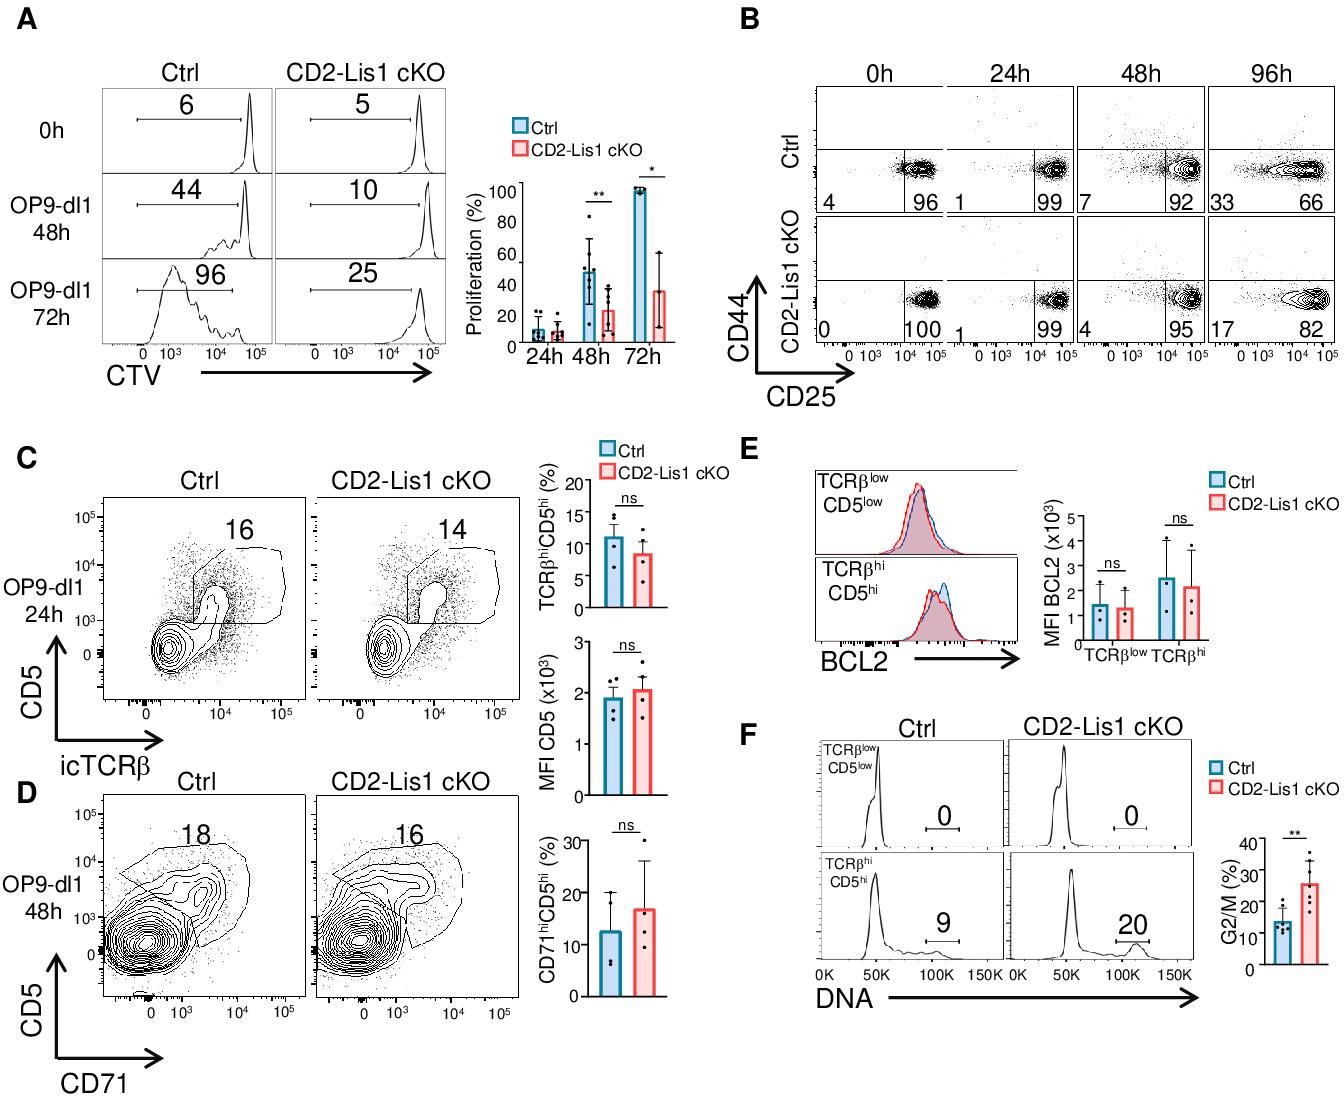
LIS1 is required for the proliferation of immature thymocytes after the β-selection checkpoint.
(A) CD5lo DN3 thymocytes from control and CD2-Lis1 cKO mice were stained with CellTrace violet (CTV) and stimulated with OP9-Dl1 cells for 48 or 72 hr. The histogram graph shows CTV dilution. Bar graphs represent the proliferation of cells determined by flow cytometry at 24, 48, and 72 hr after stimulation. Data are mean ± SD and represent 3–7 independent experiments each including n = 1–2 pooled mice per group. (B) CD5lo DN3 thymocytes from control and CD2-Lis1 cKO mice were stimulated with OP9-Dl1 cells for the indicated periods of time. Dot plots show CD44 versus CD25 surface staining on thymocytes from control and CD2-Lis1 cKO mice. Data are representative of three independent experiments each including n = 1–2 pooled mouse per group. (C) CD71lo DN3 thymocytes from control and CD2-Lis1 cKO were stimulated with OP9-Dl1 cells for 24 hr. Dot plots show CD5 versus TCRβ intracellular staining on thymocytes. Histogram bars represent the percentages of TCRβhiCD5hi thymocytes in DN3 thymocytes and the MFI CD5 in DN3 TCRβhiCD5hi thymocytes from mice of the indicated genotype. Data are mean ± SD and represent four independent experiments each including n = 1–2 pooled mice per group. (D) CD71lo DN3 thymocytes from control and CD2-Lis1 cKO mice were stimulated with OP9-Dl1 cells for 48 hr. Dot plots show CD5 versus CD71 staining on CTVhi thymocytes. Histogram bars represent the percentages of CD71hiCD5hi thymocytes in CTVlo DN3 thymocytes. Data are mean ± SD and represent four independent experiments each including n = 1–2 pooled mice per group. (E) CD71lo DN3 thymocytes from control and CD2-Lis1 cKO mice were stimulated with OP9-Dl1 cells for 24 hr. The histogram graph shows BCL-2 intracytoplasmic staining in TCRβloCD5lo and TCRβhiCD5hi thymocyte subsets. Histogram bars represent the MFI of BCL-2 in the indicated DN3 thymocyte subsets. Data are mean ± SD and represent three independent experiments each including n = 1–2 pooled mice per group. (F) CD71lo DN3 thymocytes from control and CD2-Lis1 cKO mice were stimulated with OP9-Dl1 cells for 48 hr. Histogram graphs show DNA intracellular staining on thymocytes from the indicated DN3 subsets. The indicated percentages represent cells in the G2/M phase of cell cycle. Histogram bars represent the percentages of DN3 TCRβhiCD5hi thymocytes in the G2/M phase of cell cycle. Data are mean ± SD and represent six independent experiments each including n = 1–2 pooled mice per group. (A) Unpaired two-tailed Welch t tests were performed. (C–E) Unpaired two-tailed Mann–Whitney t tests were performed. *p<0.05, **p<0.01.
-
Figure 2—source data 1
LIS1 is required for the proliferation of immature thymocytes after the β-selection checkpoint.
- https://cdn.elifesciences.org/articles/80277/elife-80277-fig2-data1-v2.zip
Figure 3 with 2 supplements
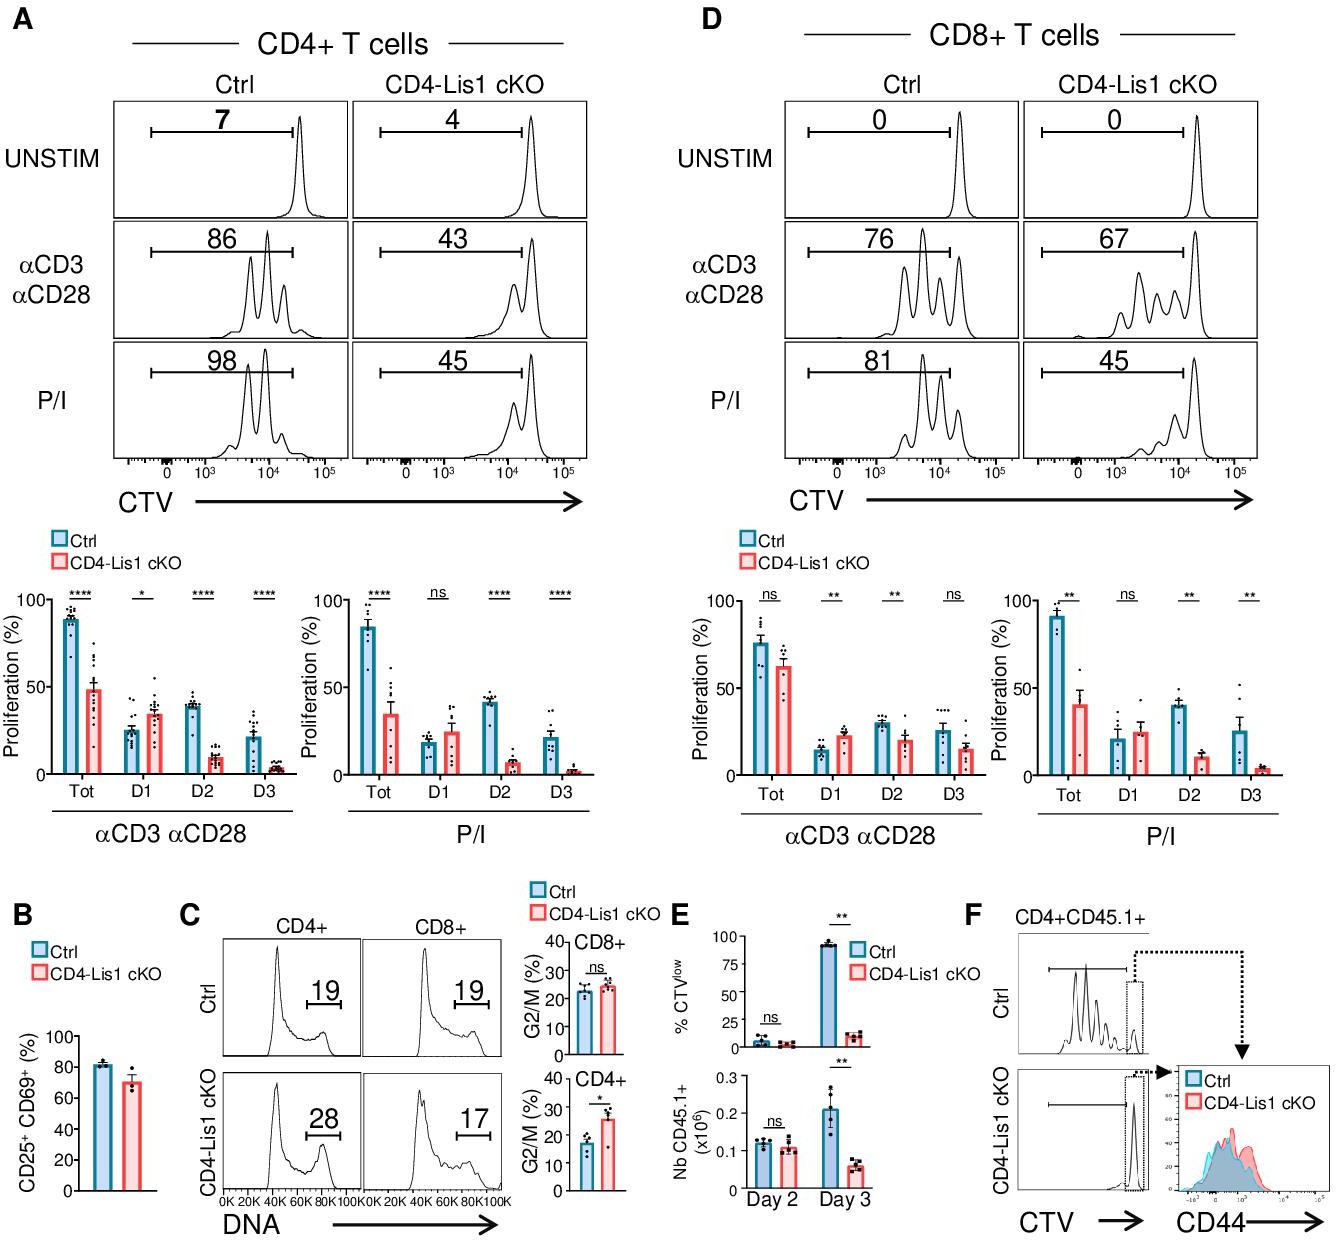
LIS1 is required for the proliferation of CD4+ T cells in response to antigen stimulation.
(A) CD4+ T cells from control and CD4-Lis1 cKO mice were stained with CellTrace violet (CTV) and stimulated with anti-CD3 and anti-CD28 antibodies or with phorbol 12-myristate 13-acetate (PMA) and ionomycin (P/I) for 72 hr. The histogram graphs show CTV dilution. Bar graphs represent the percentages of cells that divided at least one-time (Tot.) or that divided one, two, or three times (D1, D2, D3) as determined by flow cytometry at 72 hr after stimulation. Data are mean ± SD and represent five independent experiments each including n = 3 mice per group. (B) CD4+ T cells from control and CD4-Lis1 cKO mice were stimulated with anti-CD3 and anti-CD28 antibodies for 24 hr. Bar graphs represent the percentages of cells expressing CD25 and CD69 as determined by flow cytometry. Data are mean ± SD and represent two independent experiments each including n = 1–2 mice per group. (C) CD4+ and CD8+ T cells from control and CD4-Lis1 cKO mice were stimulated with anti-CD3 and anti-CD28 antibodies for 48 hr. Histogram graphs show DNA intracellular staining on CD4+ and CD8+ T cells. The indicated percentages represent cells in the G2/M phase of cell cycle. Histogram bars represent the percentages of CD4+ and CD8+ T cells in the G2/M phase of cell cycle. Data are mean ± SD and represent two independent experiments each including n = 3 mice per group. (D) CD8+ T cells from control and CD4-Lis1 cKO mice were stained with CTV and stimulated with anti-CD3 and anti-CD28 antibodies or with PMA and ionomycin (P/I) for 72 hr. The histogram graph shows CTV dilution. Bar graphs represent the percentages of cells that divided at least one-time (Tot.) or that divided one, two,or three times (D1, D2, D3) as determined by flow cytometry at 72 hr after stimulation. (E, F) C57BL/6j mice (CD45.2+) were injected i.v. with CTV-stained CD45.1+CD4+ T cells from OT2 and OT2 CD4-Lis1 cKO mice. Mice were then immunized with ovalbumin emulsified in RIBI. Proliferation of CD45.1+CD4+T cells was analyzed at days 2 and 3 after immunization. (E) Bar graphs represent the proliferation and numbers of CD45.1+CD4+T cells as determined by flow cytometry at days 2 and 3 after immunization. Data are mean ± SD and are representative of one experiment out of two independent experiments each including n = 5 mice per group. (F) The histogram graph shows CTV dilution in CD45.1+CD4+T cells at day 3 after immunization. Histograms overlay shows CD44 surface staining on undivided CD45.1+CD4+T cells at day 3 after immunization. Data are representative of one experiment out of two independent experiments each including n = 5 mice per group. Unpaired two-tailed Mann–Whitney t tests were performed for all analyses. *p<0.05; **p<0.01; ***p<0.001; ****p<0.0001.
-
Figure 3—source data 1
LIS1 is required for the proliferation of CD4+ T cells in response to antigen stimulation.
- https://cdn.elifesciences.org/articles/80277/elife-80277-fig3-data1-v2.zip
Figure 3—figure supplement 1
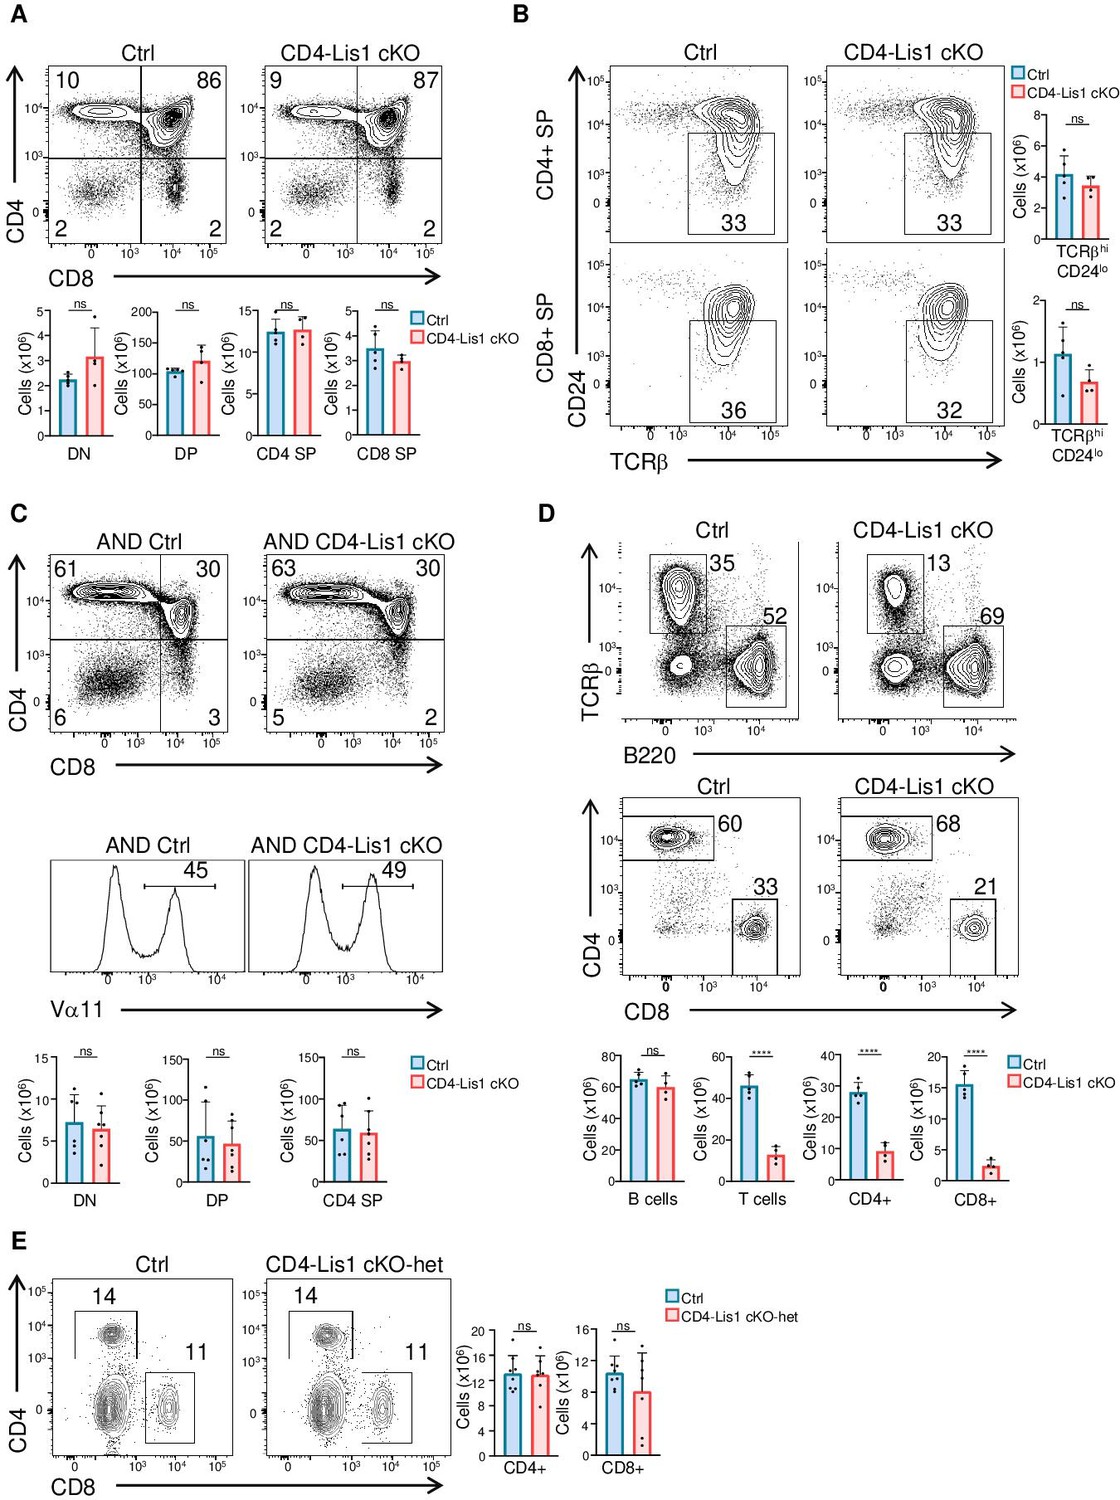
Normal T-cell development in CD4-Lis1 cKO mice.
Phenotypic analyses of thymocytes from control and CD4-Lis1 cKO mice. (A) Dot plots show CD4 versus CD8 surface staining on thymocytes from control and CD4-Lis1 cKO mice. Histogram bars represent the numbers of thymocytes in each indicated subset from mice of the indicated genotype. Data are mean ± SD and represent two independent experiments each including n = 2–3 mice per group. (B) Dot plots show CD24 versus TCRβ surface staining on CD4+ SP and CD8+ SP thymocytes from control and CD4-Lis1 cKO mice. Histogram bars represent the numbers of thymocytes in the indicated subset from mice of the indicated genotype. Data are mean ± SD and represent two independent experiments each including n = 2 mice per group. (C) Dot plots show CD4 versus CD8 surface staining on thymocytes from control and CD4-Lis1 cKO mice expressing the AND TCR transgene. Histogram graphs represent the TCR Vα11 surface staining on total thymocytes. Histogram bars represent the numbers of thymocytes in each indicated subset from mice of the indicated genotype. Data are mean ± SD and represent two independent experiments each including n = 2–3 mice per group. (D) Dot plots show TCR versus B220 and CD4 versus CD8 surface staining on total splenocytes and splenic T cells, respectively, from control and CD4-Lis1 cKO mice. Histogram bars represent the numbers of cells in each indicated subset from mice of the indicated genotype. Data are mean ± SD and represent two independent experiments each including n = 2–3 mice per group. (E) Dot plots show CD4 versus CD8 surface staining on splenocytes from control (pagah1b1flox/+) and CD4-Lis1 cKO-het mice. Histogram bars represent the numbers of cells in each indicated subset from mice of the indicated genotype. Data are mean ± SD and represent two independent experiments each including n = 3–4 mice per group. *p<0.05; **p<0.01; ***p<0.001; ****p<0.0001.
-
Figure 3—figure supplement 1—source data 1
Normal T-cell development in CD4-Lis1 cKO mice.
- https://cdn.elifesciences.org/articles/80277/elife-80277-fig3-figsupp1-data1-v2.zip
Figure 3—figure supplement 2
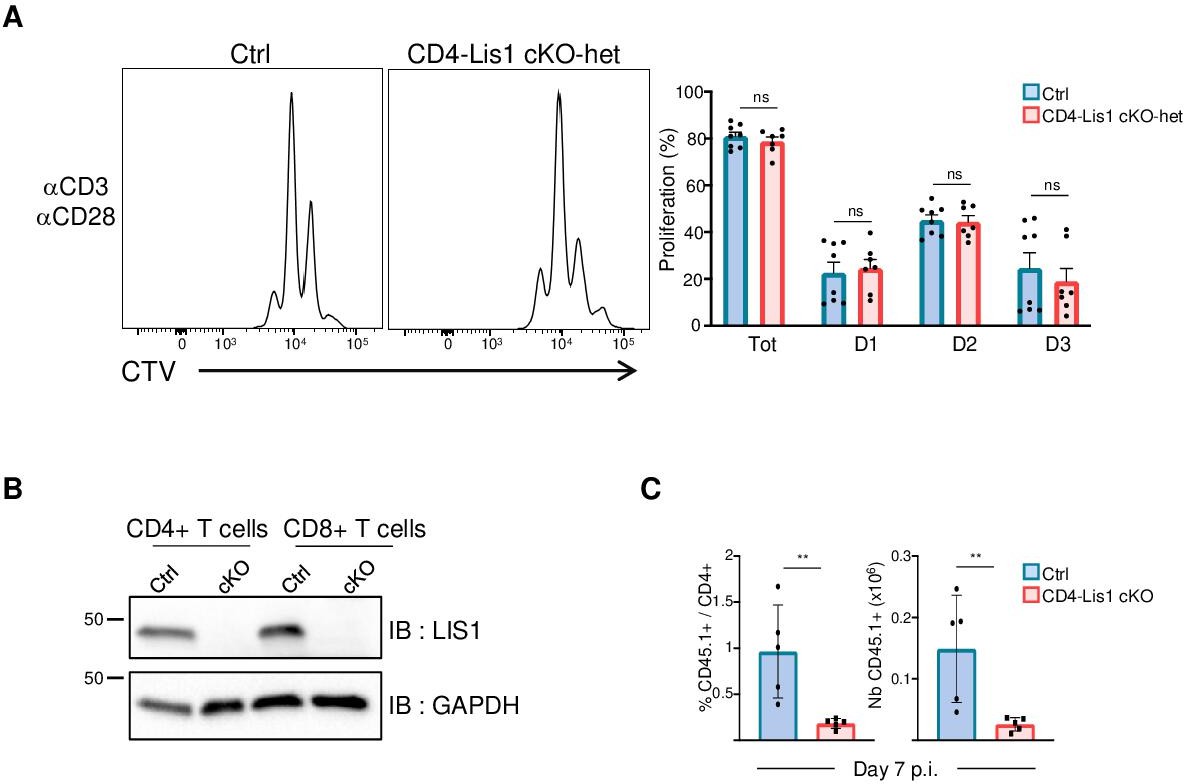
Effect of LIS1 haploid and diploid deficiency on CD4+ T-cell proliferation and expansion.
(A) CD4+ T cells from control (Pafah1flox/+) and CD4-Lis1 cKO-het were stained with CellTrace violet (CTV) and stimulated with anti-CD3 and anti-CD28 antibodies for 48 hr. The histogram graphs show CTV dilution. Bar graphs represent the percentages of cells that divided at least one-time (Tot.) or that divided one, two, or three times (D1, D2, D3) as determined by flow cytometry at 72 hr after stimulation. Data are mean ± SD and represent two independent experiments each including n = 4 mice per group. (B) Total cytoplasmic extracts of CD4+ and CD8+ T cells from control and CD4-Lis1 cKO mice were analyzed by Western blotting with antibodies against LIS1 and GAPDH, the loading control. (C) Bar graphs represent the percentages and numbers of CD45.1+CD4+ T cells as determined by flow cytometry at day 7 after immunization. Data are mean ± SD and are representative of one experiment including n = 5 mice per group. **p<0.01.
-
Figure 3—figure supplement 2—source data 1
Effect of LIS1 haploid and diploid deficiency on CD4+ T-cell proliferation and expansion.
- https://cdn.elifesciences.org/articles/80277/elife-80277-fig3-figsupp2-data1-v2.zip
Figure 4
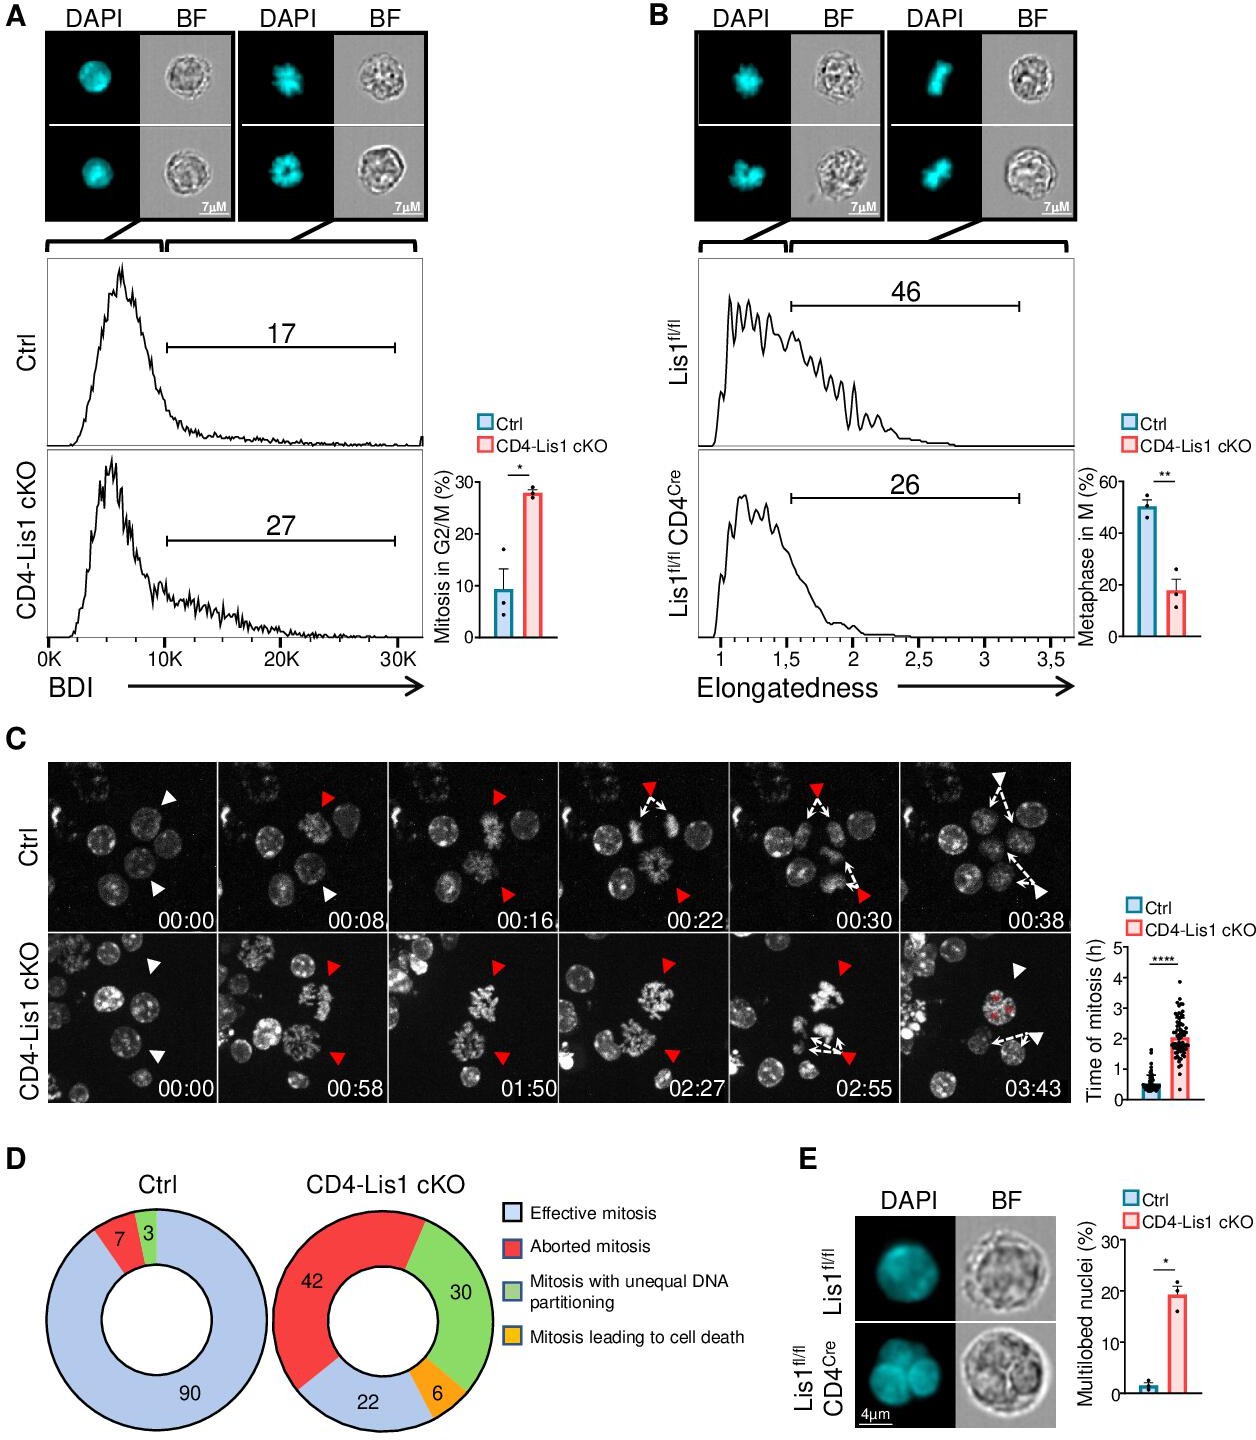
Dysfunctional chromosome alignment in LIS1-deficient CD4+ T cells leads to abortive mitosis and aneuploidy.
(A) CD4+ T cells from control and CD4-Lis1 cKO mice were stimulated with anti-CD3 and anti-CD28 antibodies for 48 hr. Histogram graphs represent the Bright Detail Intensity (BDI) feature on CD4+ T cells in the G2/M phase as determined by image stream flow cytometry. Numbers represent the percentages of cells in mitosis according to the BDI feature. Images represent DAPI staining in BDIlow and BDIhi control CD4+ T cells. Bar graphs represent the percentages of cells in mitosis (M) out of cells in the G2/M phase (n = 30,000 cells). Data are mean ± SD and represent three independent experiments each including n = 1 mouse per group. (B) CD4+ T cells from control and CD4-Lis1 cKO mice were stimulated with anti-CD3 and anti-CD28 antibodies for 24 hr, synchronized with nocodazole for 18 hr and incubated with MG132 for 3 hr to induce metaphase arrest. Histogram graphs represent the Elongatedness feature on CD4+ T cells in the M phase as determined by image stream flow cytometry. Numbers represent the percentages of cells in metaphase according to Elongatedness feature (n = 30,000 cells). Images represent DAPI staining in Elongatednesslow and Elongatednesshi control CD4+ T cells. Bar graphs represent the percentages of cells in metaphase out of cells in the M phase. Data are mean ± SD and represent three independent experiments each including n = 1 mouse per group. (C) Time-lapse microscopy analysis of cell division in CD4+ T cells from control and CD4-Lis1 cKO mice stimulated with anti-CD3 and anti-CD28 antibodies. Images represent DNA staining on CD4+ T cells at the indicated times (hours:minutes). White arrows represent cells with uncondensed DNA. Red arrows represent the same cells after chromosomes formation. The top red arrows in the CD4-Lis1 cKO panel are representative of abortive mitosis. The bottom red arrows in the CD4-Lis1 cKO panel are representative of mitosis leading to aneuploidy. Bar graphs represent the time of mitosis per cell. Data are mean ± SD and represent three independent experiments each including n = 1 mouse per group. (D) Mitosis outcomes in control and CD4-Lis1 cKO CD4+ T cells stimulated with anti-CD3 and anti-CD28 antibodies. Numbers represent percentages in the different section out of a total of n = 62–64 mitosis analyzed. Data represent three independent experiments each including n = 1 mouse per group. (E) CD4+ T cells from control and CD4-Lis1 cKO mice were stimulated with anti-CD3 and anti-CD28 antibodies for 48 hr. Cells in G2 phase were analyzed by image stream flow cytometry. Cells stained with DAPI and bright-field (BF) images are represented. Bar graphs represent the percentages of cells with multilobed nuclei (n = 400 cells). Data are mean ± SD and represent three independent experiments each including n = 1 mouse per group. (A, B) Unpaired two-tailed Welch t tests were performed. (C) Unpaired two-tailed Mann–Whitney t test was performed. *p<0.05; **p<0.01; ***p<0.001; ****p<0.0001.
-
Figure 4—source data 1
Dysfunctional chromosome alignment in LIS1-deficient CD4+ T cells leads to abortive mitosis and aneuploidy.
- https://cdn.elifesciences.org/articles/80277/elife-80277-fig4-data1-v2.zip
Figure 5
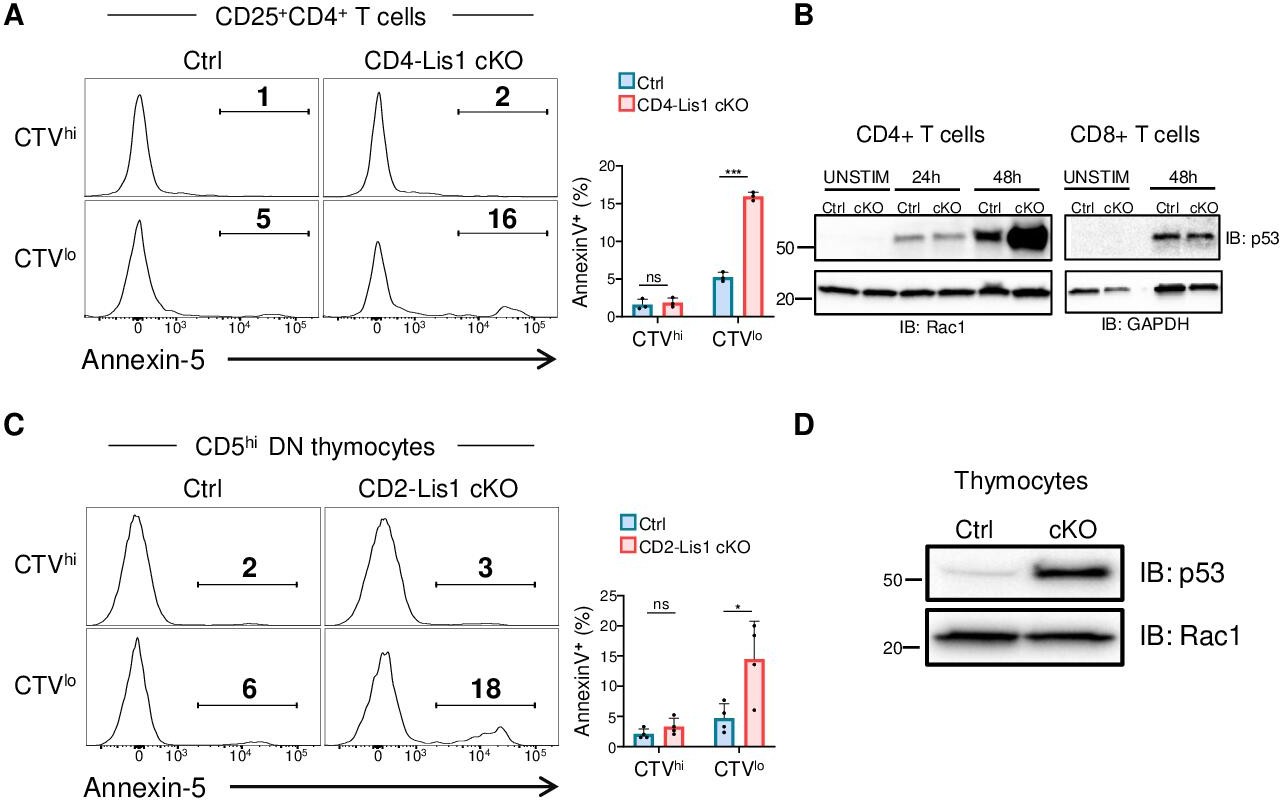
Proliferation leads to p53 upregulation and apoptosis in LIS1-deficient thymocytes and CD4+ T cells.
(A) CD4+ T cells from control and CD4-Lis1 cKO mice were stained with CellTrace violet (CTV) and stimulated with anti-CD3 and anti-CD28 antibodies for 48 hr. The histogram graphs show annexin-5 staining on CTVhi (top panel) and CTVlow (bottom panel) CD25+CD4+T cells. Bar graphs represent the percentages of annexin5+ cells in the indicated subsets. Data are mean ± SD and represent two independent experiments each including n = 1–2 mice per group. (B) Total CD4+ and CD8+ T cells from control and CD4-Lis1 cKO mice were stimulated with anti-CD3 and anti-CD28 antibodies for the indicated times. Total cytoplasmic extracts of the cells were then analyzed by Western blotting with antibodies against p53, Rac1, and GAPDH, the loading controls. Data are representative of two independent experiments. (C) CD5lo DN3 thymocytes from control and CD2-Lis1 cKO mice were stained with CTV and stimulated with OP9-Dl1 cells for 48 hr. The histogram graphs show annexin-5 staining on CTVhi (top panel) and CTVlow (bottom panel) CD5hiCD4+ T cells. Bar graphs represent the percentages of annexin5+ cells in the indicated subsets. Data are mean ± SD and represent two independent experiments each including n = 2 mice per group. (D) Total cytoplasmic extracts of the DN thymocytes were analyzed by Western blotting with antibodies against p53 and Rac1, the loading control. Data are representative of two independent experiments. Unpaired two-tailed Welch t tests were performed in (A, C). *p<0.05; ***p<0.001.
-
Figure 5—source data 1
Proliferation leads to p53 upregulation and apoptosis in LIS1-deficient thymocytes and CD4+ T cells.
- https://cdn.elifesciences.org/articles/80277/elife-80277-fig5-data1-v2.zip
Figure 6
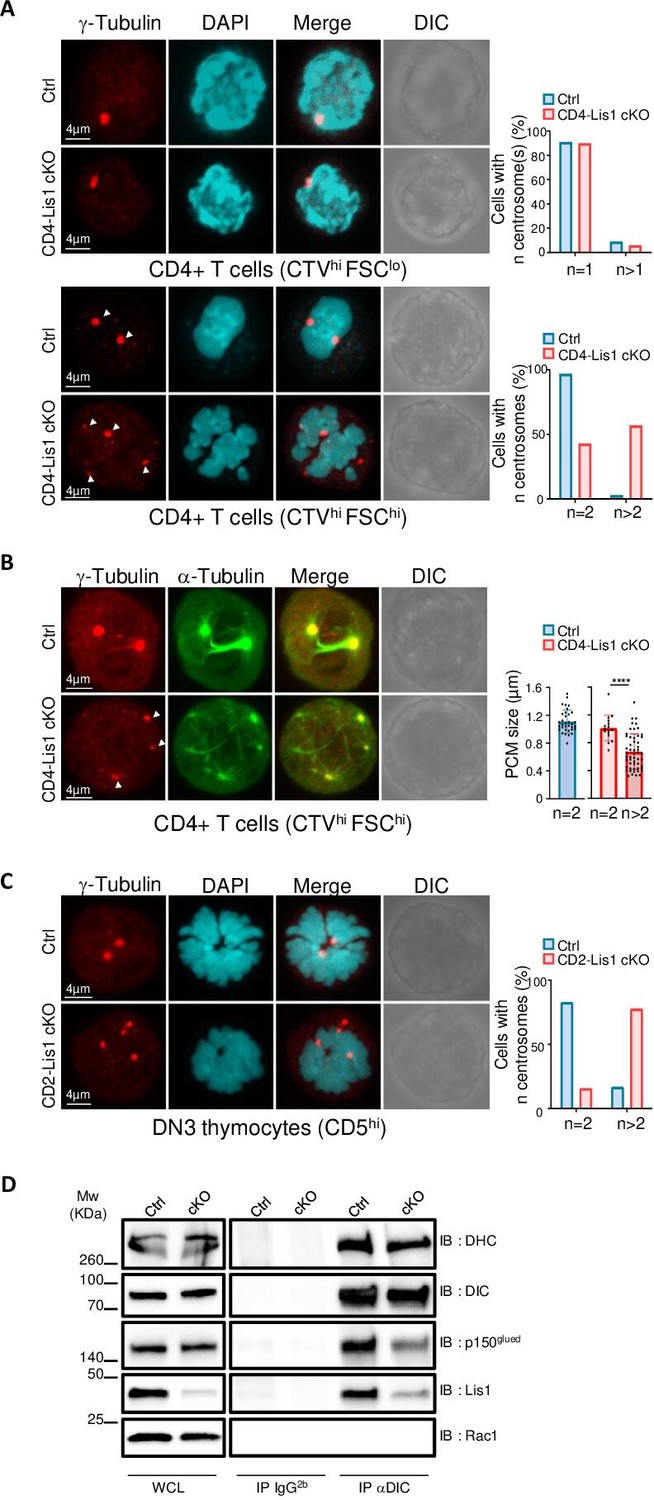
Impaired formation of dynein/dynactin complexes is associated with the loss of centrosome integrity and the formation of multipolar spindles in LIS-1-deficient thymocytes and CD4+ T cells.
(A) CD4+ T cells from control and CD4-Lis1 cKO mice were stained with CellTrace violet (CTV) and stimulated with anti-CD3 and anti-CD28 antibodies for 48 hr. Images represent maximum intensity projection of γ-tubulin and DAPI staining on undivided FSClo (top panel) and FSChi (bottom panel) CD4+ T cells. Bar graphs represent the percentages of cells with the indicated number of centrosome in total cells (top graph) or in mitotic cells (bottom graph). Data represent one experiment out of two independent experiments with n = 30–50 cells analyzed per group. (B) CD4+ T cells from control and CD4-Lis1 cKO mice were stained with CTV and stimulated with anti-CD3 and anti-CD28 antibodies for 48 hr. Images represent maximum intensity projection of γ-tubulin and α-tubulin staining on undivided FSChi CD4+ T cells. Bar graphs represent the size of the pericentriolar region (PCM) based on γ-tubulin staining in mitotic cells with the indicated number of centrosomes. Data represent three experiments with n = 16–54 centrosomes analyzed per group. (C) Images represent maximum intensity projection of γ-tubulin and DAPI staining CD5hi DN3 thymocytes. Bar graphs represent the percentages of cells with the indicated number of centrosomes in mitotic cells. Data represent one experiment out of two independent experiments with n = 30–50 cells analyzed per group. (D) CD4+ T cell extracts from control and CD4-Lis1 cKO mice were subjected to immunoprecipitation (IP) with antibodies specific of the intermediate chain of dynein (DIC) or with an IgG2b isotype control and then analyzed by Western blotting with antibodies specific of the indicated proteins (dynein heavy chain [DHC]). Data represent one experiment out of two independent experiments. Unpaired two-tailed Mann–Whitney t test was performed. ****p<0.0001.
-
Figure 6—source data 1
Impaired formation of dynein/dynactin complexes is associated with the loss of centrosome integrity and the formation of multipolar spindles in LIS-1 deficient thymocytes and CD4+ T cells.
- https://cdn.elifesciences.org/articles/80277/elife-80277-fig6-data1-v2.zip
Author response image 1
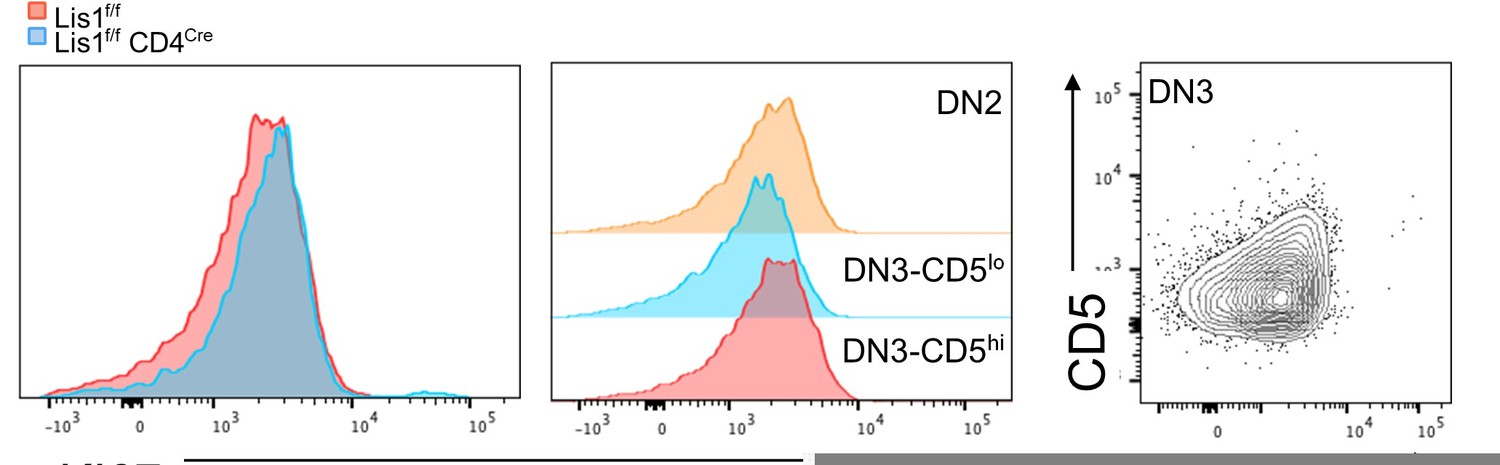
KI67 expression profile in thymocytes from Lis1flox/flox and CD2-Cre Lis1flox/flox mice.
Left panel. Histogram overlay represent KI67 staining on DN3-CD5hi thymocytes from Lis1flox/flox and CD2-Cre Lis1flox/flox mice. Middle panel. Histograms represent KI67 staining on the indicated thymocyte subsets from Lis1flox/flox (WT) mice. Right panel. Dot plot represent CD5 versus Ki67 staining on DN3 thymocytes.
Videos
Video 1
Time-lapse microscopy of mitosis in wild-type CD4+ T cells.
Time-lapse microscopy analysis of mitosis in CD4+ T cells from wild-type mice stimulated with anti-CD3 and anti-CD28 antibodies. Videos represent DNA staining (right panel) and bright field (left panel) on CD4+ T cells.
Video 2
Time-lapse microscopy of abortive mitosis in Lis1-deficient CD4+ T cells.
Time-lapse microscopy analysis of mitosis in CD4+ T cells from CD4-Lis1 cKO mice stimulated with anti-CD3 and anti-CD28 antibodies. Videos represent DNA staining (right panel) and bright field (left panel) on CD4+ T cells.
Video 3
Time-lapse microscopy of mitosis with aneuploidy in Lis1-deficient CD4+ T cells.
Time-lapse microscopy analysis of mitosis in CD4+ T cells from CD4-Lis1 cKO mice stimulated with anti-CD3 and anti-CD28 antibodies. Videos represent DNA staining (right panel) and bright field (left panel) on CD4+ T cells.
Tables
Key resources table
| Reagent type (species) or resource | Designation | Source or reference | Identifiers | Additional information |
|---|---|---|---|---|
| Genetic reagent (Mus musculus) | 129S-Pafah1b1tm2Awb/J | Jackson Laboratories | Strain #:008002; RRID:IMSR_JAX:008002 | This stain was provided by Dr. Deanna S. Smith (University of South Carolina, Columbia, USA) |
| Genetic reagent (Mus. musculus) | B6.Cg-Tg(CD2-icre)4Kio/J | Jackson Laboratories | Strain #:008520; RRID:IMSR_JAX:008520 | |
| Genetic reagent (M. musculus) | Tg(Cd4-cre)1Cwi/BfluJ | Jackson Laboratories | Strain #:017336; RRID:IMSR_JAX:017336 | |
| Cell line (M. musculus) | OP9-dl1 | Schmitt et al., 2004 | Provided by Dr. Sophie Laffont Pradines (Toulouse Institute for Infectious and Inflammatory Diseases, Toulouse France) | |
| Antibody | Anti-CD3ε (hamster monoclonal) | BioLegend | Clone 2C-11 | Purified unconjugated |
| Antibody | Anti-CD28 (hamster monoclonal) | BioLegend | Clone 37.51 | Purified unconjugated |
| Antibody | Anti-CD8α (rat monoclonal) | Thermo Fisher Scientific | Clone 53-6.7 | Conjugated to A-700 (1/300) |
| Antibody | Anti-CD4 (rat monoclonal) | BD Biosciences | Clone RM4-5 | Conjugated to Pacific Blue (1/1000) |
| Antibody | Anti-CD24 (rat monoclonal) | BioLegend | Clone M1/69 | Conjugated to PE (1/500) |
| Antibody | Anti-TCRβ (hamster monoclonal) | BD Biosciences | Clone H57-597 | Conjugated to FITC (1/400) |
| Antibody | Anti-TCRβ (hamster monoclonal) | Thermo Fisher Scientific | Clone H57-597 | Conjugated to PECy7 (1/1500) |
| Antibody | Anti-Vα11 (rat monoclonal) | BD Biosciences | Clone RR8-1 | Conjugated to FITC (1/400) |
| AntibodyA | Anti-CD5 (rat monoclonal) | BD Biosciences | Clone 53-7.3 | Conjugated to APC (1/1000) |
| Antibody | Anti-CD5 (rat monoclonal) | Thermo Fisher Scientific | Clone 53-7.3 | Conjugated to FITC (1/1000) |
| Antibody | Anti-CD69 (hamster monoclonal) | BD Biosciences | Clone H1.2F3 | Conjugated to FITC (1/200) |
| Antibody | Anti-B220 (rat monoclonal) | BD Biosciences | Clone RA3-6B2 | Conjugated to PE (1/400) |
| Antibody | Anti-Gr1 (rat monoclonal) | BioLegend | Clone RB6-8C5 | Conjugated to PE (1/300) |
| Antibody | Anti-CD11b (rat monoclonal) | BioLegend | Clone M1/70 | Conjugated to PE (1/200) |
| Antibody | Anti-CD11c (hamster monoclonal) | BioLegend | Clone N418 | Conjugated to PE (1/200) |
| Antibody | Anti-Ter119 (rat monoclonal) | BioLegend | Clone TER119 | Conjugated to PE (1/200) |
| Antibody | Anti-CD3ε (hamster monoclonal) | BioLegend | Clone 145-2C11 | Conjugated to PE (1/200) |
| Antibody | Anti-NK1.1 (mouse monoclonal) | BD Biosciences | Clone PK136 | Conjugated to PE (1/200) |
| Antibody | Anti-TCRγδ (hamster monoclonal) | BD Biosciences | Clone GL3 | Conjugated to (1/200) |
| Antibody | Anti-CD44 (rat monoclonal) | Thermo Fisher Scientific | Clone IM7 | Conjugated to FITC (1/200) |
| Antibody | Anti-CD25 (rat monoclonal) | BD Biosciences | Clone PC61.5 | Conjugated to PercP Cy5.5 (1/300) |
| Antibody | Anti-CD71 (rat monoclonal) | BioLegend | Clone R17217 | Conjugated to PeCy7 (1/400) |
| Antibody | Anti-CD27 (hamster monoclonal) | BD Biosciences | Clone LG.3A10 | Conjugated to APC (1/200) |
| Antibody | Anti-IL-7R (rat monoclonal) | BD Biosciences | Clone A7R34 | Conjugated to A700 (1/500) |
| Antibody | Anti-IL-7R (rat monoclonal) | BD Biosciences | Clone A7R34 | Conjugated to APC (1/400) |
| Antibody | Anti-BCL-2 (hamster monoclonal) | BD Biosciences | Clone 3F11 | Conjugated to FITC (5 μL/105 cells) |
| Antibody | Anti-CD19 (rat monoclonal) | BioLegend | Clone 1D3/CD19 | Conjugated to PercPCY5.5 (1/500) |
| Antibody | Anti-c-kit (rat monoclonal) | BioLegend | Clone 2B8 | Conjugated to PE (1/200) |
| Antibody | Anti-c-kit (rat monoclonal) | BD Biosciences | Clone 2B8 | Conjugated to APC (1/200) |
| Antibody | Anti-IgM (rat monoclonal) | BD Biosciences | Clone RMM-1 | Conjugated to PECy7 (1/300) |
| Antibody | Anti-CD45.1 (mouse monoclonal) | BD Biosciences | Clone A20 | Conjugated to PE (1/500) |
| Antibody | Anti-γ-tubulin (mouse monoclonal) | BioLegend | Clone 14C11 | Purified unconjugated |
| Antibody | Anti-α-tubulin (mouse monoclonal) | Thermo Fisher Scientific | Clone DM1A | Purified unconjugated |
| Antibody | Goat anti-mouse IgG2b | Thermo Fisher Scientific | Cat#A-21147 | Alexa Fluor 555 |
| Antibody | Anti-Dynein IC (mouse monoclonal) | Santa Cruz Biotechnologies | Clone 74-1 | Purified unconjugated |
| Antibody | Anti-LIS1 (rabbit polyclonal) | Santa Cruz Biotechnologies | sc-15319 | Purified unconjugated |
| Antibody | Anti-Dynein HC (rabbit polyclonal) | Santa Cruz Biotechnologies | sc-9115 | Purified unconjugated |
| Antibody | Anti-p150glued (mouse monoclonal) | BD Biosciences | Clone 1/p150Glued | Purified unconjugated |
| Antibody | Anti-p53 (mouse monoclonal) | Cell Signaling | Clone 1C12 | Purified unconjugated |
| Antibody | Anti-Rac1 (mouse monoclonal) | Millipore | Clone 23A8 | Purified unconjugated |
| Other | AnnexinV | BD Biosciences | RRID:AB_2868885 | APC (5 µL/105 cells) |
| Other | AnnexinV binding buffer | BD Biosciences | Cat#556454 | Used for annexinV staining |
| Other | eBioscience Fixable Viability Dye | Thermo Fisher Scientific | Cat#65-0865-14 | eFluor 780 APC-H7 |
| Other | Permeabilization buffer | Thermo Fisher Scientific | Cat#00-8333-56 | Used for intracytoplasmic staining |
| Other | Chambered glass coverslip | IBIDI | Cat#80821 | Used for videomicroscopy analyses |
| Other | Dynabeads Untouched Mouse CD4 Cells Kit | Thermo Fisher Scientific | Cat#11415D | Magnetic beads used for the purification of CD4-CD8- thymocytes as well as CD4+ and CD8+ T cells |
| Other | DAPI | Sigma-Aldrich | Cat#D9542 | 1 mg/mL Nuclear staining for microscopy |
| Other | Hoechst 33342 | Sigma-Aldrich | Cat#14533 | 50 ng/mL Nuclear staining for videomicroscopy |
| Other | Cell trace Violet | Thermo Fisher Scientific | Cat#C34557 | 2 μM Cell tracker used for proliferation analyses |
| Other | DABCO | Sigma-Aldrich | Cat#D27802 | Mounting medium for microscopy |
| Other | Mouse IL-7 | PeproTech | Cat#21-–17 | 10 ng/mL |
| Chemical compound, drug | Nocodazole | Sigma-Aldrich | Cat#M1404 | 100 ng/mL Inhibitor of microtubule polymerization |
| Chemical compound, drug | MG132 | Sigma-Aldrich | Cat#M7449 | 10 μM proteasome inhibitor |
| Chemical compound, drug | Phorbol 12-myristate 13-acetate (PMA) | Sigma-Aldrich | Cat#P8139 | 100 ng/ml T-cell pharmacological stimulator |
| Chemical compound, drug | Ionomycin | Sigma-Aldrich | Cat#I0634 | 100 ng/ml T-cell pharmacological stimulator |
| Chemical compound, drug | RIBI | Sigma Adjuvant System | Cat#S6322 | Adjuvant |
| Software, algorithm | IDEAS | Millipore |
Additional files
Download links
A two-part list of links to download the article, or parts of the article, in various formats.
Downloads (link to download the article as PDF)
Open citations (links to open the citations from this article in various online reference manager services)
Cite this article (links to download the citations from this article in formats compatible with various reference manager tools)
A selective LIS1 requirement for mitotic spindle assembly discriminates distinct T-cell division mechanisms within the T-cell lineage
eLife 11:e80277.
https://doi.org/10.7554/eLife.80277


