Molecular basis for the role of disulfide-linked αCTs in the activation of insulin-like growth factor 1 receptor and insulin receptor
- Department of Biophysics, University of Texas Southwestern Medical Center, United States
- Department of Pathology and Cell Biology, Vagelos College of Physicians and Surgeons, Columbia University, United States
- Department of Cell Biology, University of Texas Southwestern Medical Center, United States
Figures
Figure 1 with 3 supplements
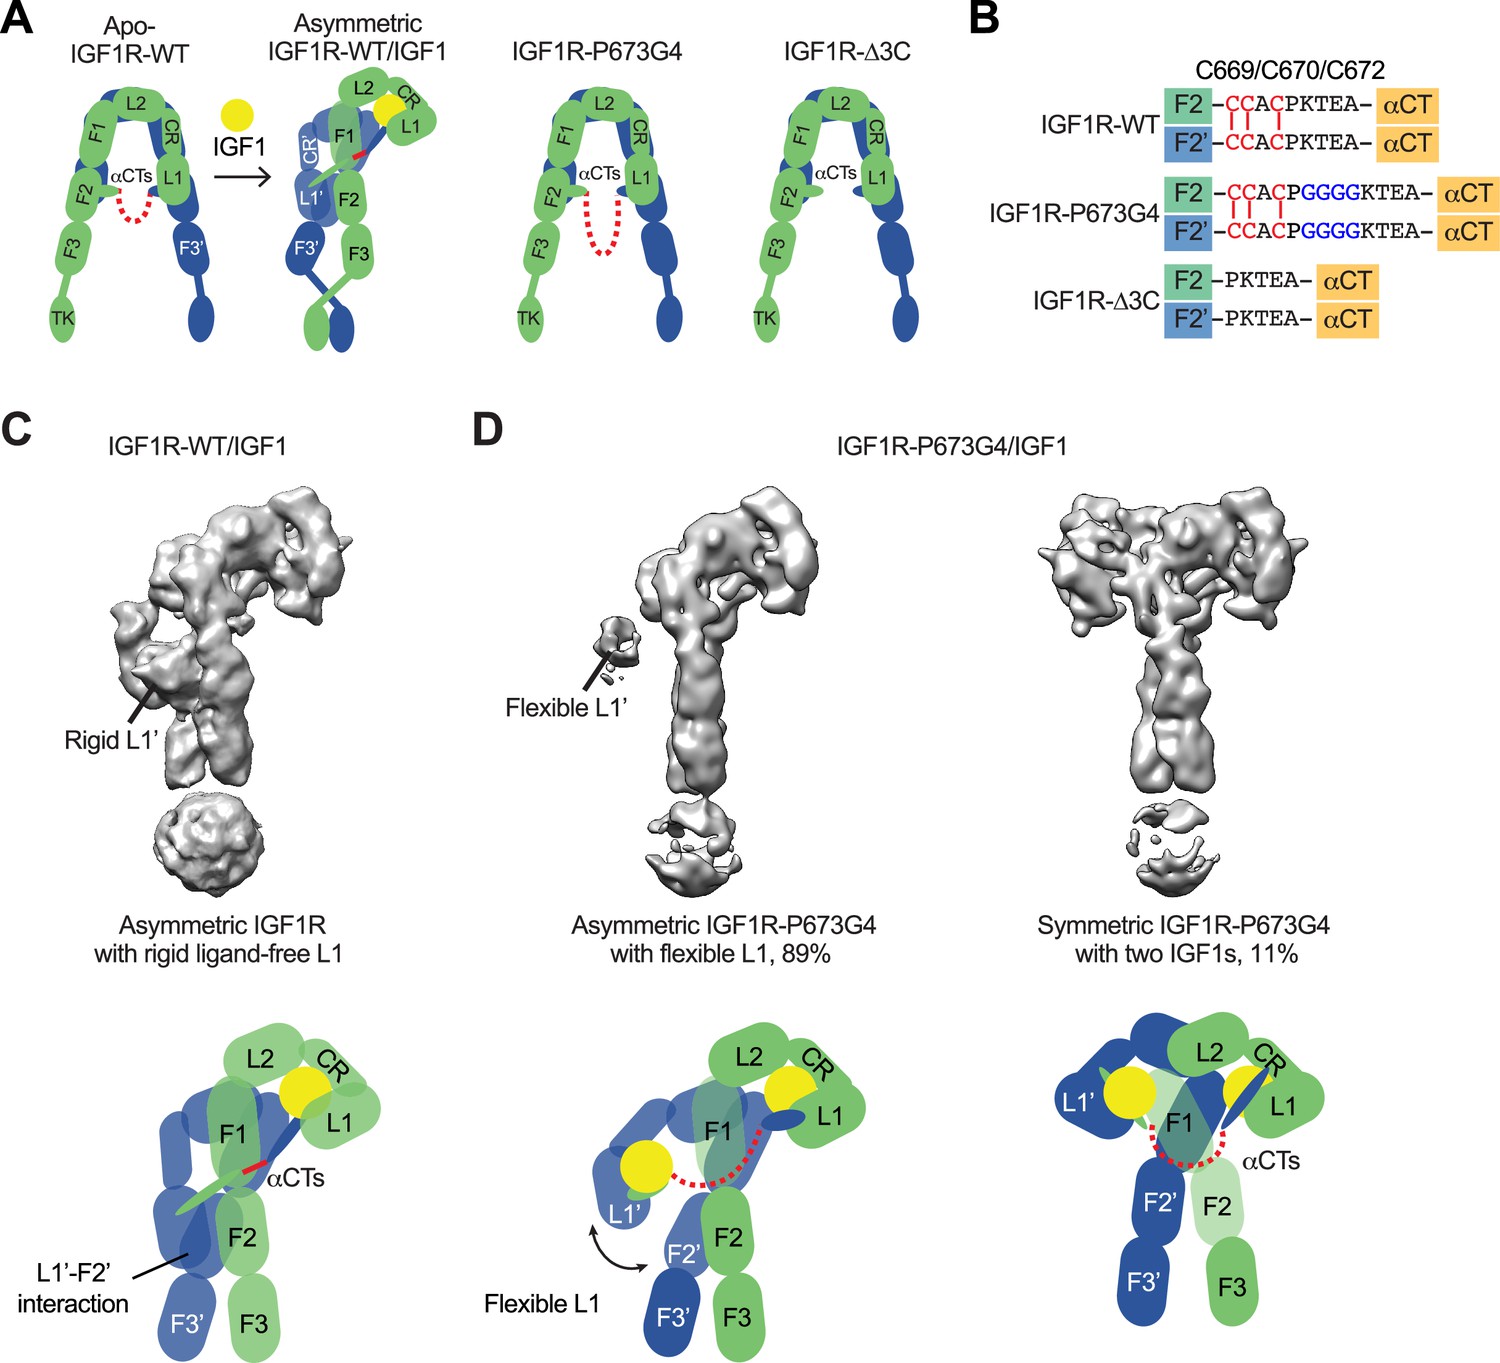
Structures of IGF1R-P673G4 with IGF1 bound.
(A) Cartoon representation of the apo-IGF1R, IGF1R/IGF1 complex showing the IGF1R dimer bound with one IGF1 (left), apo-IGF1R-P673G4 (middle) and apo-IGF1R-Δ3C (right). The two IGF1R protomers are colored in green and blue; the IGF1 is colored in yellow. The name of domain is labeled as follows: Leucine-rich repeat domains 1 and 2 (L1 and L2); cysteine-rich domain (CR); Fibronectin type III-1,–2, and –3 domains (F1, F2, F3), tyrosine kinase (TK) domain, and the C-terminus of the α-subunit (αCT) (referred to the domains in protomers 1 and 2 as L1-TK, and L1’-TK’, respectively). The linker between two αCTs is shown as red dotted line. (B) Sequence of the linker between two αCTs in the IGF1R-WT, IGF1R-P673G4, and IGF1R-Δ3C showing disulfide bonds in red. (C) Cryo-EM density map of the asymmetric IGF1R-WT/IGF1 complex. A cartoon model illustrating the structure (below). Rigid L1’ (L1’-F2’ interaction) is noted. (D) Cryo-EM density maps of the IGF1R-P673G4/IGF1 complex in both asymmetric (left) and symmetric (right) conformations. The asymmetric and symmetric conformations comprise of 89% and 11% of the good particles, respectively. Cartoon models illustrating the structural difference between symmetric and asymmetric conformations (below).
Figure 1—figure supplement 1
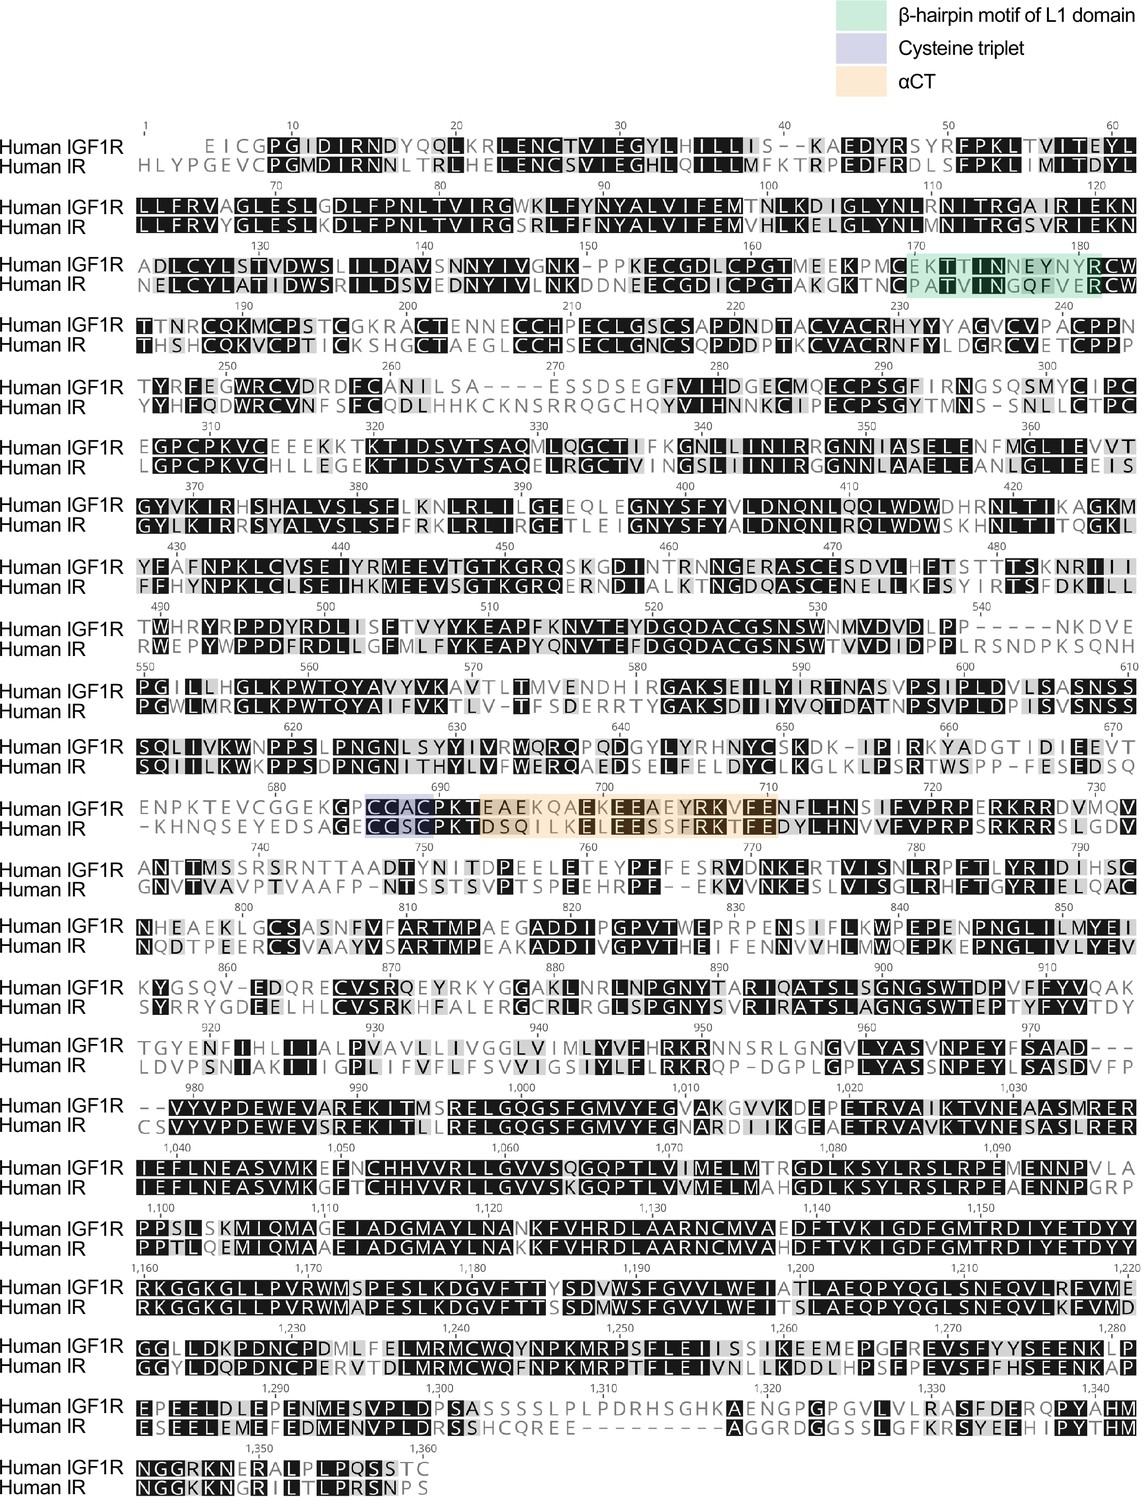
Sequence alignment of human IGF1R and IR.
Figure 1—figure supplement 2
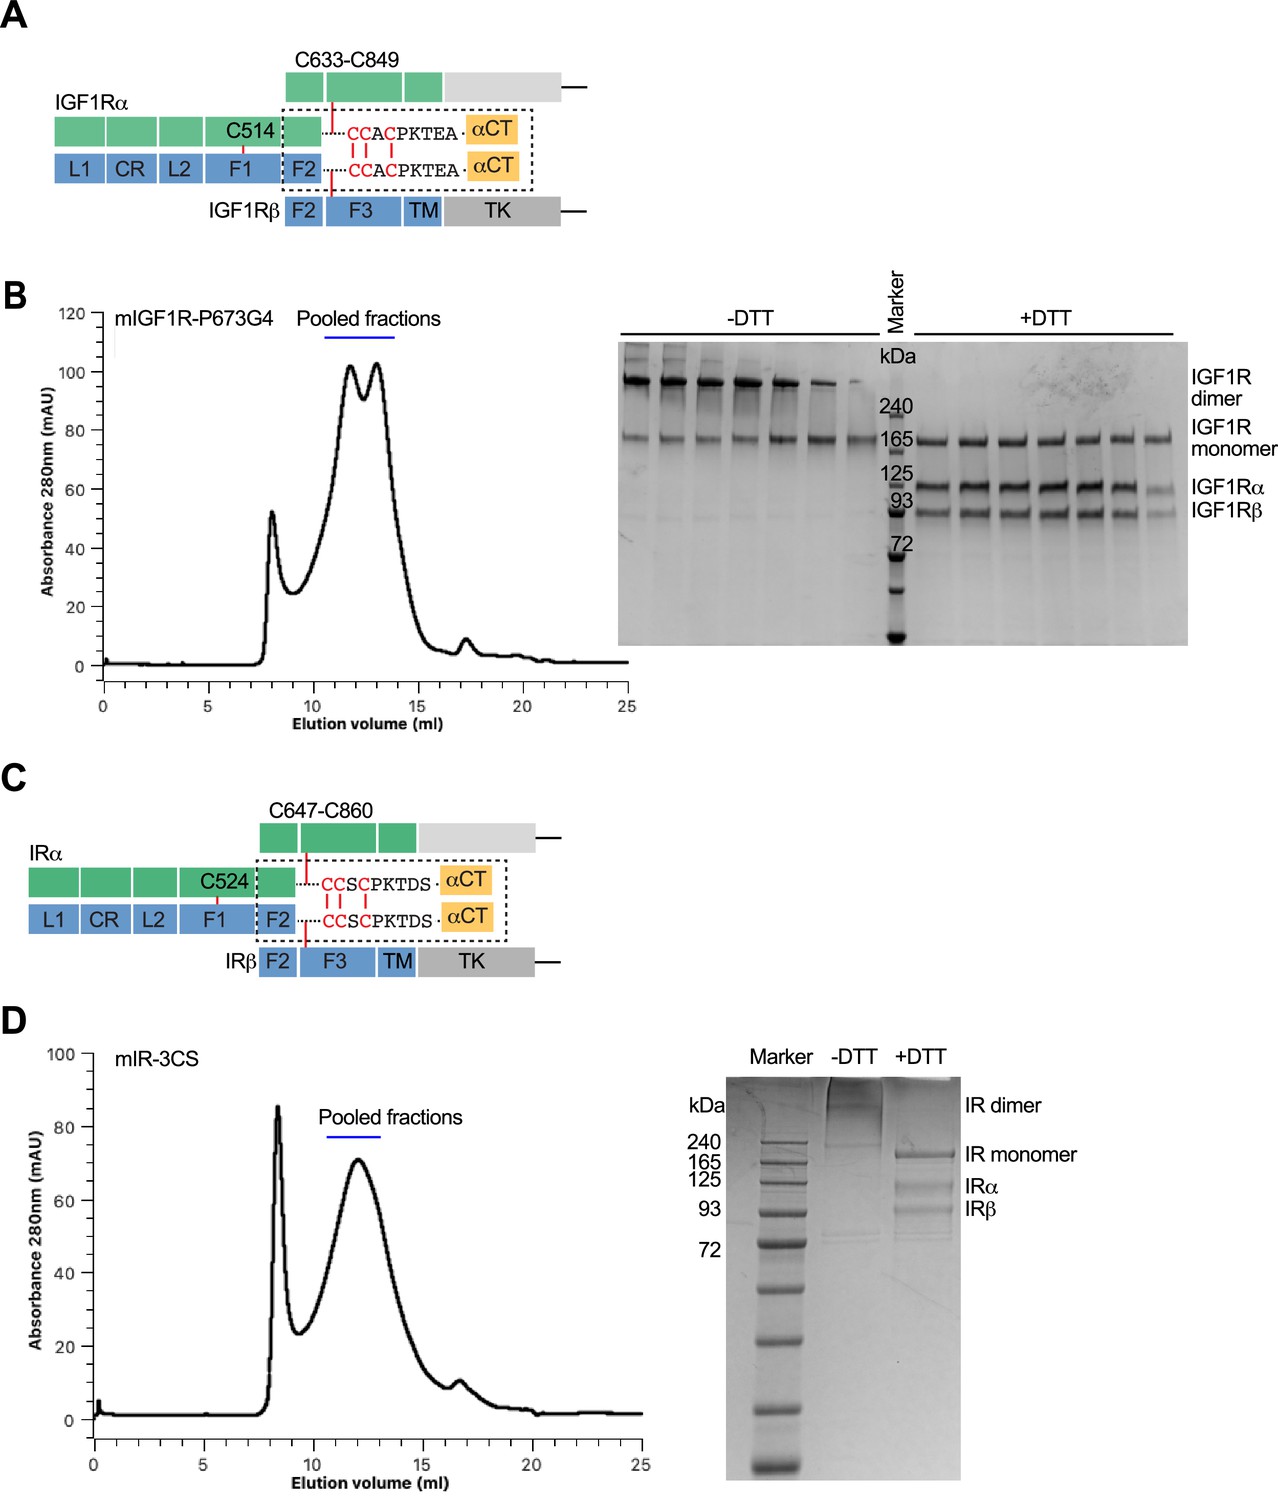
Domains and protein preparation of IGF1R and IR.
(A) Domain organization of IGF1R. A protomer of IGF1R contains L1, CR, L2, FnIII-1, FnIII-2, FnIII-3 (F1, F2, F3), transmembrane (TM), and tyrosine kinase (TK) domains. Each protomer is proteolytically processed into an α-subunit and a β-subunit that remain associated by a disulfide bond, and two protomers are further linked by disulfide bonds to make a mature homodimer. (B) Representative size-exclusion chromatogram of IGF1R. The peak fractions were visualized on SDS-PAGE by Coomassie blue staining in the absence or presence of dithiothreitol (DTT). Source data are presented in Figure 1—figure supplement 2—source data 1. (C) Domain organization of IR. A protomer of IR contains L1, CR, L2, FnIII-1, FnIII-2, FnIII-3 (F1, F2, F3), transmembrane (TM), and tyrosine kinase (TK) domains. Each protomer is proteolytically processed into an α-subunit and a β-subunit that remain associated by a disulfide bond, and two protomers are further linked by disulfide bonds to make a mature homodimer. (D) Representative size-exclusion chromatogram of IR. The peak fractions were visualized on SDS-PAGE by Coomassie blue staining in the absence or presence of DTT. Source data are presented in Figure 1—figure supplement 2—source data 1.
-
Figure 1—figure supplement 2—source data 1
Source data for Figure 1—figure supplement 2B and D.
- https://cdn.elifesciences.org/articles/81286/elife-81286-fig1-figsupp2-data1-v2.zip
Figure 1—figure supplement 3
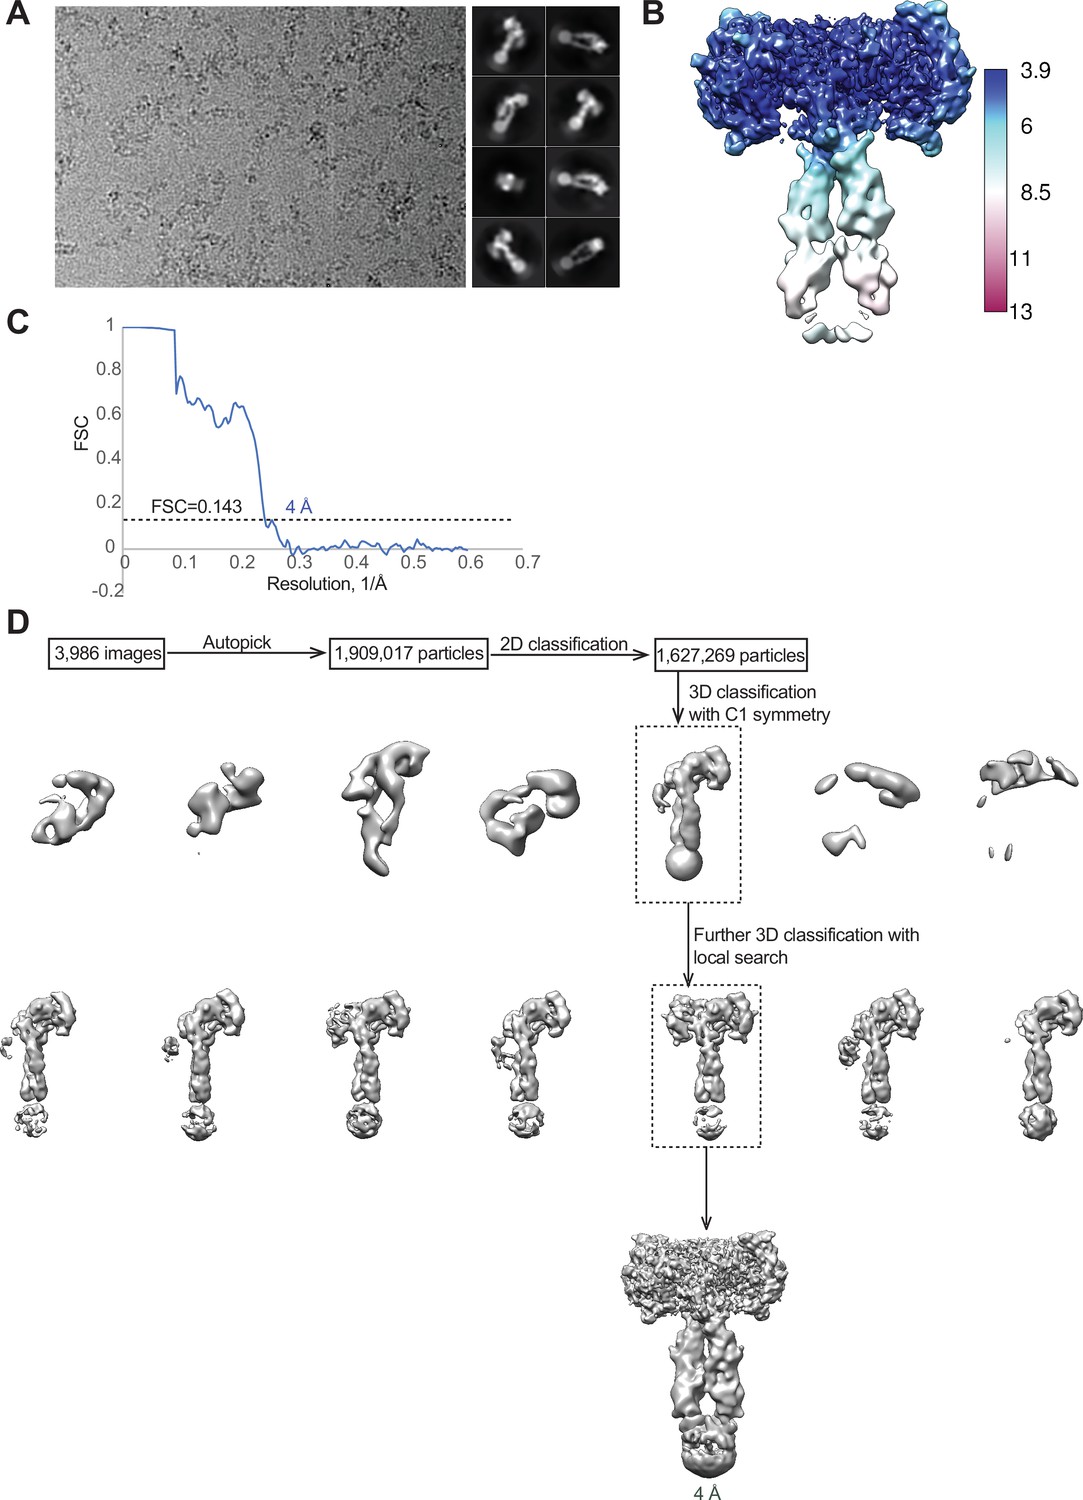
Cryo-EM analysis of the IGF1R-P673G4/IGF1 complex.
(A) A representative electron micrograph and 2D class averages of the IGF1R-P673G4/IGF1 complex. (B) Unsharpened cryo-EM map colored by local resolution. (C) The gold-standard Fourier shell correlation curve (FSC) for the cryo-EM map shown in Figures 1 and 2. (D) Flowchart of cryo-EM data processing.
Figure 2

The T-shaped symmetric IGF1R-P673G4 dimer with two IGF1s bound.
(A) A 3D reconstruction of the IGF1R-P673G4/IGF1 complex in symmetric conformation fitted into a cryo-EM map at 4 Å. (B) Ribbon representation of the symmetric IGF1R-P673G4/IGF1 complex, shown in two orthogonal views. (C) Structural comparisons between apo-IGF1R (PDB: 5U8R), asymmetric IGF1R-WT/IGF1 (PDB: 6PYH), and symmetric IGF1R-P673G4/IGF complexes.
Figure 3
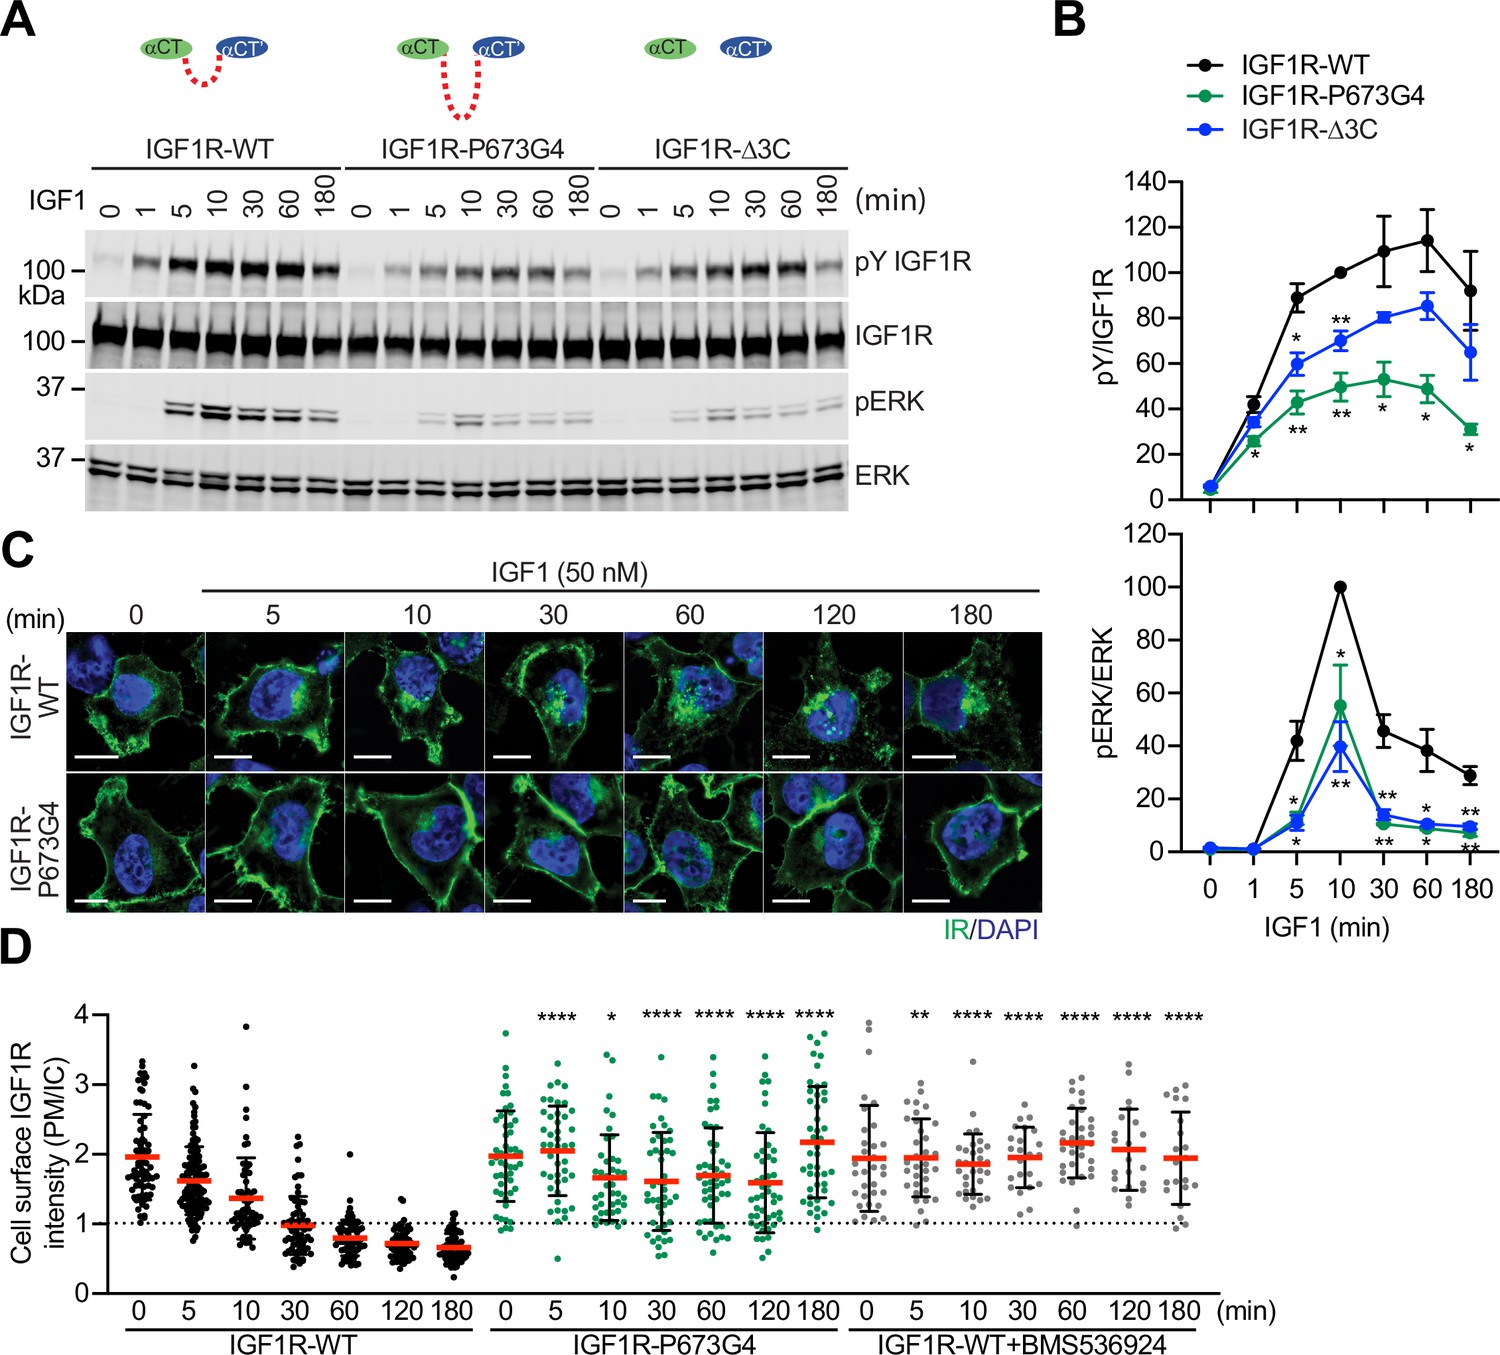
Functional importance of disulfide-linked αCTs on the IGF1R activation.
(A) IGF1-induced IGF1R autophosphorylation and pERK levels in 293 FT cells expressing IGF1R wild-type (WT), IGF1R-P673G4, and IGF1R-Δ3C. Cells were treated with 50 nM IGF1 for the indicated times. Cell lysates were blotted with the indicated antibodies. Source data are presented in Figure 3—source data 1. (B) Quantification of the western blot data shown in A (Mean ± SEM, N=3). Significance calculated using two-tailed student t-test; *p<0.05 and **p<0.01. Source data are presented in Figure 3—source data 2. (C) HeLa cells expressing IGF1R-GFP WT or IGF1R-GFP P673G4 were starved, treated with 50 nM IGF1 for indicated times, and stained with anti-GFP (IGF1R, green) and DAPI (blue). 2 μM BMS536924 were treated for 2 hr prior to IGF1 stimulation. Scale bar, 10 μm. (D) Quantification of the ratios of plasma membrane (PM) and intracellular (IC) IGF1R-GFP signals of cells in C (IGF1R WT0, n=72; WT5, n=118; WT10, n=62; WT30, n=71; WT60, n=71; WT120, n=69; WT180, n=67; P673G4-0, n=50; P673G4-5, n=44; P673G4-10, n=42; P673G4-30, n=46; P673G4-60, n=48; P673G4-120, n=47; P673G4-180, n=45; WT +BMS0, n=32; WT +BMS5, n=33; WT +BMS10, n=31; WT +BMS30, n=23; WT +BMS60, n=33; WT +BMS120, n=21; WT +BMS180, n=21). Mean ± SD; two-tailed student t-test; *p<0.05; **p<0.01; ****p<0.0001. Source data are presented in Figure 3—source data 2.
-
Figure 3—source data 1
Source data for Figure 3A.
- https://cdn.elifesciences.org/articles/81286/elife-81286-fig3-data1-v2.zip
-
Figure 3—source data 2
Source data for Figure 3B and D.
- https://cdn.elifesciences.org/articles/81286/elife-81286-fig3-data2-v2.xlsx
Figure 4 with 2 supplements
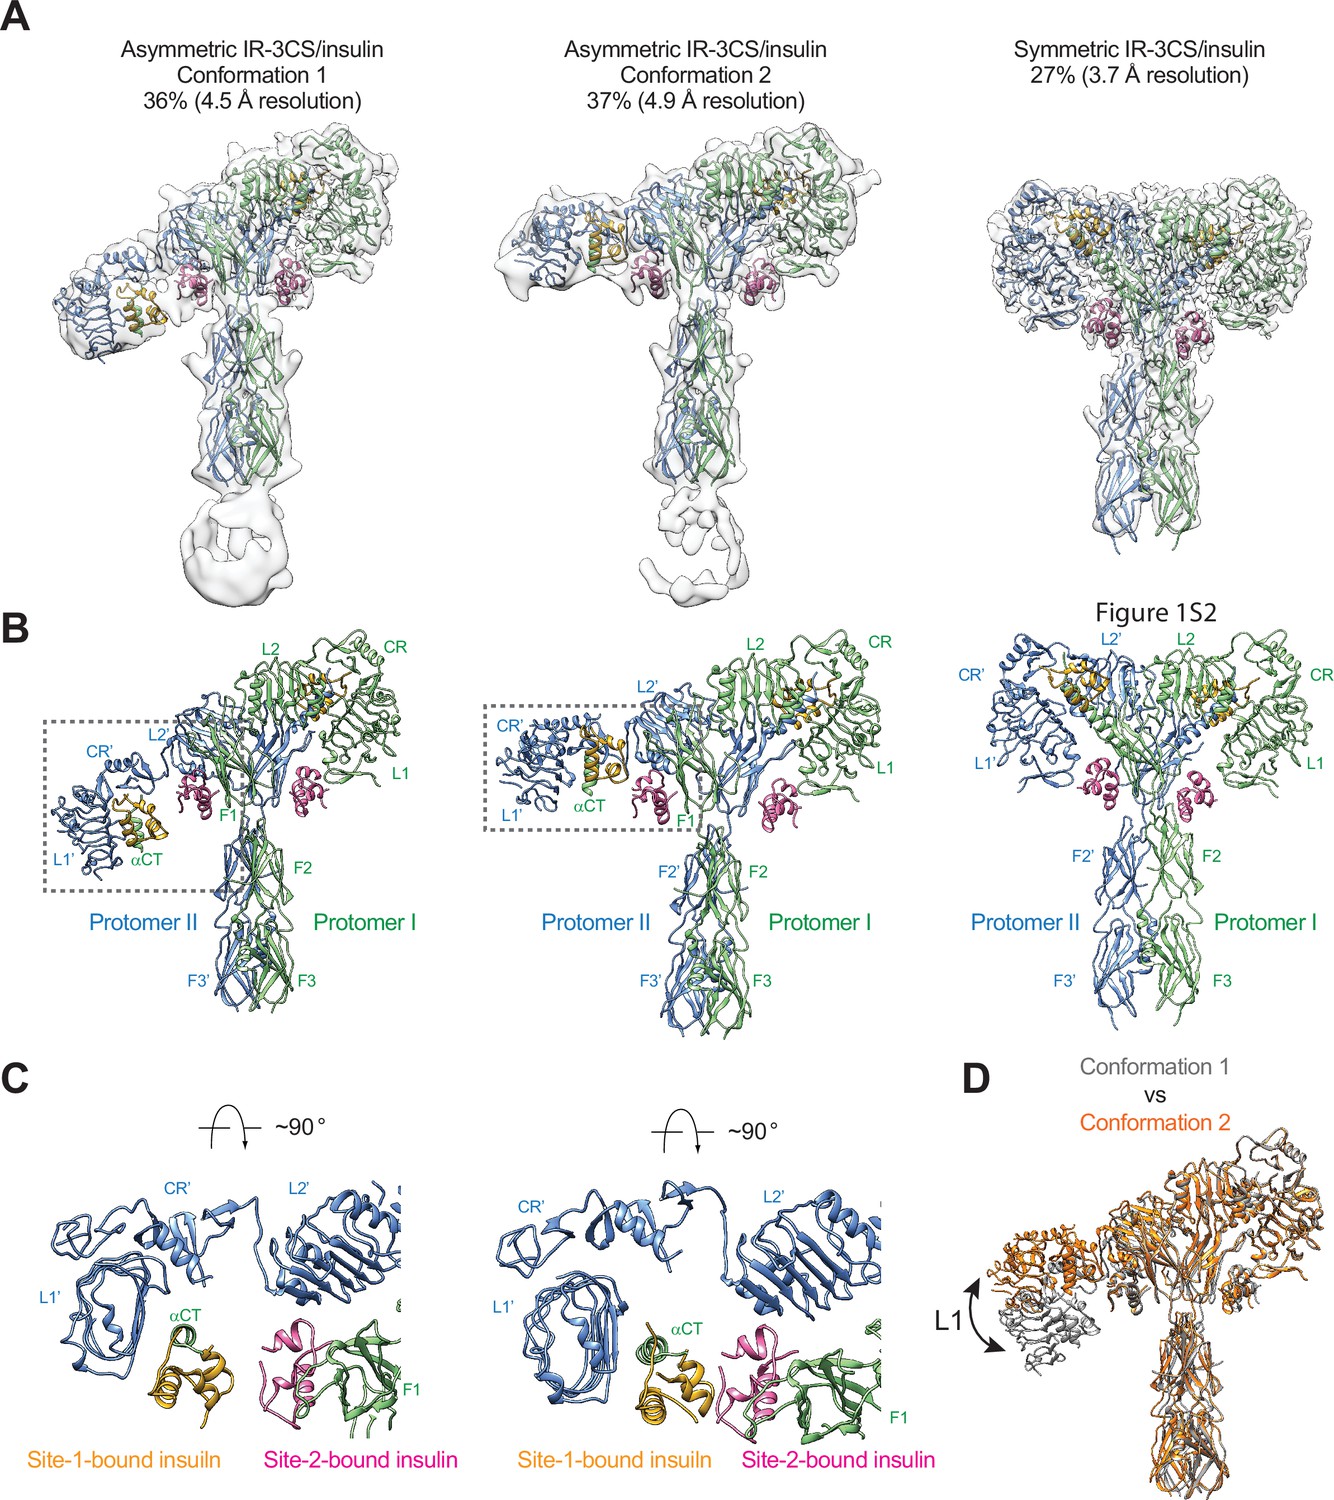
Structures of IR-3CS with insulin bound.
(A) 3D reconstructions of the 2:4 IR-3CS/insulin complexes in both asymmetric and symmetric conformations, and the corresponding ribbon representation. The asymmetric conformations 1 and 2 were fitted into cryo-EM at 4.5 Å and 4.9 Å resolution, respectively. The symmetric conformation was fitted into cryo-EM at 3.7 Å resolution. The asymmetric conformations 1 and 2 were reconstructed from 36% and 37% of the well-defined particles, respectively. The symmetric conformation was reconstructed from 27% of the well-defined particles. (B) Ribbon representations of the asymmetric and symmetric IR-3CS/insulin complexes. (C) Top view of the asymmetric IR-3CS/insulin complexes. The location of this interaction in the asymmetric dimer is indicated by gray boxes in B. (D) Superposition between the asymmetric conformations 1 (gray) and 2 (orange), revealing conformational change of the L1/CR domains (indicated by the arrow).
Figure 4—figure supplement 1
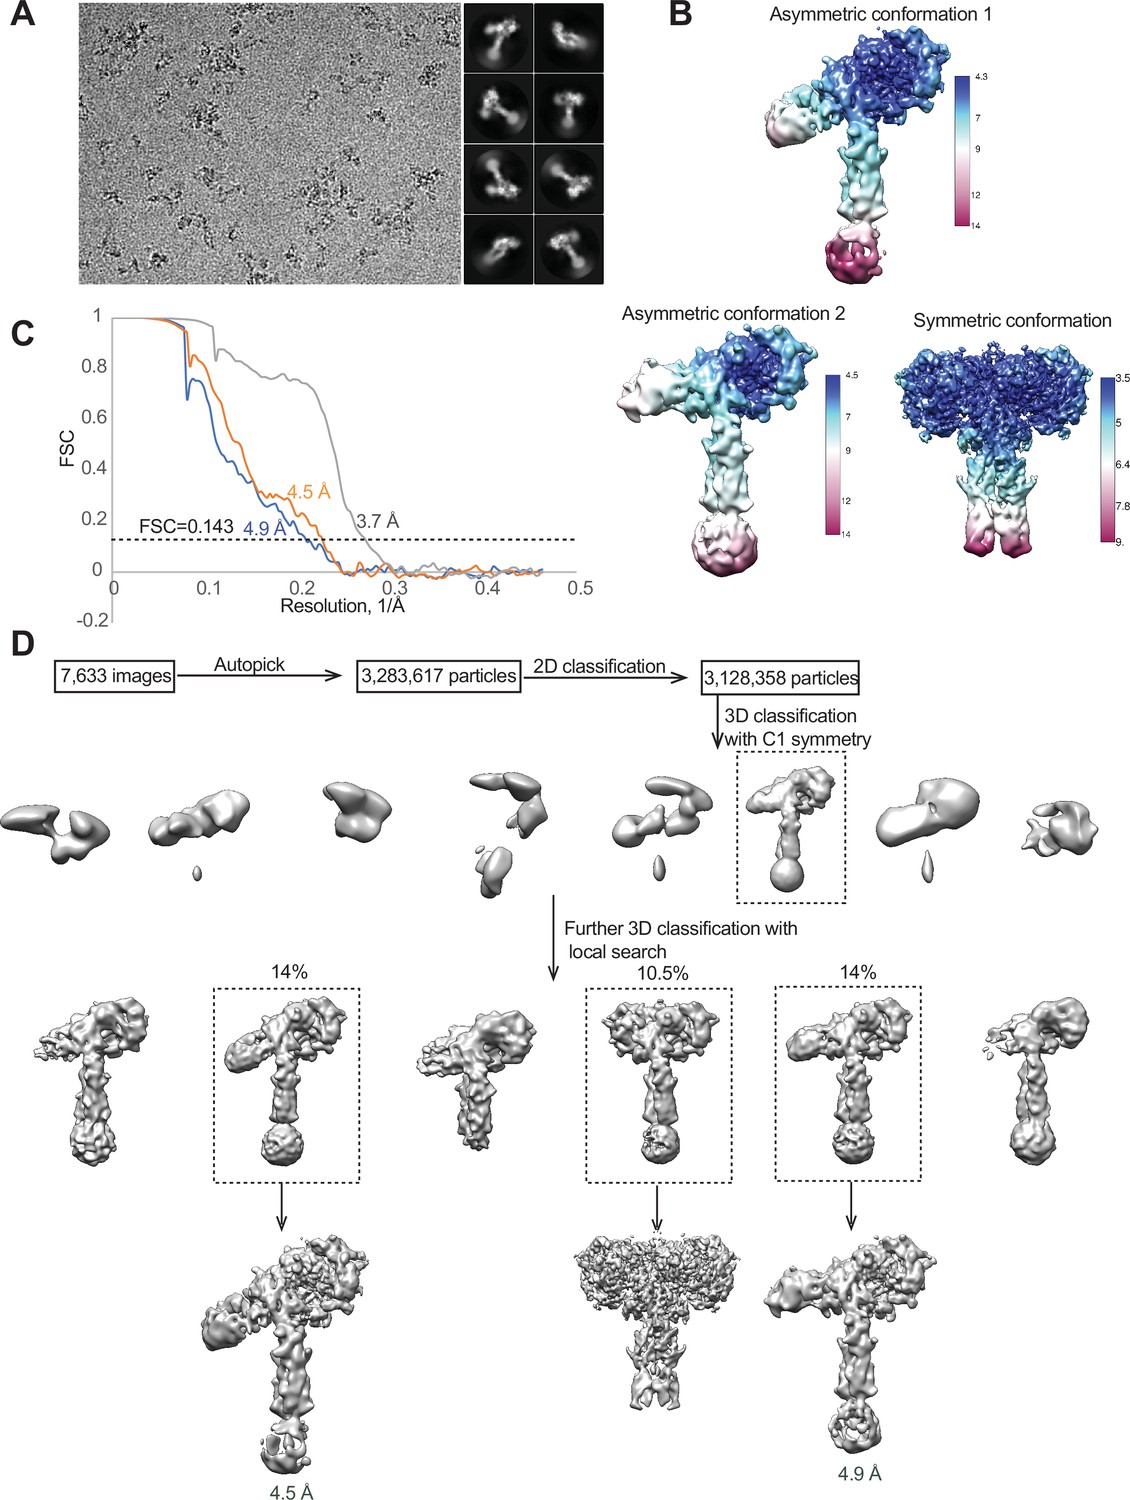
Cryo-EM analysis of the IR-3CS/insulin complex.
(A) A representative electron micrograph and 2D class averages of the IR-3CS/insulin complex. (B) Unsharpened cryo-EM map colored by local resolution. (C) The gold-standard Fourier shell correlation curve (FSC) for the cryo-EM map shown in Figure 4. (D) Flowchart of cryo-EM data processing.
Figure 4—figure supplement 2
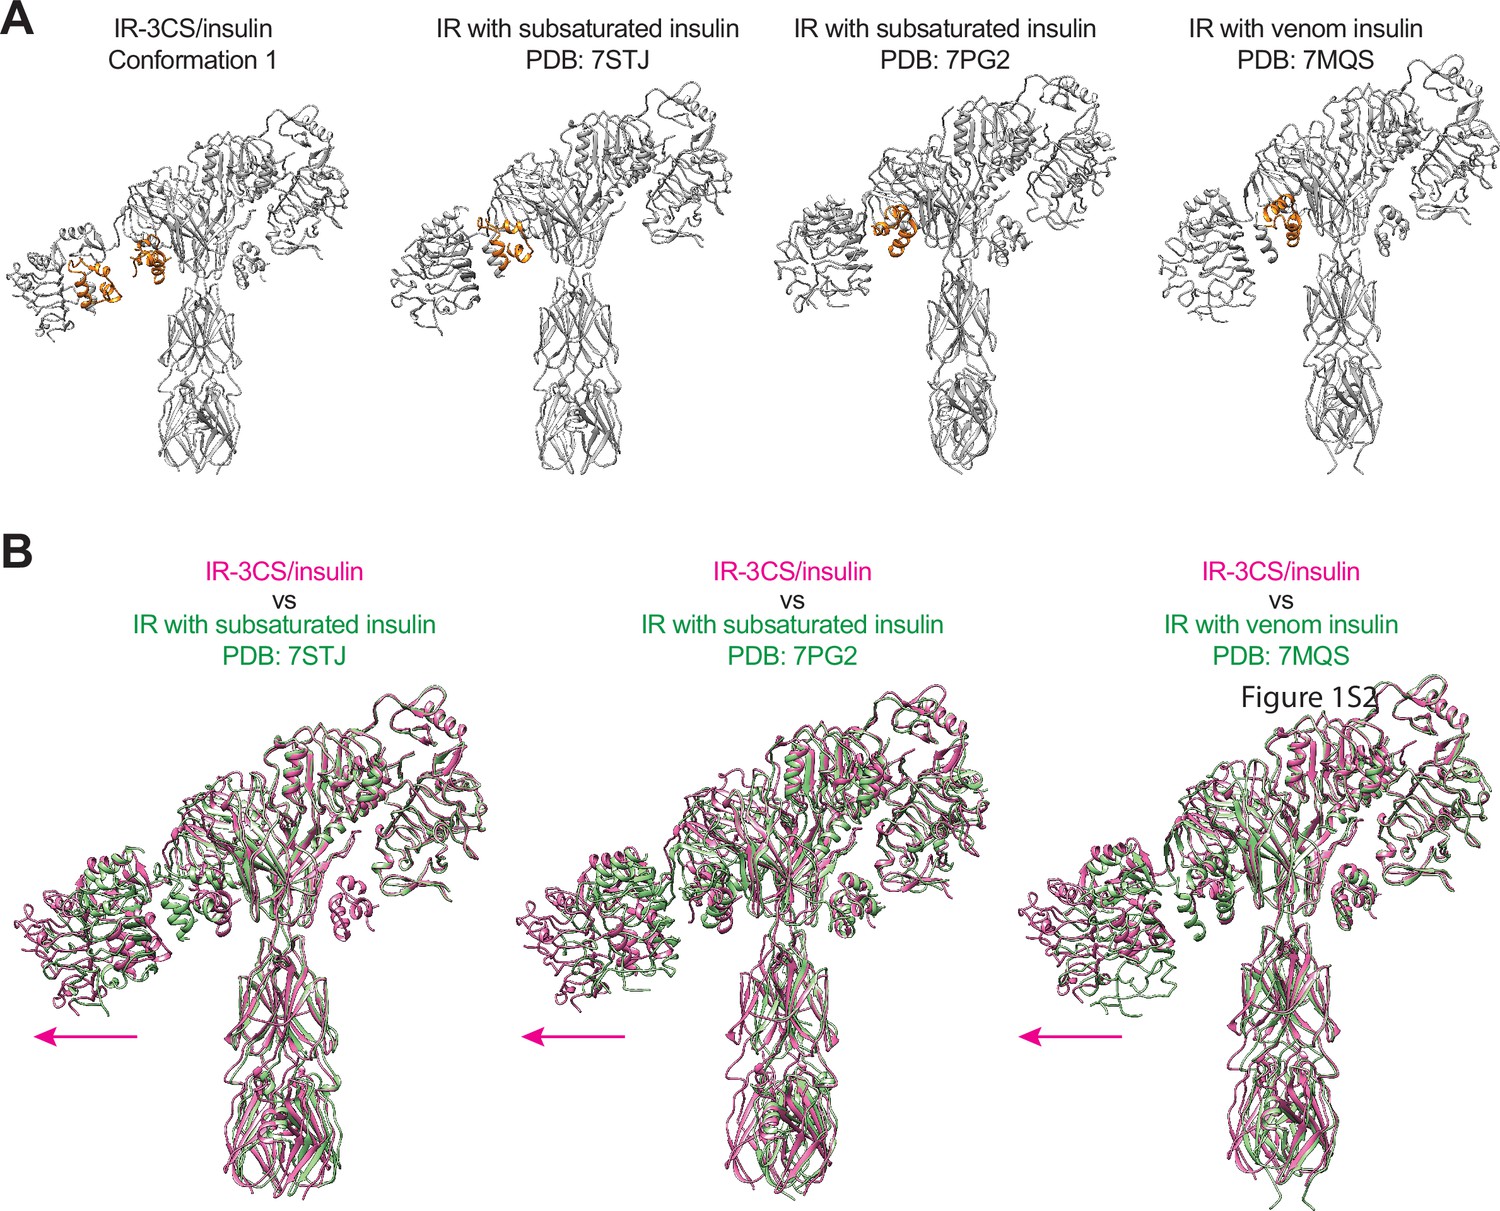
Structural comparison between asymmetric IR-3CS and asymmetric IR-WT with subsaturated insulin bound.
(A) Asymmetric IR-3CS (conformation 1) and asymmetric IRs with subsaturated insulin bound (PDB: 7STJ, 7PG2, and 7MQS); gray. Insulin; orange. (B) Superposition between asymmetric IR-3CS (conformation 1, pink) and IR with subsaturated insulin bound (PDB: 7STJ, 7PG2, and 7MQS; green).
Figure 5
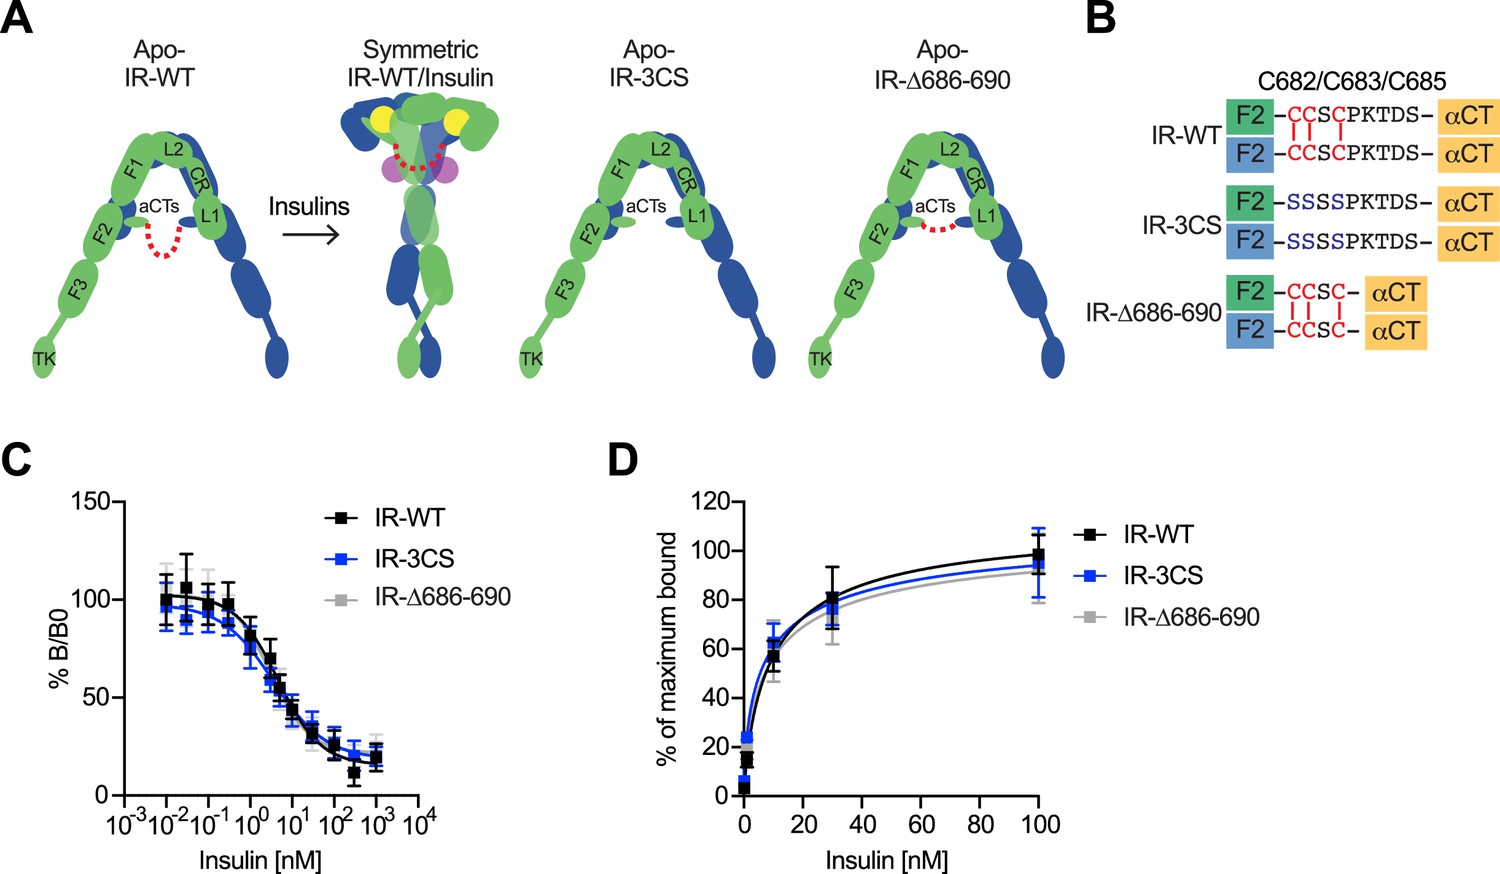
The function of disulfide-linked αCTs in the binding of insulin to IR.
(A) Cartoon representations of the apo-IR, IR/insulin complex showing the IR dimer bound with four insulins (left), apo-IR-3CS (middle) and apo-IRΔ686–690 (right). The two IR protomers are colored in green and blue; the insulins at site-1 and site-2 are colored in yellow and purple, respectively. The linker between two αCTs is shown as red dotted line. (B) Sequences of the linker between two αCTs in the IR-WT, IR-3CS, and IR-Δ686–690 showing disulfide bonds in red. (C) Insulin competition-binding assay for full-length IR-WT, IR-3CS, and IR-Δ686–690. Mean ± SD. IR-WT, n=15 (IC50=4.260 ± 0.9109 nM, Mean ± SD); IR-3CS, n=12 (IC50=3.306 ± 0.4619 nM); IR-Δ686–690, n=12 (IC50=3.231 ± 0.06734 nM). Source data are presented in Figure 5—source data 1. (D) Binding of insulin labeled with Alexa Fluor 488 to purified IR-WT, IR-3CS, and IR-Δ686–690 in the indicated conditions. Mean ± SD. n=24. Source data are presented in Figure 5—source data 1.
-
Figure 5—source data 1
Source data for Figure 5C and D.
- https://cdn.elifesciences.org/articles/81286/elife-81286-fig5-data1-v2.xlsx
Figure 6 with 1 supplement
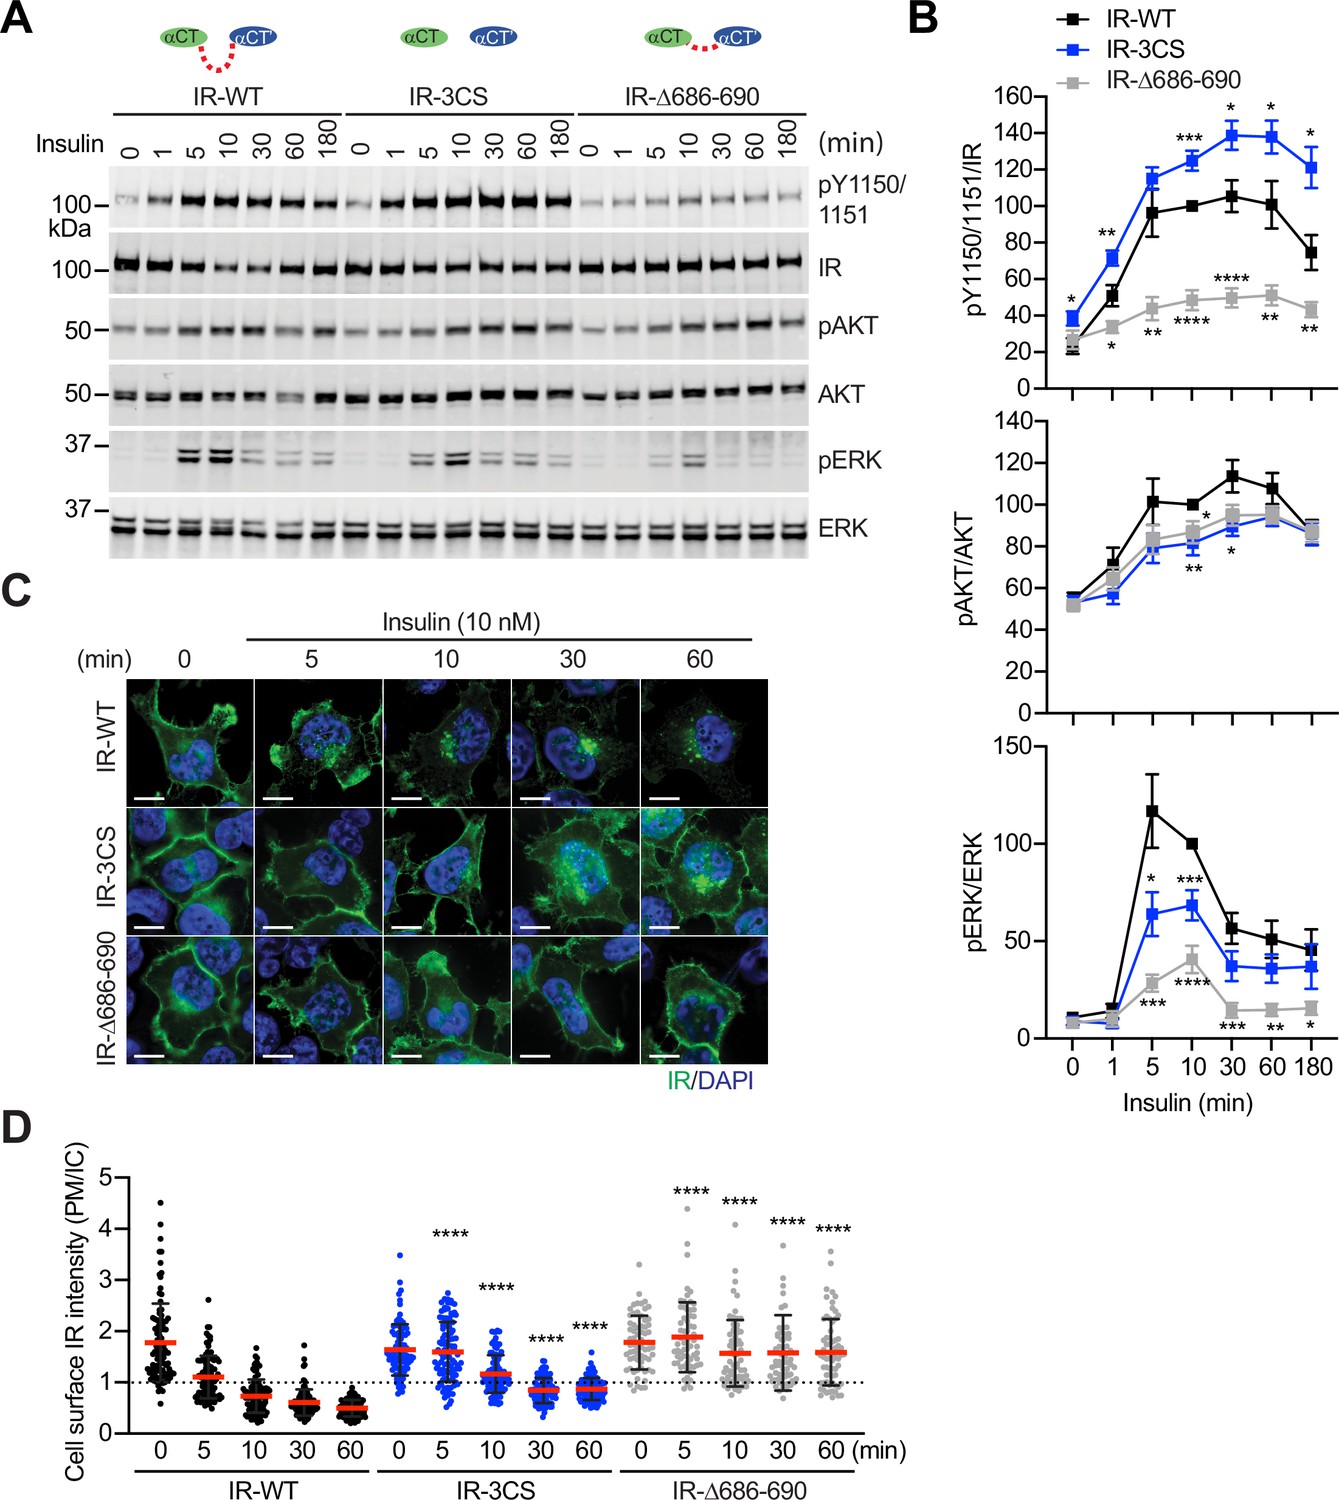
Functional importance of disulfide-linked αCTs on the IR activation.
(A) Insulin-induced IR autophosphorylation, pAKT, and pERK levels in 293 FT cells expressing IR wild-type (WT), IR-3CS, and IR-Δ686–690. Cells were treated with 10 nM insulin for the indicated times. Cell lysates were blotted with the indicated antibodies. Source data are presented in Figure 6—source data 1. (B) Quantification of the western blot data shown in A (Mean ± SEM, pY IR/IR, WT, n=7; 3CS, n=13; Δ686–690, n=8; pAKT/AKT, WT, n=5; 3CS, n=7; Δ686–690, n=6; pERK/ERK, WT, n=7; 3CS, n=12; Δ686–690, n=9). Significance calculated using two-tailed student t-test; *p<0.05; **p<0.01; ***p<0.001; ****p<0.0001. Source data are presented in Figure 6—source data 2. (C) HeLa cells expressing IR-GFP WT, IR-GFP 3CS, or IR-GFP Δ686–690 were starved, treated with 10 nM insulin for indicated times, and stained with anti-GFP (IGF1R, green) and DAPI (blue). Scale bar, 10 μm. (D) Quantification of the ratios of plasma membrane (PM) and intracellular (IC) IGF1R-GFP signals of cells in C (WT0, n=97; WT5, n=102; WT10, n=98; WT30, n=88; WT60, n=103; 3CS0, n=88; 3CS5, n=98; 3CS10, n=92; 3CS30, n=93; 3CS60, n=94; Δ686-690-0, n=65; Δ686-690-5, n=63; Δ686-690-10, n=66; Δ686-690-30, n=64; Δ686-690-60, n=69). Mean ± SD; two-tailed student t-test; ****p<0.0001. Source data are presented in Figure 6—source data 2.
-
Figure 6—source data 1
Source data for Figure 6A.
- https://cdn.elifesciences.org/articles/81286/elife-81286-fig6-data1-v2.zip
-
Figure 6—source data 2
Source data for Figure 6B and D.
- https://cdn.elifesciences.org/articles/81286/elife-81286-fig6-data2-v2.xlsx
Figure 6—figure supplement 1
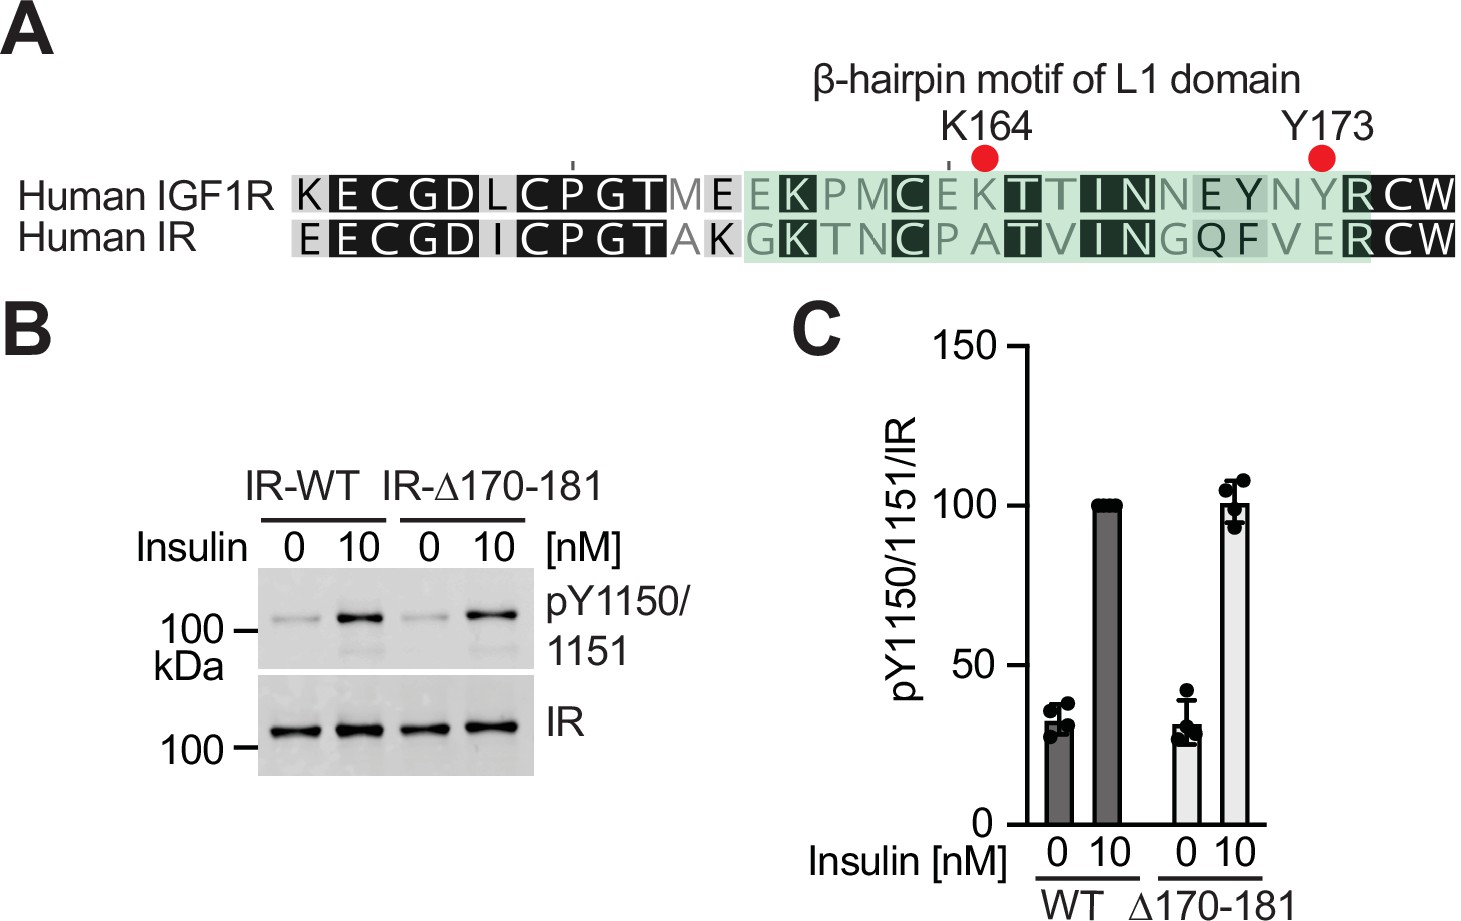
The deletion of β-hairpin motif of L1 domain does not affect the IR activation.
(A) Sequence alignment of human IR and IGF1R. Key residues for the intra L1-FnIII-2 interaction of IGF1R are noted. The L1 domain indicates residues 1-188 (IR) and 1-181 (IGF1R). (B) Insulin-induced IR autophosphorylation in 293 FT cells expressing IR WT and IR L1 β-hairpin (Δ170–181) mutant. Cells were treated with 10 nM insulin for 10 min. Cell lysates were blotted with the indicated antibodies. Source data are presented in Figure 6—figure supplement 1—source data 1. (C) Quantification of the western blot data shown in B (Mean ± SD, n=4). Source data are presented in Figure 6—figure supplement 1—source data 2.
-
Figure 6—figure supplement 1—source data 1
Source data for Figure 6—figure supplement 1B.
- https://cdn.elifesciences.org/articles/81286/elife-81286-fig6-figsupp1-data1-v2.zip
-
Figure 6—figure supplement 1—source data 2
Source data for Figure 6—figure supplement 1C.
- https://cdn.elifesciences.org/articles/81286/elife-81286-fig6-figsupp1-data2-v2.xlsx
Figure 7
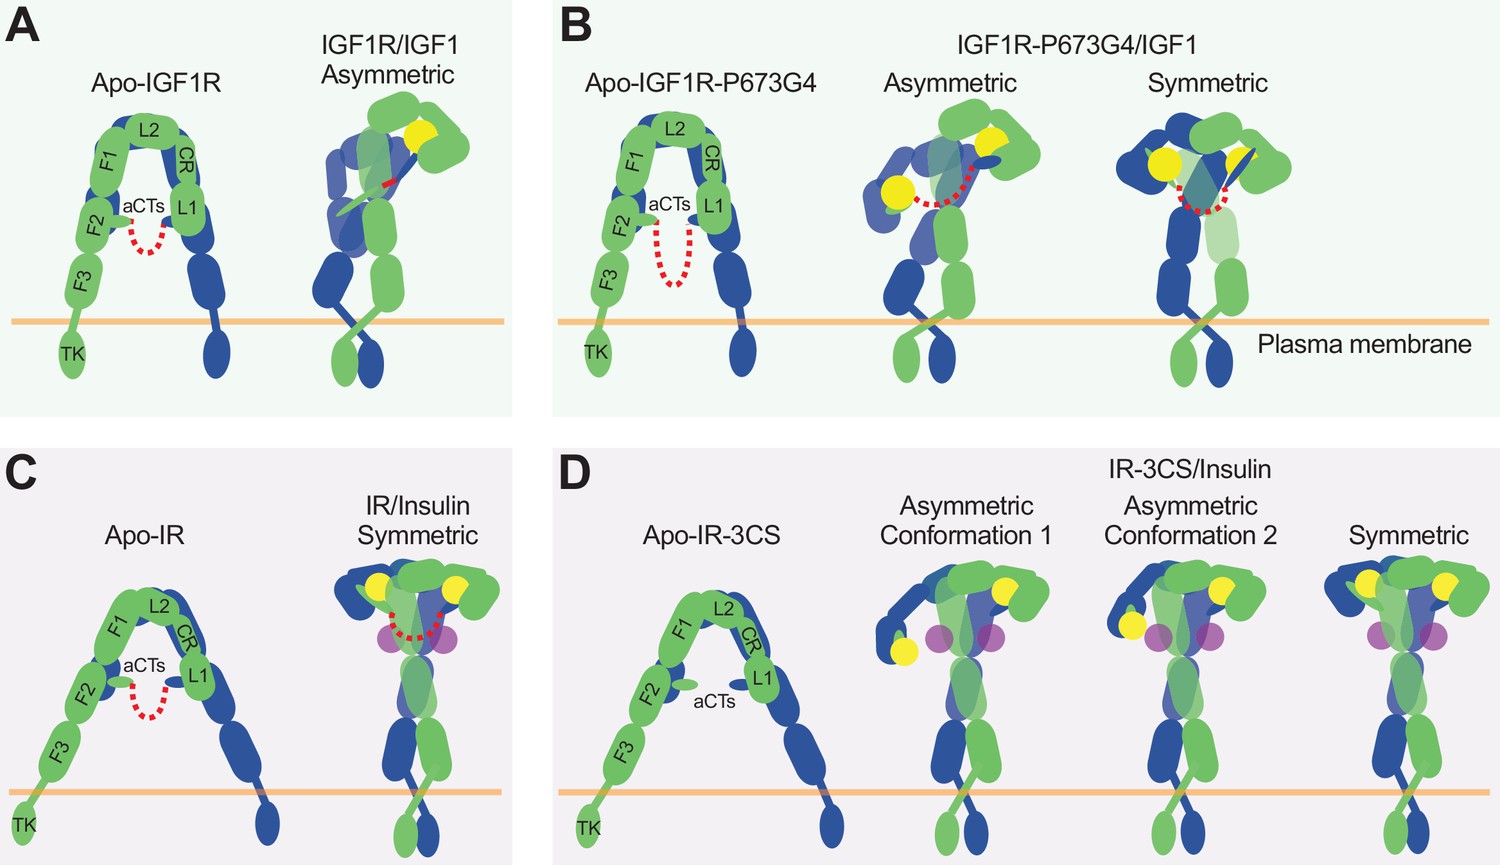
The activation mechanism of the IR and IGF1R by disulfide-linked αCTs.
(A) IGF1-induced IGF1R-WT activation at saturated IGF1 concentrations. The two IGF1R protomers are colored in blue and green, respectively; the IGF1 is colored in yellow. (B) IGF1-induced IGF1R-P673G4 activation at saturated IGF1 concentrations. (C) Insulin-induced IR-WT activation at saturated insulin concentrations. The two IR protomers are colored in blue and green, respectively; insulins at site-1 and site-2 are colored in yellow and purple, respectively. (D) Insulin-induced IR-3CS activation at saturated insulin concentrations.
Tables
Table 1
Cryo-EM data collection and refinement statistics.
| IGF1R-P673G4/IGF1Symmetric | IR-3CS/insulinSymmetric | IR-3CS/insulinAsymmetric conformation 1 | IR-3CS/insulinAsymmetric conformation 2 | ||
|---|---|---|---|---|---|
| Data collection and processing | |||||
| Magnification | 60,241 | 46,296 | 46,296 | 46,296 | |
| Voltage (kV) | 300 | 300 | 300 | 300 | |
| Electron exposure (e–/Å2) | 60 | 60 | 60 | 60 | |
| Defocus range (μm) | 1.6–2.6 | 1.6–2.6 | 1.6–2.6 | 1.6–2.6 | |
| Pixel size (Å) | 0.83 | 1.08 | 1.08 | 1.08 | |
| Symmetry imposed | C2 | C2 | C1 | C1 | |
| Map resolution (Å) | 4.0 | 4.5 | 4.9 | 3.7 | |
| FSC threshold | 0.143 | 0.143 | 0.143 | 0.143 | |
| Refinement | |||||
| Initial model used (PDB code) | 6PYH | 6PXV | 6PXV | 6PXV | |
| Model composition | |||||
| Nonhydrogen atoms | 13,596 | 14,640 | 14,108 | 14,100 | |
| Protein residues | 1,702 | 1,815 | 1,748 | 1,747 | |
| Ligands | 0 | 0 | 0 | 0 | |
| R.m.s. deviations | |||||
| Bond lengths (Å) | 0.005 | 0.004 | 0.004 | 0.004 | |
| Bond angles (°) | 1.091 | 0.987 | 0.978 | 0.957 | |
| Validation | |||||
| MolProbity score | 2.49 | 2.01 | 2.14 | 2.37 | |
| Clashscore | 25.81 | 12.03 | 15.55 | 26.58 | |
| Poor rotamers (%) | 0.74 | 0.18 | 0.06 | 0.06 | |
| Ramachandran plot | |||||
| Favored (%) | 88.48 | 93.61 | 93.17 | 92.72 | |
| Allowed (%) | 11.28 | 6.27 | 6.65 | 7.16 | |
| Disallowed (%) | 0.24 | 0.11 | 0.18 | 0.12 | |
Appendix 1—key resources table
| Reagent type (species) or resource | Designation | Source or reference | Identifiers | Additional information |
|---|---|---|---|---|
| Strain, strain background (Escherichia coli) | One Shot Stbl3 Chemically Competent E. coli | Life Technologies | C7373-03 | |
| Strain, strain background (Escherichia coli) | BL21 (DE3) | Life Technologies | C600003 | |
| Strain, strain background (Escherichia coli) | MAX Efficiency DH10Bac Competent Cells | Thermo Fisher | 10361012 | |
| Cell line (Homo-sapiens) | 293 FT | Invitrogen | R70007 | |
| Cell line (Homo-sapiens) | FreeStyle 293 F | Invitrogen | R79007 | |
| Cell line (Homo-sapiens) | HEK293S GnTI- | ATCC | CRL-3022 | |
| Cell line (Homo-sapiens) | HeLa Tet-on | Takara Bio | 631183 | |
| Cell line (Spdoptera frugiperda) | Sf9 | ATCC | CRL-1711 | |
| Transfected construct (Homo-sapiens) | pET-28a-His6-SUMO-IGF1 | This paper | Protein expressing and purification: Mature human IGF1 gene (residues 49–118) was subcloned into modified pET-28a vector encoding a His6-tag and SUMO-tag at N-terminus. | |
| Transfected construct (Mus musculus) | pEZT-BM-mouse IGF1R-P673G4 | This paper | Protein expressing and purification: NM_010513.2 with C-terminal tail truncation (residues 1–1262), D1107N, Y951A, and four glycine insertion between P673 and K674 | |
| Transfected construct (Mus musculus) | pEZT-BM-mouse insulin receptor (IR)–3CS | This paper | Protein expressing and purification: NM_010568.3 with D1122N, Y962F, C684S, C685S, and C687S | |
| Transfected construct (Homo-sapiens) | pCS2-human IR WT-MYC | Choi et al., 2016, Cell | ||
| Transfected construct (Homo-sapiens) | pCS2-human IR-3CS-MYC | This paper | Cysteine mutation (C682S, C683S, C685S) | |
| Transfected construct (Homo-sapiens) | pCS2-human IR Δ686–690-MYC | This paper | Deletion residues 686–690 | |
| Transfected construct (Homo-sapiens) | pCS2-human IR Δ170–181-MYC | This paper | Deletion residues 170–181 | |
| Transfected construct (Homo-sapiens) | pCS2-human IGF1R WT-MYC | Li et al., 2019, Nature Communications | ||
| Transfected construct (Homo-sapiens) | pCS2-human IGF1R P673G4-MYC | This paper | Four glycine insertion between P673 and K674 | |
| Transfected construct (Homo-sapiens) | pCS2-human IGF1R Δ3C-MYC | This paper | Deletion residues 669–572 | |
| Transfected construct (Homo-sapiens) | pBabe-puro-IR WT-GFP | Choi et al., 2016, Cell | ||
| Transfected construct (Homo-sapiens) | pBabe-puro-IR 3CS-GFP | This paper | Cysteine mutation (C682S, C683S, C685S) | |
| Transfected construct (Homo-sapiens) | pBabe-puro-IR Δ686–690-GFP | This paper | Deletion residues 686–690 | |
| Transfected construct (Homo-sapiens) | pBabe-puro-IGF1R WT-GFP | This paper | Mature human IGF1R | |
| Transfected construct (Homo-sapiens) | pBabe-puro-IGF1R P673G4 | This paper | Four glycine insertion between P673 and K674 | |
| Antibody | Anti-IR-pY1150/1151 (Rabbit monoclonal, 19H7) | Cell Signaling | #3024 | WB (1:1000) |
| Antibody | Anti-AKT (Mouse monoclonal, 40D4) | Cell Signaling | #2920 | WB (1:1000) |
| Antibody | Anti-pS473 AKT (Rabbit monoclonal, D9E) | Cell Signaling | #4060 | WB (1:1000) |
| Antibody | Anti-ERK1/2 (Mouse monoclonal, L34F12) | Cell Signaling | #4696 | WB (1:1000) |
| Antibody | Anti-pERK1/2 (Rabbit monoclonal, 197G2) | Cell Signaling | #4377 | WB (1:1000) |
| Antibody | Anti-Myc (Mouse monoclonal, 9E10) | Roche | #11667149001 | WB (1:1000) |
| Antibody | Anti-GFP (Rabbit polyclonal) | Homemade (Xia et al., 2004; Tang et al., 2001) | IFA (1:500) | |
| Antibody | Anti-rabbit immunoglobulin G (IgG) (H+L) Dylight 800 conjugates (secondary antibody) | Cell Signaling | #5151 | WB (1:5000) |
| Antibody | Anti-mouse IgG (H+L) Dylight 680 conjugates (secondary antibody) | Cell Signaling | #5470 | WB (1:5000) |
| Recombinant DNA reagent | p-gag/pol | Addgene | #14887 | Retrovirus production |
| Recombinant DNA reagent | pCMV-VSV-G | Addgene | #8454 | Retrovirus production |
| Sequence-based reagent | PCR primers site-directed mutagenesis for human IR 3CS | This paper | F:tcctctCCAAAGACAGACTCTCAGATCCTG R:ggaggaTTCGCCGGCCGAATCCTC | |
| Sequence-based reagent | PCR primers site-directed mutagenesis for human IR Δ686–690 | This paper | F:CAGATCCTGAAGGAGCTGG R:ACAGGAGCAGCATTCGCC | |
| Sequence-based reagent | PCR primers site-directed mutagenesis for human IR Δ170–181 | This paper | F:TGTTGGACTCATAGTCACTG R:GCAGTTGGTCTTGCCCTT | |
| Sequence-based reagent | PCR primers site-directed mutagenesis for human IGF1R P673G4 | This paper | F:ggaggtAAAACTGAAGCCGAGAAGCAGGCC R:acctccGGGGCAGGCGCAGCAAGG | |
| Sequence-based reagent | PCR primers site-directed mutagenesis for human IGF1R Δ3C | This paper | F:CCCAAAACTGAAGCCGAGAAG R:AGGCCCTTTCTCCCCACC | |
| Sequence-based reagent | PCR primers site-directed mutagenesis for mouse IGF1R P673G4 | This paper | F:CTGCGCTTGCCCTGGCGGAGGAGG CAAAACTGAAGCTGAGAAGCAGG R:GCTTCAGTTTTGCCTCCT CCGCCAGGGCAAGCGCAGCAT | |
| Sequence-based reagent | PCR primers site-directed mutagenesis for mouse IR-3CS | This paper | F:TCATCTCCTAAGACTGACTCTCAGATCC R:GGATGACTCACTGGCCGAGTCGTC | |
| Peptide, recombinant protein | Human Insulin | Sigma | I2643 | |
| Peptide, recombinant protein | Human IGF1 | PeproTech | 100–11 | |
| Commercial assay or kit | Micro BCA Protein Assay Kit | Thermo Scientific | 23235 | |
| Commercial assay or kit | Alexa Fluor 488 | Thermo Scientific | A10235 | |
| Commercial assay or kit | Q5 site directed mutagenesis kit | NEB | E0554S | |
| Commercial assay or kit | Gibson Assembly Master Mix | NEB | E2166L | |
| Chemical compound, drug | cOmplete Protease Inhibitor Cocktail | Roche | 05056489001 | |
| Chemical compound, drug | PhosSTOP | Roche | 4906837001 | |
| Chemical compound, drug | BMS536924 | Tocris | 4774 | |
| Chemical compound, drug | Cellfectin | Invitrogen | 10362100 | |
| Chemical compound, drug | Lipofectamine 2000 | Invitrogen | 11668019 | |
| Software, algorithm | Prism 9.0d | GraphPad | N/A | Statistics |
| Other | Pierce Anti-c-Myc Magnetic Beads | Thermo Scientific | 88843 | In vitro insulin binding assay |
| Other | ProLong Gold Antifade reagent with DAPI | Invitrogen | P36935 | Immunofluorescence assay for IR and IGF1R trafficking |
Additional files
Download links
A two-part list of links to download the article, or parts of the article, in various formats.
Downloads (link to download the article as PDF)
Open citations (links to open the citations from this article in various online reference manager services)
Cite this article (links to download the citations from this article in formats compatible with various reference manager tools)
Molecular basis for the role of disulfide-linked αCTs in the activation of insulin-like growth factor 1 receptor and insulin receptor
eLife 11:e81286.
https://doi.org/10.7554/eLife.81286


