Antiviral function and viral antagonism of the rapidly evolving dynein activating adaptor NINL
- Department of Cellular and Molecular Medicine, University of California, San Diego, United States
- Department of Molecular Biology, University of California, San Diego, United States
- Howard Hughes Medical Institute, United States
- Nikon Imaging Center at UC San Diego, University of California, San Diego, United States
- Department of Cell and Developmental Biology, University of California, San Diego, United States
Figures
Figure 1
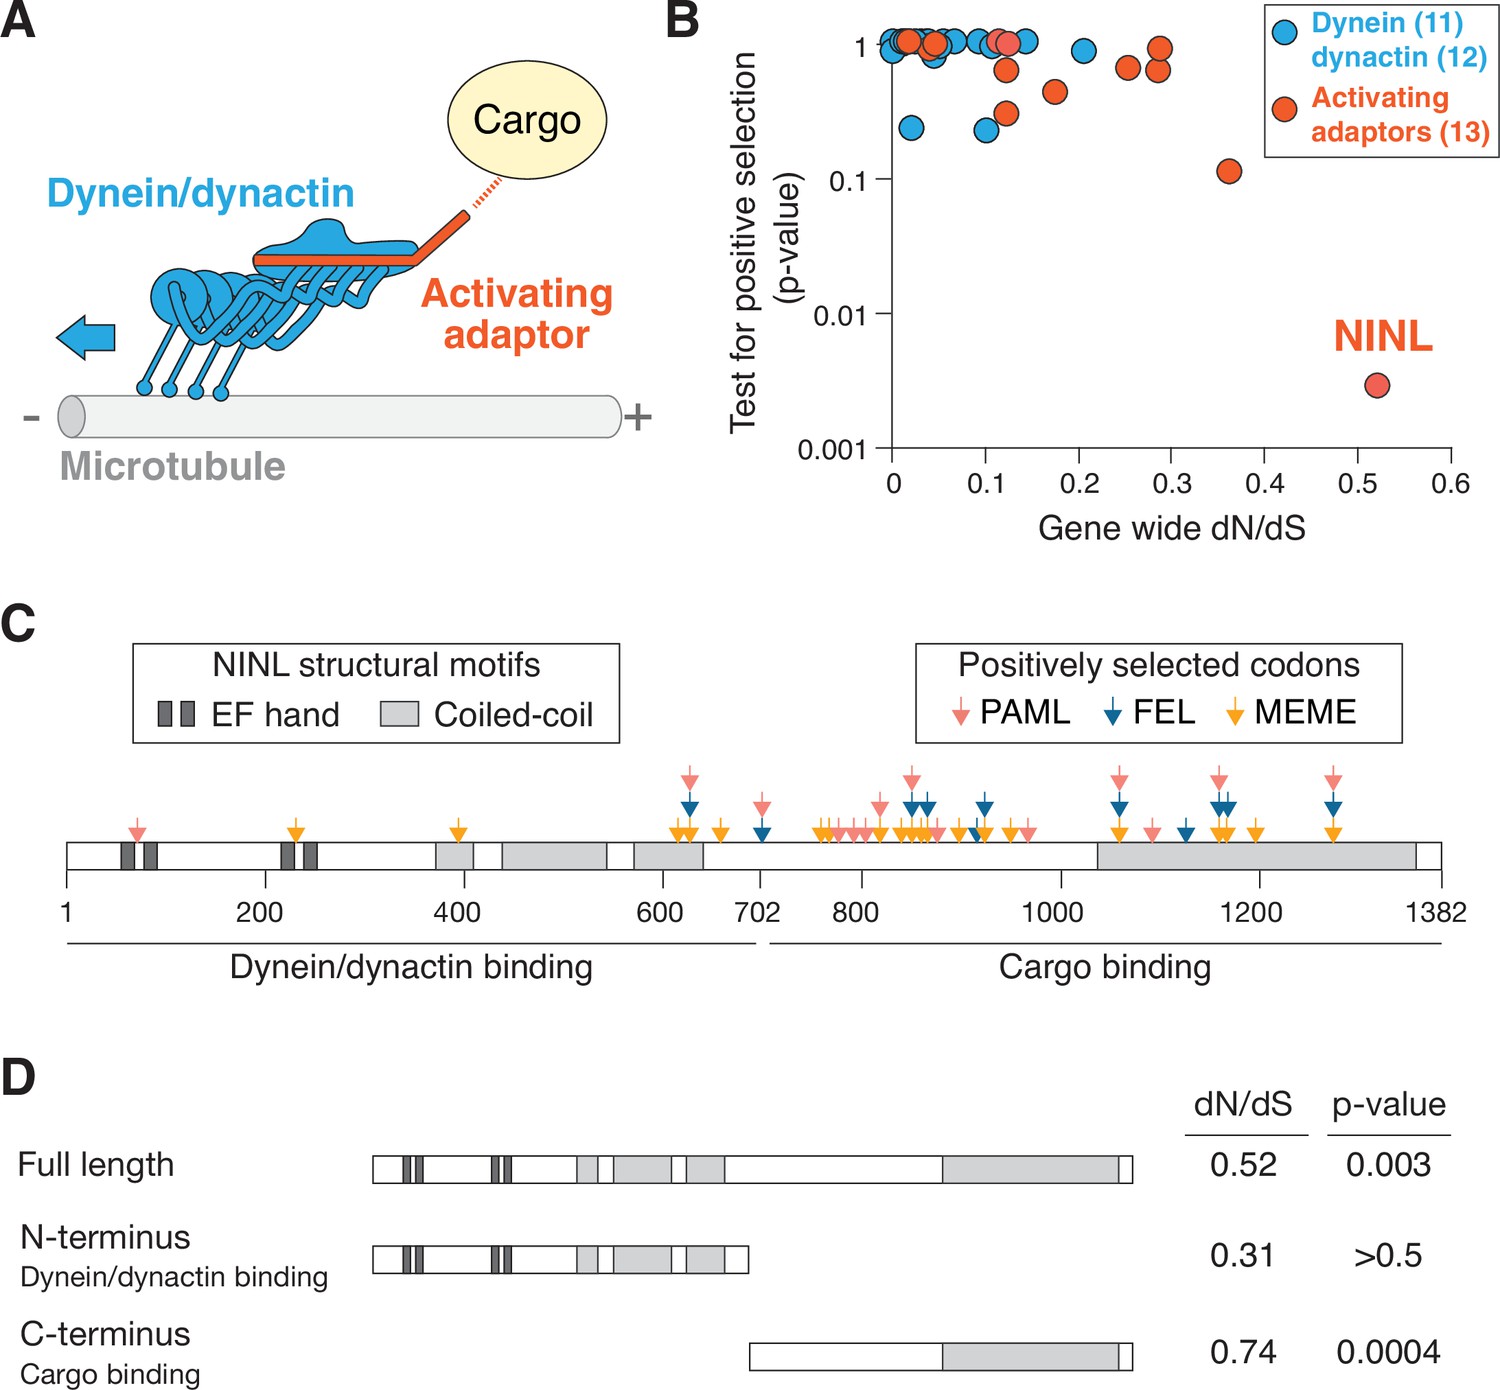
The dynein activating adaptor, ninein-like (NINL), has evolved under positive selection in primates.
(A) A schematic of the cytoplasmic dynein-1 transport machinery, which includes dynein and dynactin subunits (blue) and an activating adaptor (orange). Dynein moves toward the minus-end of microtubules (blue arrow). (B) A scatterplot displaying evolutionary signatures of selection for 23 dynein and dynactin genes (blue) and 13 dynein activating adaptor genes (orange). The x-axis displays the rate of nonsynonymous changes (dN) divided by the rate of synonymous changes (dS) in the coding sequence across primate evolution. The y-axis displays the calculated probability of the gene having evolved under positive selection using PAML. Complete data are found in Supplementary file 1 . (C) A schematic of human NINL isoform 1 with EF hand (dark gray) and coiled-coil (light gray) domains shown. The amino-terminal dynein/dynactin-binding region and the carboxy-terminal candidate cargo-binding domains are indicated. Sites of positive selection predicted by three evolutionary models are shown as colored arrows: PAML (light red), FEL (blue), and MEME (orange). A full list of sites and their calculated probabilities is shown in Supplementary file 2 . (D) Full-length NINL, the dynein/dynactin-binding amino-terminus of NINL and the candidate cargo-binding carboxy-terminus of NINL were analyzed for signatures of positive selection. Select dN/dS and p-values are shown, with additional evolutionary data in Supplementary file 3.
Figure 2 with 2 supplements
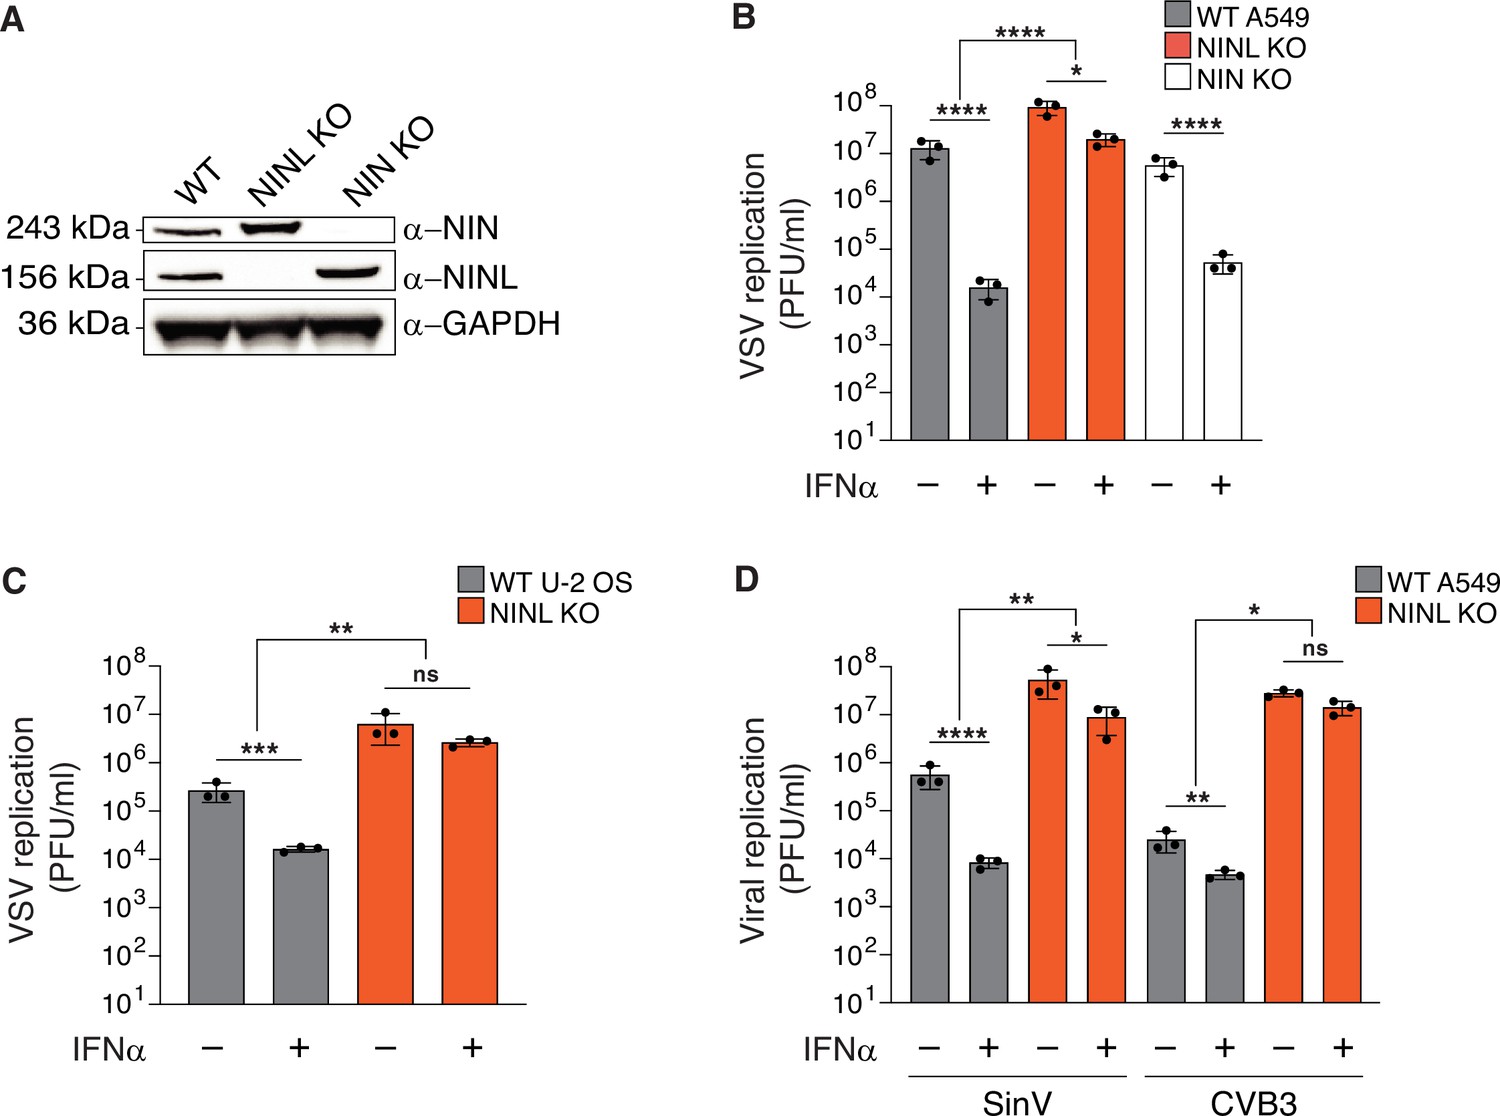
The antiviral potency of interferon alpha (IFNα) is reduced in ninein-like (NINL) knockout (KO) cells.
(A) Immunoblots of wild-type (WT) A549 cells, and CRISPR/Cas9-generated NINL and NIN KO A549 cells probed with the indicated antibodies. GAPDH served as a loading control. Protein molecular weight markers are shown in kilodaltons (kDa) to the left of each immunoblot. Representative images from three biological replicates are shown. (B) WT, NINL KO, and NIN KO A549 cells were treated with 100U IFNα for 24 hr and then infected with vesicular stomatitis virus (VSV) (5000 PFU/mL, MOI ≈ 0.01). Virus-containing supernatants were collected 9 hr post-infection and viral titers (y-axis, PFU/mL) were determined by plaque assay. (C) WT or NINL KO U-2 OS cells were treated with 100U IFNα for 24 hr and then infected with VSV (5000 PFU/mL, MOI ≈ 0.01). Virus-containing supernatant was collected 9 hr post-infection and viral titers (y-axis, PFU/mL) were determined by plaque assay. (D) WT or NINL KO A549 cells were treated with 100U IFNα for 24 hr and then infected with Sindbis virus (500,000 PFU/mL, MOI ≈ 1.0) (left) or treated with 1000U IFNα for 24 hr and then infected with coxsackievirus B3 (5000 PFU/mL, MOI ≈ 0.01) (right). Virus-containing supernatants were collected 24 hr post-infection and viral titers (y-axis, PFU/mL) were determined by plaque assay. (B–D) Data are presented as mean ± standard deviation of three experiments, with individual points shown. Data were analyzed by two-way ANOVA with Tukey’s method adjustment for multiple comparisons for IFNα treatment within each cell line, two-way ANOVA interaction comparison for IFNα interaction between cell lines. *p<0.05, **p<0.01, ***p<0.001, ****p<0.0001, ns, not significant.
-
Figure 2—source data 1
Full raw unedited images for Figure 2A.
- https://cdn.elifesciences.org/articles/81606/elife-81606-fig2-data1-v2.zip
-
Figure 2—source data 2
Individual data values for Figure 2B–D.
- https://cdn.elifesciences.org/articles/81606/elife-81606-fig2-data2-v2.xlsx
Figure 2—figure supplement 1
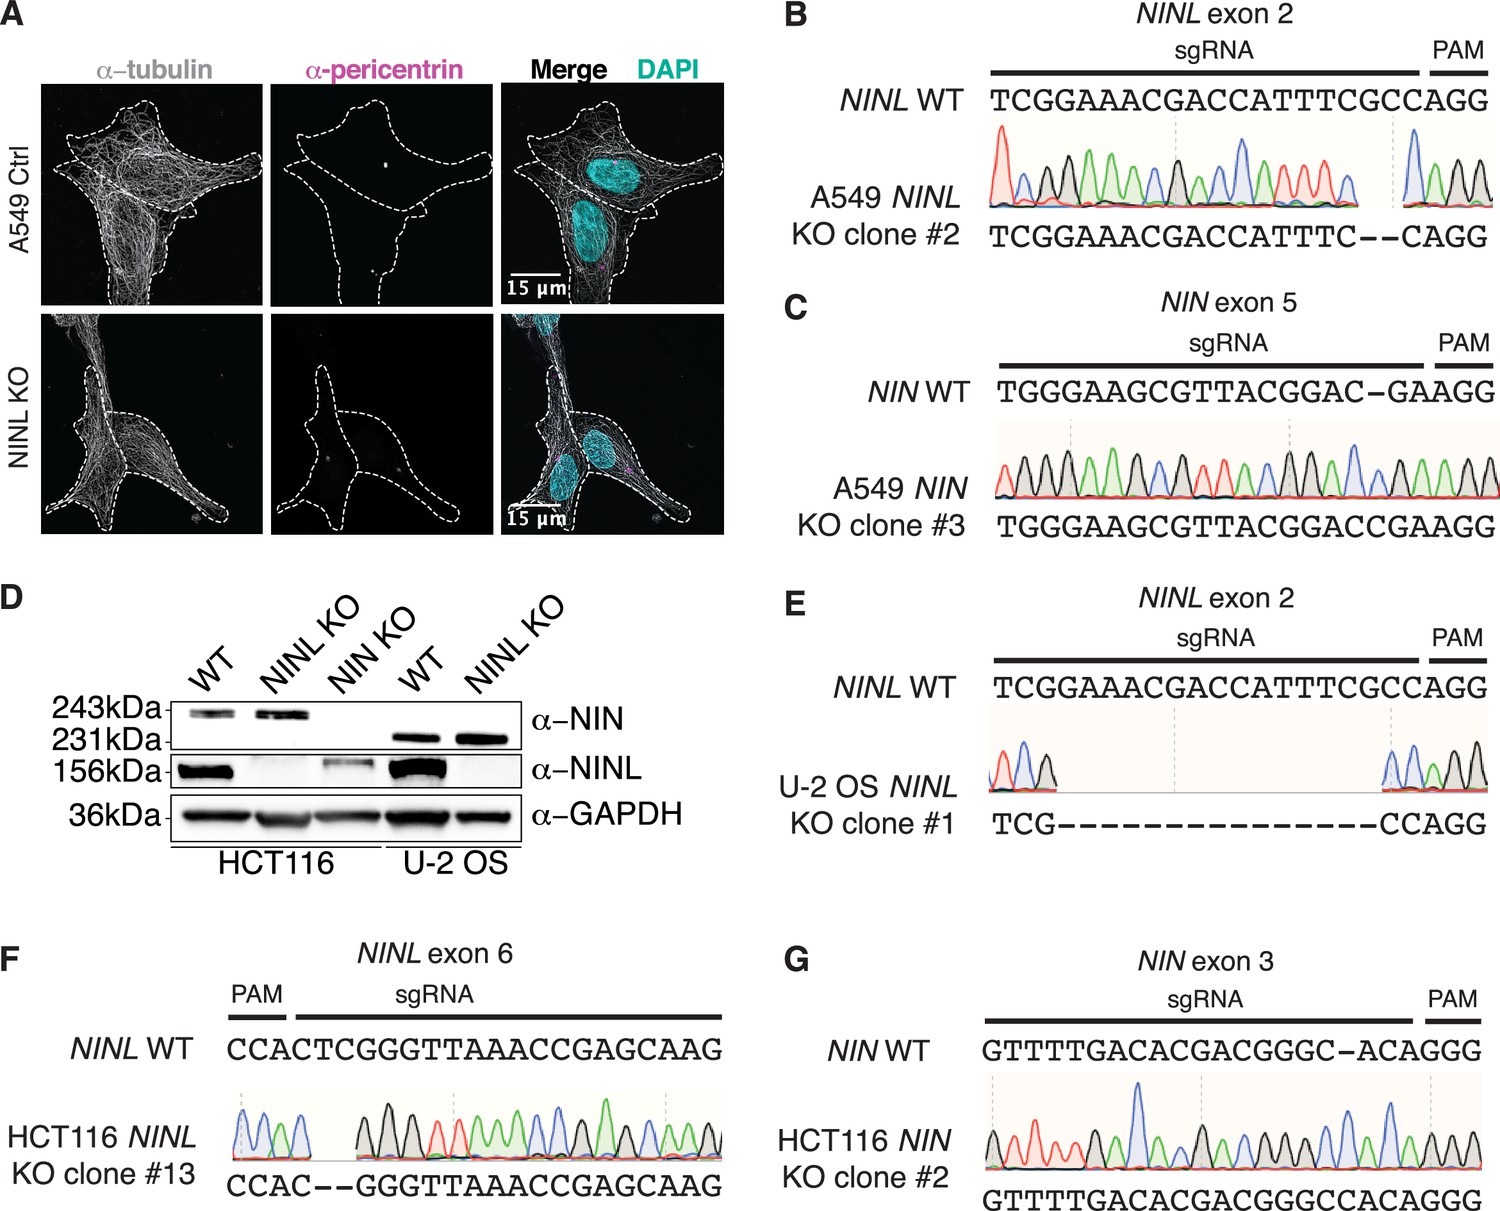
Validation of CRISPR/Cas9-editing to generate ninein-like (NINL) and NIN knockout (KO) cells.
(A) Confocal micrographs displayed as maximum intensity projections of wild-type (WT) and NINL KO A549 cells. Immunostaining with anti-pericentrin and anti-tubulin antibodies was used to visualize centrosomes and microtubules, respectively. Nuclei were visualized with DAPI. 15 μm scale bars are shown in the merged micrographs. Dashed white lines denote cellular boundaries. Representative micrographs from two biological replicates are shown. (B) Sequence verification of exon 2-targeted NINL KO A549 cells. An excerpt of the WT NINL sequence is shown with the CRISPR-targeting sgRNA and PAM sequences indicated (top), the sequencing chromatogram (middle), and the sequence of the NINL KO (bottom). (C) Sequence verification of exon 5-targeted NIN KO A549 cells. (D) Immunoblots of control (CTRL) HCT116 and U-2 OS cells, and CRISPR/Cas9-generated NINL and NIN KO HCT116 and U-2 OS cells probed with the indicated antibodies. GAPDH served as a loading control. Protein molecular weight markers are shown in kilodaltons (kDa) to the left of each immunoblot. Representative images from three biological replicates are shown. (E) Sequence verification of exon 2-targeted NINL KO U-2 OS cells. (F) Sequence verification of exon 6-targeted NINL KO HCT116 cells. (G) Sequence verification of exon 3-targeted NIN KO HCT116 cells.
-
Figure 2—figure supplement 1—source data 1
Full raw unedited images for Figure 2—figure supplement 1D.
- https://cdn.elifesciences.org/articles/81606/elife-81606-fig2-figsupp1-data1-v2.zip
Figure 2—figure supplement 2

Reduction of interferon alpha (IFNα)-mediated antiviral response is observed across multiple cell lines.
(A) A549 wild-type (WT), ninein-like (NINL) knockout (KO), or NIN KO cells were treated with 100U IFNα for 24 hr, then infected with Sindbis virus (500,000 PFU/mL, MOI ≈ 1.0). Cells were collected 24 hr post-infection and viral titers (y-axis, PFU/mL) were determined by plaque assay. WT and NINL KO data were reproduced from Figure 2D for comparison. (B) U-2 OS WT or NINL KO cells were treated, infected, harvested, and quantified as described in (A). (C) A549 WT, NINL KO, or NIN KO cells were treated with 1000U IFNα for 24 hr, then infected with coxsackievirus B3 (5000 PFU/mL, MOI ≈ 0.01). Cells were collected 24 hr post-infection and viral titers (y-axis, PFU/mL) were determined by plaque assay. WT and NINL KO data were reproduced from Figure 2D for comparison. (D) U-2 OS WT or NINL KO cells treated, infected, harvested, and quantified as described in (C). (A–D) Data are presented as mean ± standard deviation of three experiments, with individual points shown. Data were analyzed by two-way ANOVA with Tukey’s method adjustment for multiple comparisons for IFNα treatment within each cell line, two-way ANOVA interaction comparison for IFNα interaction between cell lines. *p<0.05, **p<0.01, ***p<0.001, ****p<0.0001, ns, not significant.
-
Figure 2—figure supplement 2—source data 1
Individual data values for Figure 2—figure supplement 2A–D.
- https://cdn.elifesciences.org/articles/81606/elife-81606-fig2-figsupp2-data1-v2.xlsx
Figure 3 with 5 supplements
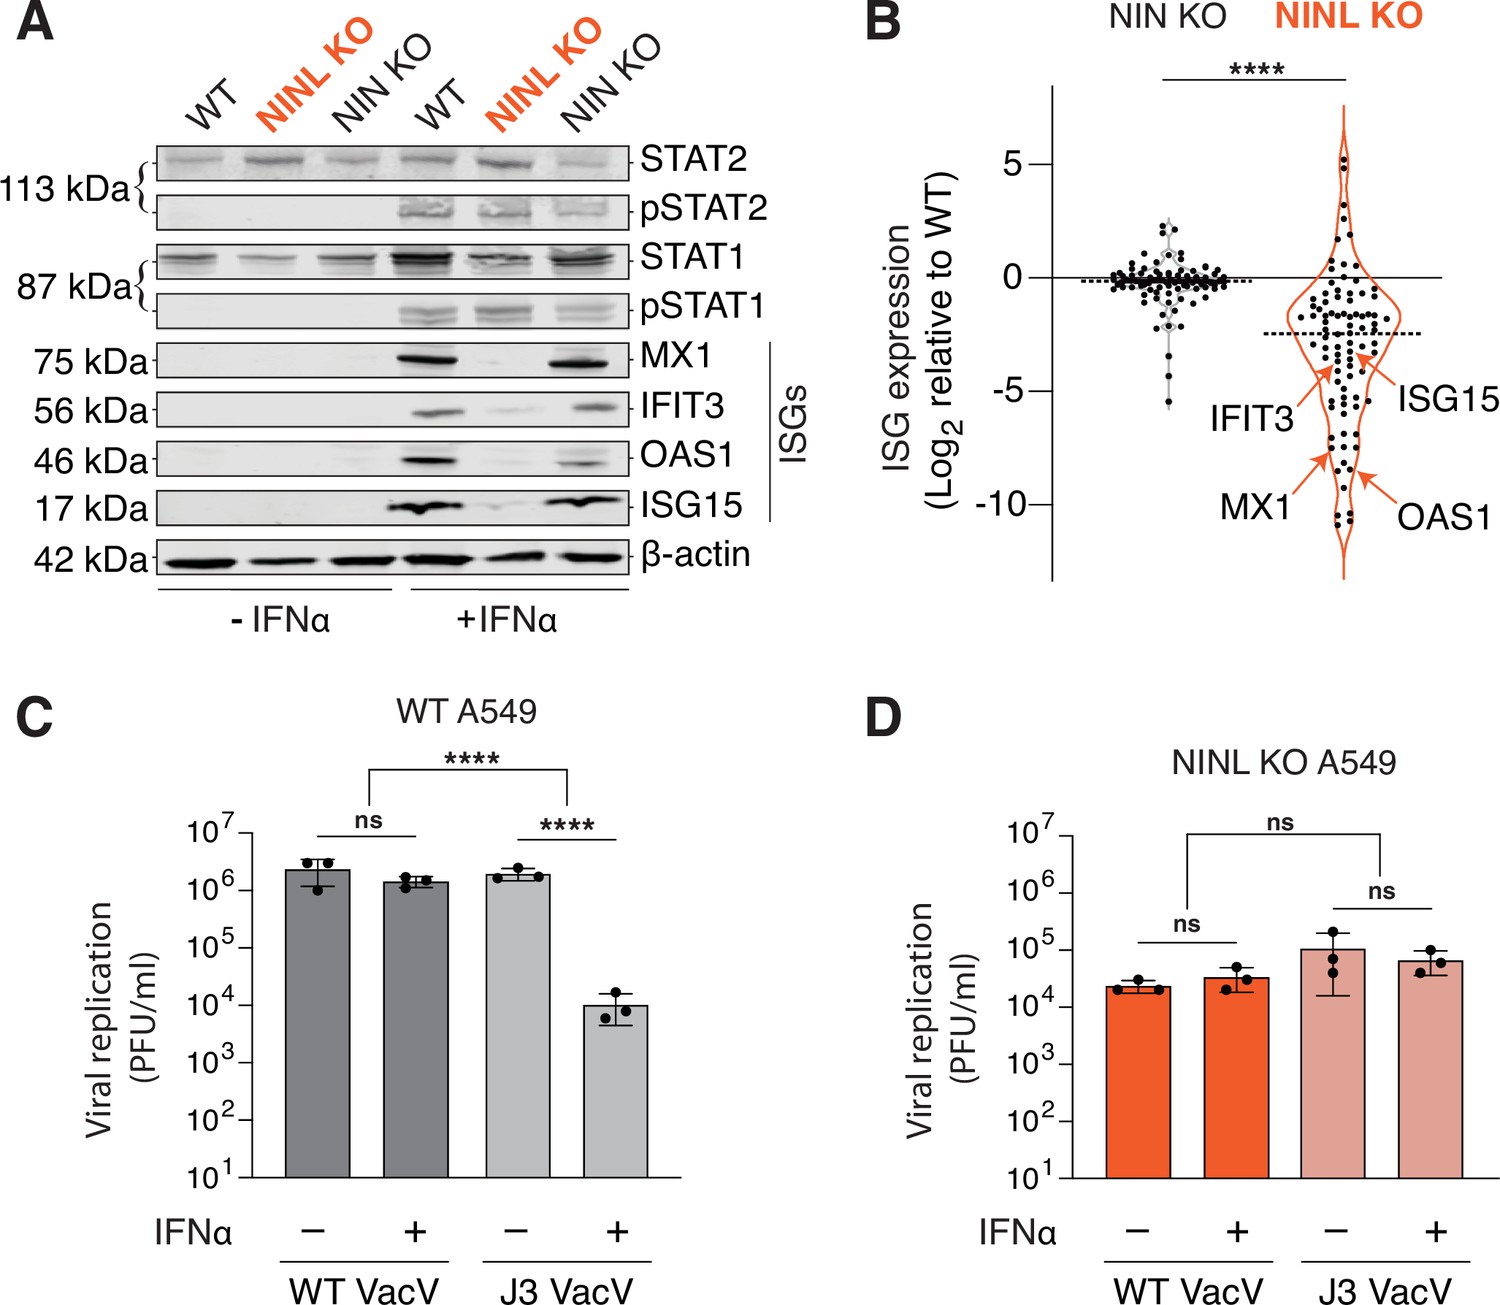
Ninein-like (NINL) knockout (KO) cells fail to mount an effective interferon (IFN) response.
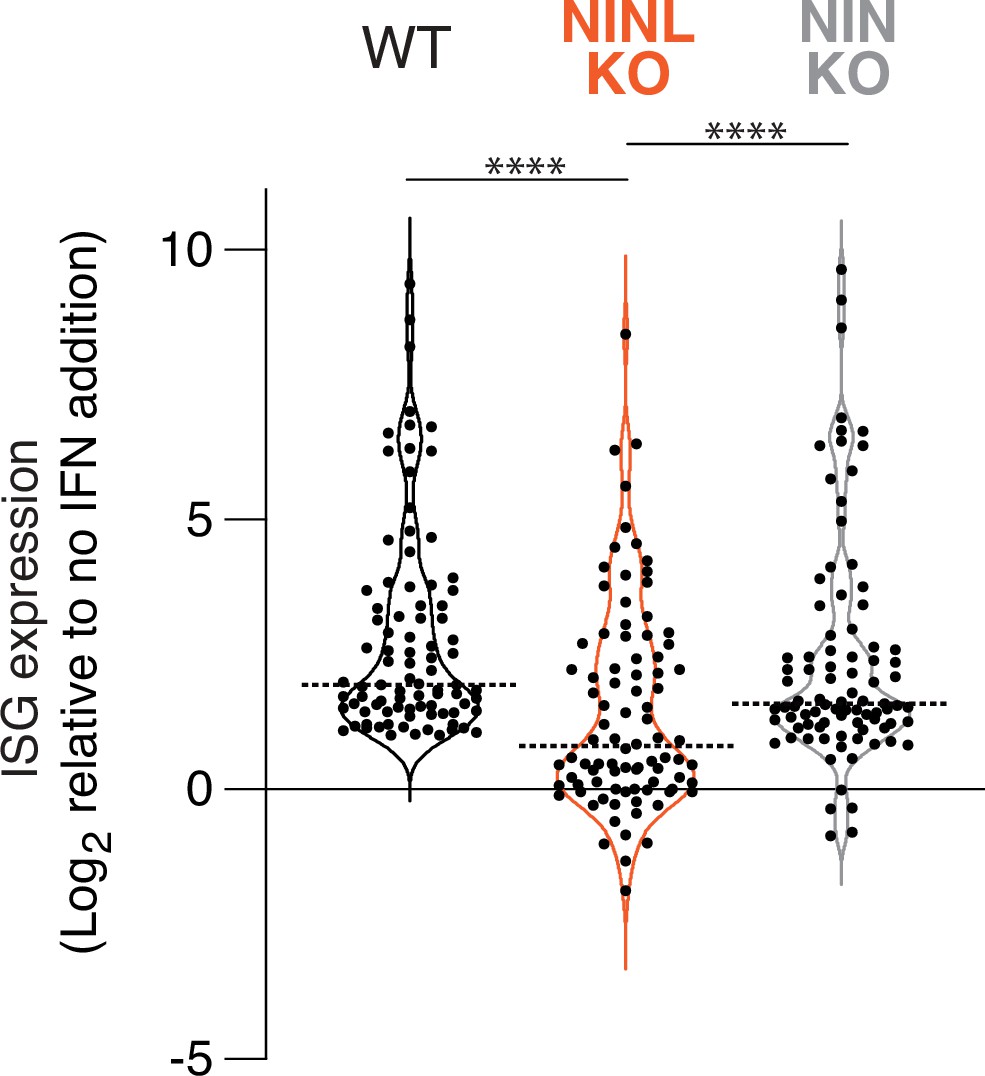
(A) Immunoblot of extracts from wild-type (WT), NINL KO, and NIN KO A549 cells untreated (-) or treated (+) with IFNα. Immunoblots were probed with anti-STAT2, anti-phospho-STAT2 (Tyr690), anti-STAT1, anti-phospho-STAT1 (Tyr701), anti-Mx1, anti-IFIT3, anti-OAS1, anti-ISG15, and anti-β-actin antibodies. Predicted protein molecular weights are shown in kilodaltons (kDa) to the left of each immunoblot. Representative images from three biological replicates are shown. (B) Differential interferon-stimulated gene (ISG) expression in WT, NINL KO, and NIN KO cells induced with IFNα. ISGs were identified as the 88 genes whose expression was upregulated in WT cells after IFNα pretreatment (Figure 3—figure supplement 2). Data are displayed as a violin plot of ISG expression in NIN KO or NINL KO cells relative to WT cells. ****p<0.0001 based on paired t-test. Dotted line indicates mean. Individual datapoints for ISGs shown in panel (A) are indicated. (C) A549 WT cells were treated with 1000U IFNα for 24 hr, then infected with wild-type vaccinia virus (WT VacV) or J3 mutant vaccinia virus (J3 VacV) (50,000 PFU/mL, MOI ≈ 0.1). Cell-associated virus was collected 24 hr post-infection and viral titers (y-axis, PFU/mL) were determined by plaque assay. (D) A549 NINL KO cells were treated, infected, harvested, and quantified as described in (C). (C, D) Data are presented as mean ± standard deviation of three experiments, with individual points shown. Data were analyzed by two-way ANOVA with Tukey’s method adjustment for multiple comparisons for IFNα treatment within each cell line, two-way ANOVA interaction comparison for IFNα interaction between cell lines. ****p<0.0001, ns, not significant.
-
Figure 3—source data 1
Full raw unedited images for Figure 3A.
- https://cdn.elifesciences.org/articles/81606/elife-81606-fig3-data1-v2.zip
-
Figure 3—source data 2
Individual data values for Figure 3C.
- https://cdn.elifesciences.org/articles/81606/elife-81606-fig3-data2-v2.xlsx
Figure 3—figure supplement 1
Reduced interferon-stimulated gene (ISG) production occurs following ninein-like (NINL) knockout (KO) in multiple cell lines generated using different CRISPR gRNAs.
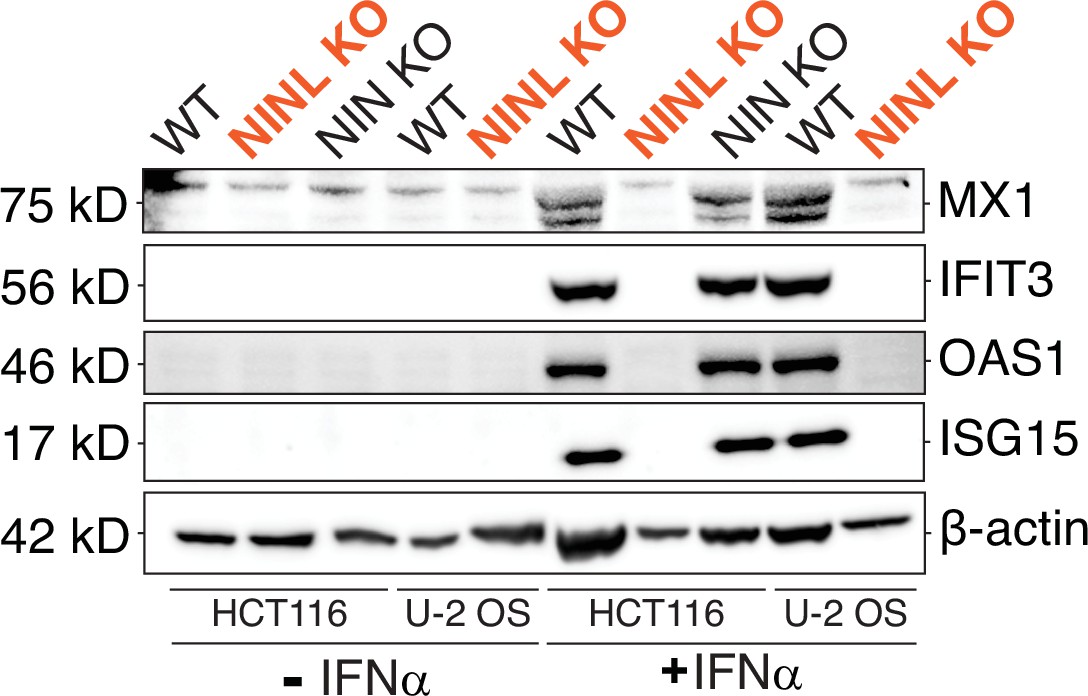
Immunoblot of extracts from wild-type (WT), NINL KO, NIN KO HCT116 cells and WT and NINL KO U-2 OS cells untreated or treated with interferon alpha (IFNα). Immunoblots were probed with anti-STAT2, anti-phospho-STAT2 (Tyr690), anti-STAT1, anti-phospho-STAT1 (Tyr701), anti-Mx1, anti-IFIT3, anti-OAS1, anti-ISG15, and anti-β-actin antibodies. Predicted protein molecular weights are shown in kilodaltons (kDa) to the left of each immunoblot. Representative images from three biological replicates are shown.
-
Figure 3—figure supplement 1—source data 1
Full raw unedited images for Figure 3—figure supplement 1.
- https://cdn.elifesciences.org/articles/81606/elife-81606-fig3-figsupp1-data1-v2.zip
Figure 3—figure supplement 2

Identification of 88 interferon-stimulated genes (ISGs) in wild-type (WT) A549 cells.
Differential gene expression from RNAseq analyses of WT A549 cells pretreated with interferon alpha (IFNα) compared to untreated. Each condition (untreated or IFNα) was performed in triplicate, with independent RNA extractions, sequencing library preparation, and sequencing. RNA levels for a total of 14,102 genes (gray dots) could be compared (see ‘Materials and methods’). Only 88 genes (red dots) showed a statistically significant upregulation (adjusted p-value≤0.05, log2-fold change ≥1), which we refer to in subsequent analyses as ISGs.
Figure 3—figure supplement 3
Interferon induction has a reduced effect on interferon-stimulated gene (ISG) expression in ninein-like (NINL) knockout (KO) cells.
Differential gene expression of 88 ISGs (identified in Figure 3—figure supplement 2) from RNAseq analyses of the indicated cell lines pretreated with interferon alpha (IFNα) compared to untreated. Each condition (untreated or IFNα) was performed in triplicate, with independent RNA extractions, sequencing library preparation, and sequencing. Only the 88 genes significantly upregulated in wild-type (WT) cells, which we refer to as ISGs (adjusted p-value≤0.05, log2-fold change ≥ 1), are shown for each cell line. Data are displayed as a violin plot of ISG upregulation, with the dotted line indicating the mean. ****p<0.0001 based on one-way ANOVA test.
Figure 3—figure supplement 4
Differential gene expression in ninein-like (NINL) knockout (KO) and NIN KO cells compared to wild-type (WT) cells.
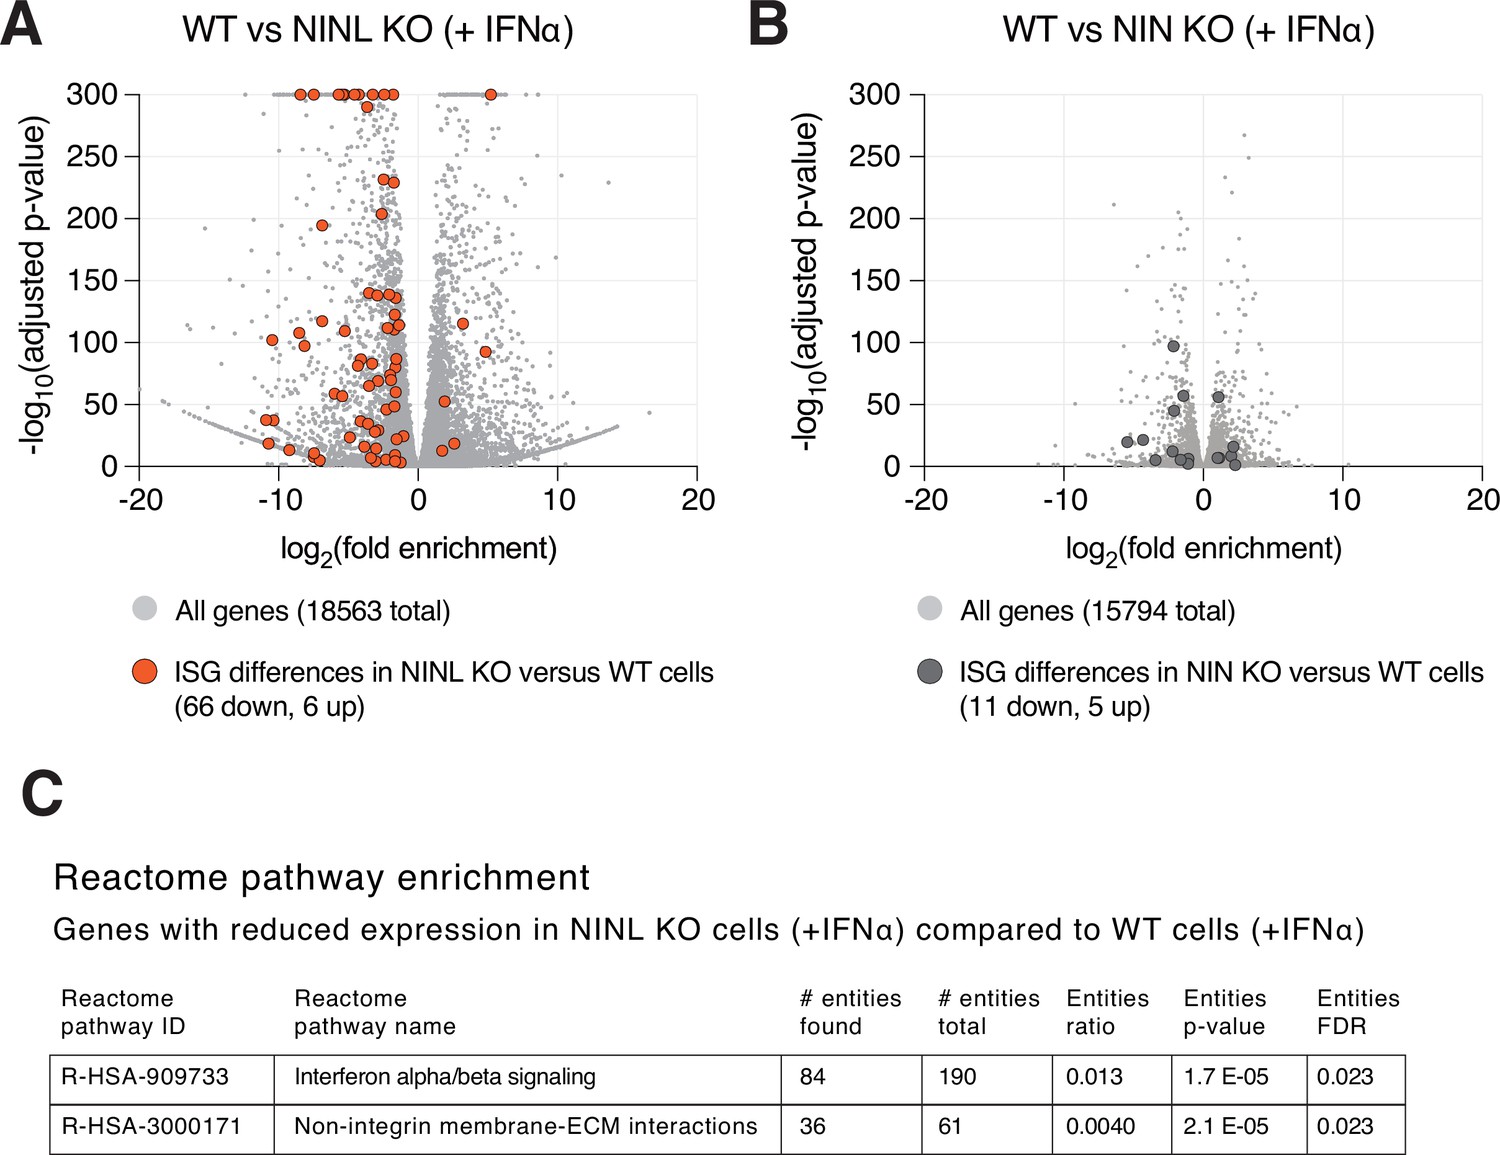
(A) Differential gene expression from RNAseq analyses of NINL KO cells treated with interferon alpha (IFNα) compared to WT A549 cells treated with IFNα. Each cell line (NINL KO or WT) was treated with IFNα in triplicate, with independent RNA extractions, sequencing library preparation, and sequencing. RNA levels for a total of 18,563 genes (gray dots) could be compared (see ‘Materials and methods’). Orange dots highlight the 72 interferon-stimulated genes (ISGs) that are significantly differentially expressed between cell lines, with the majority (66 of 72) of ISGs significantly lower in NINL KO cells (adjusted p-value ≤ 0.05, log2-fold change ≤ –1). (B) Differential gene expression from RNAseq analyses of NIN KO cells treated with IFNα compared to WT A549 cells treated with IFNα. Dark gray dots highlight the 11 ISGs that are significantly differentially expressed between cell lines. (C) Reactome pathway analysis (Jassal et al., 2020) of the 3549 genes with significantly lower expression (adjusted p-value ≤ 0.05, log2-fold change ≤ –1) in NINL KO cells treated with IFNα relative to WT cells treated with IFNα. Only the two pathways shown were identified as significantly different between the cell lines. The number of genes found to be lower in NINL KO cells (# entities found) compared to the number of genes in the indicated pathway (# entities total) is shown. The p-value, as well as false discovery rate (FDR)-adjusted p-values, is shown.
Figure 3—figure supplement 5
Ninein-like (NINL) knockout (KO) results in loss of interferon sensitivity of the VacV J3 mutant.
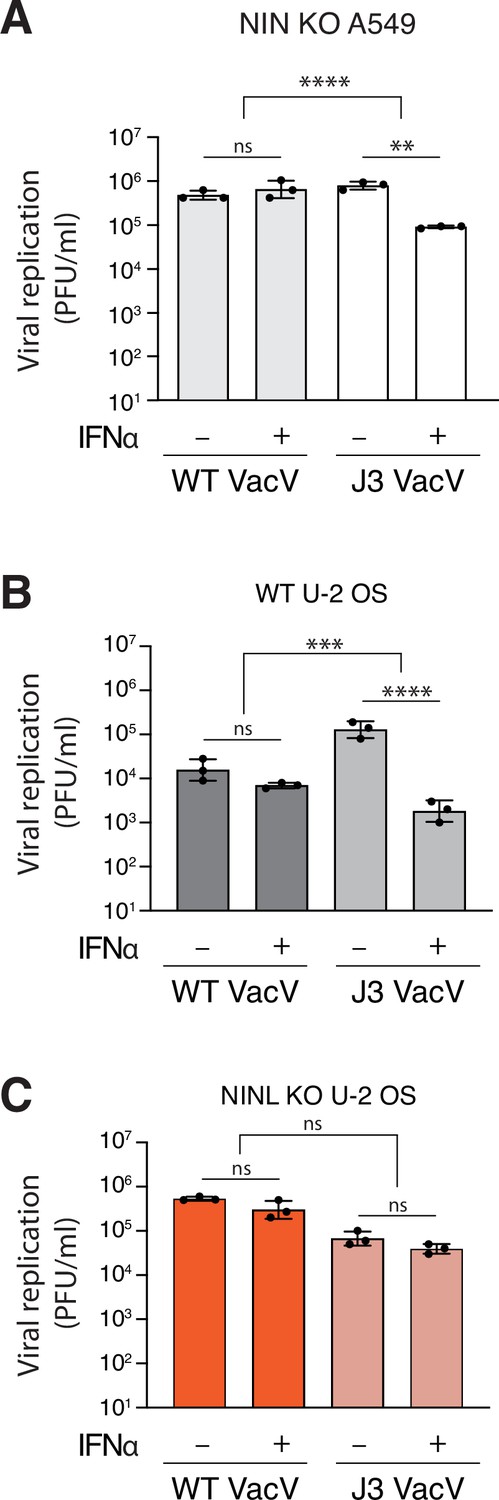
(A) A549 NIN KO cells were treated with 1000U interferon alpha (IFNα) for 24 hr, then infected with wild-type vaccinia virus (VacV WT) or J3 mutant vaccinia virus (J3 VacV) (50,000 PFU/mL, MOI ≈ 0.1). Cell-associated virus was collected 24 hr post-infection and viral titers (y-axis, PFU/mL) were determined by plaque assay. (B) U-2 OS WT cells were treated with 1000U IFNα for 24 hr, then infected with VacV WT or J3 VacV (50,000 PFU/mL, MOI ≈ 0.1). Cells were collected 24 hr post-infection and viral titers (y-axis, PFU/mL) were determined by plaque assay. (C) U-2 OS NINL KO cells were treated, infected, harvested, and collected as indicated in (B). (A–C) Data are presented as mean ± standard deviation of three experiments, with individual points shown. Data were analyzed by two-way ANOVA with Tukey’s method adjustment for multiple comparisons for IFNα treatment within each viral infection, two-way ANOVA interaction comparison for IFNα interaction between viral infections, and are presented as mean ± standard deviation of three experiments, with individual points shown. **p<0.01, ***p<0.001, ns, not significant.
-
Figure 3—figure supplement 5—source data 1
Individual data values for Figure 3—figure supplement 5A–C.
- https://cdn.elifesciences.org/articles/81606/elife-81606-fig3-figsupp5-data1-v2.xlsx
Figure 4 with 1 supplement
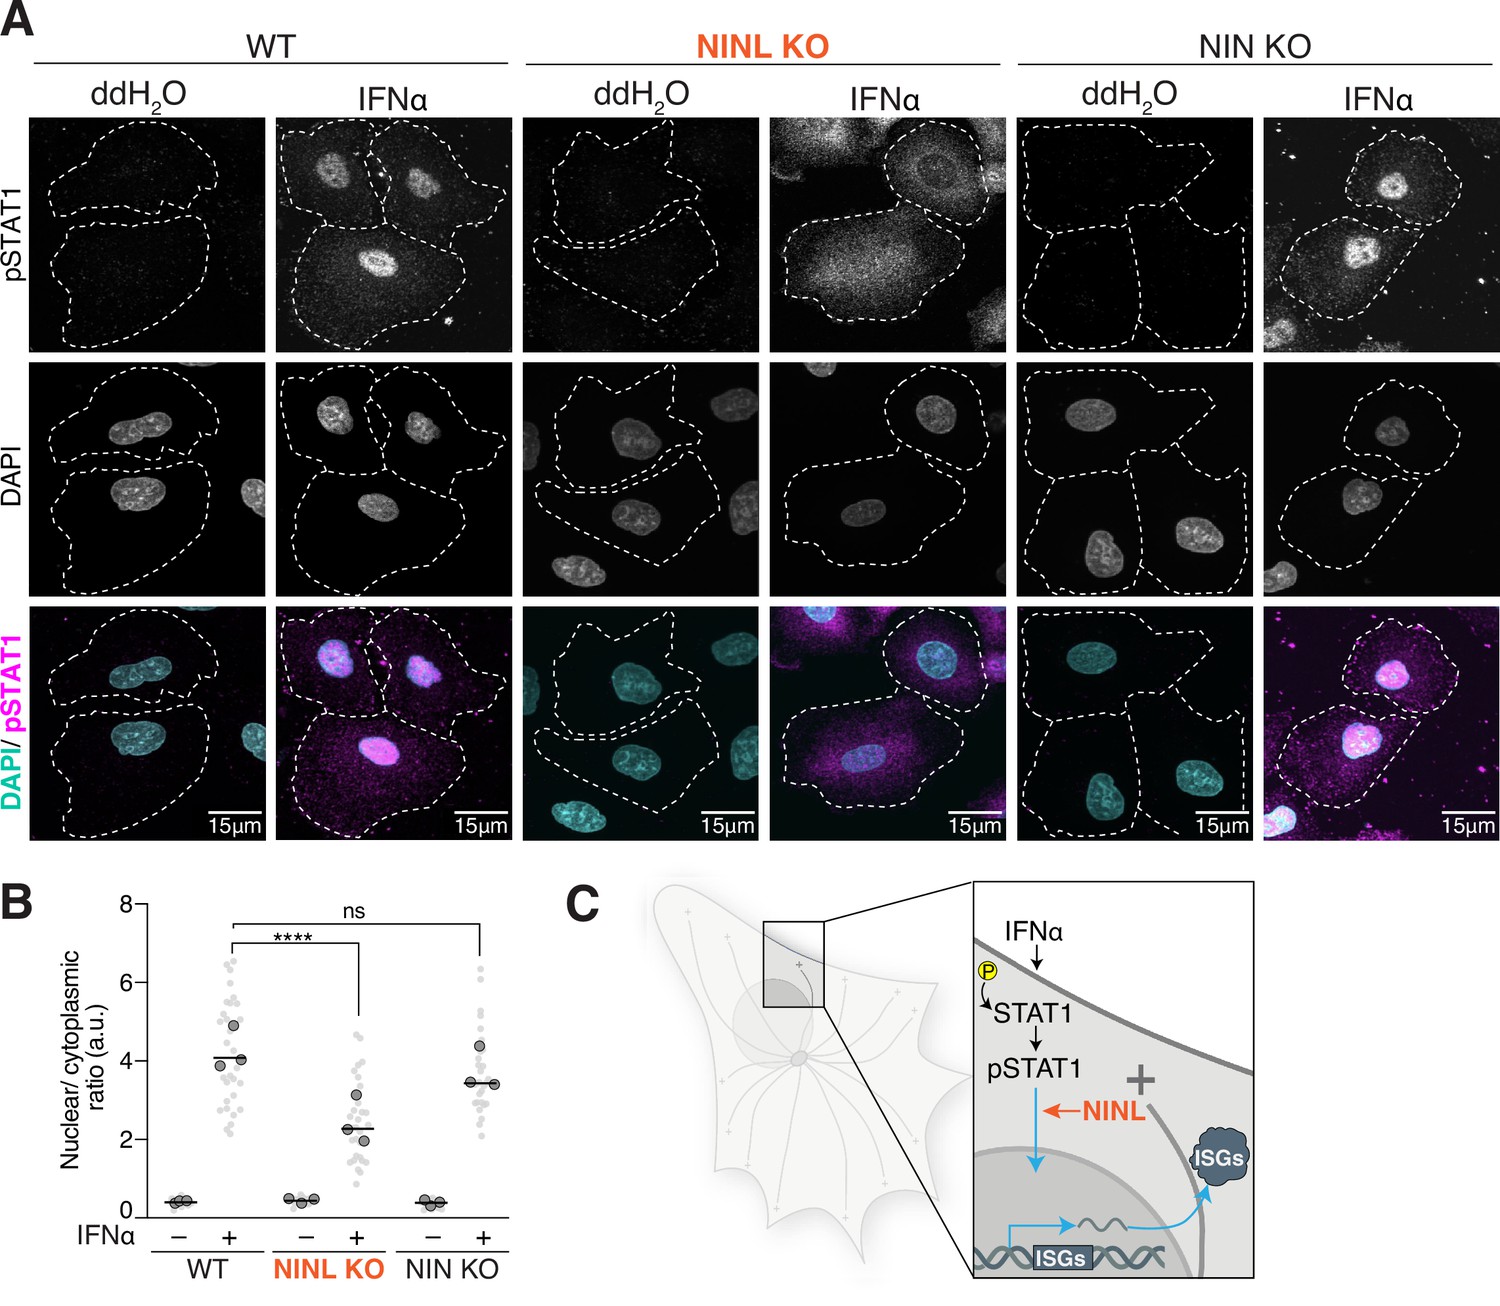
Ninein-like (NINL) knockout (KO) cells have reduced pSTAT1 nuclear localization.
(A) Confocal micrographs displayed as maximum intensity projections of wild-type (WT), NINL KO, and NIN KO A549 cells. Where indicated, cells were treated for 1 hr with 1000U interferon alpha (IFNα). pSTAT1 was immunostained with anti-phosphorylated STAT1 (Y701) and nuclei were visualized with DAPI. Dashed white lines denote cell boundaries. Representative micrographs from three biological replicates are shown. 15 μm scale bars are also shown. (B) Quantification of the mean nuclear to mean cytoplasmic fluorescence intensity of pSTAT1 from three biological replicates. Light gray datapoints correspond to the mean ratio of all cells in a field of view. Dark gray, large, outlined circles correspond to the mean for each of the three biological replicates. For each condition, n = 30. The mean across all replicates is denoted by the bold line. Data were analyzed using Kruskal–Wallis with Dunn’s post-hoc test for multiple comparisons. ****p<0.0001, ns, not significant. (C) Schematic depicting where in the IFN signaling pathway NINL acts.
-
Figure 4—source data 1
Individual data values for Figure 4B.
- https://cdn.elifesciences.org/articles/81606/elife-81606-fig4-data1-v2.xlsx
Figure 4—figure supplement 1
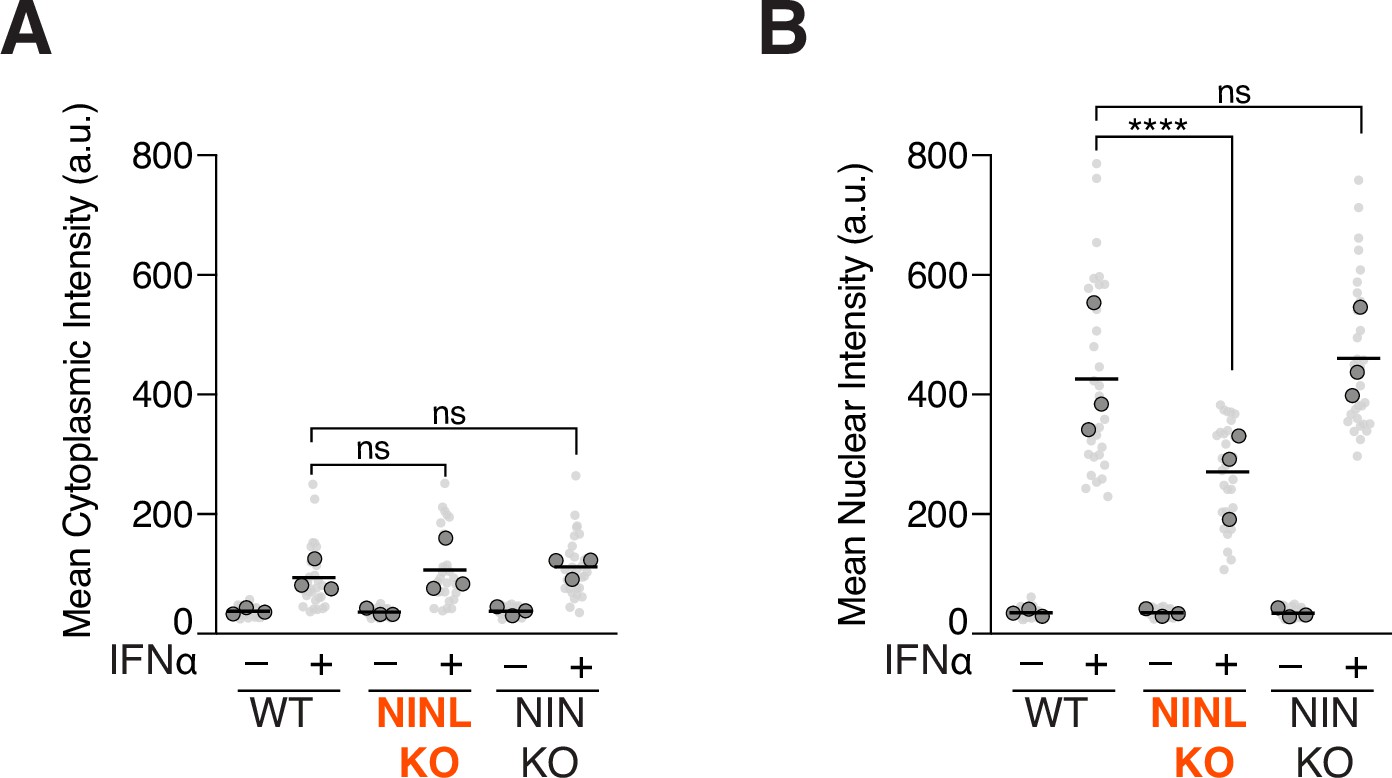
Ninein-like (NINL) knockout (KO) cells show reduced nuclear, but not cytoplasmic, intensity of pSTAT1.
(A) Quantification of the mean cytoplasmic pSTAT1 fluorescence intensity from three biological replicates. Light gray datapoints correspond to the mean intensity of all cells in a field of view. Dark gray, large, outlined circles correspond to the mean intensity for each of the three biological replicates. For each condition, n = 30. The mean across all replicates is denoted by the bold line. Data were analyzed using Kruskal–Wallis with Dunn’s post-hoc test for multiple comparisons. ns, not significant. (B) Quantification of the mean nuclear intensity from three biological replicates. Light gray datapoints correspond to the mean intensity of all cells in a field of view. Dark gray, large, outlined circles correspond to the mean intensity for each of the three biological replicates. For each condition, n = 30. The mean across all replicates is denoted by the bold line. Data were analyzed using Kruskal–Wallis with Dunn’s post-hoc test for multiple comparisons. ****p<0.0001, ns, not significant.
-
Figure 4—figure supplement 1—source data 1
Individual data values for Figure 4—figure supplement 1.
- https://cdn.elifesciences.org/articles/81606/elife-81606-fig4-figsupp1-data1-v2.xlsx
Figure 5 with 1 supplement
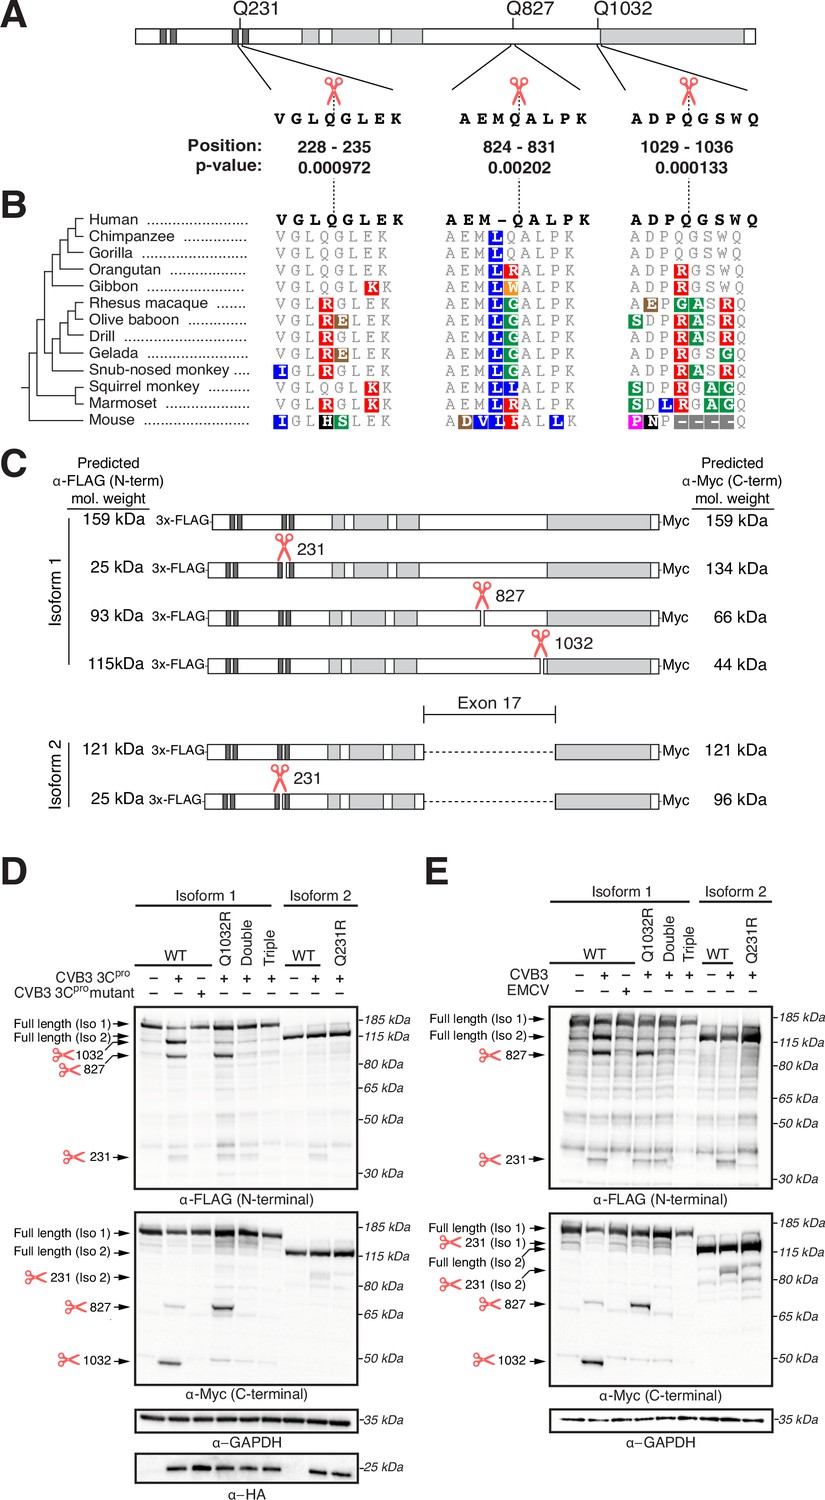
Ninein-like (NINL) is cleaved at species-specific sites by virally encoded proteases.
(A) Schematic of human NINL, with positions of predicted 3Cpro cleavage sites annotated. Shown are the four amino acids on each side of the predicted cleavage site in human NINL, along with the residue positions and cleavage score predicted using a motif search with the consensus enterovirus cleavage site (see ‘Materials and methods’). (B) NINL sequences from 12 primate species and mice for each predicted 3Cpro cleavage site. Amino acid changes relative to human NINL are highlighted in colors to denote differences in polarity and charge. (C) Schematic of 3xFLAG-NINL-Myc isoform 1 and isoform 2 constructs, with predicted molecular weights for both amino-terminal (FLAG) and carboxy-terminal (Myc) products upon cleavage by 3Cpro. (D) Immunoblots of extracts from HEK293T cells co-transfected with the indicated NINL constructs and either CVB3 3Cpro or the catalytically inactive (C147A) CVB3 3Cpro (mutant). Immunoblots were probed with anti-FLAG (NINL amino-terminus), anti-Myc (NINL carboxy-terminus), anti-HA (3Cpro), and anti-GAPDH (loading control). Arrows to the left of each immunoblot indicate full-length products as well as products corresponding to cleavage at the indicated amino acid residue. Protein molecular weight markers are shown in kilodaltons (kDa) to the right of each immunoblot. Representative images from three biological replicates are shown. (E) Immunoblots of extracts from HEK293T cells transfected with the indicated amino-terminal FLAG and carboxyl-terminal Myc tagged NINL constructs and infected with either CVB3 or EMCV (500,000 PFU/mL, MOI ≈ 1.0 for 8 hr). Immunoblots were probed with anti-FLAG (NINL amino-terminus), anti-Myc (NINL carboxy-terminus), and anti-GAPDH (loading control). Arrows to the left of each immunoblot indicate full length products as well as products corresponding to CVB3 3Cpro cleavage at the indicated amino acid residue. Protein molecular weight markers are shown in kilodaltons (kDa) to the right of each immunoblot. Representative images from three biological replicates are shown.
-
Figure 5—source data 1
Full raw unedited images for Figure 5D and E.
- https://cdn.elifesciences.org/articles/81606/elife-81606-fig5-data1-v2.zip
Figure 5—figure supplement 1
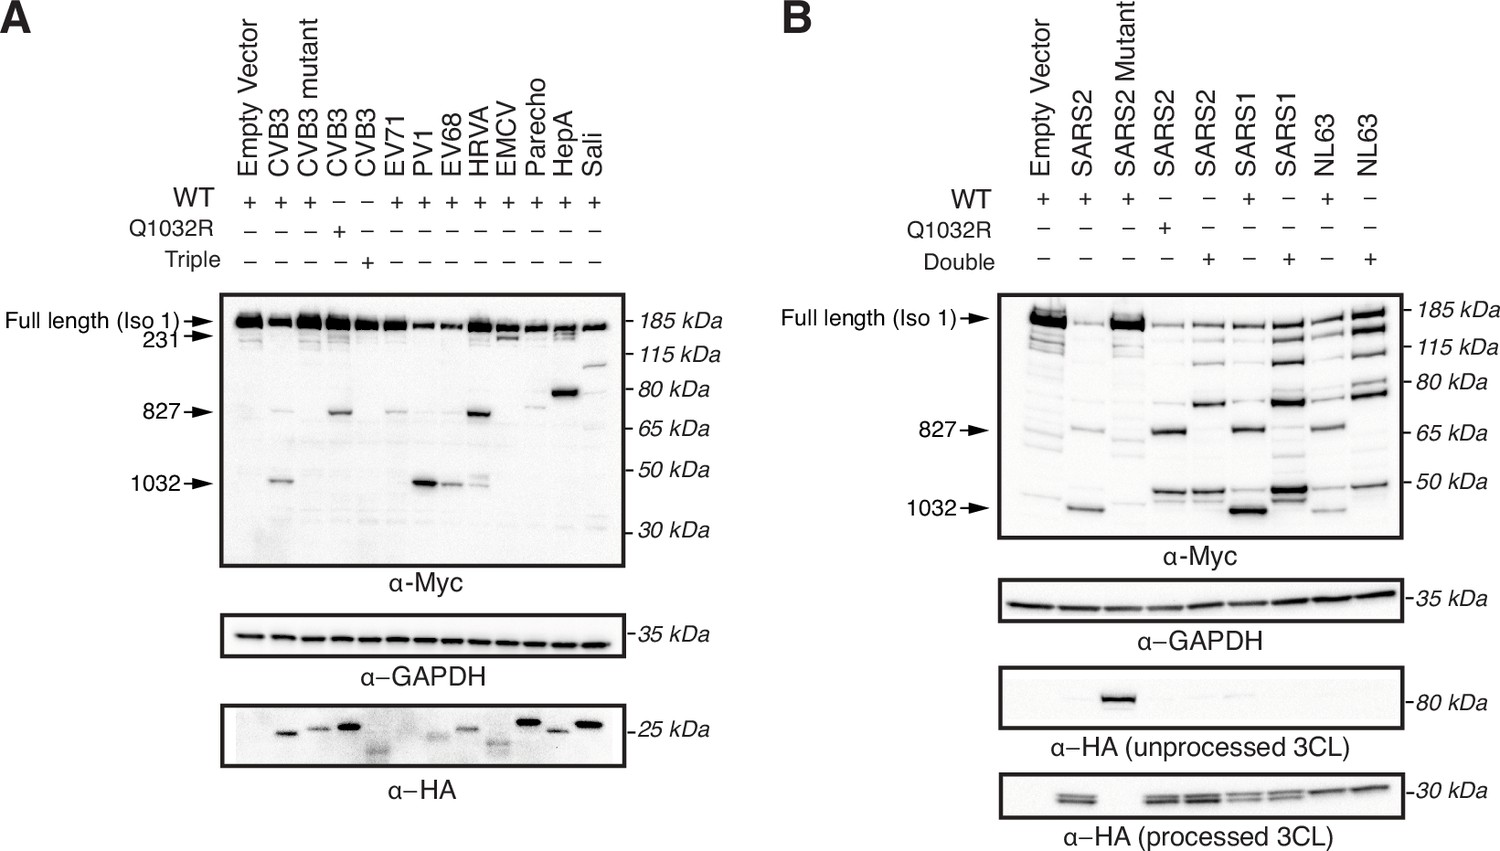
3C and 3CL proteases from diverse viruses cleave ninein-like (NINL) at redundant and unique sites.
(A) Immunoblots of extracts from HEK293T cells co-transfected with the indicated NINL constructs and 3Cpro from the indicated picornavirus. CVB3: coxsackievirus B3; CVB3 mutant: catalytically inactive (C147A) CVB3 3Cpro; EV71: enterovirus A71; PV1: poliovirus 1; EV68: enterovirus D68; HRVA: human rhinovirus A; EMCV: encephalomyocarditis virus; Parecho: parechovirus A; HepA: hepatitis A virus; Sali: salivirus A. Immunoblots were probed with anti-Myc (NINL carboxy-terminus), anti-HA (3Cpro), and anti-GAPDH (loading control). Arrows to the left of each immunoblot indicate full-length products as well as products corresponding to CVB3 3Cpro cleavage at the indicated amino acid residue. Protein molecular weight markers are shown in kilodaltons (kDa) to the right of each immunoblot. Representative images from three biological replicates are shown. (B) Immunoblots of extracts from HEK293T cells co-transfected with the indicated NINL constructs and the indicated coronaviral 3CLpro. SARS2: SARS-CoV-2, SARS2 mutant: catalytically inactive (C145A) SARS-CoV-2 3CLpro SARS1: SARS-CoV, NL63: HCoV-NL63. 3CLpros were expressed as self-cleaving constructs that remove a carboxy-terminal mCherry-HA tag. Immunoblots were probed with anti-Myc (NINL carboxy-terminal), anti-HA (cleaved mCherry-HA from catalytically active protease constructs, or eGFP-3CLpro-mCherry-HA from catalytically inactive protease constructs), and anti-GAPDH (loading control). Arrows to the left of each immunoblot indicate full-length products as well as products corresponding to SARS-CoV-2 3CLpro cleavage at the indicated amino acid residue. Protein molecular weight markers are shown in kilodaltons (kDa) to the right of each immunoblot. Representative images from three biological replicates are shown.
-
Figure 5—figure supplement 1—source data 1
Full raw unedited images for Figure 5—figure supplement 1A and B.
- https://cdn.elifesciences.org/articles/81606/elife-81606-fig5-figsupp1-data1-v2.zip
Figure 6 with 1 supplement
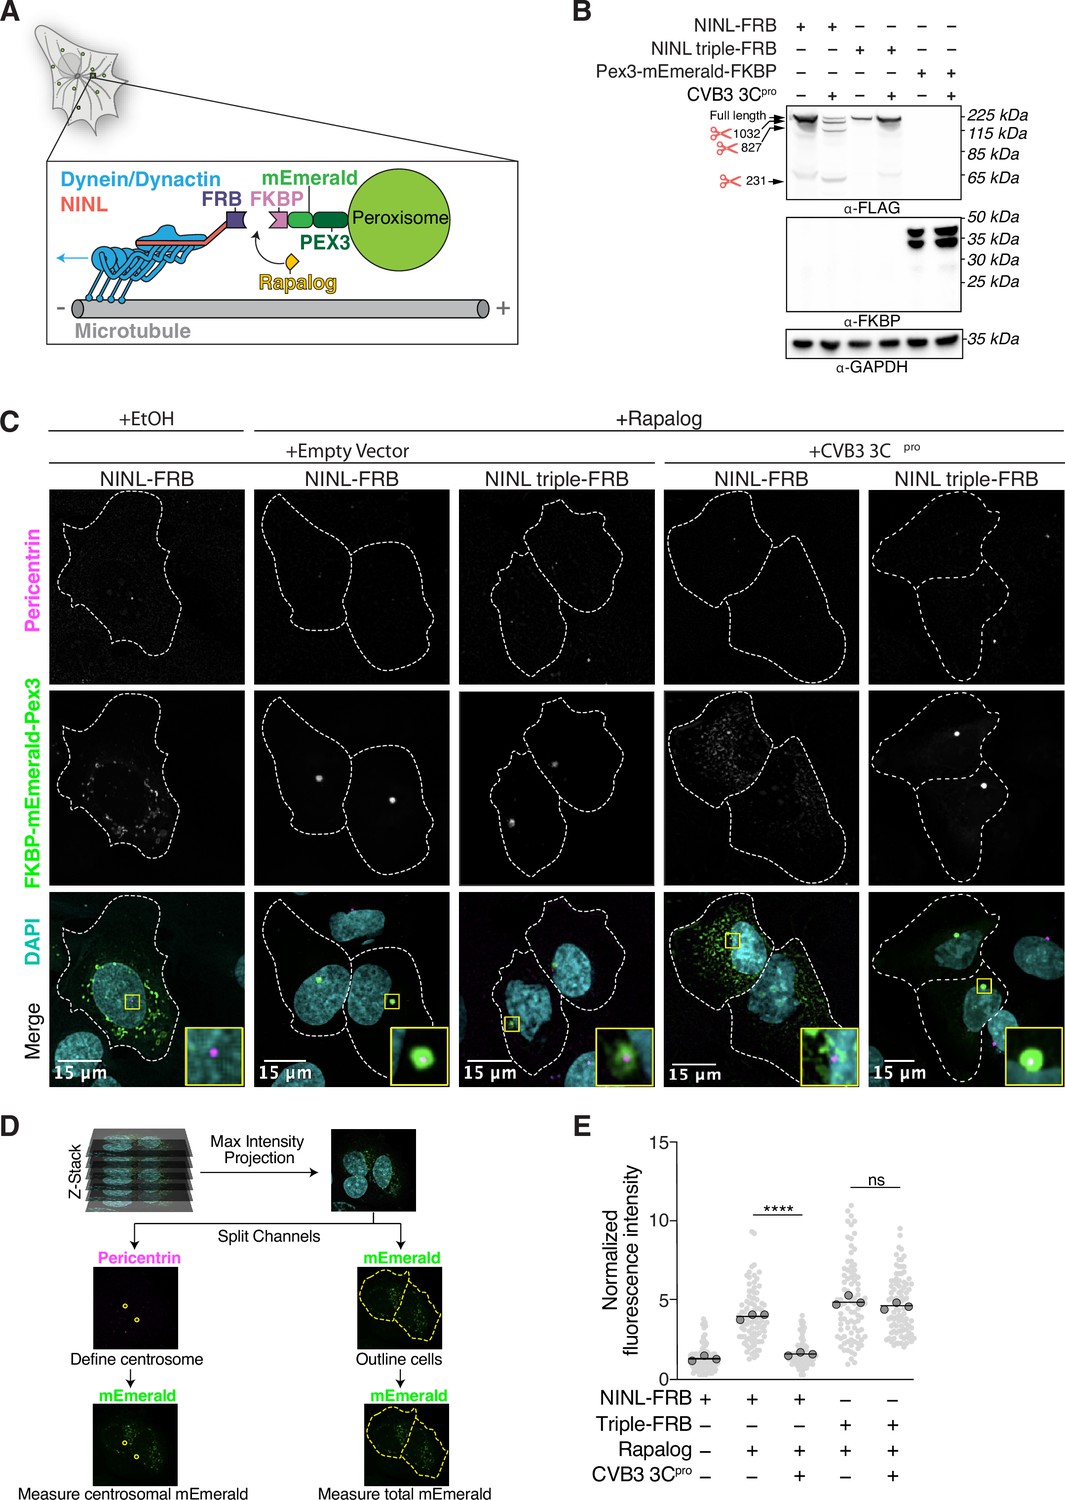
CVB3 3Cpro cleavage of ninein-like (NINL) prevents rapalog-induced dynein-dependent transport of intracellular cargoes.
(A) Schematic of the peroxisomal trafficking assay. The peroxisomal targeting signal (PTS1) of human PEX3 (amino acids 1–42) was fused to mEmerald and FKBP and a truncated NINL (amino acids 1–1062) was fused to FRB. Dynein-dependent accumulation of peroxisomes at the centrosome, where most minus-ends are located, is initiated by the rapalog-mediated heterodimerization of FKBP and FRB. Blue arrow indicates dynein motility. (B) Indicated FRB and FKBP constructs transiently expressed with (+) or without (-) the transient co-expression of HA-tagged CVB3 3Cpro in HEK293T cells. Immunoblots were probed with anti-FLAG, anti-FKBP, anti-GAPDH, and anti-HA antibodies. Protein molecular weight markers are shown in kilodaltons (kDa) to the left of each immunoblot. Representative images from three biological replicates are shown. (C) Confocal micrographs are displayed as maximum intensity projections of U-2 OS cells, transfected with Pex3-mEmerald-FKBP and the indicated cleavable or uncleavable NINL-FRB fusion constructs with or without the co-expression of CVB3 3Cpro. Where indicated, cells were treated for 1 hr with ethanol (EtOH) as a control or 1 μM rapalog in EtOH prior to fixation. Centrosomes were immunostained with anti-pericentrin and nuclei were visualized with DAPI. 15 μm scale bars indicated in lower-left corner of merged micrographs. Yellow rectangles denote region of cropped inset. Dashed white lines denote cellular boundaries. Representative micrographs from three biological replicates are shown. (D) Schematic of the analysis pipeline. (E) Quantification of peroxisomal trafficking assays from three biological replicates. The fluorescence intensity of Pex3-mEmerald-FKBP at the centrosome was normalized to the whole-cell fluorescence, and to the areas of the regions of interest used to quantify centrosome versus whole-cell fluorescence. Each datapoint corresponds to an individual cell. The dark gray, large, outlined circles correspond to the mean for each biological replicate. For each condition, n = ~80. The mean across all replicates is denoted by the bold line. Data were analyzed using Kruskal–Wallis with Dunn’s post-hoc test for multiple comparisons. ****p<0.0001, ns, not significant.
-
Figure 6—source data 1
Full raw unedited images for Figure 6B.
- https://cdn.elifesciences.org/articles/81606/elife-81606-fig6-data1-v2.zip
-
Figure 6—source data 2
Individual data values for Figure 6E and Figure 6—figure supplement 1C.
- https://cdn.elifesciences.org/articles/81606/elife-81606-fig6-data2-v2.xlsx
Figure 6—figure supplement 1
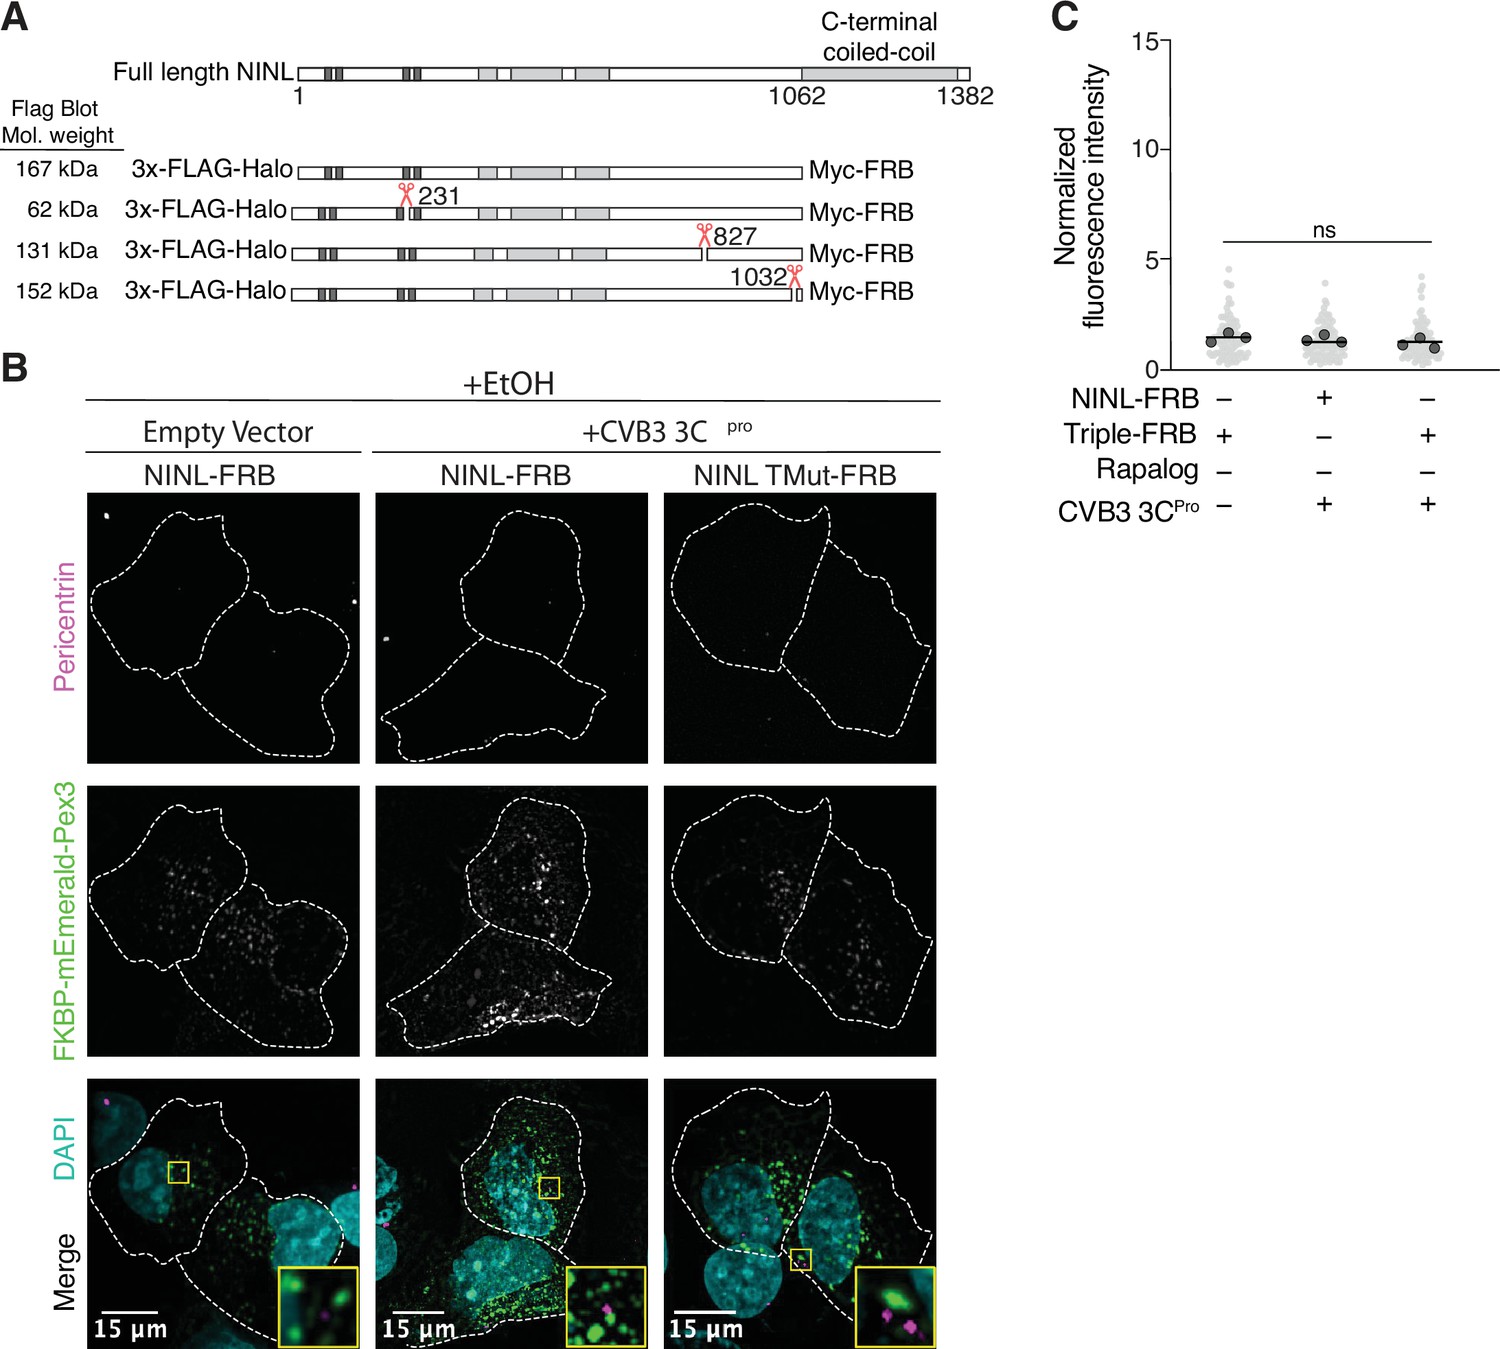
Peroxisome distribution remains consistent regardless of presence of CVB3 3Cpro prior to rapalog-induced dynein-dependent transport.
(A) Schematic of full length ninein-like (NINL) and NINL-FRB fusion constructs. NINL-FRB constructs are truncated at residue 1062 as indicated. Shown are the predicted molecular weights for each 3xFLAG tagged amino-terminal cleavage product produced by 3Cpro. (B) Peroxisome distribution controls. Confocal micrographs displayed as maximum intensity projections of U-2 OS cells, transfected with Pex3-mEmerald-FKBP and the indicated cleavable or uncleavable NINL-FRB fusion constructs with or without the co-expression of CVB3 3Cpro treated for 1 hr with ethanol (EtOH) prior to fixation. Centrosomes were immunostained with anti-pericentrin and nuclei were visualized with DAPI. 15 μm scale bars are indicated in the lower-left corner of the merged micrographs. Yellow rectangles denote region of cropped inset. Dashed white lines denote cellular boundaries. Representative micrographs from three biological replicates are shown. (C) Quantification of peroxisomal trafficking assay from three biological replicates. The fluorescence intensity of Pex3-mEmerald-FKBP at the centrosome was normalized to the whole-cell fluorescence, and to the areas of the regions of interest used to quantify centrosome versus whole-cell fluorescence. Each datapoint corresponds to an individual cell and biological replicates can be distinguished by shade. For each condition, n = ~80. The mean across all replicates is denoted by the bold line. Bold circles correspond to the mean for each biological replicate. Data were analyzed using Kruskal–Wallis with Dunn’s post-hoc test for multiple comparisons. ns, not significant.
Figure 7 with 1 supplement
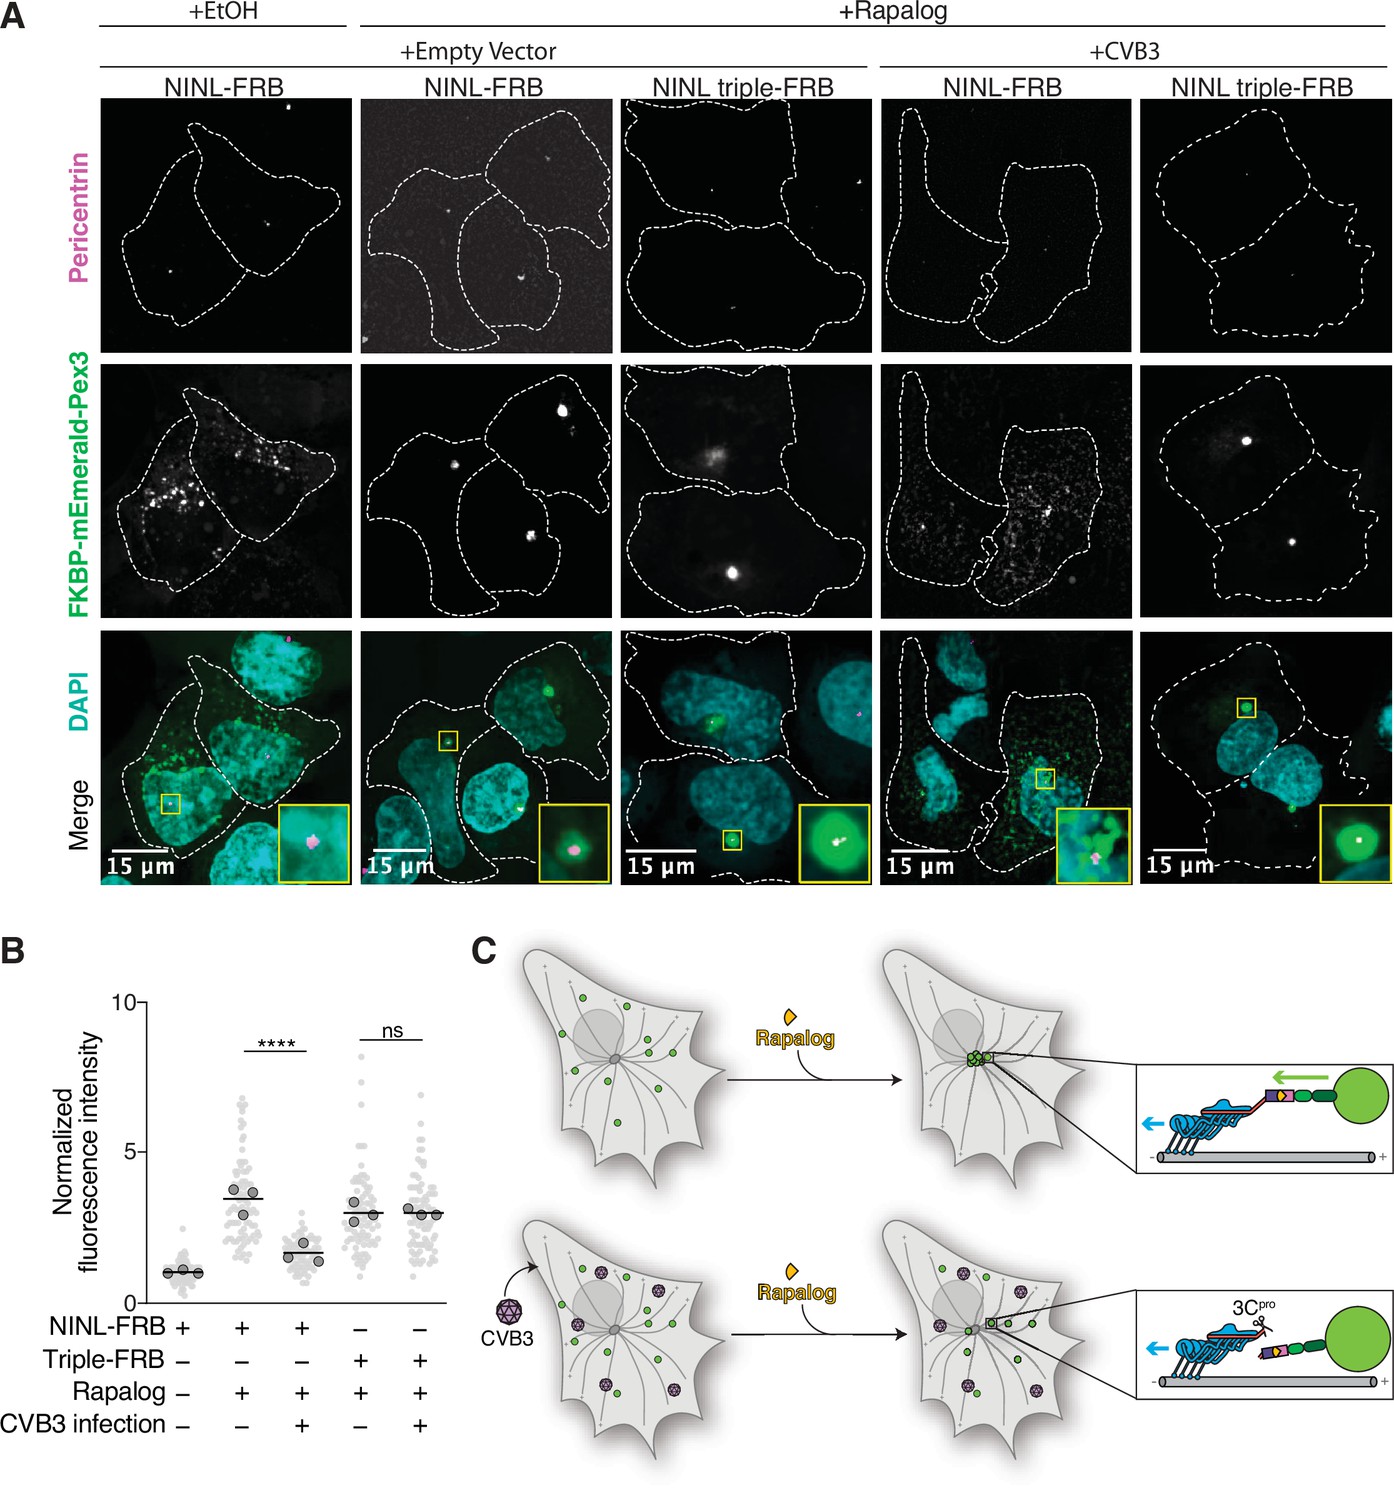
Cleavage of ninein-like (NINL) during viral infection prevents dynein-dependent transport of an intracellular cargo.
(A) Confocal micrographs displayed as maximum intensity projections of uninfected or CVB3 infected U-2 OS cells. Cells were transfected with Pex3-mEmerald-FKBP and the indicated cleavable or uncleavable NINL-FRB fusion constructs, and infected (or mock infected) with CVB3 (500,000 PFU/ml, MOI = ~2) for 5 hr. Cells were then treated for 1 hr with ethanol (EtOH) or 1 μM rapalog prior to fixation. Centrosomes were immunostained with anti-pericentrin and nuclei were visualized with DAPI. 15 μm scale bars are indicated in the lower-left corner of the merged micrographs. Yellow rectangles denote region of cropped inset. Dashed white lines denote cellular boundaries. Representative micrographs from three biological replicates are shown. (B) Quantification of peroxisomal trafficking assays from three biological replicates. The fluorescence intensity of Pex3-mEmerald-FKBP at the centrosome was normalized to the whole-cell fluorescence, and to the areas of the regions of interest used to quantify centrosome versus whole-cell fluorescence. Each datapoint corresponds to an individual cell and biological replicates can be distinguished by shade. For each condition, n = ~80. The mean across all replicates is denoted by the bold line. Bold circles correspond to the mean for each biological replicate. Data were analyzed using Kruskal–Wallis with Dunn’s post-hoc test for multiple comparisons. ****p<0.0001, ns, not significant. (C) Schematic of the rapalog-induced pericentrosomal accumulation of peroxisomes and loss of accumulation upon viral infection.
-
Figure 7—source data 1
Individual data values for Figure 7B and Figure 7—figure supplement 1B.
- https://cdn.elifesciences.org/articles/81606/elife-81606-fig7-data1-v2.xlsx
Figure 7—figure supplement 1
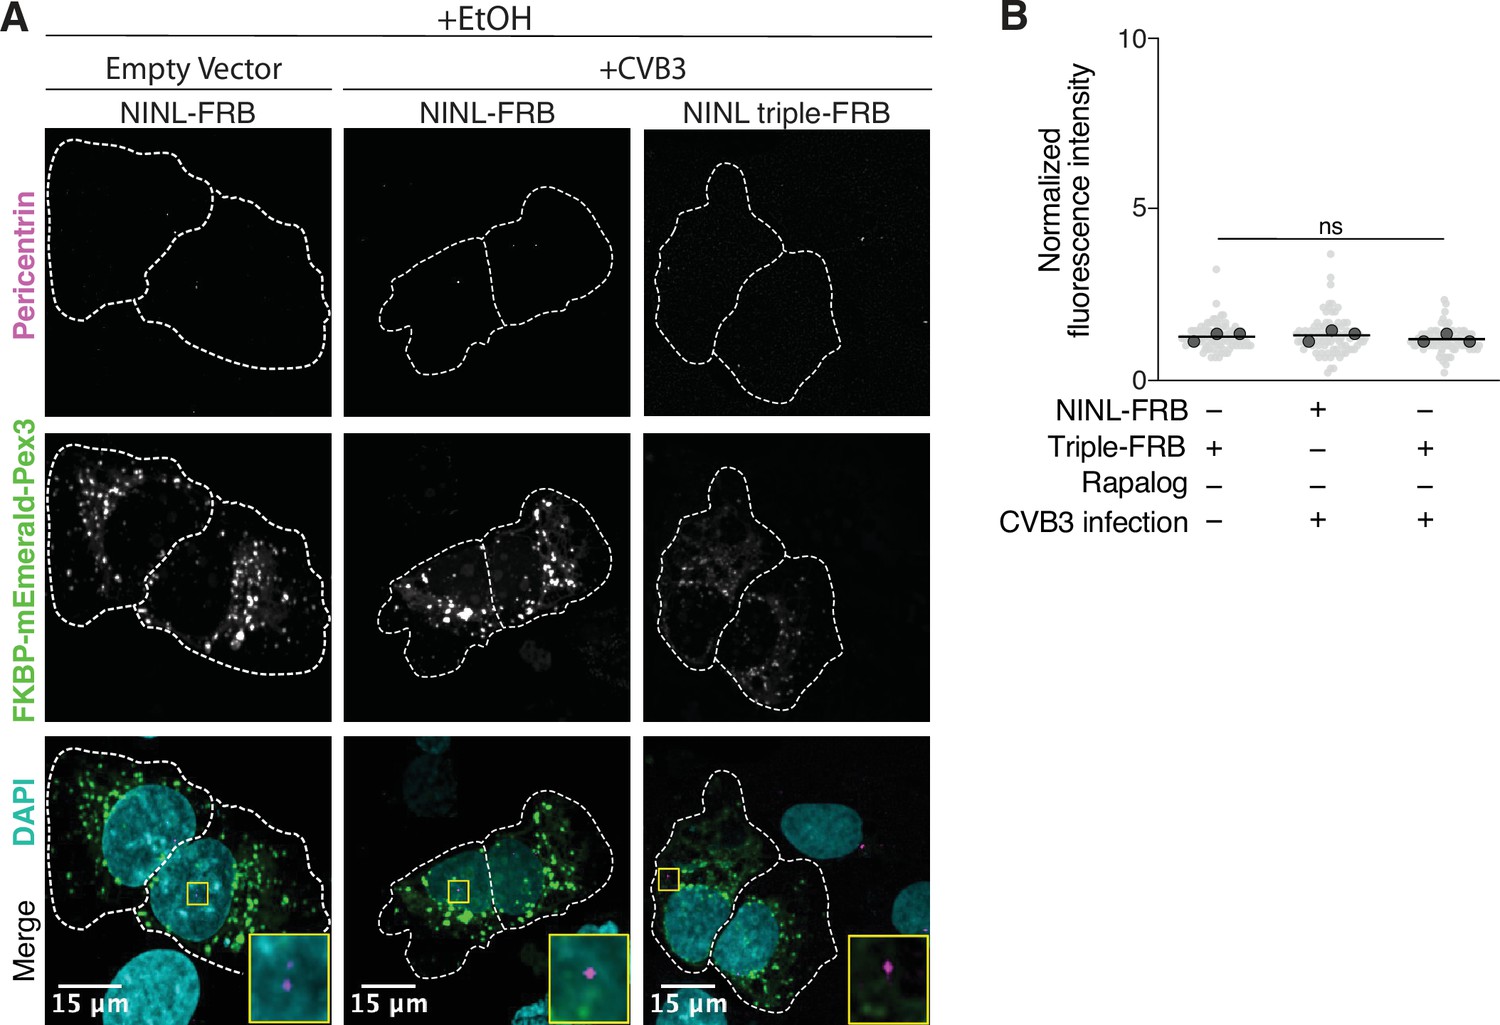
Peroxisome distribution remains consistent regardless of CVB3 infection prior to rapalog-induced dynein-mediated transport.
(A) Peroxisome distribution controls. Confocal micrographs displayed as maximum intensity projections of uninfected or CVB3 infected U-2 OS cells expressing Pex3-mEmerald-FKBP and the indicated cleavable or uncleavable NINL-FRB fusion constructs treated for 1 hr with ethanol (EtOH) prior to fixation. Centrosomes were immunostained with anti-pericentrin and nuclei were stained with DAPI. 15 μm scale bars are indicated in the lower-left corner of the merged micrographs. Yellow rectangles denote region of cropped inset. Dashed white lines denote cellular boundaries. Representative micrographs from three biological replicates are shown. (B) Quantification of peroxisomal trafficking assays from three biological replicates. Fluorescence intensity of Pex3-mEmerald-FKBP at the centrosome was normalized to the whole-cell fluorescence, and to the areas of the regions of interest used to quantify centrosome versus whole-cell fluorescence. Each datapoint corresponds to an individual cell and biological replicates can be distinguished by shade. For each condition, n = ~80. The mean across all replicates is denoted by a bold line. Bold circles correspond to the mean for each biological replicate. Data were analyzed using Kruskal–Wallis with Dunn’s post-hoc test for multiple comparisons. ns, not significant.
Tables
Key resources table
| Reagent type (species) or resource | Designation | Source or reference | Identifiers | Additional information |
|---|---|---|---|---|
| Gene (Homo sapiens) | NINL | NCBI | NM_025176 | |
| Gene (Ho. sapiens) | NIN | NCBI | NM_020921 | |
| Cell line (H. sapiens) | HEK293T | ATCC | Cat# CRL-3216; RRID:CVCL_0063 | |
| Cell line (H. sapiens) | A549 | ATCC | Cat# CRM-CCL-185; RRID:CVCL_0023 | |
| Cell line (H. sapiens) | A549 NINL KO Clone #2 | This paper | Exon 2 target (TCGGAAACGACCATTTCGCCAGG) | |
| Cell line (H. sapiens) | A549 NIN KO Clone #3 | This paper | Exon 5 target (TGGGAAGCGTTACGGACGAAGG) | |
| Cell line (H. sapiens) | U-2 OS | ATCC | Cat# HTB-96; RRID:CVCL_0042 | |
| Cell line (H. sapiens) | U-2 OS NINL KO Clone # 1 | This paper | Exon 2 target (TCGGAAACGACCATTTCGCCAGG) | |
| Cell line (H. sapiens) | Flp-In T-REx HCT116 NINL KO clone #13 | This paper | Exon 6 target (CCACTCGGGTTAAACCGAGCAAG) | |
| Cell line (H. sapiens) | Flp-In T-REx HCT116 NIN KO clone #2 | This paper | Exon 3 target (GTTTTGACACGACGGGCACAGGG) | |
| Sequence-based reagent | Oligonucleotides | Other | See Supplementary file 5 for list of oligonucleotides used in this study | |
| Recombinant DNA reagent | pDL2118-mCherry-P2A-3x Flag-NINL-(Q231/827/1032R)-Myc | This paper | See Supplementary file 5 for notes on plasmid design | |
| Recombinant DNA reagent | pDL2118-mCherry-P2A-3x Flag-NINL(iso1)-Myc | This paper | See Supplementary file 5 for notes on plasmid design | |
| Recombinant DNA reagent | pDL2118-mCherry-P2A-3x Flag-NINL(iso2 Q231R)-Myc | This paper | See Supplementary file 5 for notes on plasmid design | |
| Recombinant DNA reagent | pDL2118-mCherry-P2A-3x Flag-NINL(iso2)-Myc | This paper | See Supplementary file 5 for notes on plasmid design | |
| Recombinant DNA reagent | pDL2118-mCherry-P2A-3x Flag-NINL(Q231R)-Myc | This paper | See Supplementary file 5 for notes on plasmid design | |
| Recombinant DNA reagent | pDL2118-mCherry-P2A-3x Flag-NINL(Q827R)-Myc | This paper | See Supplementary file 5 for notes on plasmid design | |
| Recombinant DNA reagent | pDL2118mCherry-P2A-3x Flag-NINL(Q1032R)-Myc | This paper | See Supplementary file 5 for notes on plasmid design | |
| Recombinant DNA reagent | pQCXIP-HA-CVB3(Nancy Strain)-3Cpro | PMID:33410748 | ||
| Recombinant DNA reagent | pQCXIP-HA-CVB3(Nancy Strain)-3Cpro(C147A) | PMID:33410748 | ||
| Recombinant DNA reagent | pQCXIP-HA-EMCV-3Cpro | PMID:33410748 | ||
| Recombinant DNA reagent | pQCXIP-HA-EV68-3Cpro | PMID:33410748 | ||
| Recombinant DNA reagent | pQCXIP-HA-EV71-3Cpro | PMID:33410748 | ||
| Recombinant DNA reagent | pQCXIP-HA-HepA-3Cpro | PMID:33410748 | ||
| Recombinant DNA reagent | pQCXIP-HA-HRVA-3Cpro | PMID:33410748 | ||
| Recombinant DNA reagent | pQCXIP-HA-NL63-3CLpro | This paper | See Supplementary file 5 for notes on plasmid design | |
| Recombinant DNA reagent | pQCXIP-HA-Parecho-3Cpro | PMID:33410748 | ||
| Recombinant DNA reagent | pQCXIP-HA-PV1-3Cpro | PMID:33410748 | ||
| Recombinant DNA reagent | pQCXIP-HA-Sali-3Cpro | PMID:33410748 | ||
| Recombinant DNA reagent | pQCXIP-HA-SARS1-3CLpro | This paper | See Supplementary file 5 for notes on plasmid design | |
| Recombinant DNA reagent | pQCXIP-HA-SARS2-3CLpro | This paper | See Supplementary file 5 for notes on plasmid design | |
| Recombinant DNA reagent | pQCXIP-HA-SARS2-3CLpro(C145A) | This paper | See Supplementary file 5 for notes on plasmid design | |
| Recombinant DNA reagent | pSPCas9(BB)-2A-Puro-V2.0-NINLexon2-gRNA | This paper | See Supplementary file 5 for notes on plasmid design | |
| Recombinant DNA reagent | pSPCas9(BB)-2A-Puro-V2.0-NINLexon6-gRNA | This paper | See Supplementary file 5 for notes on plasmid design | |
| Recombinant DNA reagent | pSPCas9(BB)-2A-Puro-V2.0-NINexon3-gRNA | This paper | See Supplementary file 5 for notes on plasmid design | |
| Recombinant DNA reagent | pSPCas9(BB)-2A-Puro-V2.0-NINexon5-gRNA | This paper | See Supplementary file 5 for notes on plasmid design | |
| Recombinant DNA reagent | pSpCas9(BB)-2A-Puro (PX459) V2.0 | Addgene | Cat# 62988; RRID:Addgene_101732 | Gift from Feng Zhang |
| Recombinant DNA reagent | pcDNA3.1(+)-3xFlag- Halo-NINL-Myc-FRB | This paper | See Supplementary file 5 for notes on plasmid design | |
| Recombinant DNA reagent | pcDNA3.1(+)-3xFlag- Halo_NINL(1-1062)-Myc-FRB | This paper | See Supplementary file 5 for notes on plasmid design | |
| Recombinant DNA reagent | pcDNA3.1(+)–3xFlag- Halo-NINL(1-1062)(Q231/827/1032R)-Myc-FRB | This paper | See Supplementary file 5 for notes on plasmid design | |
| Recombinant DNA reagent | pcDNA3.1(+)-Pex3-Emerald-FKBP | This paper | See Supplementary file 5 for notes on plasmid design | |
| Recombinant DNA reagent | CVB3 (strain Nancy) infectious clone plasmid | PMID:2410905 | Gift from Dr. Julie Pfeiffer | |
| Recombinant DNA reagent | EMCV (strain Mengo) infectious clone plasmid | PMID:2538661 | Gift from Dr. Julie Pfeiffer | |
| Recombinant DNA reagent | T7 plasmid | PMID:31666382 | Gift from Dr. Julie Pfeiffer | |
| Recombinant DNA reagent | SinV (strain Toto1101) infectious clone plasmid | PMID:12388685 | From Dr. Charles Rice, Rockefeller University | |
| Recombinant DNA reagent | VSV-GFP (strain Indiana) | PMID:10400792 | From Dr. John Rose, Yale University | |
| Recombinant DNA reagent | Vaccinia virus (strain Western Reserve) | PMID:12359447 | From Dr. Richard Condit, University of Florida | |
| Recombinant DNA reagent | Vaccinia virus (strain Western Reserve), J3 K175R mutant | PMID:12359447 | From Dr. Richard Condit, University of Florida | |
| Chemical compound, drug | TransIT-X2 | Mirus | MIR 6000 | |
| Chemical compound, drug | Rapalog AP21967 | Takara Bio | 635055 | |
| Peptide, recombinant protein | Recombinant human Interferon alpha 2 | Abcam | ab200262 | |
| Antibody | α-Tubulin antibody (mouse monoclonal) | MilliporeSigma | Cat# T6199; RRID:AB_477583 | IF (1:300) |
| Antibody | β-Actin antibody (mouse monoclonal) | Thermo Fisher Scientific | Cat# MA5-15739; RRID:AB_10979409 | WB (1:1000) |
| Antibody | Flag antibody (mouse monoclonal) | Sigma-Aldrich | Cat# A8592; RRID:AB_439702 | WB (1:2000) |
| Antibody | GAPDH antibody (rabbit monoclonal) | Cell Signaling | Cat# 2118; RRID:AB_561053 | WB (1:1000) |
| Antibody | HA antibody (rat monoclonal) | Roche | Cat# 11867423001; RRID:AB_390918 | WB (1:1000) |
| Antibody | IFIT3 antibody (mouse polyclonal) | Abcam | Cat# ab76818; RRID:AB_1566324 | WB (1:1000) |
| Antibody | ISG15 antibody (rabbit polyclonal) | Cell Signaling Technology | Cat# 2743; RRID:AB_2126201 | WB (1:1000) |
| Antibody | Mx1 antibody (rabbit monoclonal) | Cell Signaling Technology | Cat# 37849; RRID:AB_2799122 | WB (1:1000) |
| Antibody | Myc antibody (rabbit monoclonal) | Cell Signaling Technology | Cat# 2278; RRID:AB_490778 | WB (1:1000) |
| Antibody | NIN antibody (rabbit polyclonal) | Lifespan Biosciences | Cat# LS-C668760 | WB (1:1000) |
| Antibody | NINL antibody (rabbit polyclonal) | Thermo Fisher Scientific | Cat# PA5-51438; RRID:AB_2644681 | WB (1:1000) |
| Antibody | Oas1 antibody (rabbit monoclonal) | Cell Signaling Technology | Cat# 14498; RRID:AB_2798498 | WB (1:1000) |
| Antibody | Pericentrin antibody (rabbit polyclonal) | Abcam | Cat# ab4448; RRID:AB_304461 | IF (1:500) |
| Antibody | Phospho Stat1 (Tyr701) antibody (rabbit monoclonal) | Cell Signaling Technology | Cat# 9167; RRID:AB_561284 | WB (1:1000) |
| Antibody | Phospho Stat2 (Tyr690)antibody (rabbit monoclonal) | Cell Signaling Technology | Cat# 88410; RRID:AB_2800123 | WB (1:1000) |
| Antibody | Stat1 antibody (rabbit monoclonal) | Cell Signaling Technology | Cat# 14994; RRID:AB_2737027 | WB (1:1000) |
| Antibody | Stat2 antibody (rabbit monoclonal) | Cell Signaling Technology | Cat# 72604; RRID:AB_2799824 | WB (1:1000) |
| Antibody | Goat anti-mouse IgG (H+L) HRP conjugated (goat polyclonal) | Bio-Rad | Cat# 170-6516; RRID:AB_11125547 | WB (1:10,000) |
| Antibody | Goat anti-mouse IgG (H+L) Alexa Fluor 647 conjugated (goat polyclonal) | Thermo Fisher Scientific | Cat# A21235; RRID:AB_2535804 | IF (1:1000) |
| Antibody | Horse anti-mouse IgG (H+L) HRP conjugated (horse polyclonal) | Cell Signaling Technology | Cat# 7076; RRID:AB_330924 | WB (1:3000) |
| Antibody | Goat anti-rabbit IgG (H+L) Alexa Fluor 568 conjugated (goat polyclonal) | Thermo Fisher Scientific | Cat# A11011; RRID:AB_143157 | IF (1:1000) |
| Antibody | Goat anti-rabbit IgG (H+L) Alexa Fluor 647 conjugated (goat polyclonal) | Thermo Fisher Scientific | Cat# A21247; RRID:AB_141778 | IF (1:1000) |
| Antibody | Goat anti-rabbit IgG (H+L) HRP conjugated (goat polyclonal) | Bio-Rad | Cat# 170-6515; RRID:AB_11125142 | WB (1:10,000) |
| Antibody | Goat anti-rabbit IgG (H+L) HRP conjugated (goat polyclonal) | Cell Signaling Technology | Cat# 7074; RRID:AB_2099233 | WB (1:3000) |
| Antibody | Goat anti-rat IgG (H+L) HRP conjugated (goat polyclonal) | Thermo Fisher Scientific | Cat# 31470; RRID:AB_228356 | WB (1:10,000) |
| Commercial assay or kit | RNeasy Plus Mini Kit | QIAGEN | Cat# 74134 | |
| Commercial assay or kit | DNeasy Blood & Tissue Kit | QIAGEN | Cat# 69504 | |
| Software, algorithm | tBlastn | PMID:2231712 | ||
| Software, algorithm | MAFFT | PMID:12136088 | ||
| Software, algorithm | Geneious | Dotmatics | ||
| Software, algorithm | PAML 4 | PMID:17483113 | ||
| Software, algorithm | FEL | PMID:15703242 | ||
| Software, algorithm | MEME | PMID:22807683 | ||
| Software, algorithm | Datamonkey | PMID:29301006 | ||
| Software, algorithm | CHOPCHOP | PMID:27185894 | ||
| Software, algorithm | Salmon | PMID:28263959 | ||
| Software, algorithm | DESeq2 | PMID:25516281 | ||
| Software, algorithm | Scripts for RNAseq analysis | This paper, Stevens, 2022 | Available at https://github.com/daugherty-lab/NINL | |
| Software, algorithm | Reactome | PMID:31691815 | ||
| Software, algorithm | Scripts for microscopy analysis | This paper, Stevens, 2022 | Available at https://github.com/daugherty-lab/NINL |
Additional files
-
Supplementary file 1
Evolutionary analyses on dynein, dynactin, and activating adaptor genes.
Statistics from PAML analyses on individual dynein, dynactin, and activating adaptor genes.
- https://cdn.elifesciences.org/articles/81606/elife-81606-supp1-v2.xlsx
-
Supplementary file 2
Codon positions in ninein-like (NINL) predicted to be evolving under positive selection.
NINL codon positions and probability scores from PAML, FEL, and MEME analyses.
- https://cdn.elifesciences.org/articles/81606/elife-81606-supp2-v2.xlsx
-
Supplementary file 3
Evolutionary analysis of N-terminal and C-terminal domains of ninein-like (NINL).
Statistics from PAML analyses on NINL full length, N-terminal domain only, and C-terminal domain only.
- https://cdn.elifesciences.org/articles/81606/elife-81606-supp3-v2.xlsx
-
Supplementary file 4
Differentially regulated transcripts in wild-type (WT) A549, ninein-like (NINL) knockout (KO), and NIN KO cell lines induced and uninduced with interferon (IFN).
Results from DESeq comparison from RNAseq of indicated cell lines and under different induction conditions.
- https://cdn.elifesciences.org/articles/81606/elife-81606-supp4-v2.xlsx
-
Supplementary file 5
List of primers and gBlocks used.
Spreadsheet that details the generation or sourcing of all plasmids used throughout this study.
- https://cdn.elifesciences.org/articles/81606/elife-81606-supp5-v2.xlsx
-
Supplementary file 6
List of antibodies used for immunoblots and immunofluorescence.
Spreadsheet that details each antibody name, manufacturer, catalog number, and dilutions used.
- https://cdn.elifesciences.org/articles/81606/elife-81606-supp6-v2.xlsx
-
MDAR checklist
- https://cdn.elifesciences.org/articles/81606/elife-81606-mdarchecklist1-v2.pdf
Download links
A two-part list of links to download the article, or parts of the article, in various formats.
Downloads (link to download the article as PDF)
Open citations (links to open the citations from this article in various online reference manager services)
Cite this article (links to download the citations from this article in formats compatible with various reference manager tools)
Antiviral function and viral antagonism of the rapidly evolving dynein activating adaptor NINL
eLife 11:e81606.
https://doi.org/10.7554/eLife.81606


