Inactivation of Invs/Nphp2 in renal epithelial cells drives infantile nephronophthisis like phenotypes in mouse
- Department of Genetics, Yale University School of Medicine, United States
- Department of Pediatrics, Yale University School of Medicine, United States
Figures
Figure 1
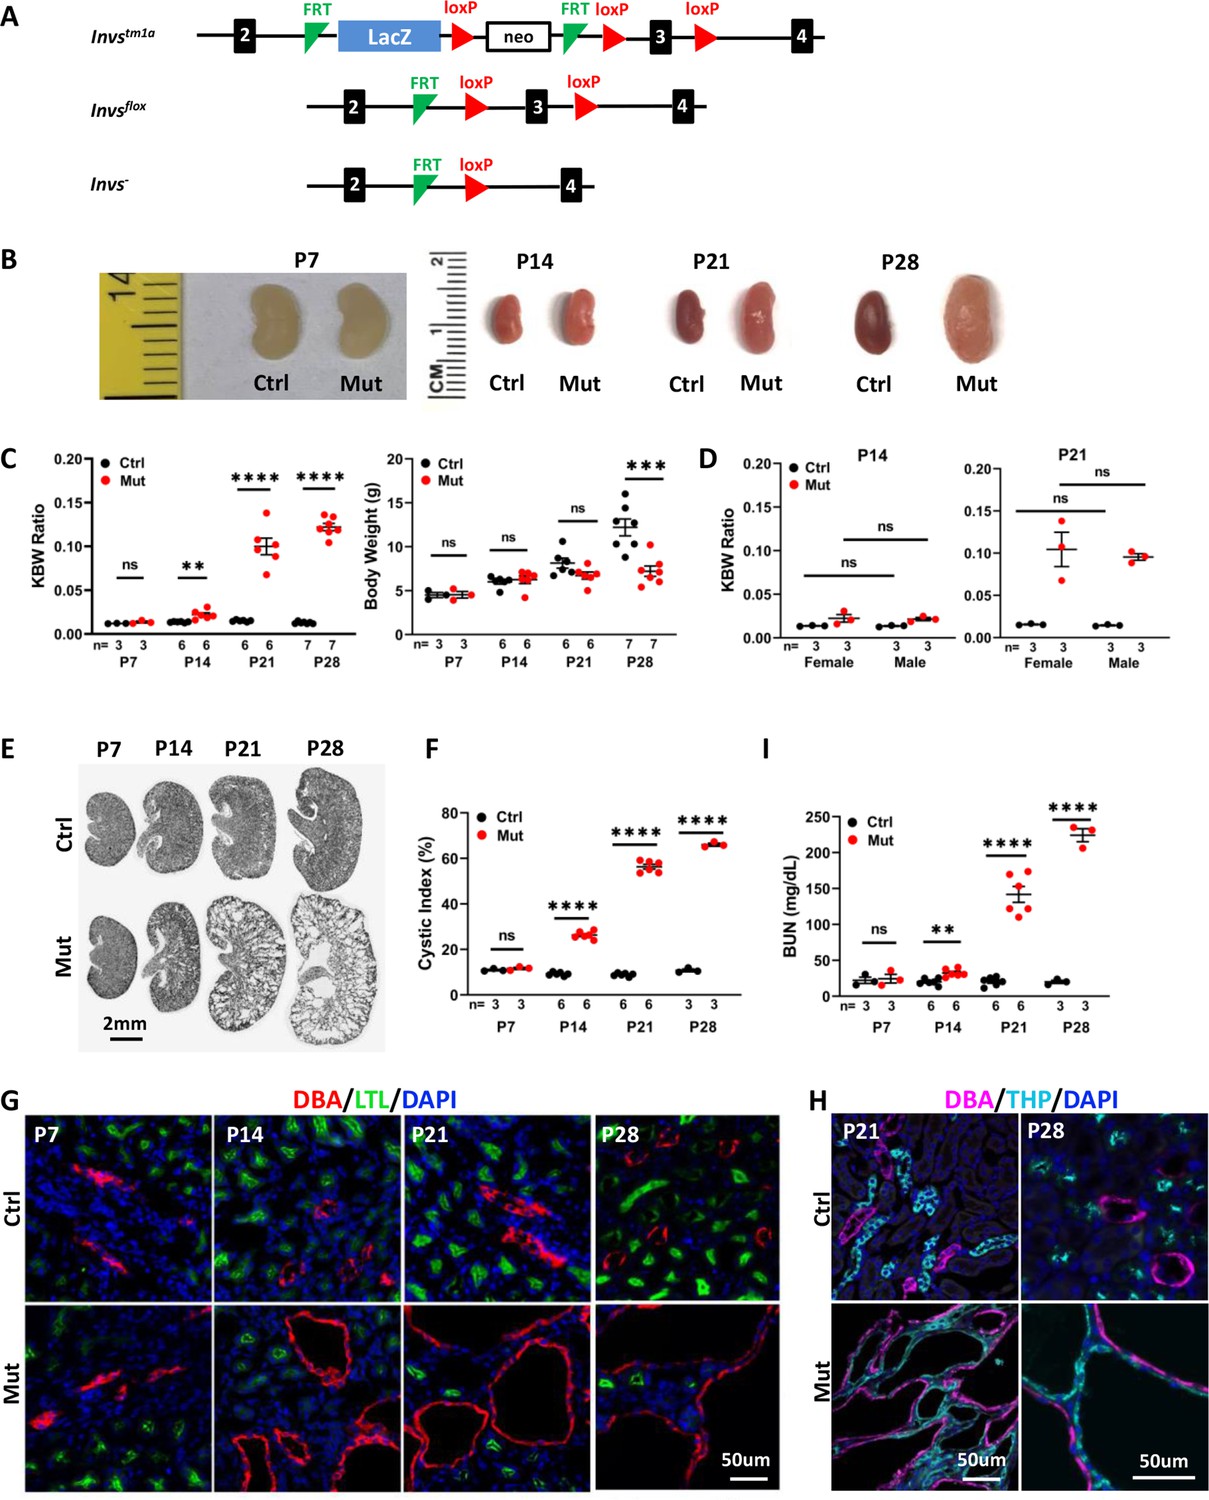
Invsflox/flox;Cdh16-Cre mice develop progressive cystic kidney disease at the neonatal stage.
(A) Generation of a floxed allele of Invs. FRT indicates FLPE recombinase sites, and loxP indicates Cre recombinase sites. (B) Gross morphology of the kidney. (C) KBW ratio and body weight in control and mutant mice. (D) KBW ratio in male and female mice. (E) HE-stained kidney sections. (F) Cystic index. (G, H) Origin of cysts. DBA marks the collecting duct in red in G and in purple in H. The proximal tubule is labeled with LTL in green and the medullary thick ascending limb is labeled by THP in cyan. Nuclei are labeled with DAPI in blue. (I) BUN level. Ctrl: littermate control; Mut: Invsflox/flox;Cdh16-Cre mutants. Unpaired t-test was performed between mutants and control animals. Data are presented as mean ± SEM: ns: not significant (p>0.05); **: p<0.01; ***: p<0.001; ****: p<0.0001.
-
Figure 1—source data 1
Related to Figure 1C, D, F and I.
- https://cdn.elifesciences.org/articles/82395/elife-82395-fig1-data1-v2.zip
Figure 2
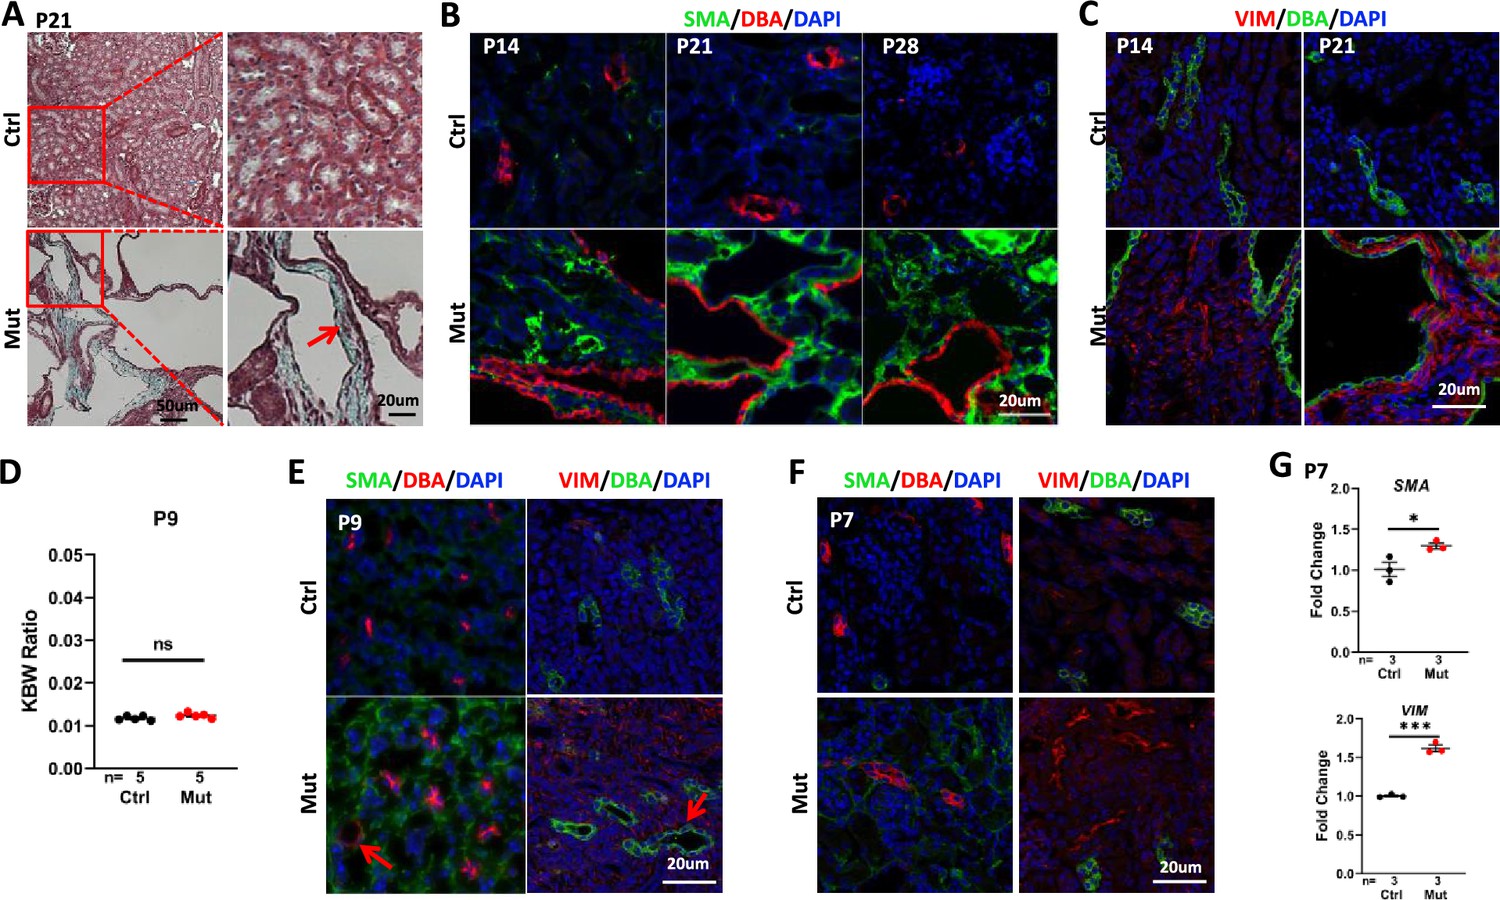
Invsflox/flox;Cdh16-Cre mice develop interstitial fibrosis in the kidney.
(A) Trichome staining of P21 kidney sections indicates blue collagen deposition (arrow) in the cortex region of a mutant kidney. (B) Increased signal of SMA (green) in the cortex region of mutant kidneys from P14 to P28. DBA in red marks the collecting duct. DAPI in blue labels the nucleus. (C) Increase of vimentin staining (VIM, red) in the cortex region of P14 and P21 mutant kidneys. DBA in green. DAPI in blue. (D) KBW ratio at P9. (E, F) Modest increase of SMA (in green, DBA in red in the left panels) and vimentin (VIM in red in the right panels, DBA in green) in the cortex region of the mutant kidney at P9 (E) and P7 (F). Arrows point to dilated tubules. DAPI in blue labels the nucleus. (G) The level of SMA (upper) and Vimentin (lower) mRNA is increased in the mutant kidney as assayed by RT-qPCR using P7 whole kidney lysates. Ctrl: littermate control; Mut: Invsflox/flox;Cdh16-Cre mutants. Unpaired t-test was performed between mutants and control animals. Data are presented as mean ± SEM. ns: not significant (p>0.05); *: p<0.05; ***: p<0.001.
-
Figure 2—source data 1
Related to Figure 2D and G.
- https://cdn.elifesciences.org/articles/82395/elife-82395-fig2-data1-v2.zip
Figure 3
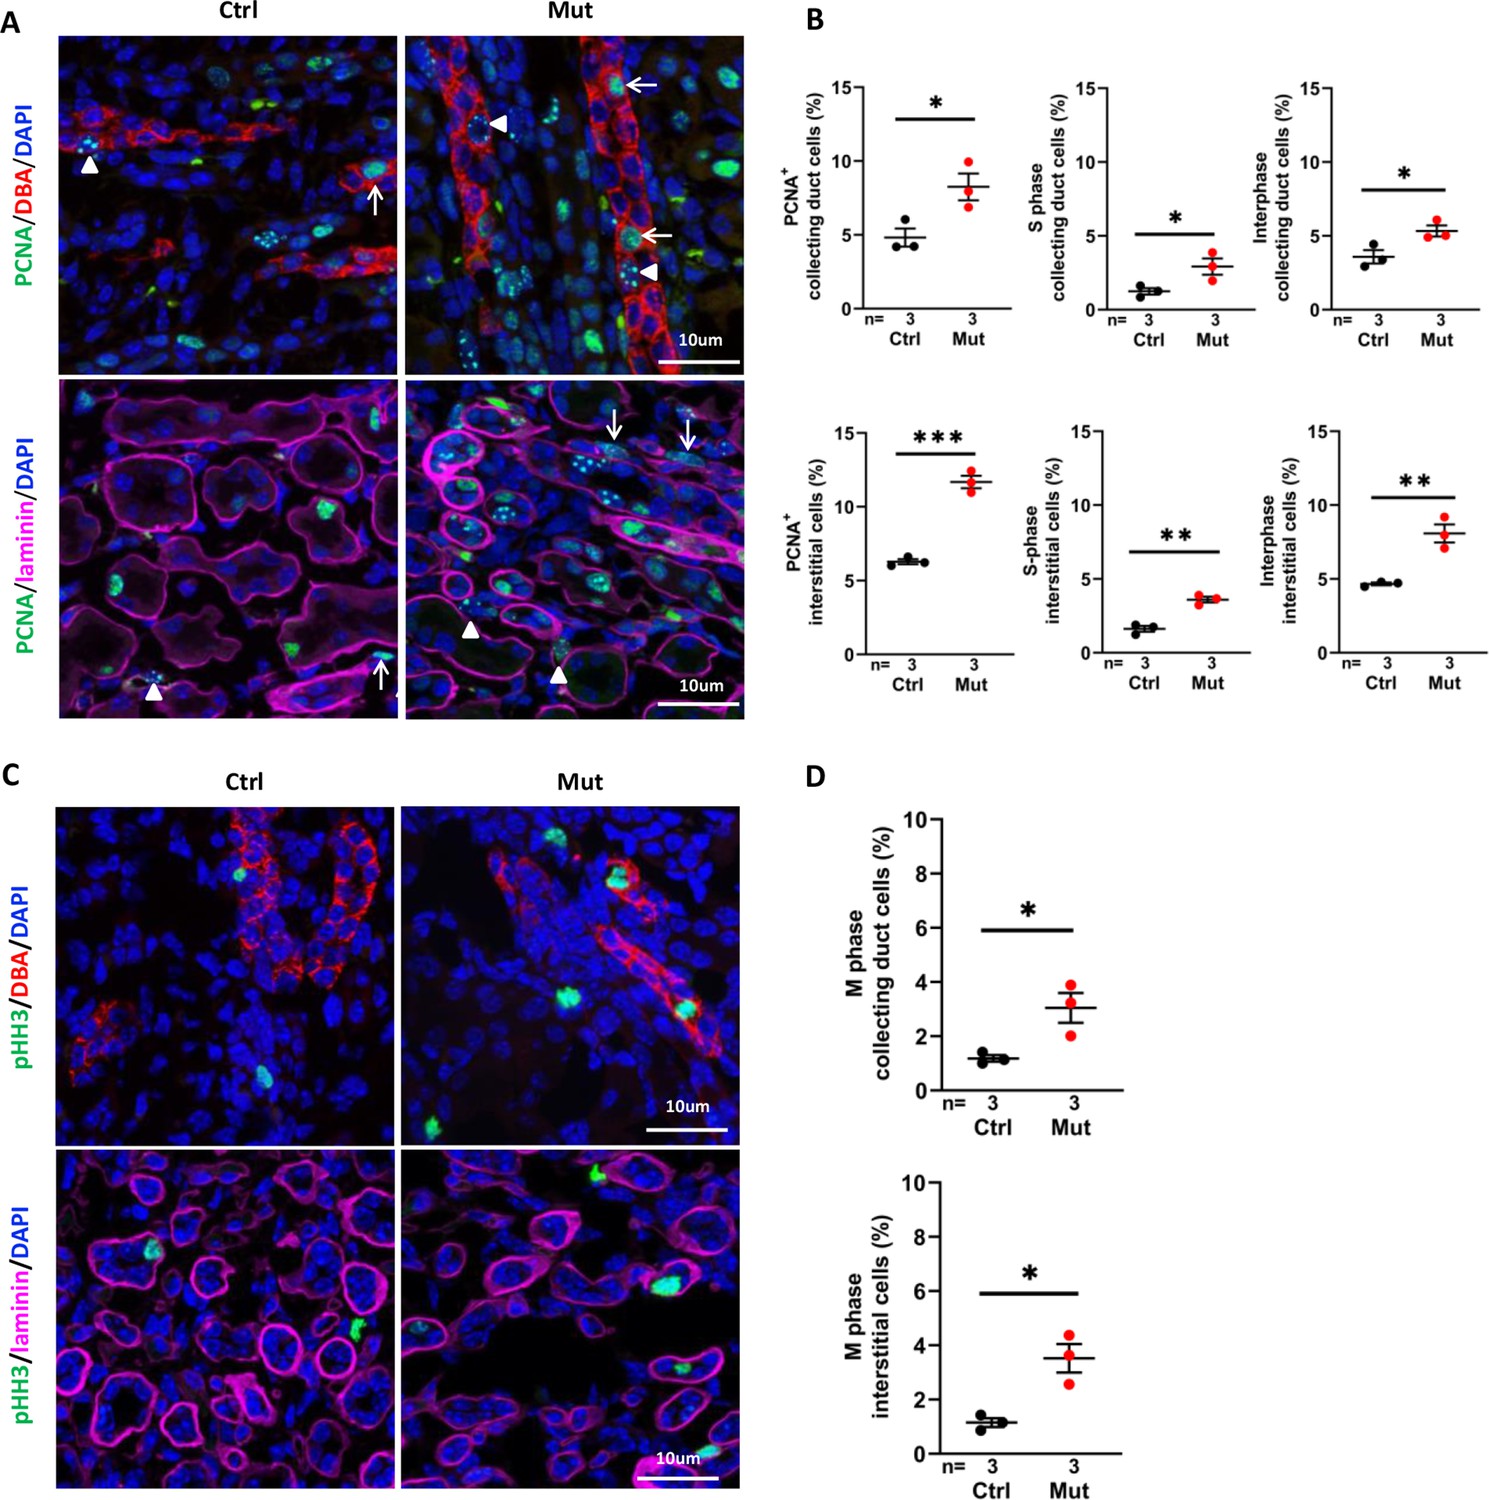
Invsflox/flox;Cdh16-Cre kidneys show increased cell proliferation at P7.
(A) Proliferating cells in the cortex region. PCNA (in green) stains replication foci in the nucleus of S-phase cells (examples pointed by arrowheads) but shows diffusive nuclear signal in interphase cells (arrows). In upper panels, collecting duct cells are labeled with DBA in red. In lower panels, epithelial regions are encircled by anti-laminin staining in purple. DAPI in blue labels the nucleus. (B) Percentage of total PCNA+ cells, PCNA+ S phase cells and PCNA+ interphase cells in collecting duct cells and interstitial cells in the cortex region. (C) Mitotic cells labelled by anti-pHH3 in the cortex region. In upper panels, collecting duct cells are labelled with DBA in red. In lower panels, epithelial regions are encircled by anti-laminin staining in purple. (D) Percentage of mitotic cells in collecting duct cells (upper panel) and interstitial cells (lower panel) in the cortex region. DAPI in blue labels the nucleus. Ctrl: littermate control; Mut: Invsflox/flox;Cdh16-Cre mutants. Unpaired t-test was performed between mutants and control animals. Data are presented as mean ± SEM. *: p<0.05; **: p<0.01; ***: p<0.001.
-
Figure 3—source data 1
Related to Figure 3B and D.
- https://cdn.elifesciences.org/articles/82395/elife-82395-fig3-data1-v2.zip
Figure 4 with 1 supplement
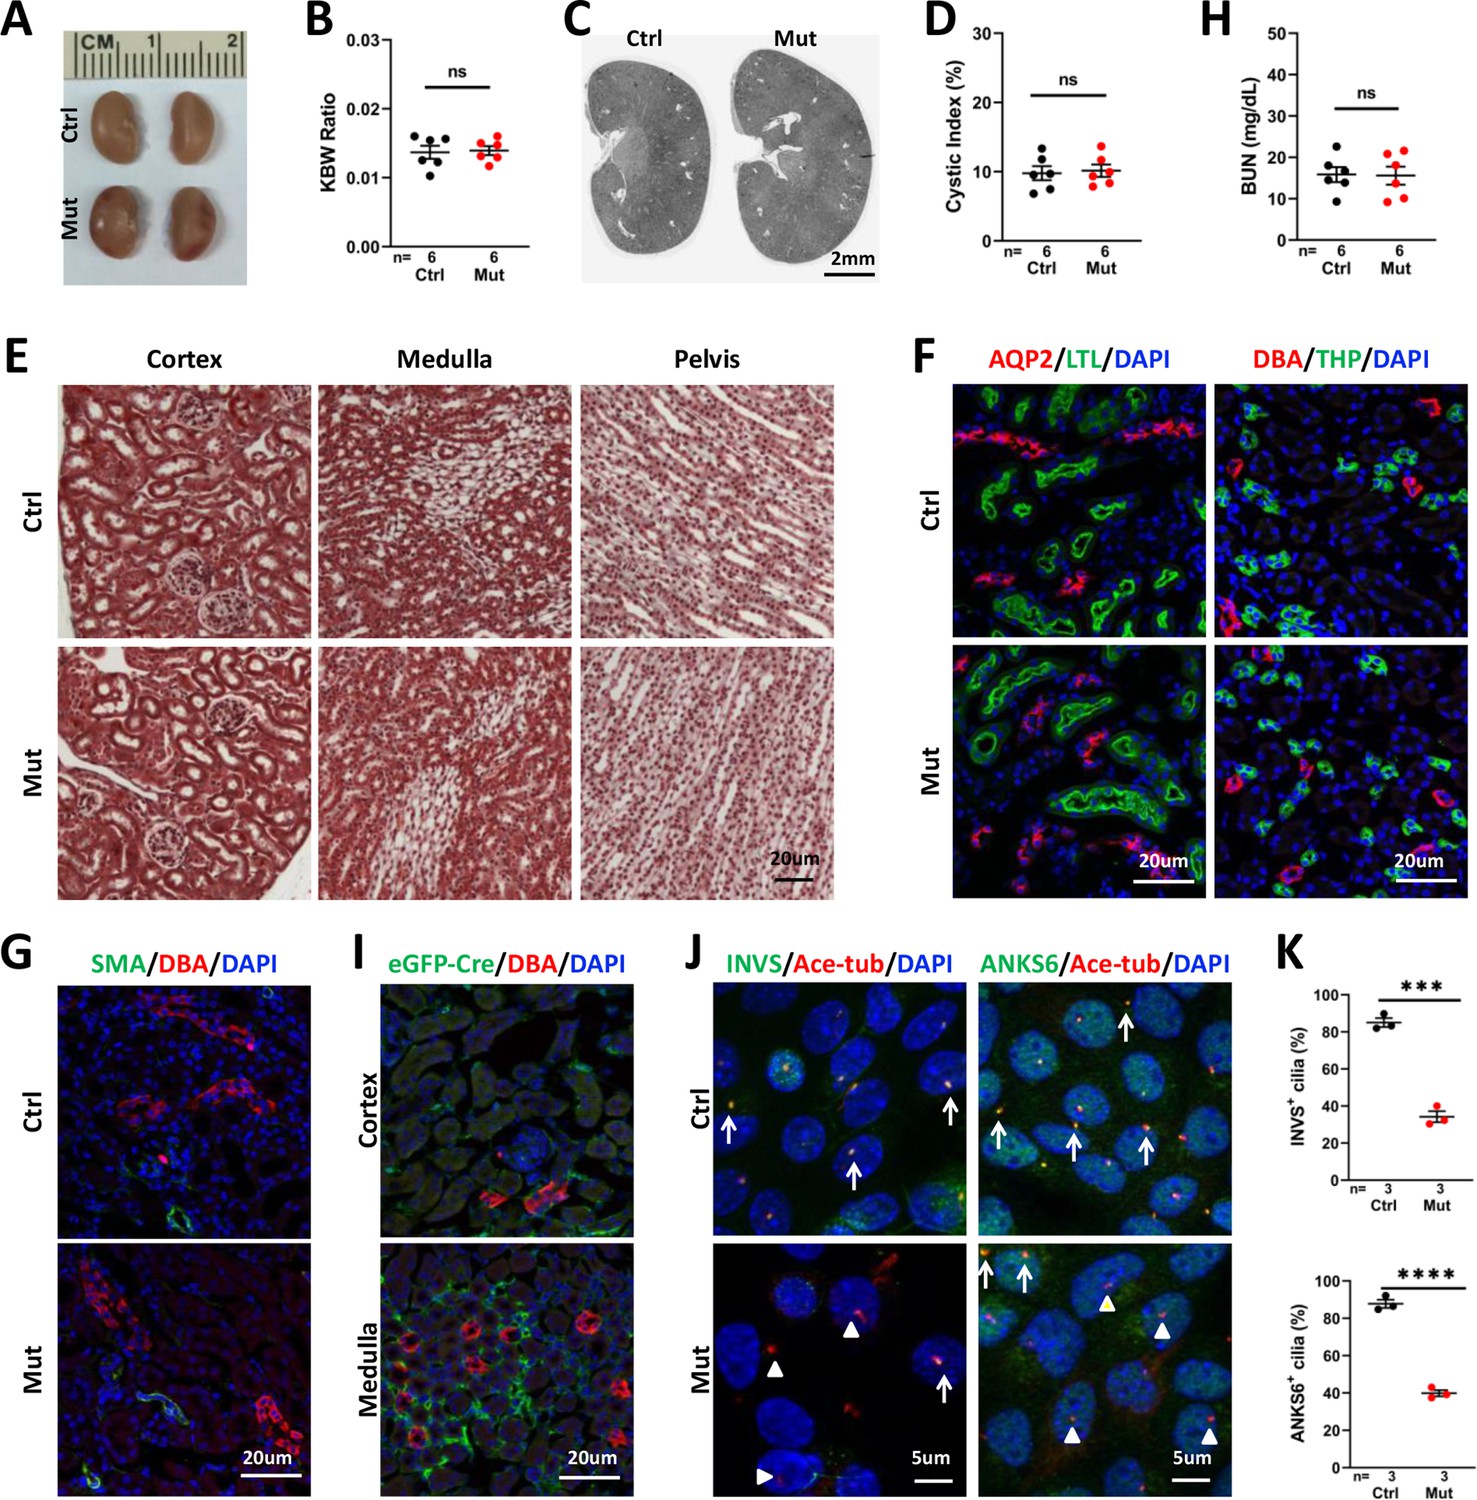
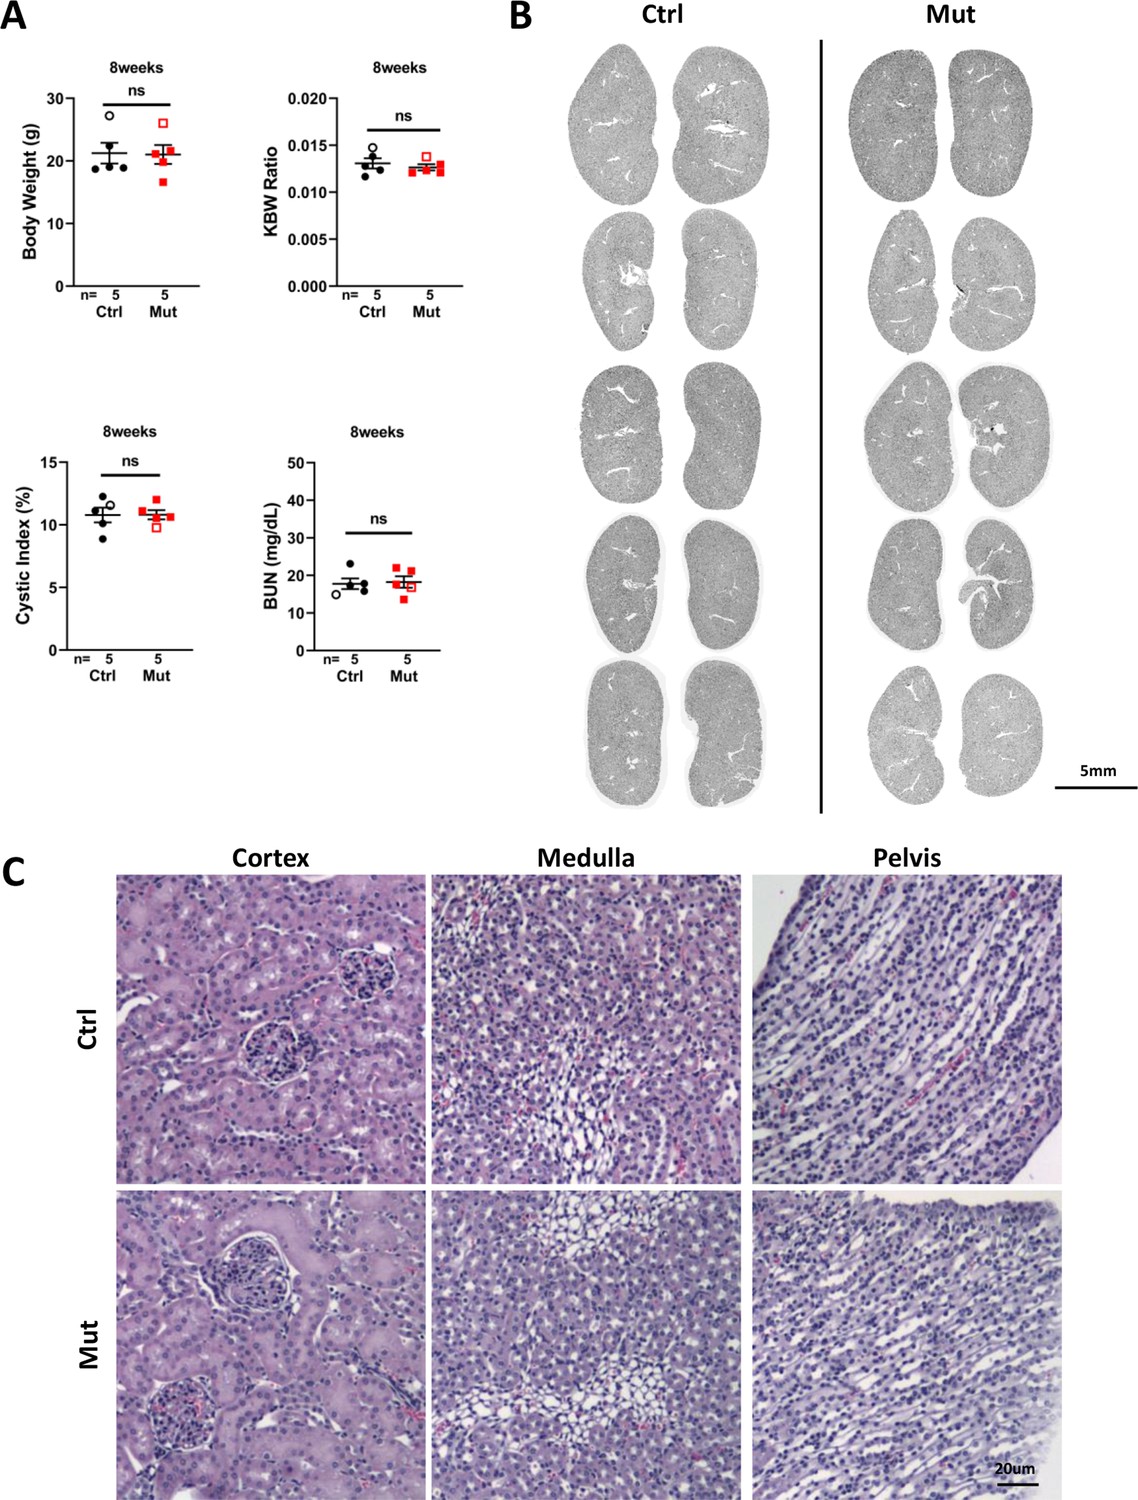
Invsflox/flox;Foxd1-Cre kidneys show no significant phenotype at P28.
(A) Gross morphology of the kidney. (B) KBW ratio. (C) HE-stained sections of the kidney. (D) Cystic index. (E) Trichrome staining of kidney sections. (F) Normal morphology of the collecting tubule and duct labelled by AQP2 (in red, left panels), collecting duct labelled by DBA (in red in right panels), proximal tubule (LTL in green in left panels) and thick ascending limb (THP in green in right panels). DAPI in blue labels the nucleus. (G) No increase of SMA signal (in green) can be detected in the mutant kidney. DBA in red labels the collecting duct. DAPI in blue labels the nucleus. (H) BUN level. (I) Immunostaining of eGFP-Cre (green). DBA in red. DAPI in blue. (J) Immunostaining of INVS (in green, left panels) and ANKS6 (in green, right panels) in primary culture of interstitial cells from control and mutant kidneys. Anti-acetylated tubulin (Ace-tub, red) labels cilia. DAPI in blue. Arrows indicate INVS or ANKS6 positive cilia. Arrowheads point to INVS- or ANKS6- cilia. (K) Quantification of INVS and ANKS6 positive cilia. Ctrl: littermate control; Mut: Invsflox/flox;Foxd1-Cre mutants. Unpaired t-test was performed between mutants and control animals. Data are presented as mean ± SEM. ns: not significant (p>0.05); ***: p<0.001; ****: p<0.0001.
-
Figure 4—source data 1
Related to Figure 4B, D, H and K.
- https://cdn.elifesciences.org/articles/82395/elife-82395-fig4-data1-v2.zip
Figure 4—figure supplement 1
Invsflox/flox;Foxd1-Cre kidneys show no significant phenotype at P56.
(A) Body weight, KBW ratio, cystic index and BUN. Open labels indicate males and filled labels indicate females. (B) Section images of all kidneys analyzed in A. (C) Hematoxylin/eosin-stained sections of the kidney. Ctrl: littermate control; Mut: Invsflox/flox;Foxd1-Cre mutants. Unpaired t-test was performed between mutants and control animals. Data are presented as mean ± SEM. ns: not significant (p>0.05).
-
Figure 4—figure supplement 1—source data 1
Related to Figure 4—figure supplement 1A.
- https://cdn.elifesciences.org/articles/82395/elife-82395-fig4-figsupp1-data1-v2.zip
Figure 5
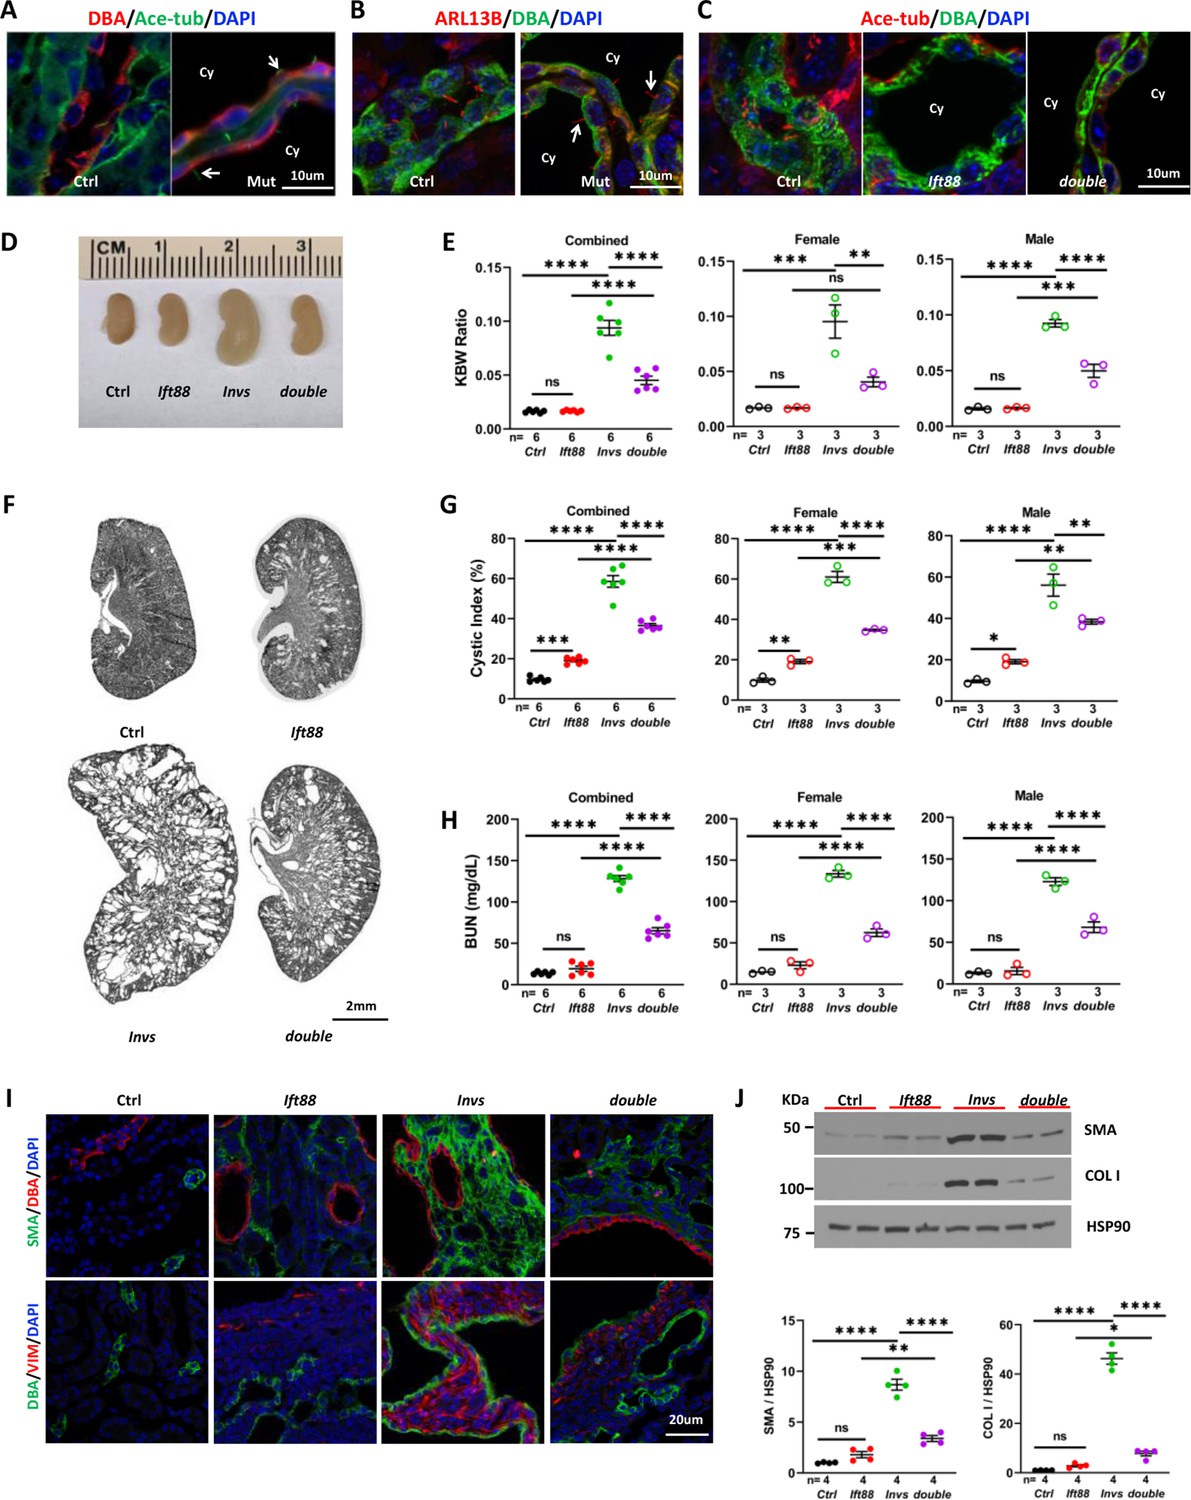
Genetic abrogation of cilia partially suppresses the phenotypes of Invsflox/flox;Cdh16-Cre mice at P21.
(A) Invs is dispensable for cilia biogenesis. Cilia (arrow) are labelled by anti-Ace-tub (green). The collecting duct is labeled by DBA (red). DAPI (blue) labels the nucleus. (B) Invs is dispensable for ciliary localization of ARL13b (red, arrow). DBA in green. DAPI in blue. (C) Cilia (labelled by anti-Ace-tub, red) biogenesis is disrupted in both Ift88flox/flox;Cdh16-Cre knockout and Invsflox/flox;Ift88flox/flox;Cdh16-Cre knockout kidney. DBA in green. (D) Gross kidney morphology. (E) KWB ratio. (F) HE-stained kidney sections. (G) Cystic index. (H) BUN level. (I) Immunostaining of the renal cortex region. DBA in red and SMA in green in upper panels. DBA in green and vimentin (VIM) in red in lower panels. DAPI in blue. (J) Representative western blot and quantification. COL I: Collagen I. Ctrl: age matched controls from pooled litters; Invs: Invsflox/flox;Cdh16-Cre mutant; Ift88: Ift88flox/flox;Cdh16-Cre mutant; double: Ift88flox/flox;Invsflox/flox;Cdh16-Cre double mutant; Ace-tub: acetylated tubulin; Cy: cyst. One-way ANOVA analysis followed by Šidák’s test was performed between selected pairs. Data are presented as mean ± SEM. ns: not significant (p>0.05); *: p<0.05; **: p<0.01; ***: p<0.001; ****: p<0.0001.
-
Figure 5—source data 1
Related to Figure 5E, G, H and J.
Littermates are highlighted by the same color in data tables.
- https://cdn.elifesciences.org/articles/82395/elife-82395-fig5-data1-v2.zip
Figure 6 with 1 supplement
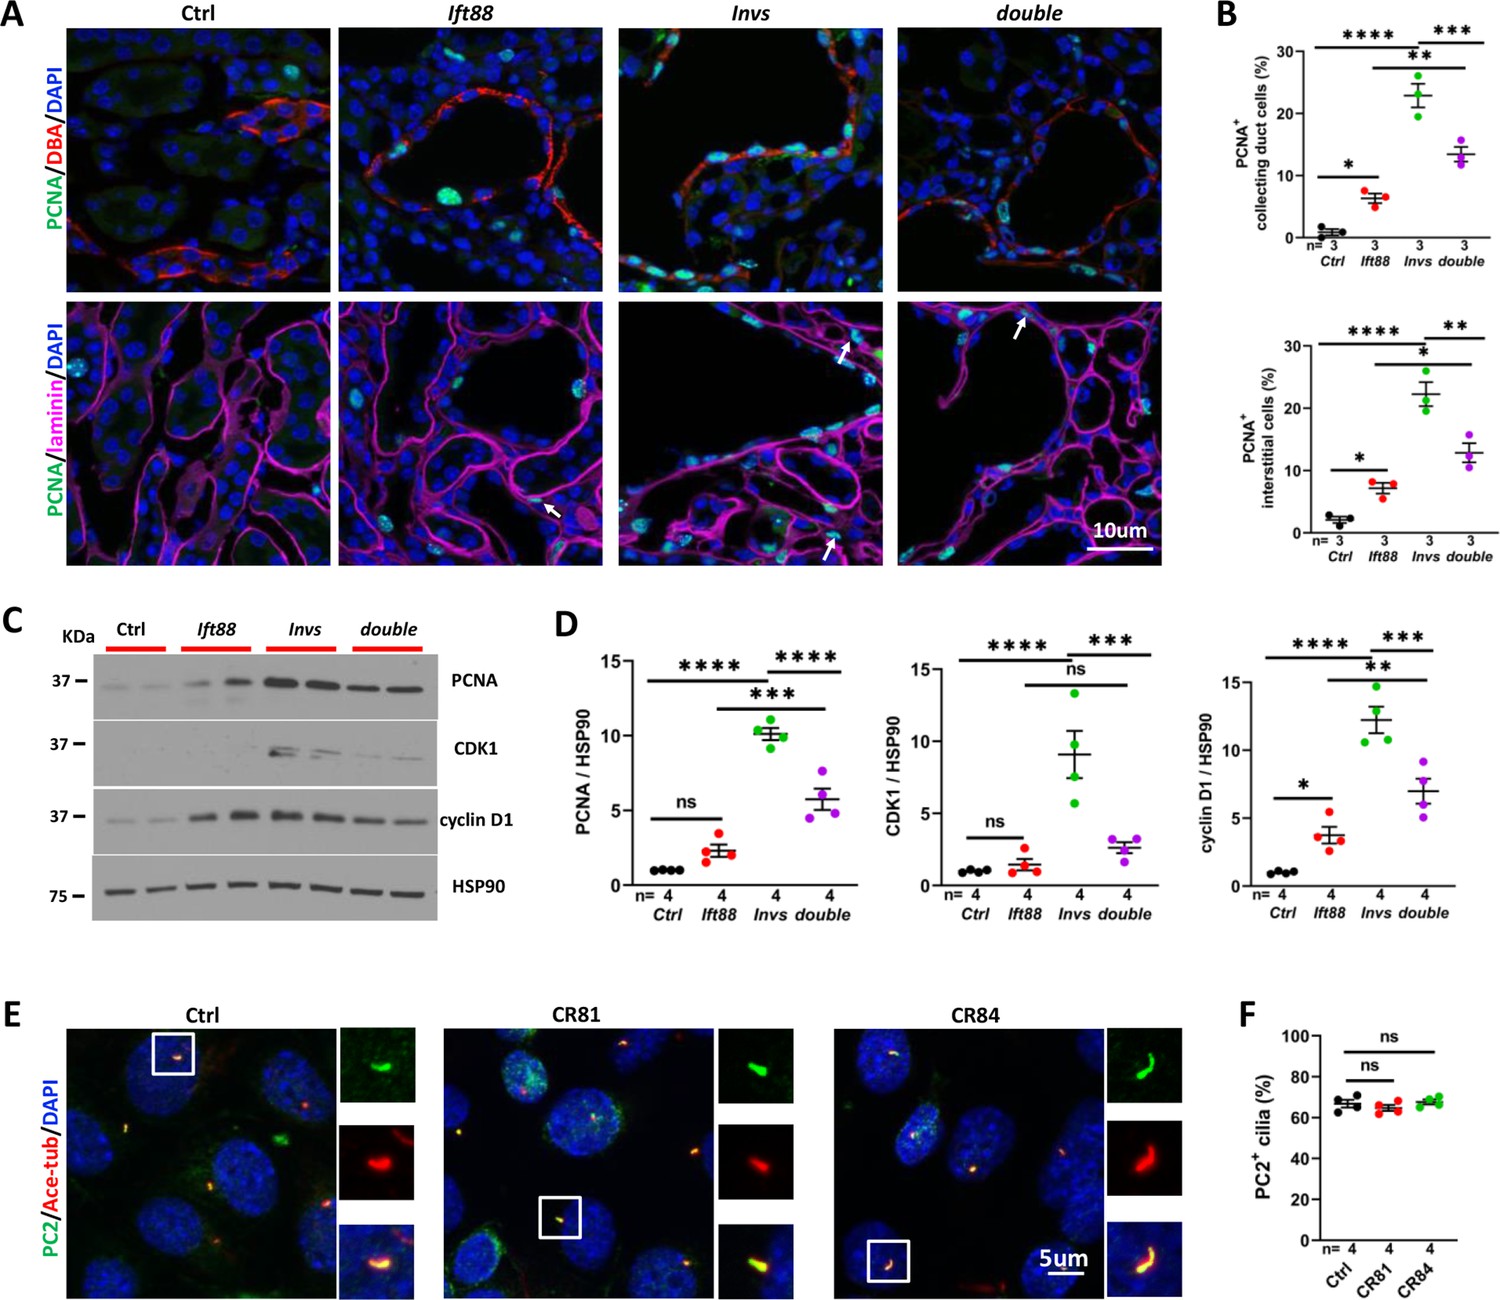
Genetic abrogation of cilia partially reduced cell proliferation in Invsflox/flox;Cdh16-Cre kidney at P21.
(A) PCNA (in green) staining of the cortex region. The collecting duct is labeled by DBA in red in upper panels. Epithelial regions are encircled by laminin signal in purple in lower panels. DAPI in blue labels the nucleus. Arrows point to representative PCNA+ interstitial cells. (B) Quantification of PCNA+ collecting duct cells (DBA) and interstitial cells outside of regions demarcated by laminin signal. (C) Representative Western Blot of PCNA, CDK1, cyclin D1 and the loading control HSP90 using kidney lysates. (D) Quantification of signals on Western Blots. Unit 1 is defined by the level in control kidneys. (E) Immunostaining of PC2 (in green) in control mIMCD3 cells (Ctrl) and mutant cells (Mut) from Invs-/- clones CR81 and CR84. Cilia are labeled by anti-acetylated tubulin (Ace-tub) in red. DAPI in blue labels the nucleus. (F) Quantification of PC2 positive cilia. Invs: Invsflox/flox;Cdh16-Cre mutant; Ift88: Ift88flox/flox;Cdh16-Cre mutant; double: Ift88flox/flox;Invsflox/flox;Cdh16-Cre double mutant. One-way ANOVA analysis followed by Šidák’s test was performed between selected pairs. Data are presented as mean ± SEM. ns: not significant (p>0.05); *: p<0.05; **: p<0.01; ***: p<0.001; ****: p<0.0001.
-
Figure 6—source data 1
Related to Figure 6B–D and F.
- https://cdn.elifesciences.org/articles/82395/elife-82395-fig6-data1-v2.zip
Figure 6—figure supplement 1
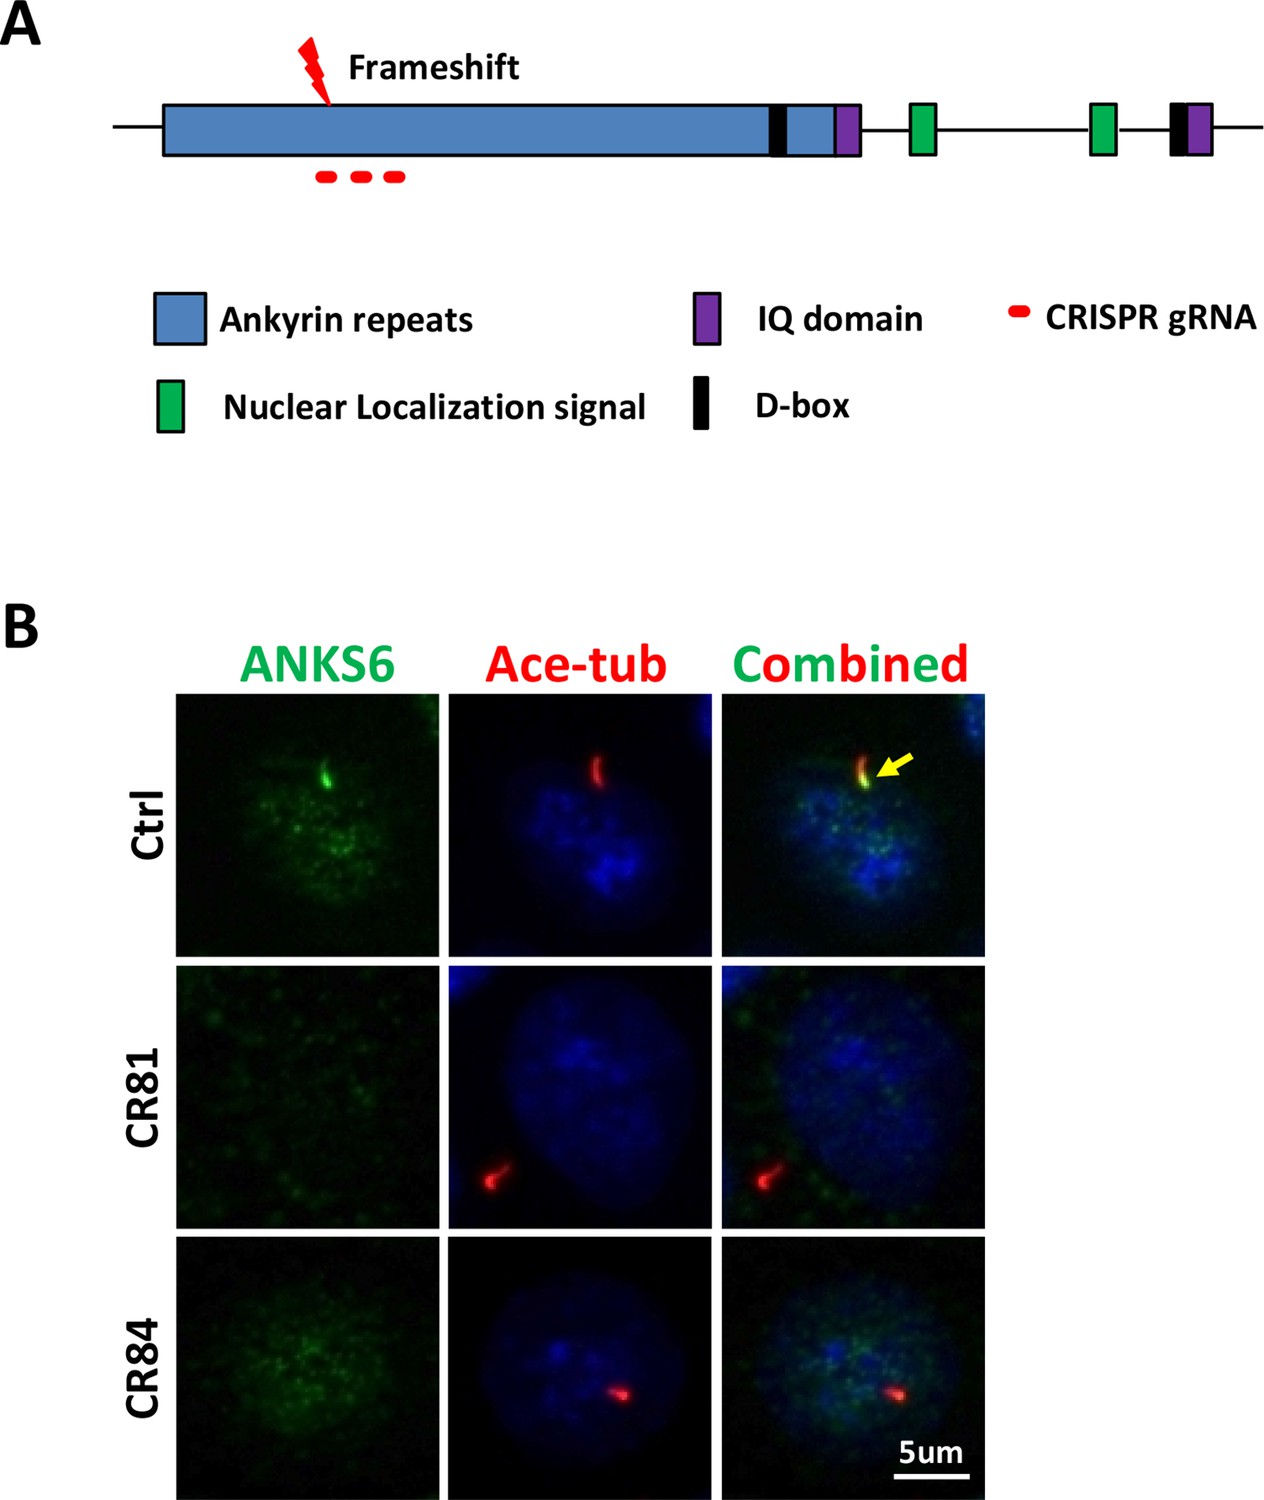
The generation of Invs-/- cells.
(A) A diagram of INVS structure and CRISPR targets. (B) ANKS6 (green) is absent from the INVS compartment (arrow) of cilia. Cilia are labelled by anti-acetylated tubulin (Ace-tub, red) in mutant clones CR81 and CR84.
Figure 7 with 1 supplement
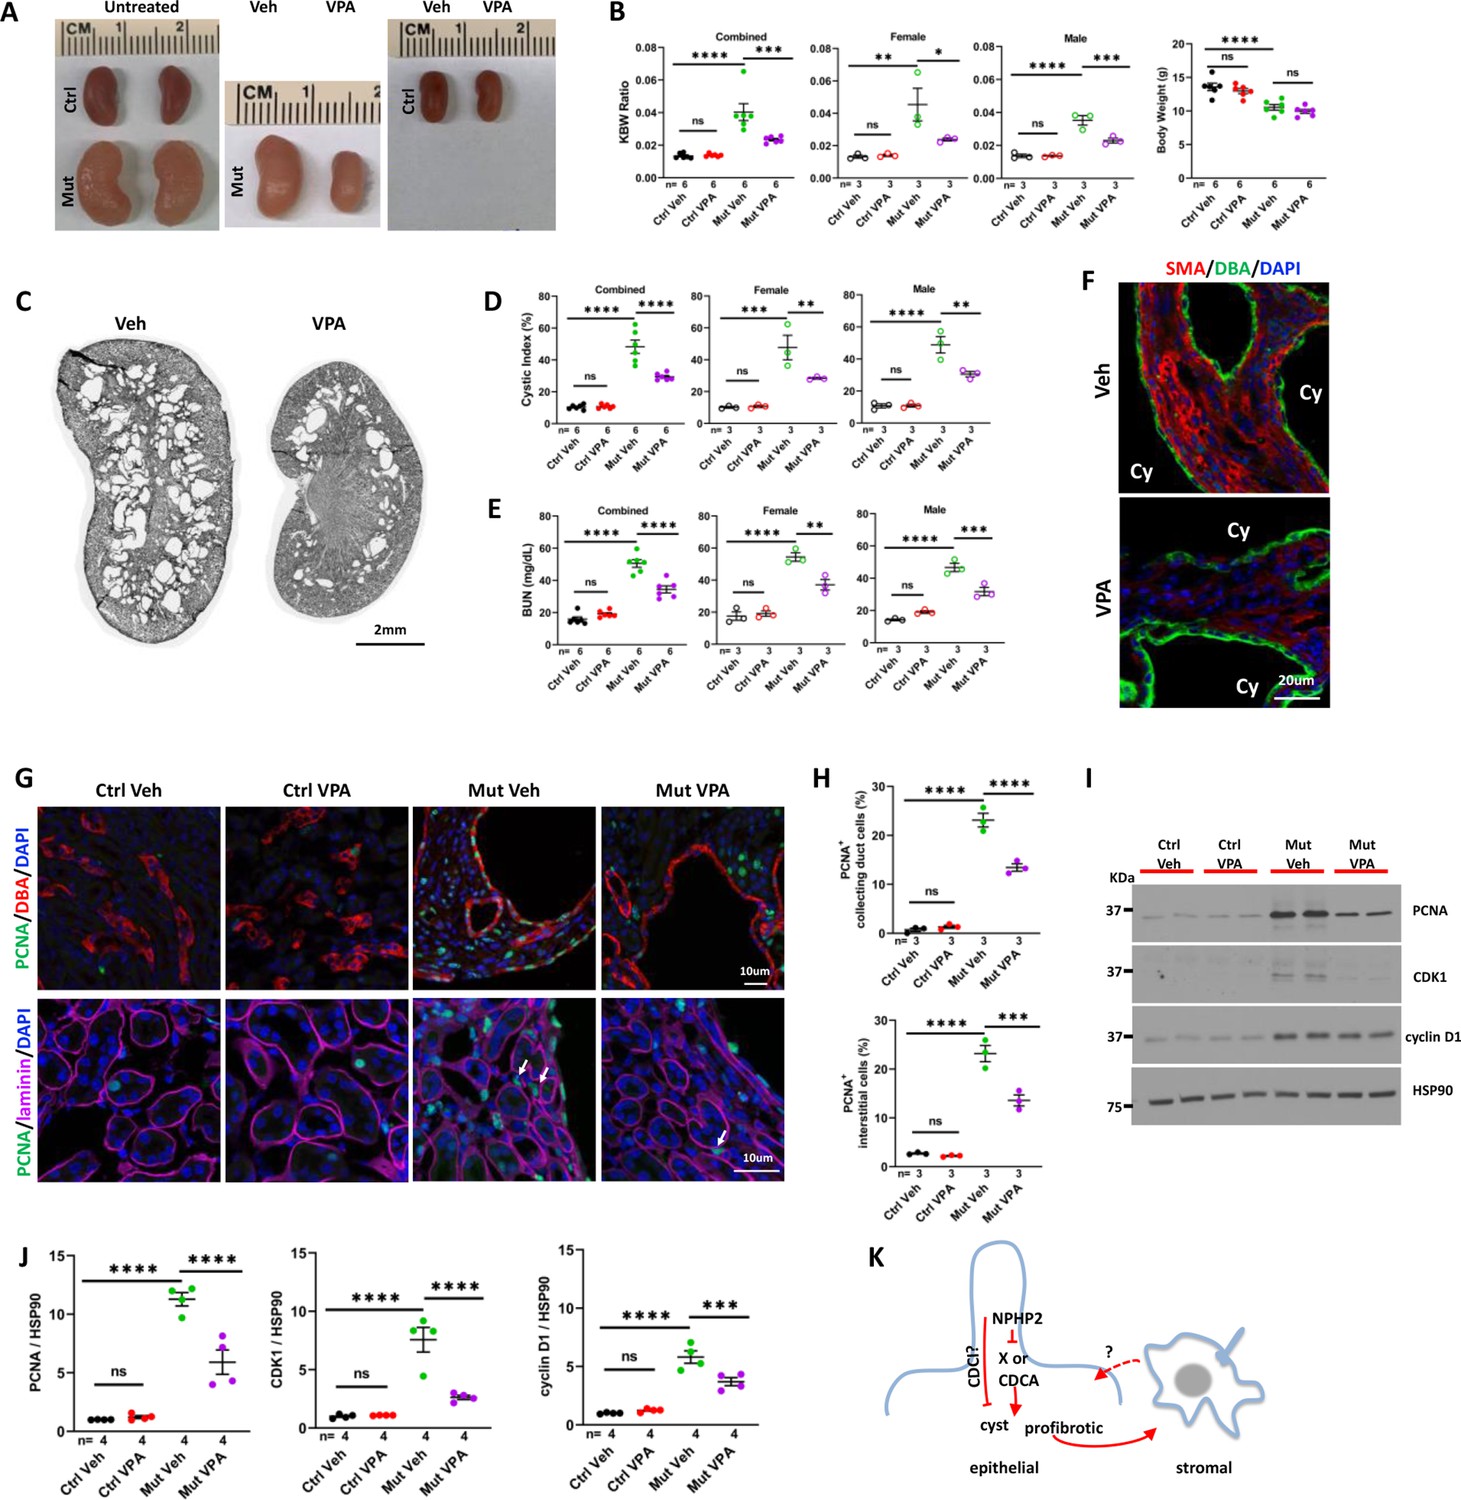
VPA partially suppresses the phenotypes of Invsflox/flox;Pkhd1-Cre mice at P28.
(A) Gross morphology of the kidney. (B) KBW ratio and body weight. (C) HE-stained kidney section. (D) Cystic index. (E) BUN level. (F) SMA (red) in the cortex region of the kidney. DBA in green marks the collecting duct. DAPI in blue labels the nucleus. (G) Proliferating cells labelled by anti-PCNA staining (in green) in the cortex region. In upper panels, DBA in red. In lower panels, anti-laminin staining in purple. Arrows point to representative PCNA+ interstitial cells. DAPI in blue. (H) Percentage of PCNA+ collecting duct cells (upper panel) and interstitial cells (lower panel) in the cortex region. (I) Representative western blot of PCNA, CDK1, cyclin D1 and the loading control HSP90. (J) Quantification of signals on western blots. (K) A model of INVS function. INVS in epithelial cilia inhibits a pro-cystic and profibrotic pathway, which activates interstitial cells non-cell autonomously. CDCI: cilia-dependent cyst inhibiting. Cy: cyst; Ctrl: age matched control animals from pooled litters; Mut: Invsflox/flox;Pkhd1-Cre mutant; Veh: vehicle treated. One-way ANOVA analysis followed by Šidák’s test was performed between selected pairs. Data are presented as mean ± SEM. ns: not significant (p>0.05); *: p<0.05; **: p<0.01; ***: p<0.001; ****: p<0.0001.
-
Figure 7—source data 1
Related to Figure 7B, D, E and H–J.
Littermates are highlighted by the same color in data tables.
- https://cdn.elifesciences.org/articles/82395/elife-82395-fig7-data1-v2.zip
Figure 7—figure supplement 1
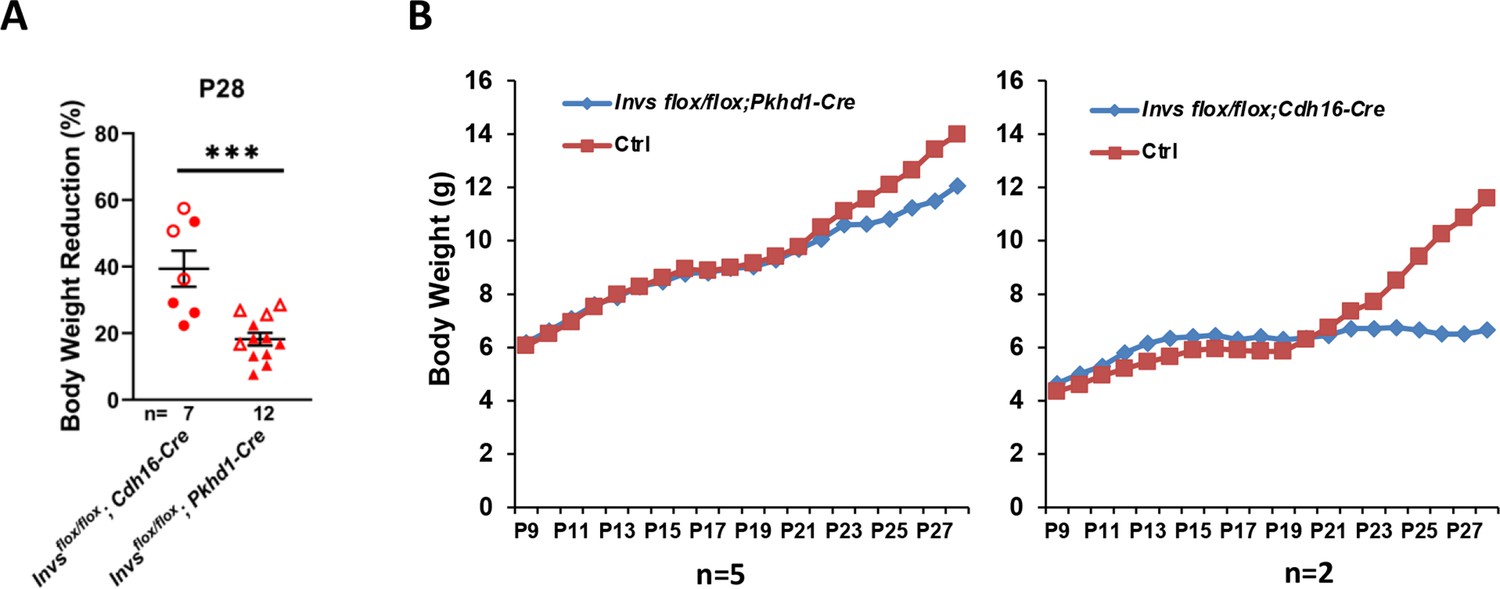
Body weight change of Invs models.
(A) Decrease of body weight of Invsflox/flox;Cdh16-Cre and Invsflox/flox;Pkhd1-Cre at P28 compared to littermate controls. Percentage of body weight reduction is defined as the difference between littermate control and mutant body weight divided by littermate control body weight. Open labels indicate males and filled labels indicate females. (B) Average body weight curve of Invsflox/flox;Cdh16-Cre and Invsflox/flox;Pkhd1-Cre female mice. Ctrl: littermate control. Unpaired t-test was performed between mutants and control animals. Data are presented as mean ± SEM. ***: p<0.001.
-
Figure 7—figure supplement 1—source data 1
Related to Figure 7—figure supplement 1A and B.
- https://cdn.elifesciences.org/articles/82395/elife-82395-fig7-figsupp1-data1-v2.zip
Tables
Key resources table
| Reagent type (species) or resource | Designation | Source or reference | Identifiers | Additional information |
|---|---|---|---|---|
| Gene (Mus musculus) | Invs | NCBI | Gene ID: 16348 | MGI 1335082 |
| Strain, strain background (M. musculus) | C57BL/6 J | Jackson Laboratory | Cat#: 000664 | |
| Genetic reagent (M. musculus) | Invstm1a/+ | EUCOMM | Embryonic stem cell clone Invstm1a | Yale Genome Editing Center generate Invstm1a/+ mice |
| Genetic reagent (M. musculus) | Invsflox/+ | This paper | Dr. Brueckner (Yale University) | |
| Genetic reagent (M. musculus) | Cdh16-Cre | PMID:12089378, 12089379 and 23892607 | From Stefan Somlo lab | |
| Genetic reagent (M. musculus) | Pkhd1-Cre | PMID:23892607 | From Stefan Somlo lab | |
| Genetic reagent (M. musculus) | Foxd1-Cre | Jackson Laboratory | Cat#: 012463 | |
| Genetic reagent (M. musculus) | Ift88flox/+ | PMID:17166921, 33046531 | From Stefan Somlo lab | |
| Cell line (M. musculus) | mIMCD3 | ATCC | Cat#: CRL-2123 | |
| Cell line (M. musculus) | Invs-/- CR81, CR84 | This paper | Dr. Brueckner (Yale University) | |
| Antibody | Anti-THP (Sheep polyclonal) | R&D Systems | Cat#: AF5175 | IF (1:500) |
| Antibody | Anti-AQP2 (Rabbit polyclonal) | Cell Signaling Technology | Cat#: 3487 S | IF (1:300) |
| Antibody | Anti-ARL13B (Rabbit polyclonal) | Proteintech | Cat#: 17711–1-AP | IF (1:100) |
| Antibody | Anti-acetylated tubulin (Mouse monoclonal) | Sigma-Aldrich | Cat#: MABT868; clone 6–11B-1 | IF (1:5000) |
| Antibody | Anti-α–SMA (Mouse monoclonal) | Abcam | Cat#: ab7817 | IF (1:100) |
| Antibody | Anti- vimentin (Rabbit polyclonal) | Proteintech | Cat#:10366–1-AP | IF (1:100) |
| Antibody | Anti-GFP (Mouse monoclonal) | Roche | Cat#: 11814460001 | IF (1:300) |
| Antibody | Anti-laminin (Rabbit polyclonal) | Invitrogen | Cat#: PA1-16730 | IF (1:1000) |
| Antibody | Anti-PCNA (Mouse monoclonal) | BD Biosciences Pharmingen | Cat#: 51–900205 | IF (1:100) |
| Antibody | Anti-pHH3 (mouse monoclonal) | Upstate | Cat#: 05806 | IF (1:500) |
| Antibody | Anti-INVS (Rabbit polyclonal) | Proteintech | Cat#:10585–1-AP | IF (1:100) |
| Antibody | Anti-ANKS6 (Rabbit polyclonal) | Sigma-Prestige Antibodies | Cat#: HPA008355 | IF (1:100) |
| Antibody | Anti-PC2 (Rabbit polyclonal) | PMID:10497221 | YCC2 | From Stefan Somlo Lab; IF (1:2000) |
| Antibody | Anti-CDK1 (Rabbit monoclonal) | Cell Signaling Technology | Cat#: 28439 | WB (1:1000) |
| Antibody | Anti-PCNA (Rabbit monoclonal) | Cell Signaling Technology | Cat#:13110 | WB (1:1000) |
| Antibody | Anti-cyclin D1 (Rabbit monoclonal) | Abcam | Cat#: ab134175 | WB (1:2000) |
| Antibody | Anti-HSP90 (Rabbit monoclonal) | Cell Signaling Technology | Cat#: 4877 | WB (1:3000) |
| Antibody | Anti-α-smooth muscle actin (Rabbit polyclonal) | Abcam | Cat#: ab5694 | WB (1:2000) |
| Antibody | Anti-collagen I (Rabbit polyclonal) | Proteintech | Cat#: 14695–1-AP | WB (1:2000) |
| Recombinant DNA reagent | Invs CRISPR/Cas9 KO (plasmid)(m) | Santa Cruz | Cat#: SC-421144 | |
| Commercial assay or kit | ProLong Gold antifade reagent with DAPI | Molecular Probes | Cat#: P36935 | |
| Commercial assay or kit | MycoAlert Mycoplasma Detction Kit | Lonza | Cat#: LT-07–118 | |
| Commercial assay or kit | Trizole reagent | Ambion | Cat#:15596018 | |
| Commercial assay or kit | SuperScript IV First-Strand Synthesis System | Invitrogen | Cat#:18091050 | |
| Commercial assay or kit | KAPA SYBR FAST Universal | KAPA Biosystems | Cat#: 07959389001 | |
| Commercial assay or kit | Protein Assay Dye Reagent Concentrate | Bio-Rad | Cat#: 500–0006 | |
| Commercial assay or kit | SuperSignal West Pico PLUS Chemiluminescent Substrate | Thermo Scientific | Cat#: 34580 | |
| Chemical compound, drug | Complete EDTA-free Protease inhibitor | Roche | Cat#: 11836170001 | |
| Chemical compound, drug | PhosSTOP phosphatase inhibitor | Roche | Cat#: 04906837001 | |
| Chemical compound, drug | 2-Propylpentanoic acid, sodium salt (VPA) | Acros Organics | Cat#: 1069-66-5 | |
| Software, algorithm | GraphPad Prism | GraphPad Prism | ||
| Software, algorithm | ImageJ | ImageJ | ||
| Other | Rhodamine DBA | Vector Laboratories | Cat#: RL-1032 | IF (1:100) |
| Other | Fluorescein DBA | Vector Laboratories | Cat#: FL-1031 | IF (1:100) |
| Other | Fluorescein LTL | Vector Laboratories | Cat#: FL1321 | IF (1:300) |
Author response table 1
| Group A | Group B | Group C | Group D | |
|---|---|---|---|---|
| Ctrl | Ift88 | Invs | double | |
| 1 | 0.015800000 | 0.015878788 | 0.102857143 | 0.049194030 |
| 2 | 0.017560000 | 0.016804124 | 0.099063291 | 0.056283951 |
| 3 | 0.016694444 | 0.017709302 | 0.088949153 | 0.035397260 |
| 4 | 0.015176471 | 0.015256757 | 0.066209677 | 0.038000000 |
| 5 | 0.014500000 | 0.016518519 | 0.116844444 | 0.055061224 |
| 6 | 0.017973333 | 0.017322034 | 0.089321429 | 0.036822785 |
Author response table 2
| Group A | Group B | Group C | Group D | |
|---|---|---|---|---|
| Ctrl Veh | Ctrl VPA | Mut Veh | Mut VPA | |
| 1 | 0.012396552 | 0.014127820 | 0.037855556 | 0.020752688 |
| 2 | 0.015106870 | 0.013128000 | 0.065266055 | 0.022039604 |
| 3 | 0.012455882 | 0.013617391 | 0.038261307 | 0.024288889 |
| 4 | 0.012109489 | 0.015356589 | 0.033000000 | 0.025181818 |
| 5 | 0.015722628 | 0.013800000 | 0.037882353 | 0.025700000 |
| 6 | 0.012873418 | 0.012978723 | 0.029415929 | 0.022441176 |
Additional files
-
MDAR checklist
- https://cdn.elifesciences.org/articles/82395/elife-82395-mdarchecklist1-v2.docx
-
Supplementary file 1
Sequences of oligos used in this study.
- https://cdn.elifesciences.org/articles/82395/elife-82395-supp1-v2.docx
Download links
A two-part list of links to download the article, or parts of the article, in various formats.
Downloads (link to download the article as PDF)
Open citations (links to open the citations from this article in various online reference manager services)
Cite this article (links to download the citations from this article in formats compatible with various reference manager tools)
Inactivation of Invs/Nphp2 in renal epithelial cells drives infantile nephronophthisis like phenotypes in mouse
eLife 12:e82395.
https://doi.org/10.7554/eLife.82395


