Collateral deletion of the mitochondrial AAA+ ATPase ATAD1 sensitizes cancer cells to proteasome dysfunction
- Department of Biochemistry, University of Utah, United States
- Department of Chemistry & Biochemistry, University of Toledo, United States
- Whitehead Institute for Biomedical Research, United States
- Dana-Farber Cancer Institute, Harvard Medical School, United States
- University of Utah and ARUP Laboratories, United States
- Huntsman Cancer Institute, University of Utah, United States
- Department of Biology, Massachusetts Institute of Technology, United States
- Howard Hughes Medical Institute, United States
Figures
Figure 1 with 4 supplements
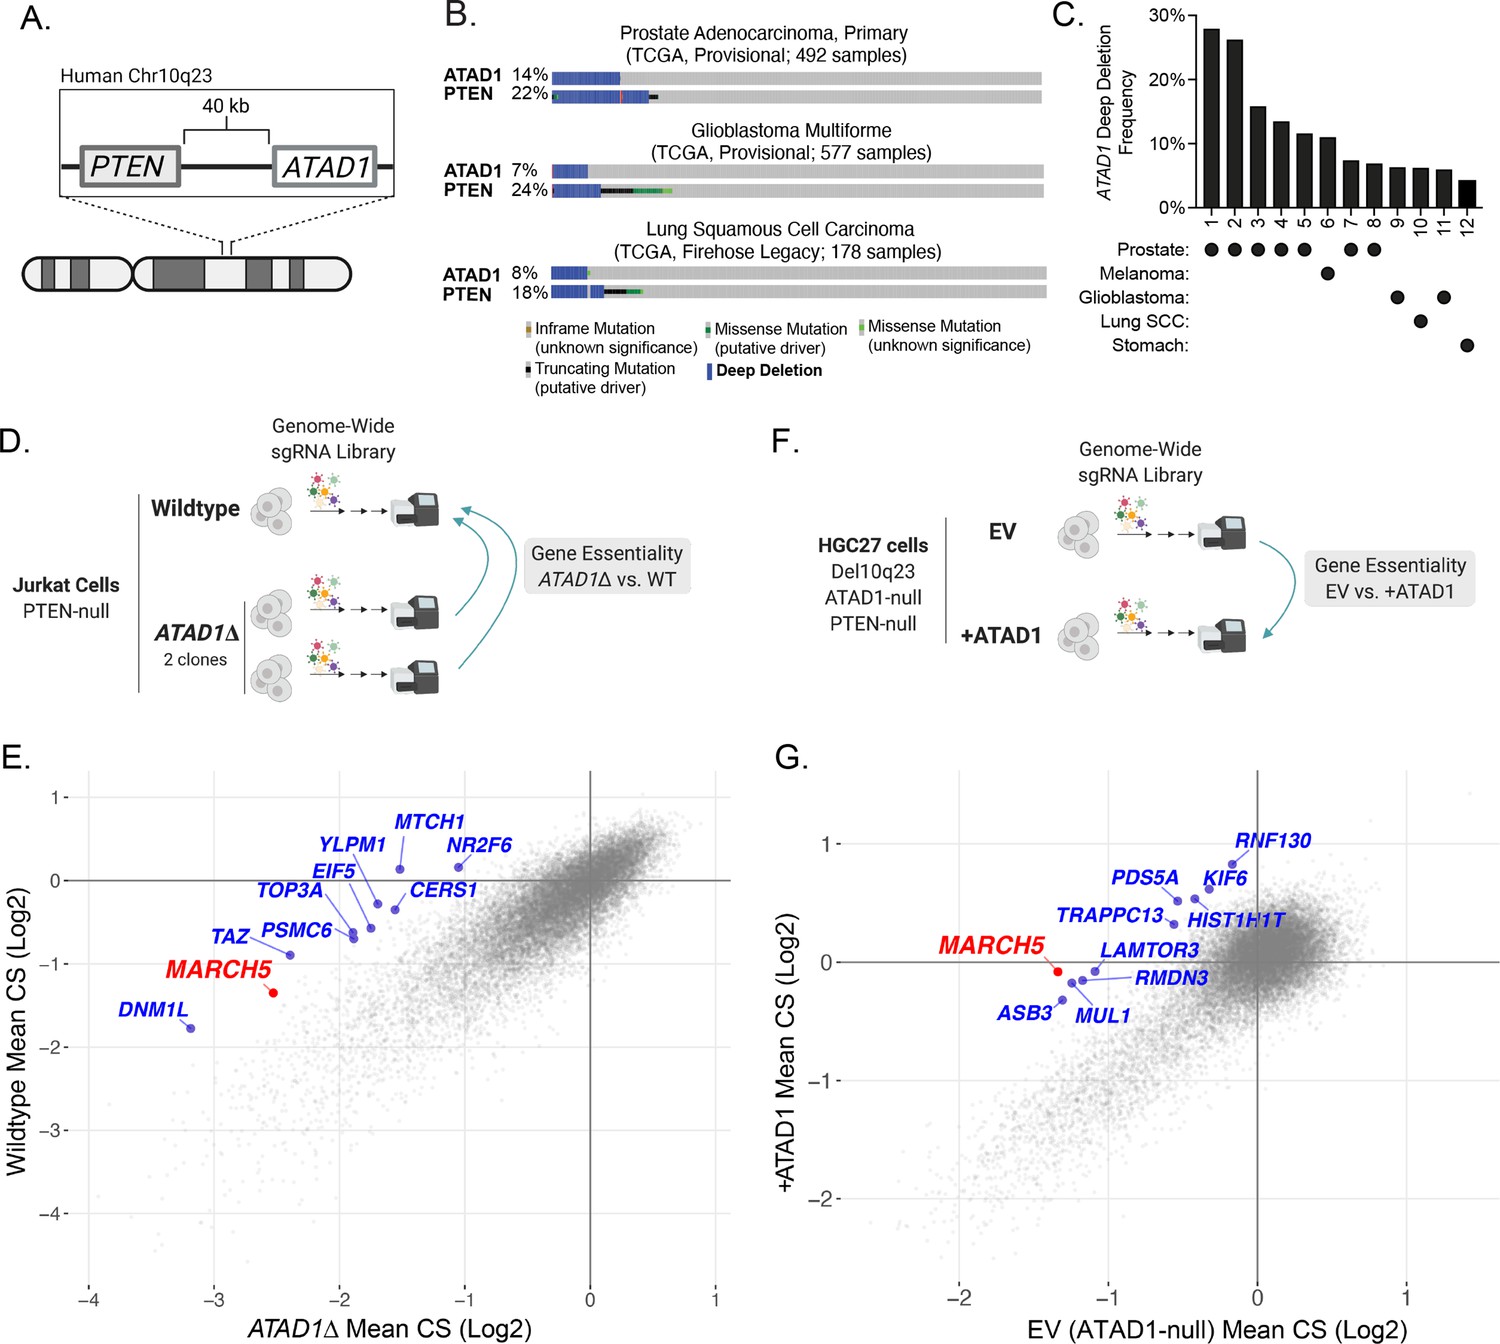
ATAD1 is co-deleted with PTEN in cancer and its loss confers synthetic lethal vulnerabilities.
(A) Schematic of PTEN and ATAD1 loci. (B) Oncoprint plots from three TCGA studies of cancer. ATAD1 and PTEN alteration frequencies are shown, with blue bars indicating deep deletions. (C) Frequency of ATAD1 deep deletions across various cancer types; data from cBioPortal. (D) CRISPR screen design for wild-type (WT) and ATAD1∆ Jurkat cells. (E) Jurkat CRISPR screen results; each point represents one gene. CRISPR score (CS) values were calculated by taking the average log2 fold-change in relative abundance of all sgRNAs targeting a given gene over 14 population doublings. WT CS values are shown on the y-axis. The CS values per gene for each of the two ATAD1∆ clones were averaged and are plotted on the x-axis. The top 10 genes that were differentially essential between WT and ATAD1∆ are labeled in blue, with MARCH5 labeled in red. (F) CRISPR screen design for HGC27 cells (Chr10q23 deletion, ATAD1-null) comparing gene essentiality in ATAD1 complemented cells or empty vector (EV) (ATAD1-null) control. (G) HGC27 CRISPR screen results; CS values are as described for (E). The x-axis depicts CS for the ATAD1-null condition of EV-transduced cells, and the y-axis depicts CS for the ATAD1-complemented (+ATAD1) condition. Labels are as described for (E).
-
Figure 1—source data 1
Source data used to make Figure 1.
- https://cdn.elifesciences.org/articles/82860/elife-82860-fig1-data1-v2.zip
Figure 1—figure supplement 1
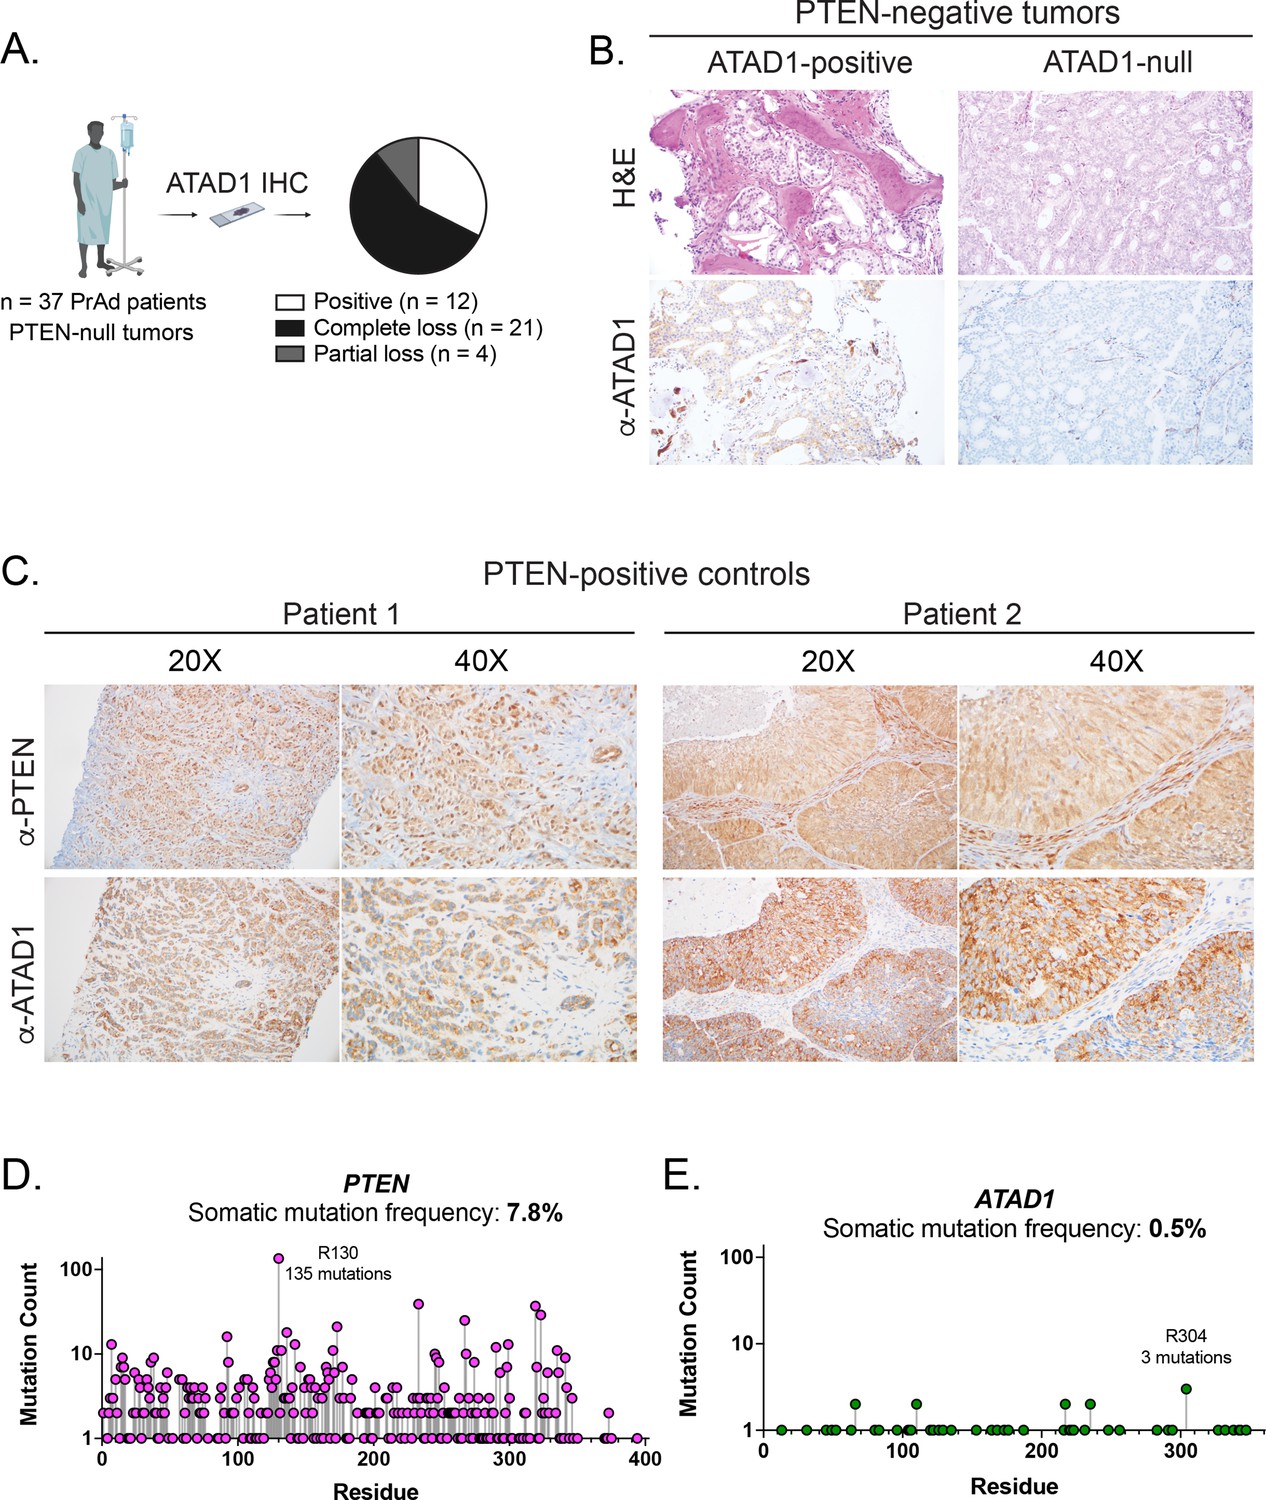
ATAD1 is co-deleted with PTEN as a passenger.
(A) Summary of IHC study on PTEN-null prostate adenocarcinoma (PrAd). (B) Representative histology of tumor samples from patients with PTEN-null tumors. (C) Representative histology of PTEN-positive tumors. (D) Somatic mutations in the PTEN (D) or ATAD1 (E) loci, from TCGA Pan-Cancer Atlas studies (32 studies; n=10,528 samples); note logarithmic scale on y-axis.
-
Figure 1—figure supplement 1—source data 1
Source data used to make Figure 1—figure supplement 1.
- https://cdn.elifesciences.org/articles/82860/elife-82860-fig1-figsupp1-data1-v2.zip
Figure 1—figure supplement 2
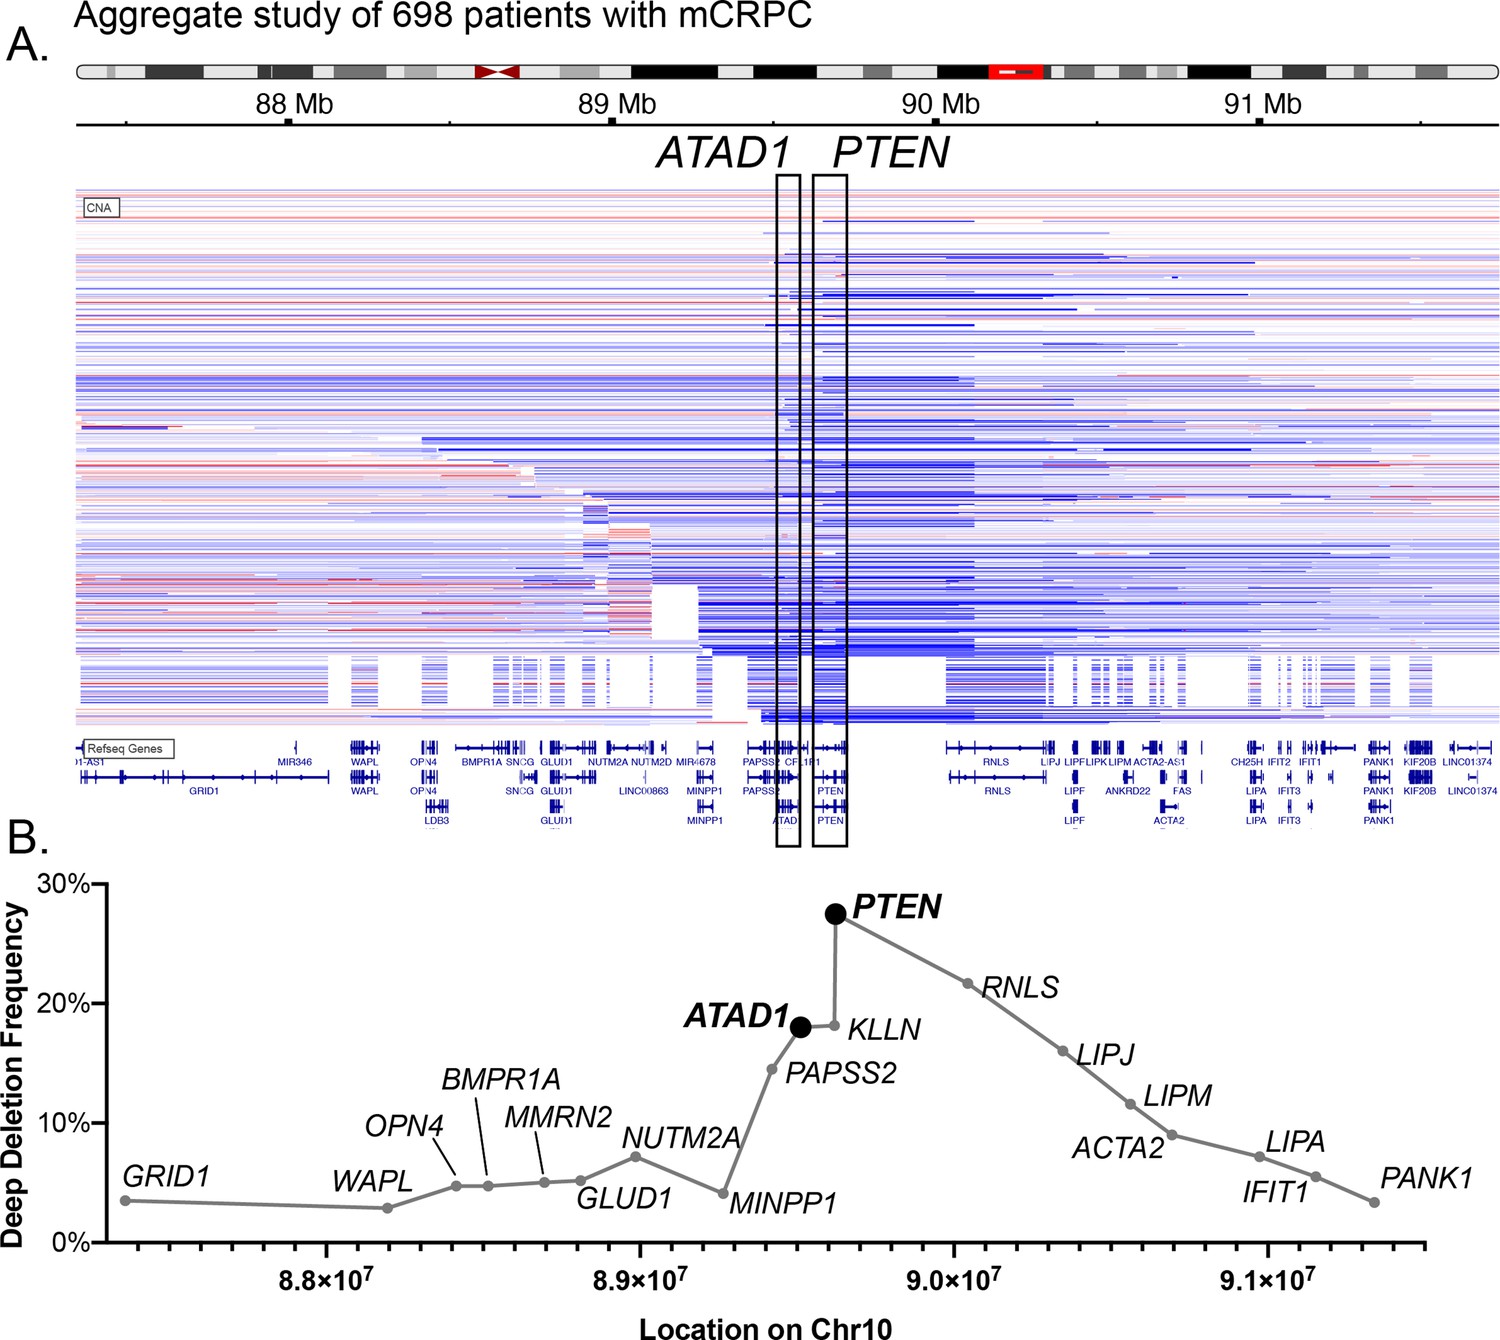
Characterization of co-deleted genes on Chr10q23.
(A) Schematic of human chr10, with the 10q23 region highlighted with a red box, and CNV of 698 tumors from patients with metastatic castrate-resistant prostate cancer. Blue horizontal bars indicate deletion of the corresponding region of the chromosome, with darker blue indicating deeper deletion (i.e. lower copy number). Red indicates amplification. (B) Plot of deep deletion frequency vs. chromosomal location. Each point corresponds to the genomic coordinates of the start codon for the corresponding gene, as annotated in cBioPortal, and the frequency of deep deletions in the cohort shown in (A). The x-axis is to scale, but only approximately to scale in relation to (A).
Figure 1—figure supplement 3
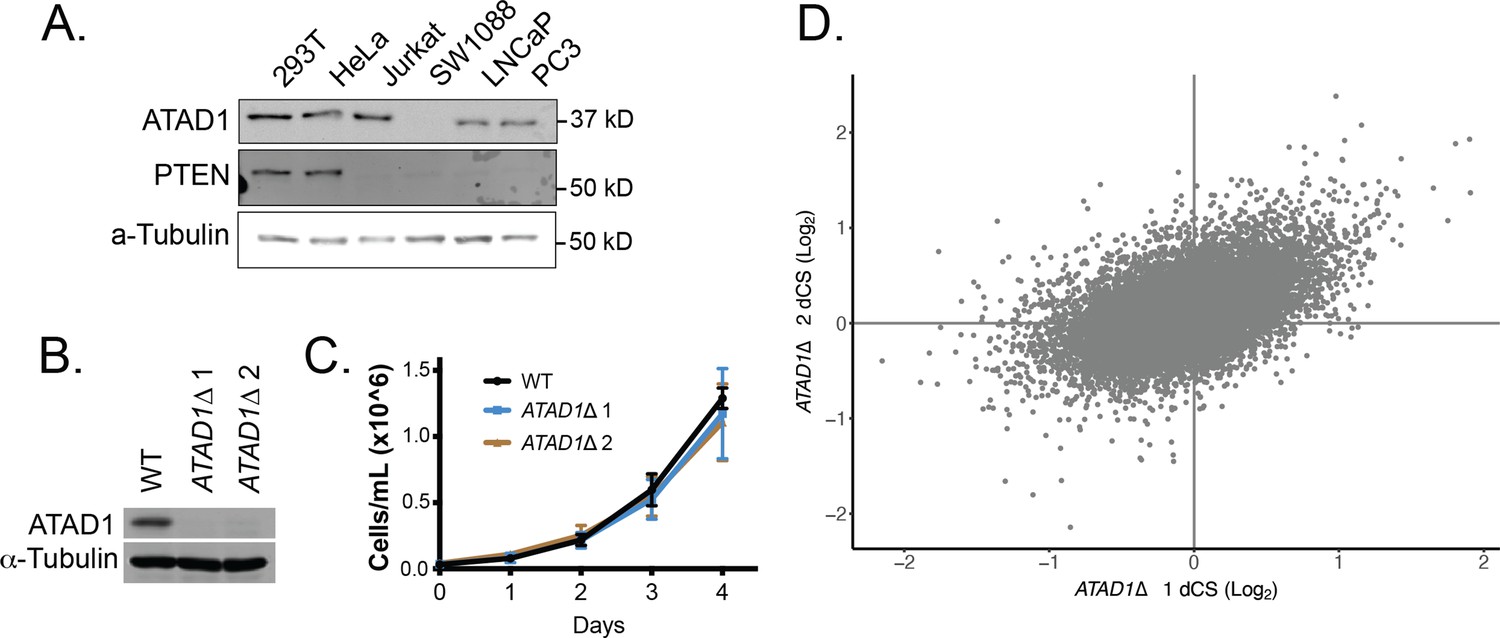
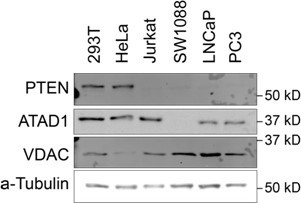
Supporting data for Jurkat CRISPR screens.
(A) Western blot demonstrating PTEN and ATAD1 status across cell lines. (B) Western blot verification of ATAD1 deficiency of ATAD1∆ cell lines. (C) Proliferation of wild-type (WT) and ATAD1∆ cell lines over 4 days; mean ± SD for n=3 independent experiments. (D) Differential CRISPR scores for the two ATAD1∆ clonal cell lines relative to WT; Pearson coefficient = 0.51, p=2.16 × 10⁻¹⁶.
-
Figure 1—figure supplement 3—source data 1
Source data used to make Figure 1—figure supplement 3.
- https://cdn.elifesciences.org/articles/82860/elife-82860-fig1-figsupp3-data1-v2.zip
Figure 1—figure supplement 4
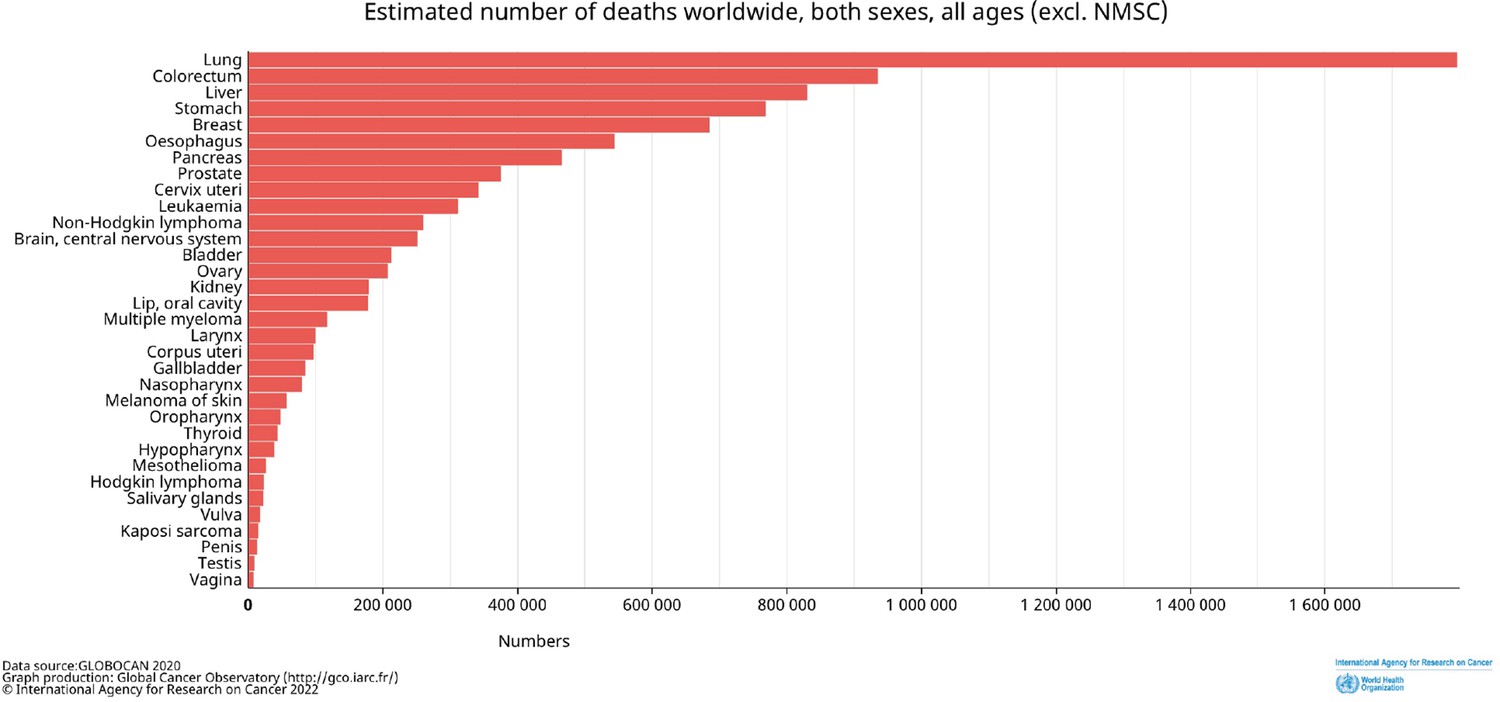
Estimated number of deaths worldwide by cancer type.
Both sexes and all ages are included. Data from GLOBOCAN2020; http://gco.iarc/fr/.
Figure 2 with 9 supplements
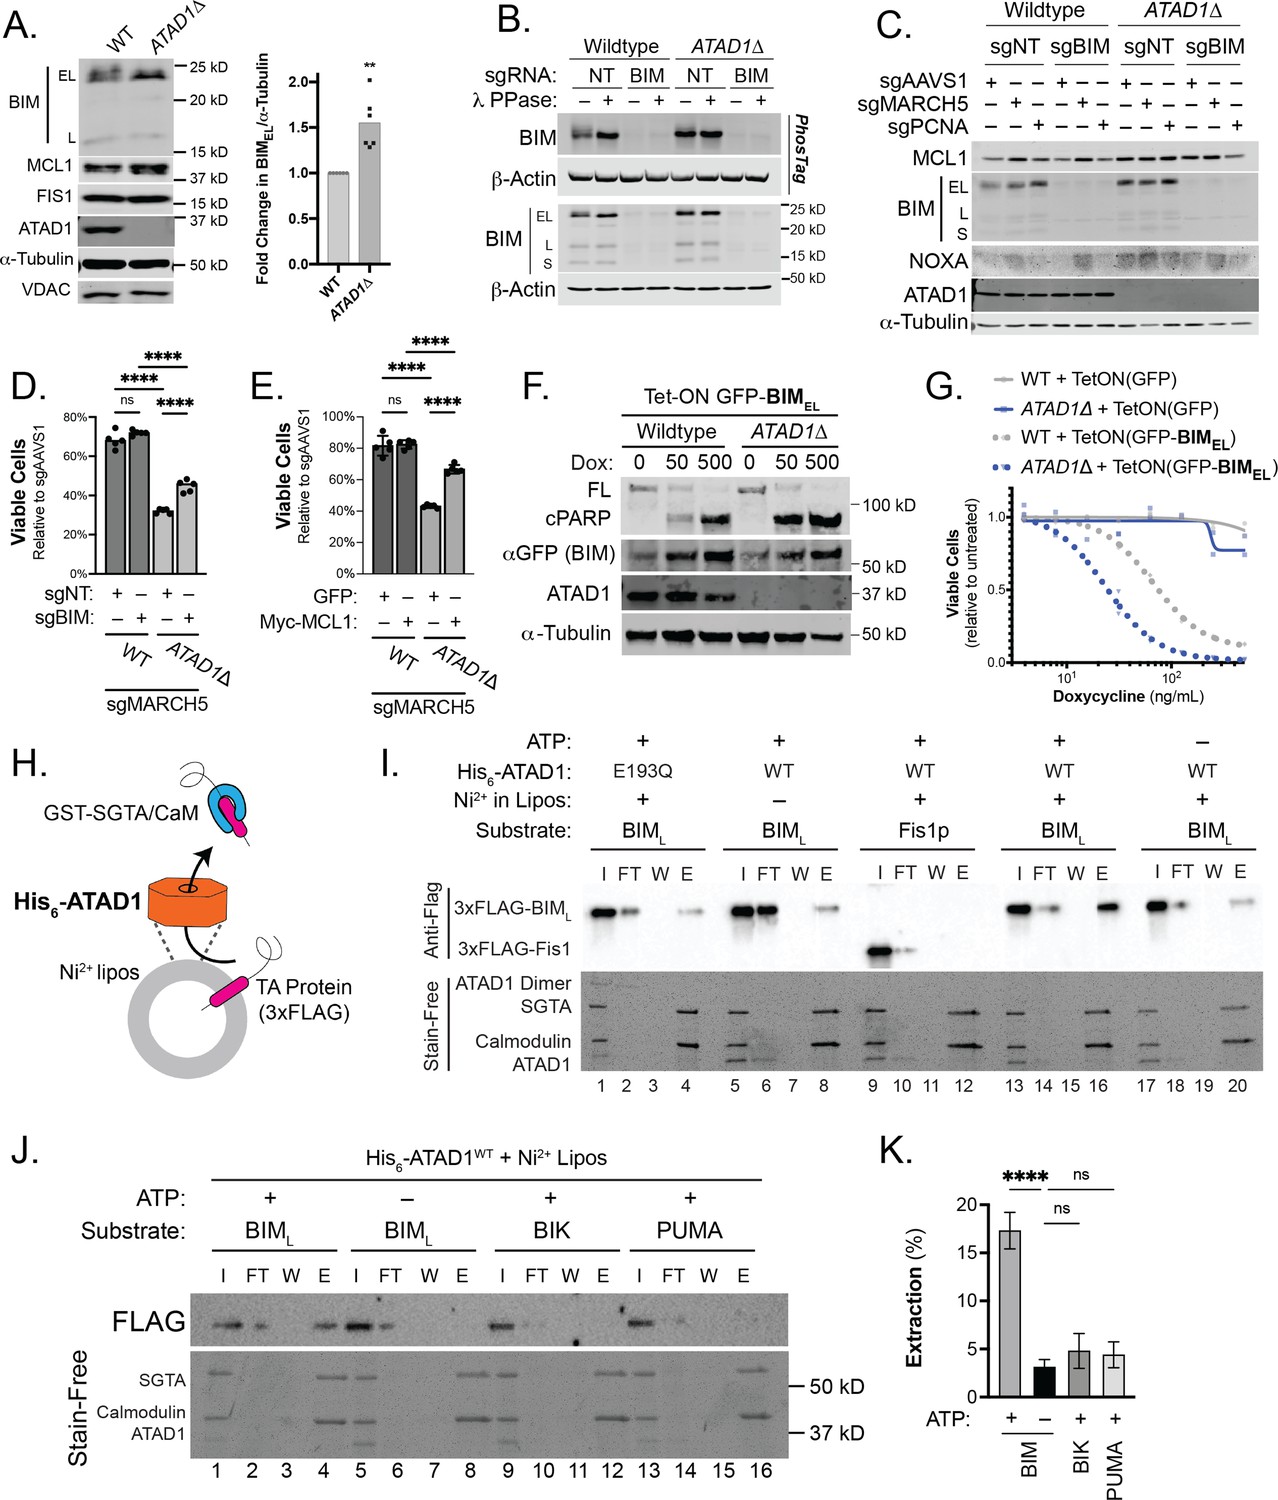
ATAD1/MARCH5 synthetic lethality is partially mediated by BIM, which is a novel ATAD1 substrate.
(A) Western blot of Jurkat cell lines, with quantification of BIMEL levels normalized to alpha-tubulin; one sample t and Wilcoxon test. (B) Western blot of whole cell lysates from wild-type (WT) or ATAD1∆ Jurkat cells stably expressing sgNT or sgBIM with Cas9-T2A-GFP. Lysates were mock treated or treated with lambda phosphatase (λ PPase) and analyzed by PhosTag/SDS-PAGE. (C) Western blots of Jurkat cell lines stably expressing Cas9-T2A-GFP with sgNT or sgBIM, harvested 4 days after transduction with additional indicated sgRNAs. (D) Viability of Jurkat cells after deletion of MARCH5, using different genetic backgrounds. Viability at 4 days post-transduction was normalized to that of cells transduced with sgRNA targeting AAVS1. Data analyzed by two-way ANOVA with Tukey’s multiple comparisons. (E) Viability of Jurkat cells stably expressing GFP or Myc-tagged MCL1 after deletion of MARCH5 and normalized as in (D). (F) Viability of Jurkat cells transduced with tetracycline-inducible GFP or GFP-BIMEL fusion; t=48 hr, normalized to viability of cells without doxycycline. (G) Western blot of cell lines as described in (D), treated with doxycycline (Dox) for 24 hr. (H) Schematic of in vitro extraction assay; ‘Ni2+ lipos’ indicates the use of nickel chelating headgroups of lipids in the liposomes; the star symbolizes a GST tag on the soluble chaperones, calmodulin (CaM) and SGTA, which are included to catch extracted TA substrates. (I) Extraction assay using His-ATAD1 and 3xFLAG-BIML (lanes 1–8, 13–20) or the negative control yeast TA protein, 3xFLAG-Fis1p (lanes 9–12); E193Q indicates the use of a catalytically inactive mutant of ATAD1; in samples shown in lanes 5–8, Ni2+ chelating lipids were omitted; in samples shown in lanes 17–20, ATP was omitted; ‘I’=Input, ‘FT’=flow-through, ‘W’=final wash, ‘E’=elution. Eluted fractions represent TA proteins extracted by ATAD1 and bound by GST-tagged chaperones; compare elution ‘E’ to input ‘I’. (J) Extraction assay as described in (H) but comparing different BH3-only proteins, BIM, BIK, and PUMA. (K) Quantification of assays as shown in (I), n=6 independent experiments.
-
Figure 2—source data 1
Source data and uncropped blots used to make Figure 2.
- https://cdn.elifesciences.org/articles/82860/elife-82860-fig2-data1-v2.zip
Figure 2—figure supplement 1
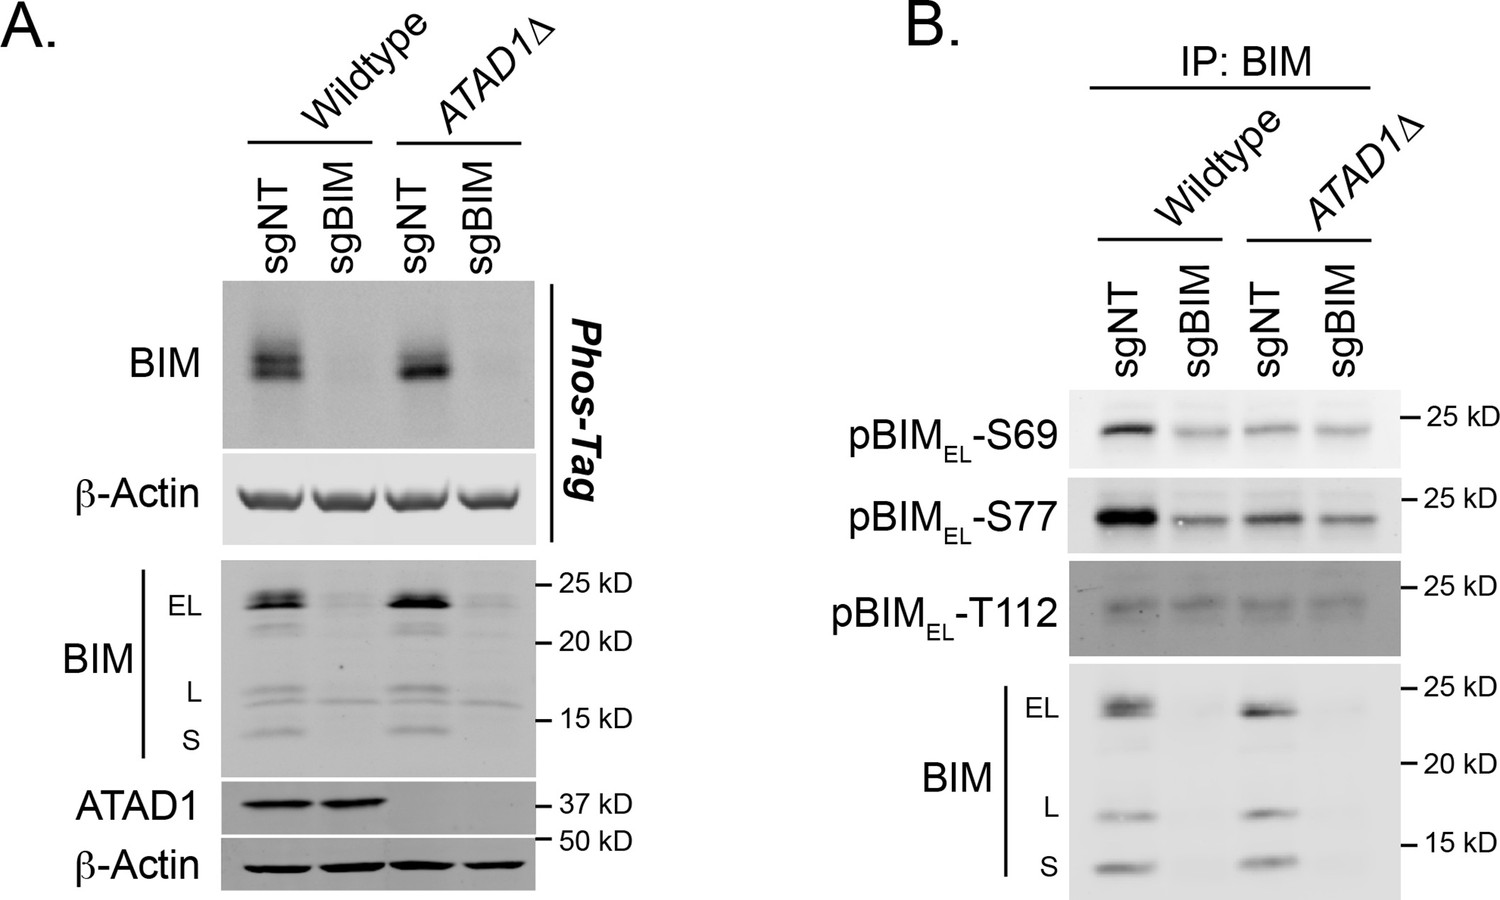
BIM phosphorylation in Jurkat cells.
(A) Western blot of lysates separated by SDS-PAGE or Phos-Tag SDS-PAGE. Image representative of two independent experiments. (B) Western blot of anti-BIM immunoprecipitates, probing with phospho-specific antibodies to BIM. Representative of two independent experiments.
-
Figure 2—figure supplement 1—source data 1
Source data used to make Figure 2—figure supplement 1.
- https://cdn.elifesciences.org/articles/82860/elife-82860-fig2-figsupp1-data1-v2.zip
Figure 2—figure supplement 2
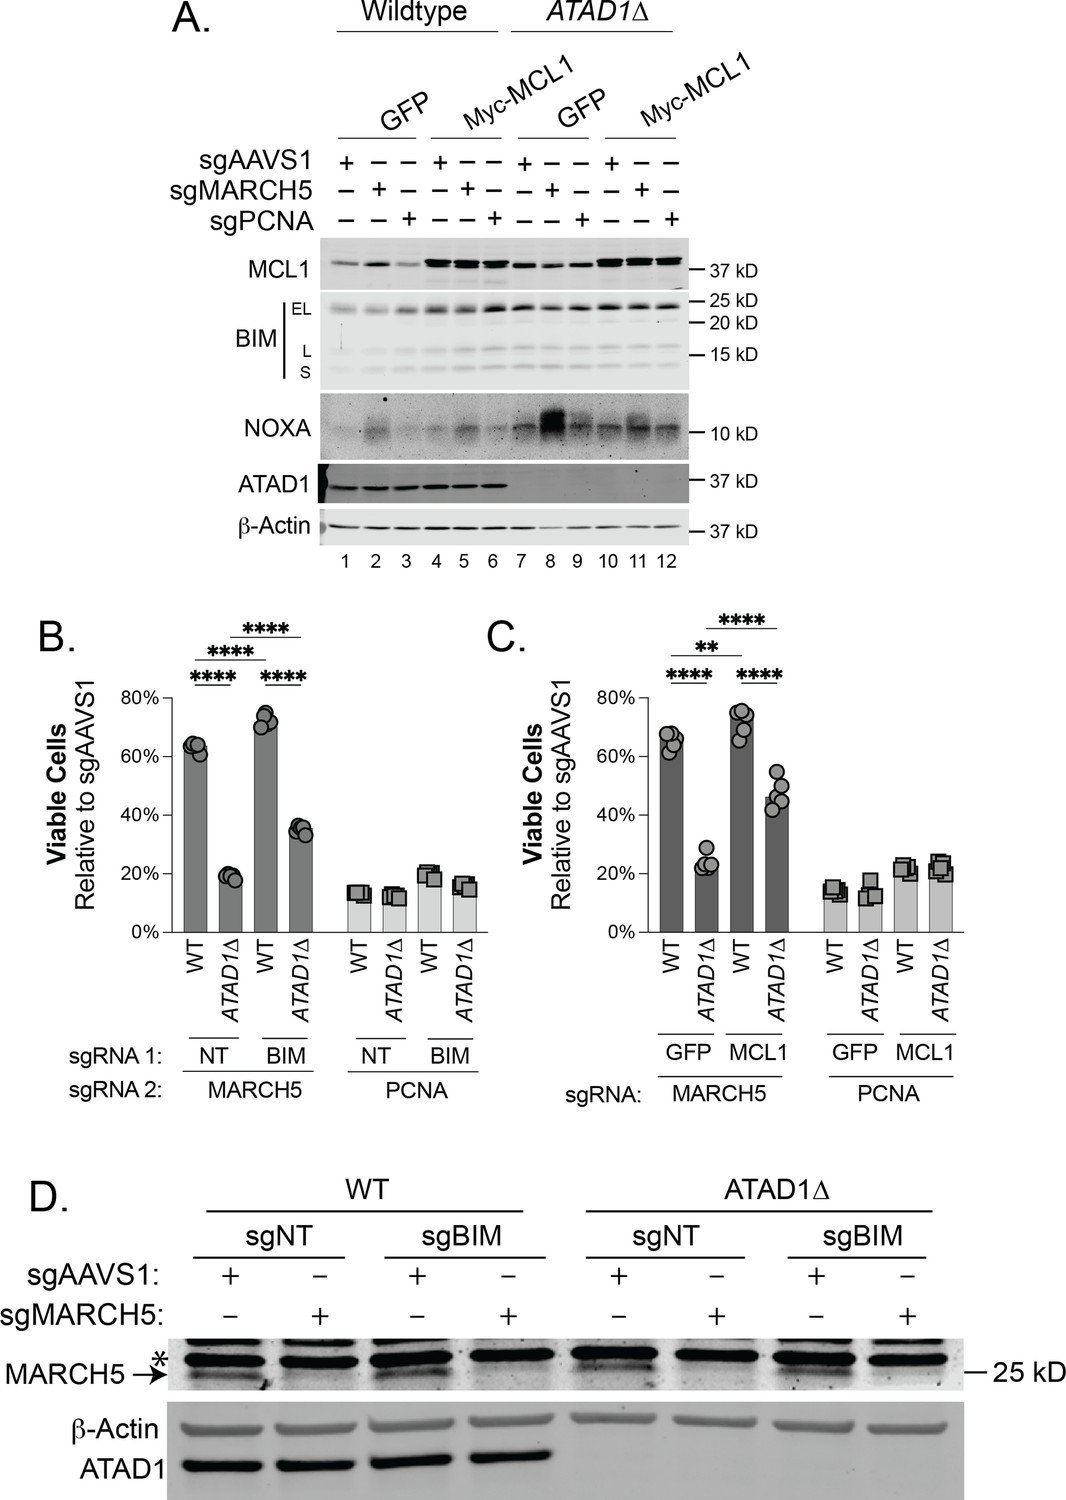
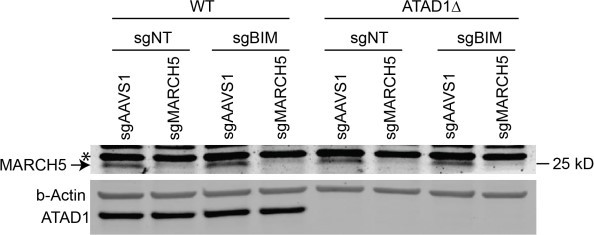
Synthetic lethality of ATAD1/MARCH5 partially depends on BIM and can be suppressed by MCL1.
(A) Western blot of whole cell lysates from Jurkat cells transduced with sgAAVS1, sgMARCH5, or sgPCNA at 4 days post-transduction. Wild-type (WT) and ATAD1∆ cells here stably express Cas9-T2A-GFP+sgNT, and either GFP or Myc-MCL1. (B) Viability of Jurkat cells stably expressing Cas9-T2A-GFP+sgNT/sgBIM, transduced with mCherry+sgMARCH5/sgPCNA and normalized to the same cells transduced instead with mCherry+sgAAVS1 at day 7, because PCNA deletion is not immediately toxic to cells. N=5 biological replicates. (C) Viability of Jurkat cells as described in (A), measured at day = 7, because PCNA deletion is not immediately toxic to cells. N=5 biological replicates.
-
Figure 2—figure supplement 2—source data 1
Source data used to make Figure 2—figure supplement 2.
- https://cdn.elifesciences.org/articles/82860/elife-82860-fig2-figsupp2-data1-v2.zip
Figure 2—figure supplement 3
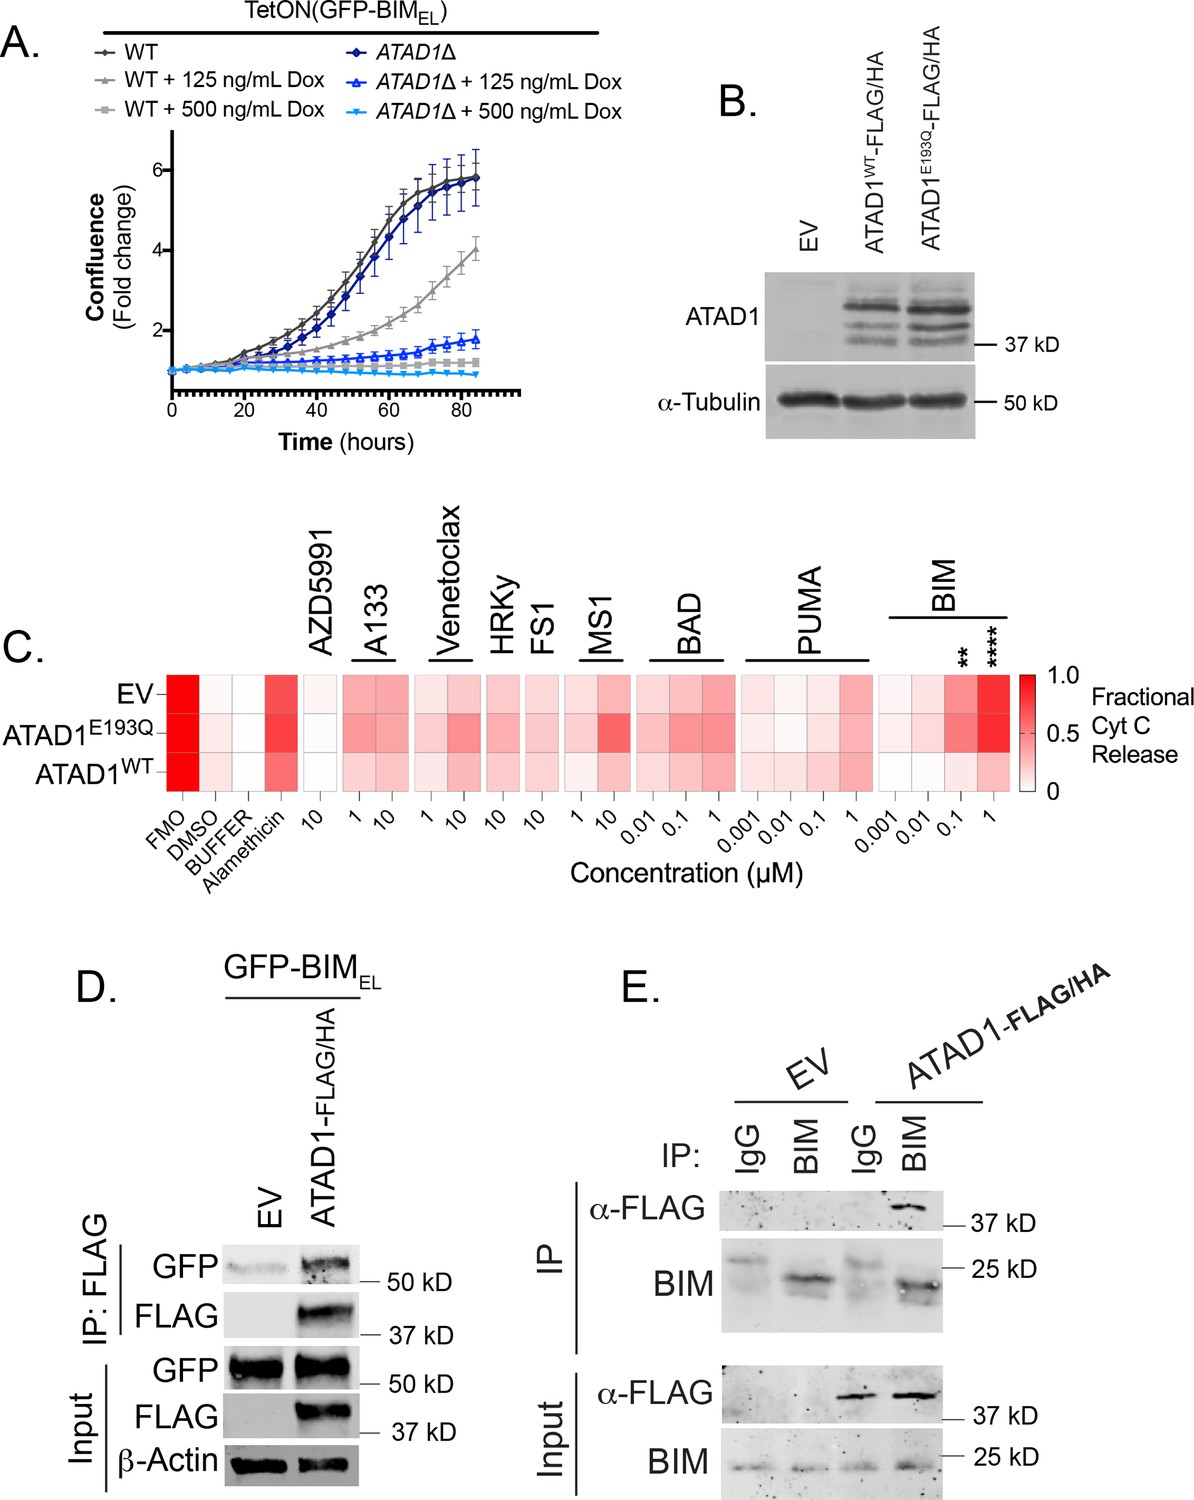
Functional and physical interaction of ATAD1 and BIM.
(A) Fold-change in confluence measured by Incucyte software, of Jurkat cell lines transduced with tetracycline-inducible GFP-BIMEL, treated with indicated concentrations of doxycycline; mean ± SEM from n=3 biological replicates, representative of three independent experiments. (B) Western blot of H4 cells transduced with indicated constructs. Multiple ATAD1 bands correspond to cleavage of C-terminal epitope tags, which is sometimes seen in cell lines re-expressing ATAD1-FLAG/HA. (C) BH3 profiling data on H4 glioma cells (Del10q23) transduced with the indicated constructs (rows). A133 indicates A1331852. FMO: Fluorescence Minus One FACS control; mean of n=3 biological replicates is shown; **** or ** indicates p<0.001 or p<0.01 by unpaired two-sided t-test. (D) Western blot of co-immunoprecipitation from H4 cells transduced with empty vector (EV) or ATAD1-FLAG/HA and transfected with GFP-BIMEL in the presence of zVAD-FMK. Representative of two independent experiments. (E) Western blot of co-immunoprecipitation from membrane fractions of H4 cells, precipitating endogenous BIM (anti-BIM or IgG as control) and immunoblotting for FLAG-tagged ATAD1. Representative of three independent experiments.
-
Figure 2—figure supplement 3—source data 1
Source data used to make Figure 2—figure supplement 3.
- https://cdn.elifesciences.org/articles/82860/elife-82860-fig2-figsupp3-data1-v2.zip
Figure 2—figure supplement 4
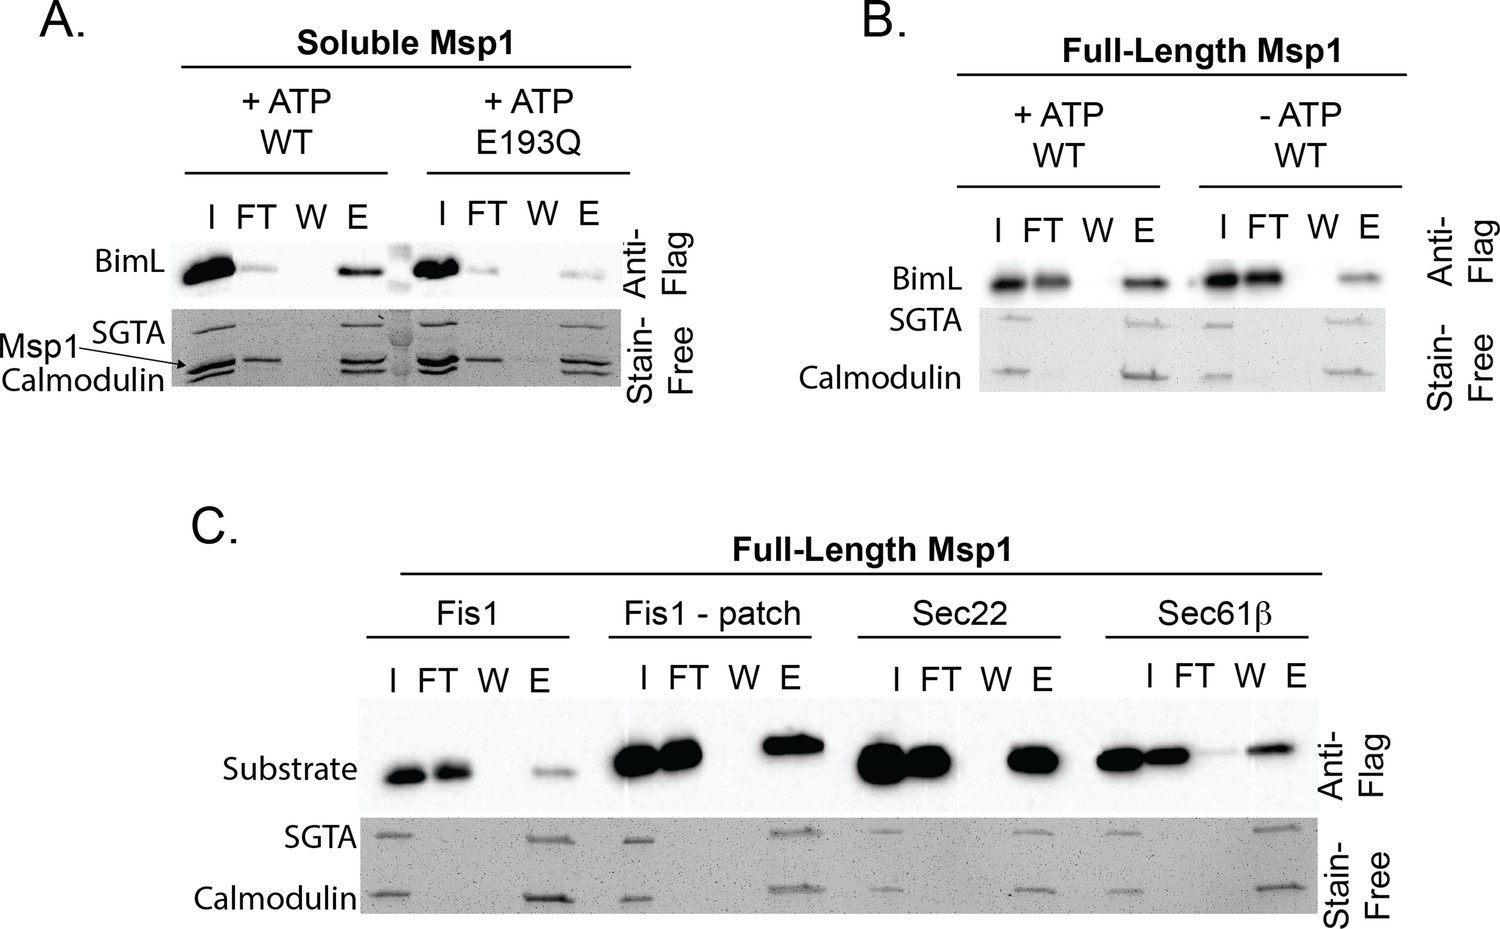
Validation of proteoliposome extraction assay.
(A) Soluble His-Msp1 and full-length Msp1 (B) extract BIML from proteoliposomes. (C) The extraction assay recapitulates physiological substrate selectivity of Msp1. Fis1 is extracted when a known Msp1 recognition motif consisting of a hydrophobic patch of residues from Pex15 is inserted N-terminal to the TMD (‘Fis1 - patch’). Sec22 and Sec61b are positive controls demonstrating that Msp1 can recognize ER-native TA proteins.
-
Figure 2—figure supplement 4—source data 1
Source data used to make Figure 2—figure supplement 4.
- https://cdn.elifesciences.org/articles/82860/elife-82860-fig2-figsupp4-data1-v2.zip
Figure 2—figure supplement 5
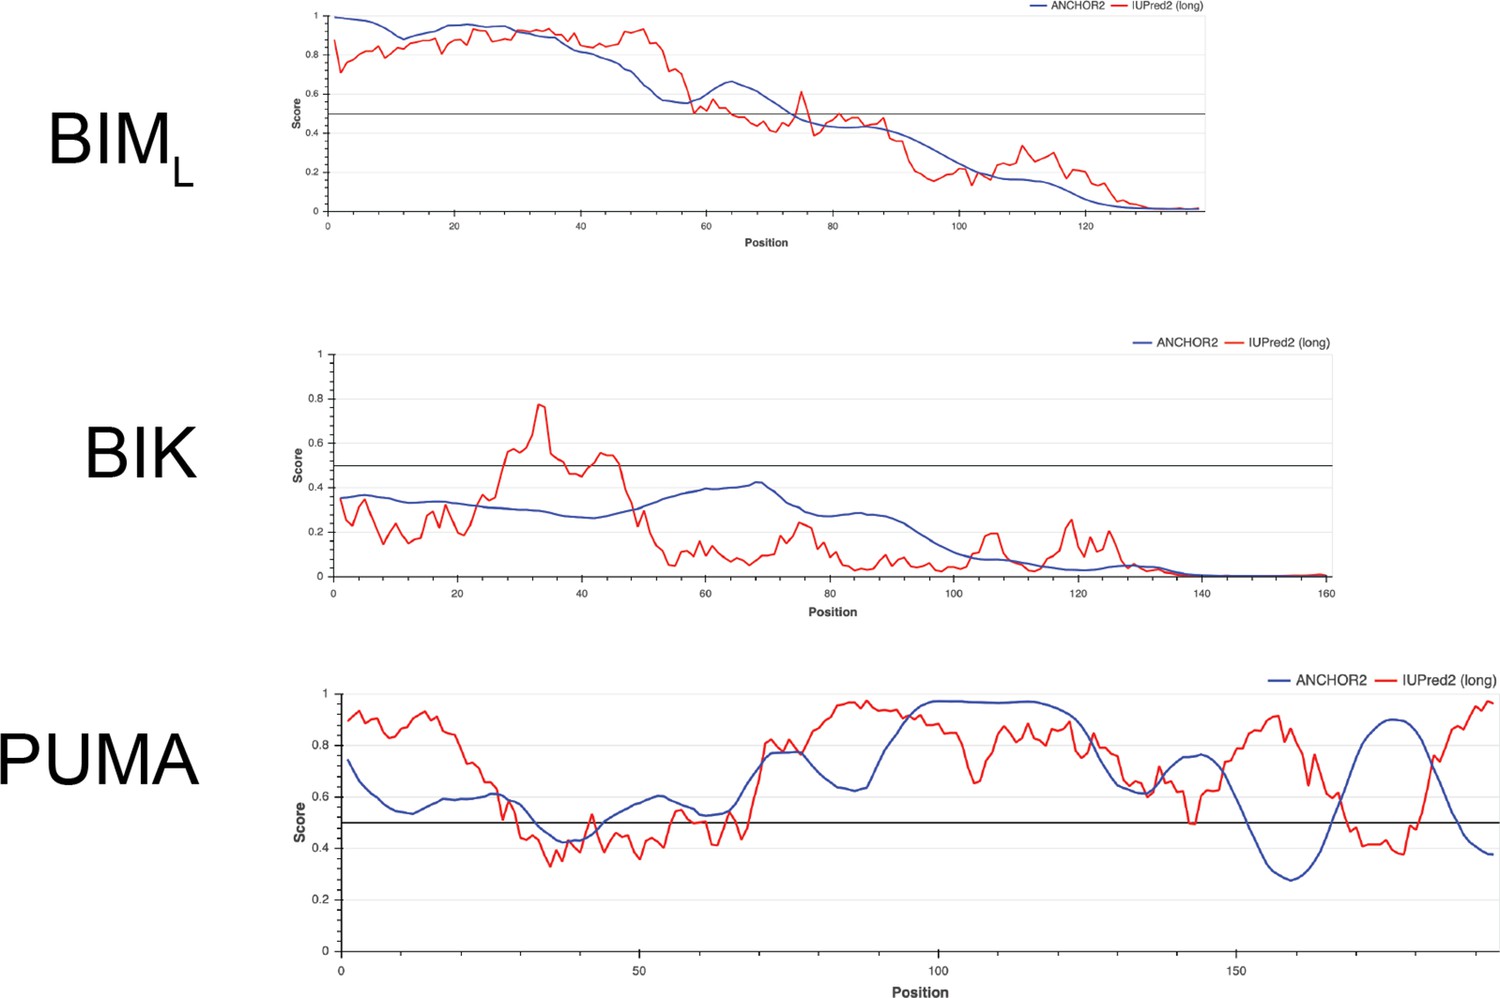
Comparing intrinsically disordered regions of BIML, BIK, and PUMA.
Y-axis is a measure of disorder, with amino acid position on the x-axis; FASTA sequences were obtained from UniProt and analyzed with IUPred2A and ANCHOR2.
Figure 2—figure supplement 6
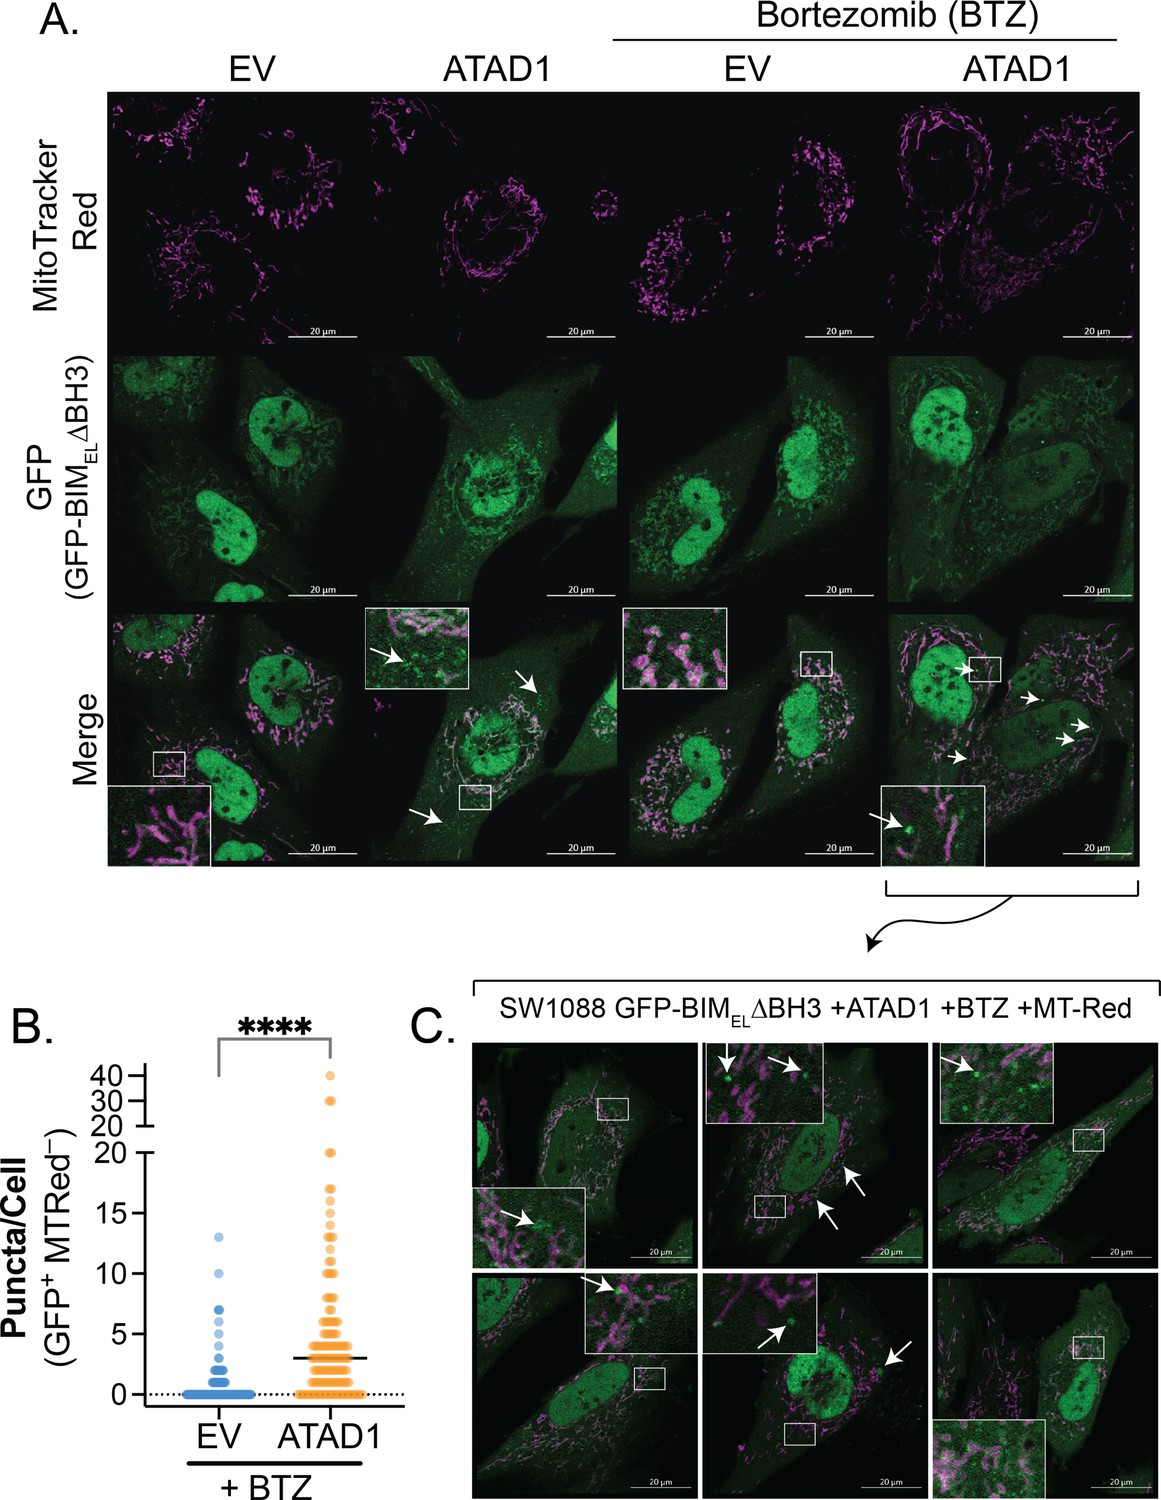
ATAD1 promotes non-mitochondrial localization of GFP-tagged BIMEL∆BH3.
(A) Confocal microscopy of live cells transduced with empty vector (EV) or ATAD1-FLAG, plus TetON(GFP-BIMEL∆BH3) and treated with 100 ng/mL doxycycline for 24 hr. Bortezomib treatment was used at a concentration of 100 nM for 2 hr. Mitochondria were visualized with MitoTracker Red. Images are representative of at least three independent experiments, and the microscopist was blinded. Arrows indicate GFP+ MTRed– puncta. Scale bar = 20 µm. (B) Quantification of GFP+ MTRed– puncta in BTZ-treated cells, as shown in (A); n=132 (EV) or 127 cells (ATAD1) compiled from three independent experiments; unpaired, two-sided t-test, **** indicates p<0.001. (C) Additional examples of GFP-positive puncta induced by bortezomib treatment in SW1088 cells expressing ATAD1 and GFP-BIMEL∆BH3. Images were taken by a blinded investigator and are representative of three independent experiments.
Figure 2—figure supplement 7
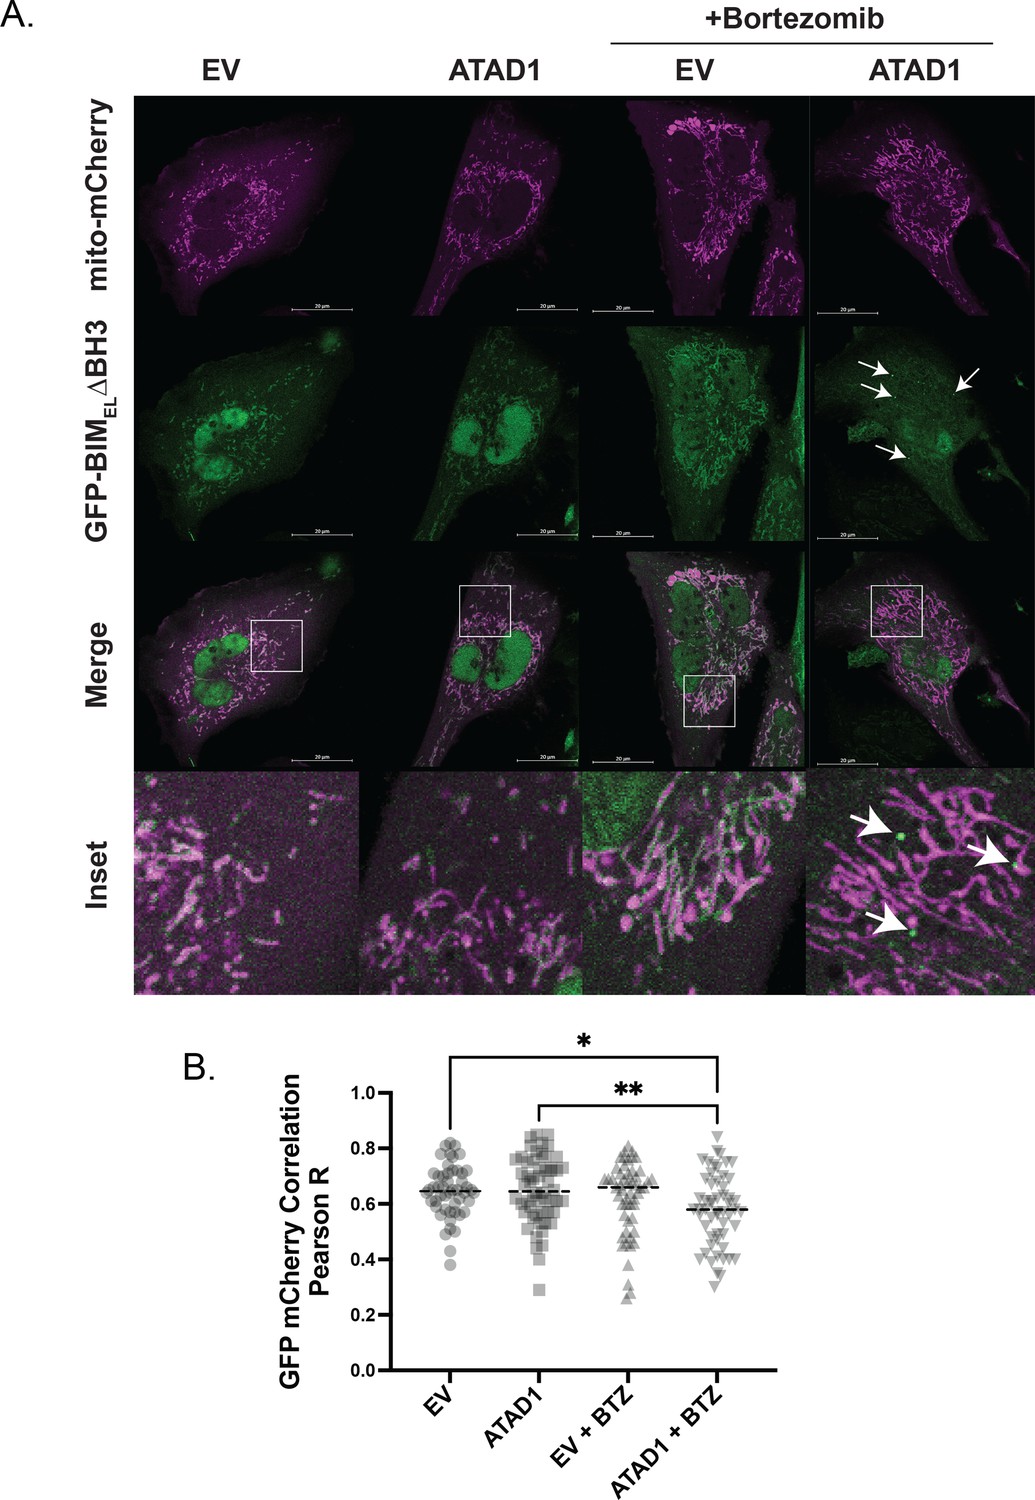
GFP-BIM puncta do not colocalize with mitochondria labeled with mito-mCherry.
(A) Confocal microscopy of live SW1088 cells transduced with empty vector (EV)/ATAD1, mito-mCherry, and TetON(GFP-BIMEL∆BH3). BIM expression was induced with 100 ng/mL doxycycline for 24 hr, and bortezomib was used for 2 hr prior to imaging at 100 nM. Mitochondria were labeled by expressing mCherry with an N-terminal fusion of the mitochondrial targeting sequence of COX8. N≥30 cells per condition, imaged by a blinded microscopist. (B) Quantification of colocalization between GFP (BIM) and mCherry (mitochondria) in the presence and absence of ATAD1, with and without bortezomib treatment. Data were analyzed by one-way ANOVA with Tukey’s multiple comparisons test. Colocalization analysis was conducted using Coloc2 in FIJI, and the region of interest was defined as a single cell, excluding the nucleus.
Figure 2—figure supplement 8
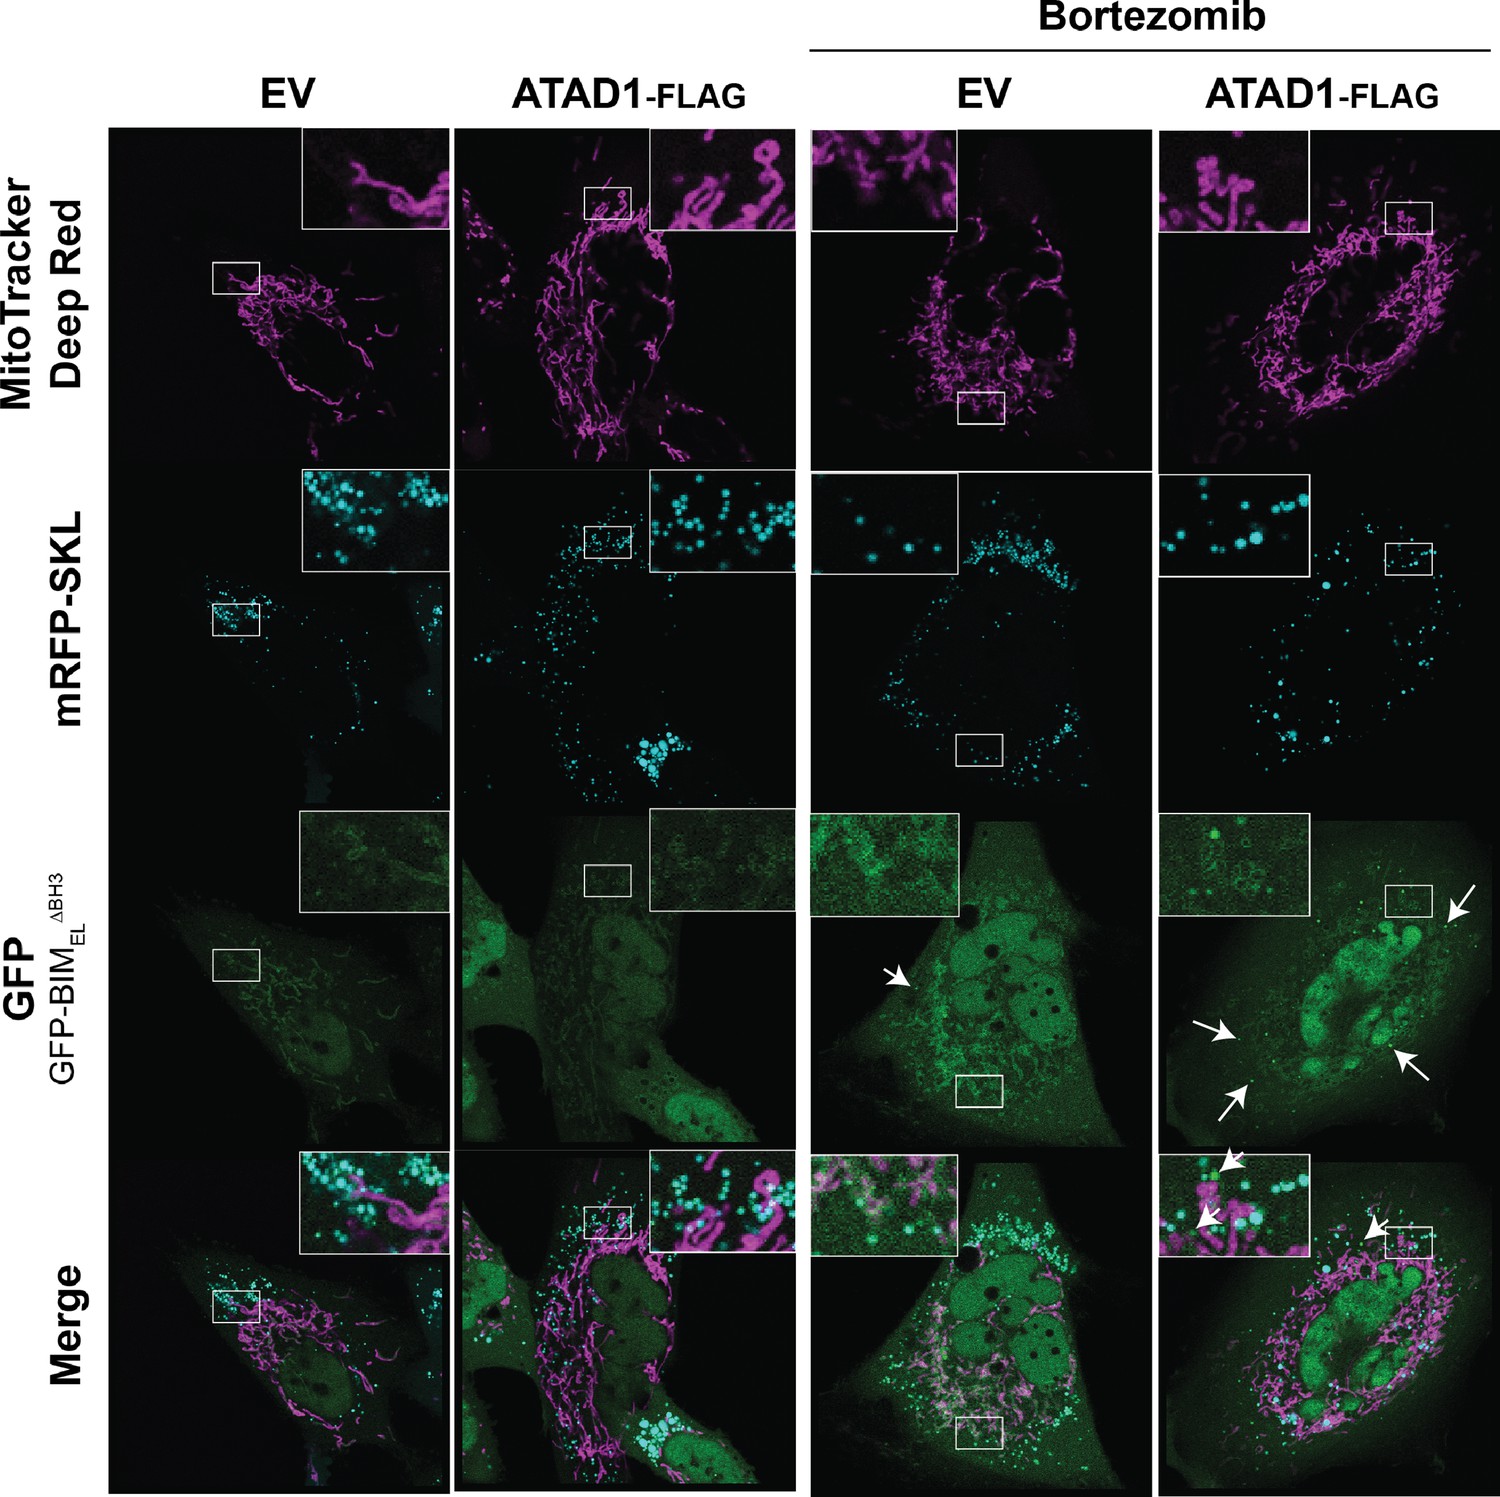
GFP-BIM puncta do not colocalize with peroxisomes.
Confocal microscopy of SW1088 cells transduced with empty vector (EV) or ATAD1, monomeric RFP-SKL (peroxisome marker), and TetON(GFP-BIMEL∆BH3). BIM expression was induced with 100 ng/mL doxycycline for 24 hr, and bortezomib was used for 2 hr prior to imaging at 100 nM. Mitochondria were labeled with Mitotracker Deep Red. N≥30 cells per condition, imaged by a blinded microscopist.
Figure 2—figure supplement 9
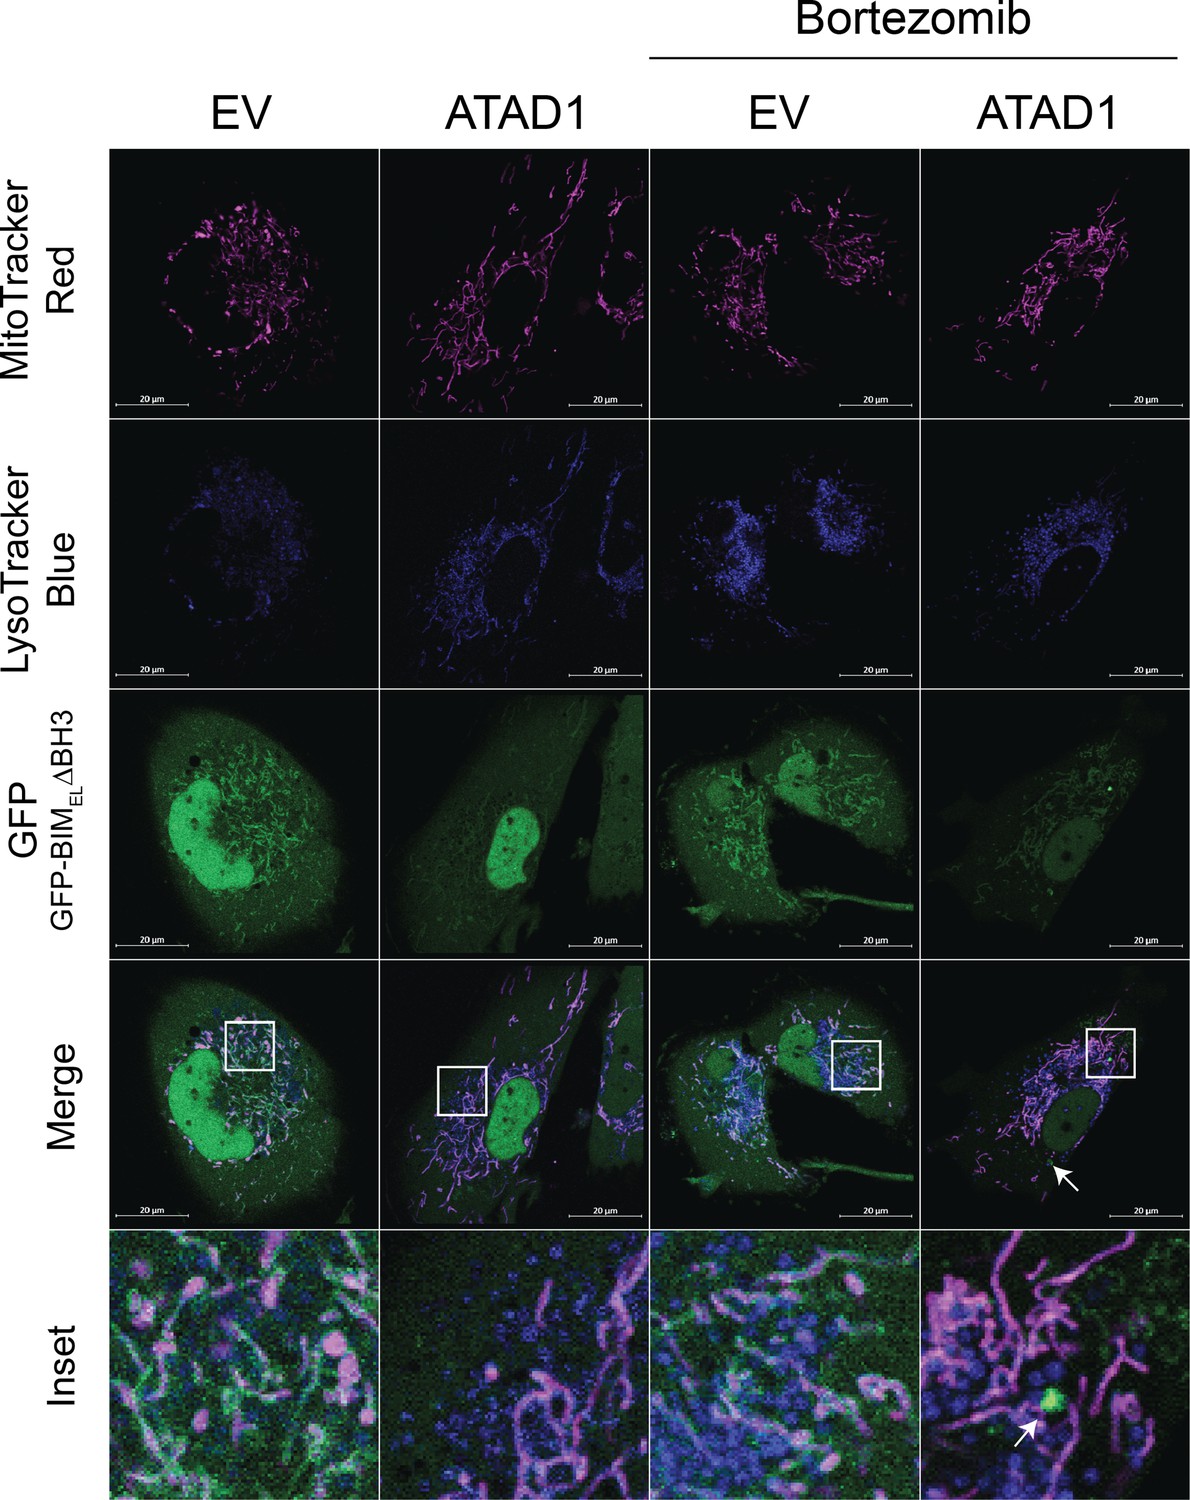
GFP-BIM puncta do not colocalize with lysotracker blue.
Confocal microscopy of SW1088 cells transduced with empty vector (EV) or ATAD1, and TetON(GFP-BIMEL∆BH3). BIM expression was induced with 100 ng/mL doxycycline for 24 hr, and bortezomib was used for 2 hr prior to imaging at 100 nM. Mitochondria were labeled with Mitotracker Deep Red. Lysosomes were labeled with LysoTracker Blue. N≥30 cells per condition, imaged by a blinded microscopist.
Figure 3 with 4 supplements
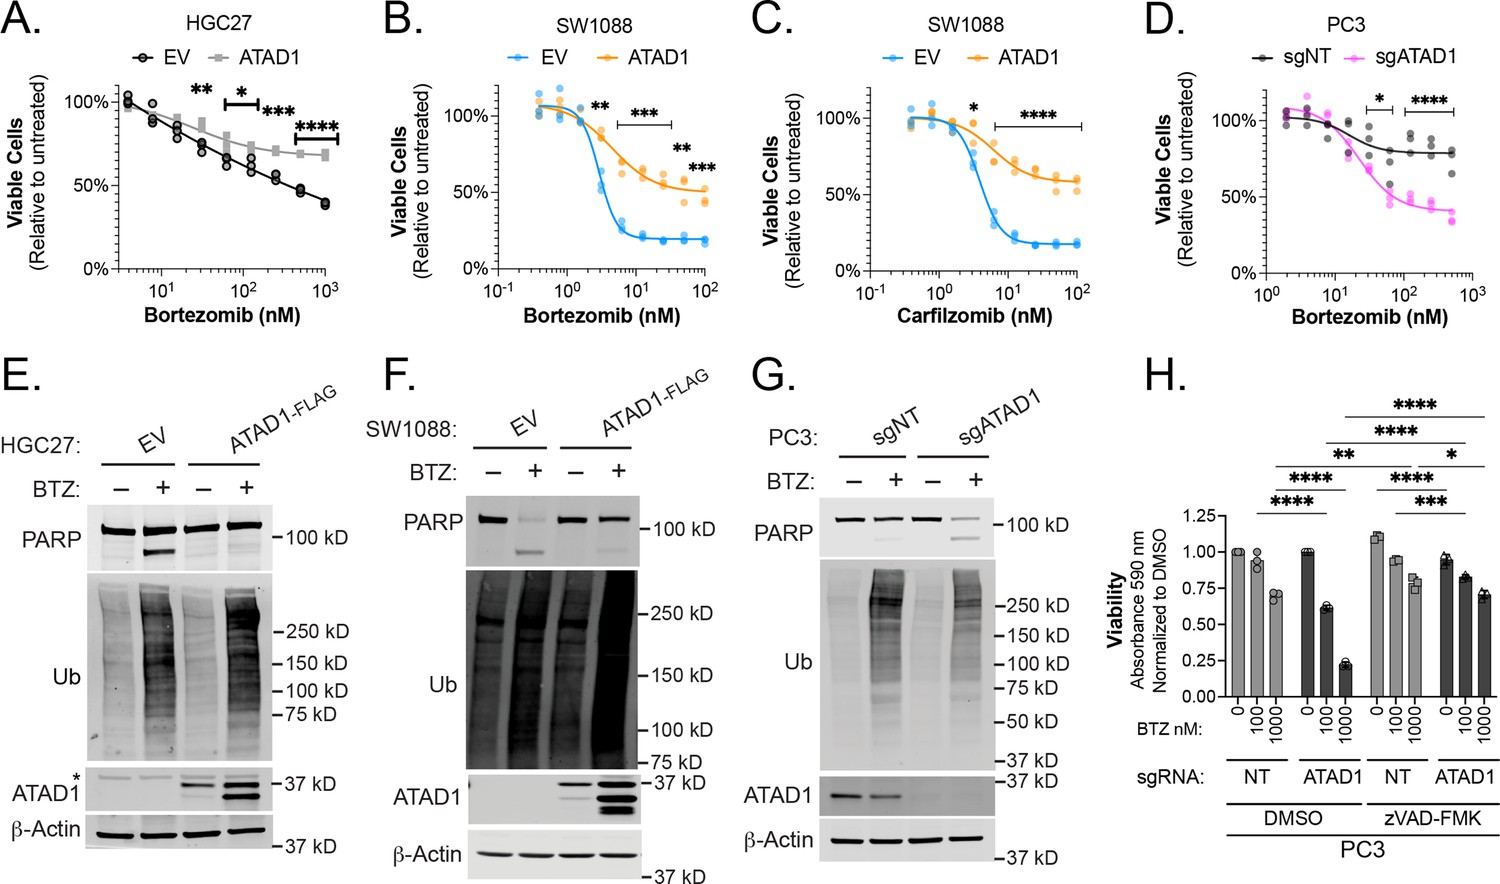
ATAD1 protects cells from apoptosis triggered by proteasome inhibition.
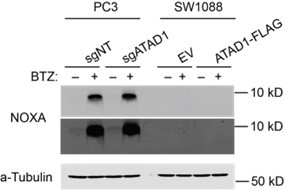
(A) Viability of HGC27 cells treated with bortezomib (BTZ) for 16 hr. (B) Viability of SW1088 cells treated with BTZ for 24 hr. (C) Viability of SW1088 cells treated with carfilzomib, a different proteasome inhibitor, for 24 hr. (D) Viability of PC3 cells treated with BTZ for 16 hr. (E) Western blots of HGC27 cells screen treated with 1 µM BTZ for 16 hr. (F) Western blots of SW1088 cells transduced with empty vector (EV) or ATAD1-FLAG and treated with 100 nM BTZ for 16 hr. (G) Western blots of PC3 cells transduced with non-targeting sgRNA or ATAD1 sgRNA and treated with 1 µM BTZ for 16 hr. (H) Viability as measured by normalized crystal violet staining (Abs 590 nm) in PC3 cells transduced with sgNT vs. sgATAD1, treated with BTZ for 16 hr in the presence or absence of 40 µM zVAD-FMK. Data analyzed by two-way ANOVA with Tukey’s multiple comparisons.
-
Figure 3—source data 1
Source data used to make Figure 3.
- https://cdn.elifesciences.org/articles/82860/elife-82860-fig3-data1-v2.zip
Figure 3—figure supplement 1
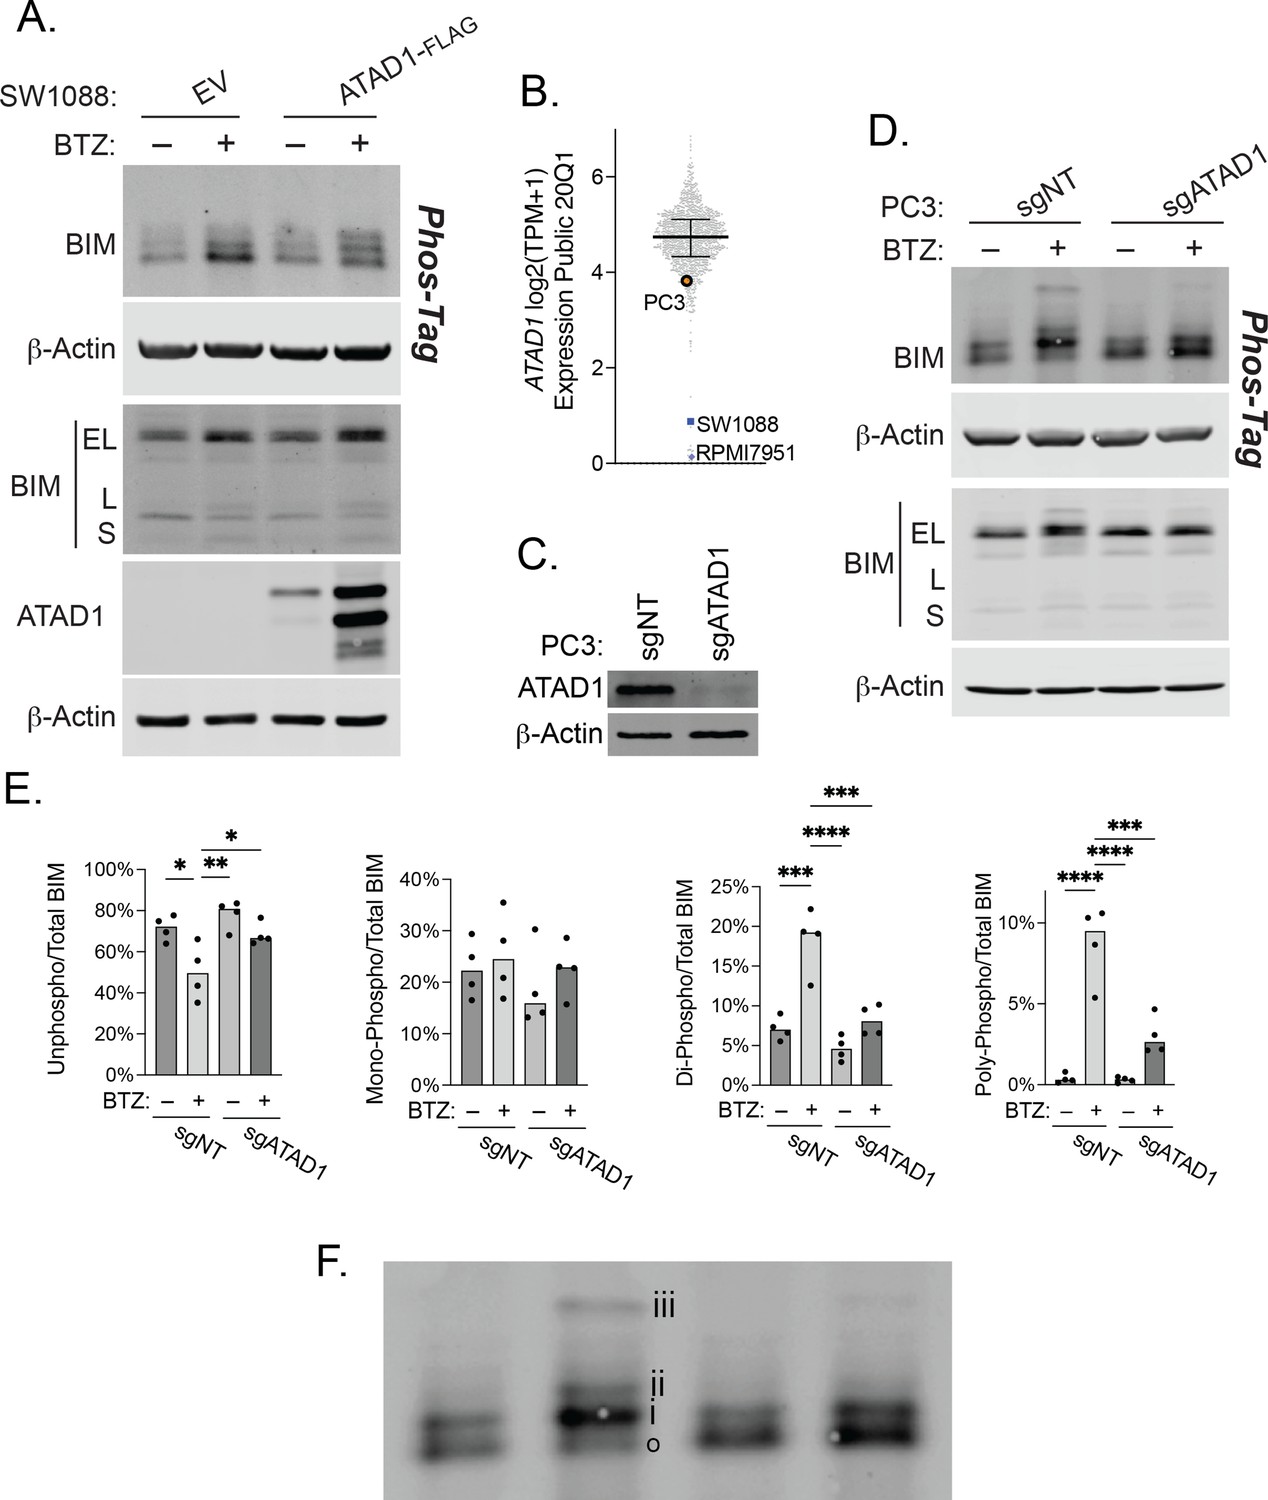
ATAD1 promotes BIMEL phosphorylation in response to proteasome inhibition.
(A) Western blot of SW1088 cells (Del10q23; basally ATAD1-null) transduced with empty vector (EV) or ATAD1-FLAG and treated with 100 nM bortezomib overnight. Whole cell lysates were analyzed by SDS-PAGE and Phos-Tag SDS-PAGE; representative of two independent experiments. (B) Expression levels of ATAD1 across cell lines in DepMap (log2(TPM+1)). (C) Western blot of PC3 cells transduced with LentiCRISPRv2 sgNT or sgATAD1. (D) Western blot of PC3 cells transduced with non-targeting gRNA (sgNT) or sgATAD1 and treated with 1 µM bortezomib overnight. Whole cell lysates were analyzed by SDS-PAGE and Phos-Tag SDS-PAGE; representative of four independent experiments. (E) Quantification of BIM phosphorylation in PC3 cells treated as in (B), n=4 independent experiments. Data were compared by one-way ANOVA with Tukey’s multiple comparisons test. (F) Enlarged blot from (B) above used to clearly demonstrate phosphorylation status of BIM: ‘o’=unphosphorylated; ‘i’=monophosphorylated; ‘ii’=di-phosphorylated; ‘iii’=poly-phosphorylated.
-
Figure 3—figure supplement 1—source data 1
Source data used to make Figure 3—figure supplement 1.
- https://cdn.elifesciences.org/articles/82860/elife-82860-fig3-figsupp1-data1-v2.zip
Figure 3—figure supplement 2
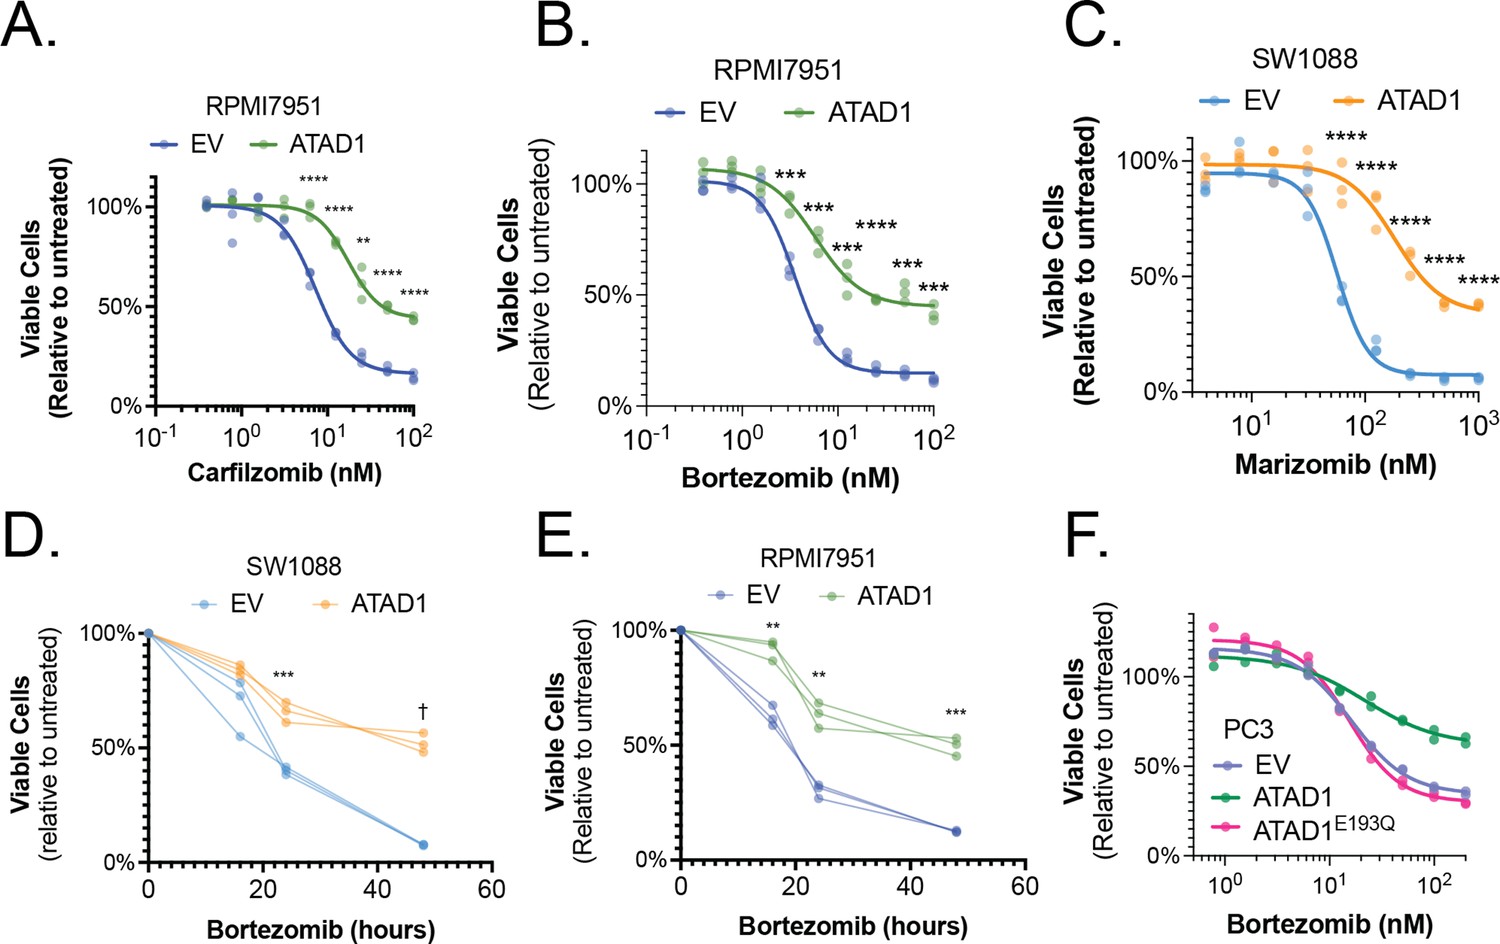
ATAD1 status and proteasome inhibition in cancer cell lines.
(A) Viability of RPMI7951 cells treated with carfilzomib or bortezomib (B) for 16 hr, n=3 biological replicates, two independent experiments. (C) Viability of SW1088 cells treated with marizomib for 24 hr, n=3 biological replicates, two independent experiments. (D) Viability of SW1088 cells treated with bortezomib (3.9 nM) for the indicated durations, n=3 biological replicates. (E) Viability of RPMI7951 cells treated with bortezomib (3.1 nM) for the indicated durations, n=3 biological replicates. (F) Viability of PC3 cells transduced with empty vector (EV), ATAD1WT, or ATAD1E193Q and treated with bortezomib for 24 hr. n=2 biological replicates, 3 independent experiments. Data were analyzed by two-way ANOVA with Tukey’s multiple comparisons test.
Figure 3—figure supplement 3
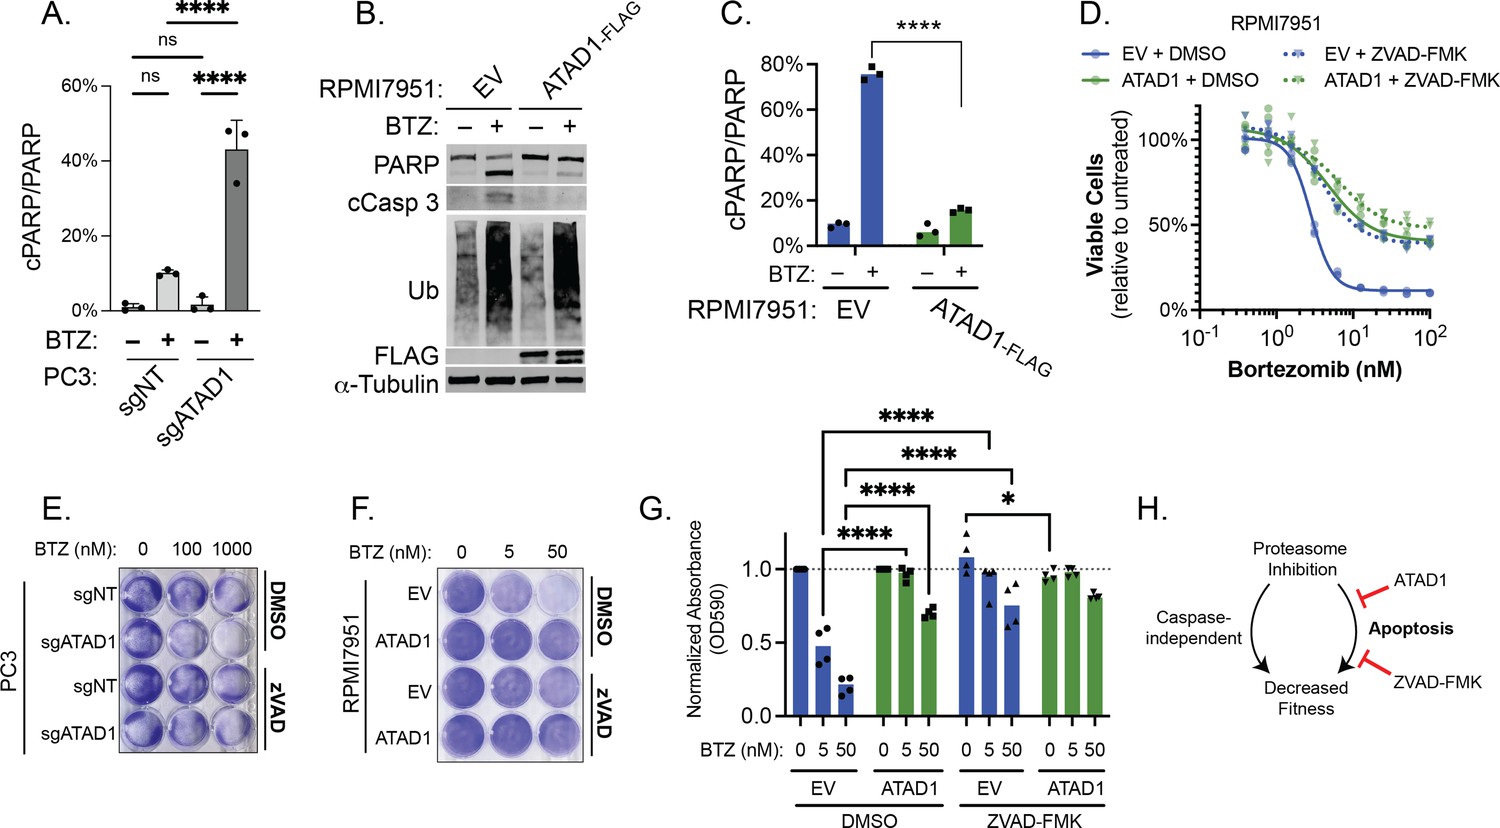
ATAD1 protects cells from proteasome inhibition by blocking apoptosis, specifically.
(A) Quantification of PARP cleavage from experiments; PC3 cells treated with bortezomib (BTZ) for 16 hr. (B) Western blot of whole cell lysates from RPMI7951 cells transduced with empty vector (EV) or ATAD1-FLAG and treated with BTZ (100 nM) for 8 hr; representative of three independent experiments. (C) Quantification of PARP cleavage from experiments represented by (A). (D) Viability of RPMI7951 cells transduced with EV/ATAD1, treated with DMSO (0.1%) or ZVAD-FMK (20 µM), and varying doses of BTZ for 16 hr. n=3 biological replicates, 2 independent experiments. (E) Representative image of crystal violet staining of PC3 cells transduced with sgNT/sgATAD1, treated with DMSO (0.1%) or ZVAD-FMK (40 µM), and indicated doses of BTZ for 16 hr. n=3 independent experiments. Quantification shown in main figure. (F) Representative image of crystal violet staining of RPMI7951 cells transduced with EV/ATAD1, treated with DMSO (0.1%) or ZVAD-FMK (20 µM), and indicated doses of BTZ for 16 hr. n=4 independent experiments. (G) Quantification of eluted crystal violet from RPMI7951 cells treated as described in (E). Values were normalized to that of DMSO-treated cells from the same plate. Data analyzed by two-way ANOVA with Tukey’s multiple comparisons test. (H) Schematic depicting that proteasome inhibition can decrease cell fitness via caspase-independent and caspase-dependent (apoptosis) pathways. ATAD1, like ZVAD-FMK, only affects the caspase-dependent pathway, an unexpected insight into how ATAD1 protects cells from protein stress. Data were analyzed by two-way ANOVA with Tukey’s multiple comparisons test.
-
Figure 3—figure supplement 3—source data 1
Source data used to make Figure 3—figure supplement 3.
- https://cdn.elifesciences.org/articles/82860/elife-82860-fig3-figsupp3-data1-v2.zip
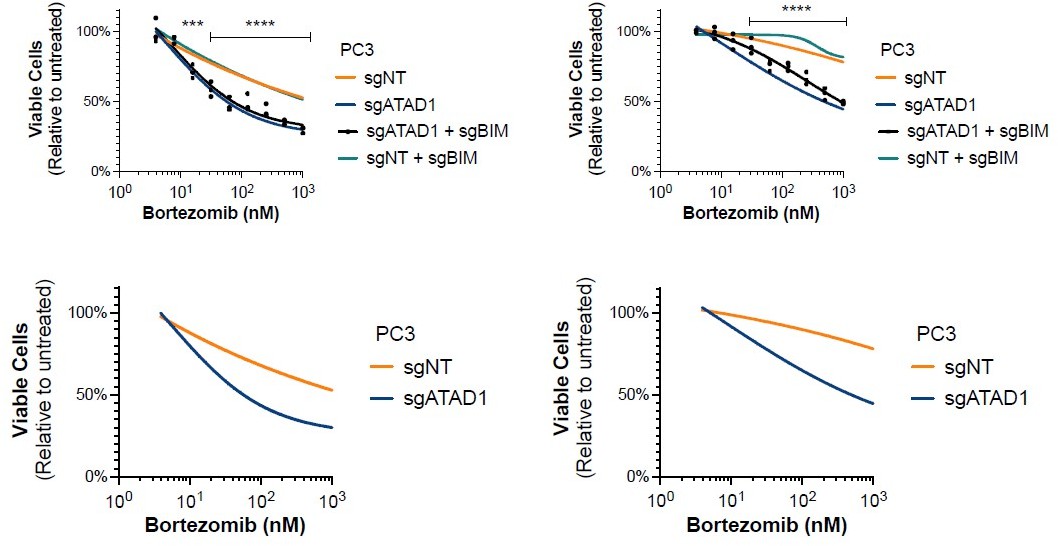
Figure 3—figure supplement 4
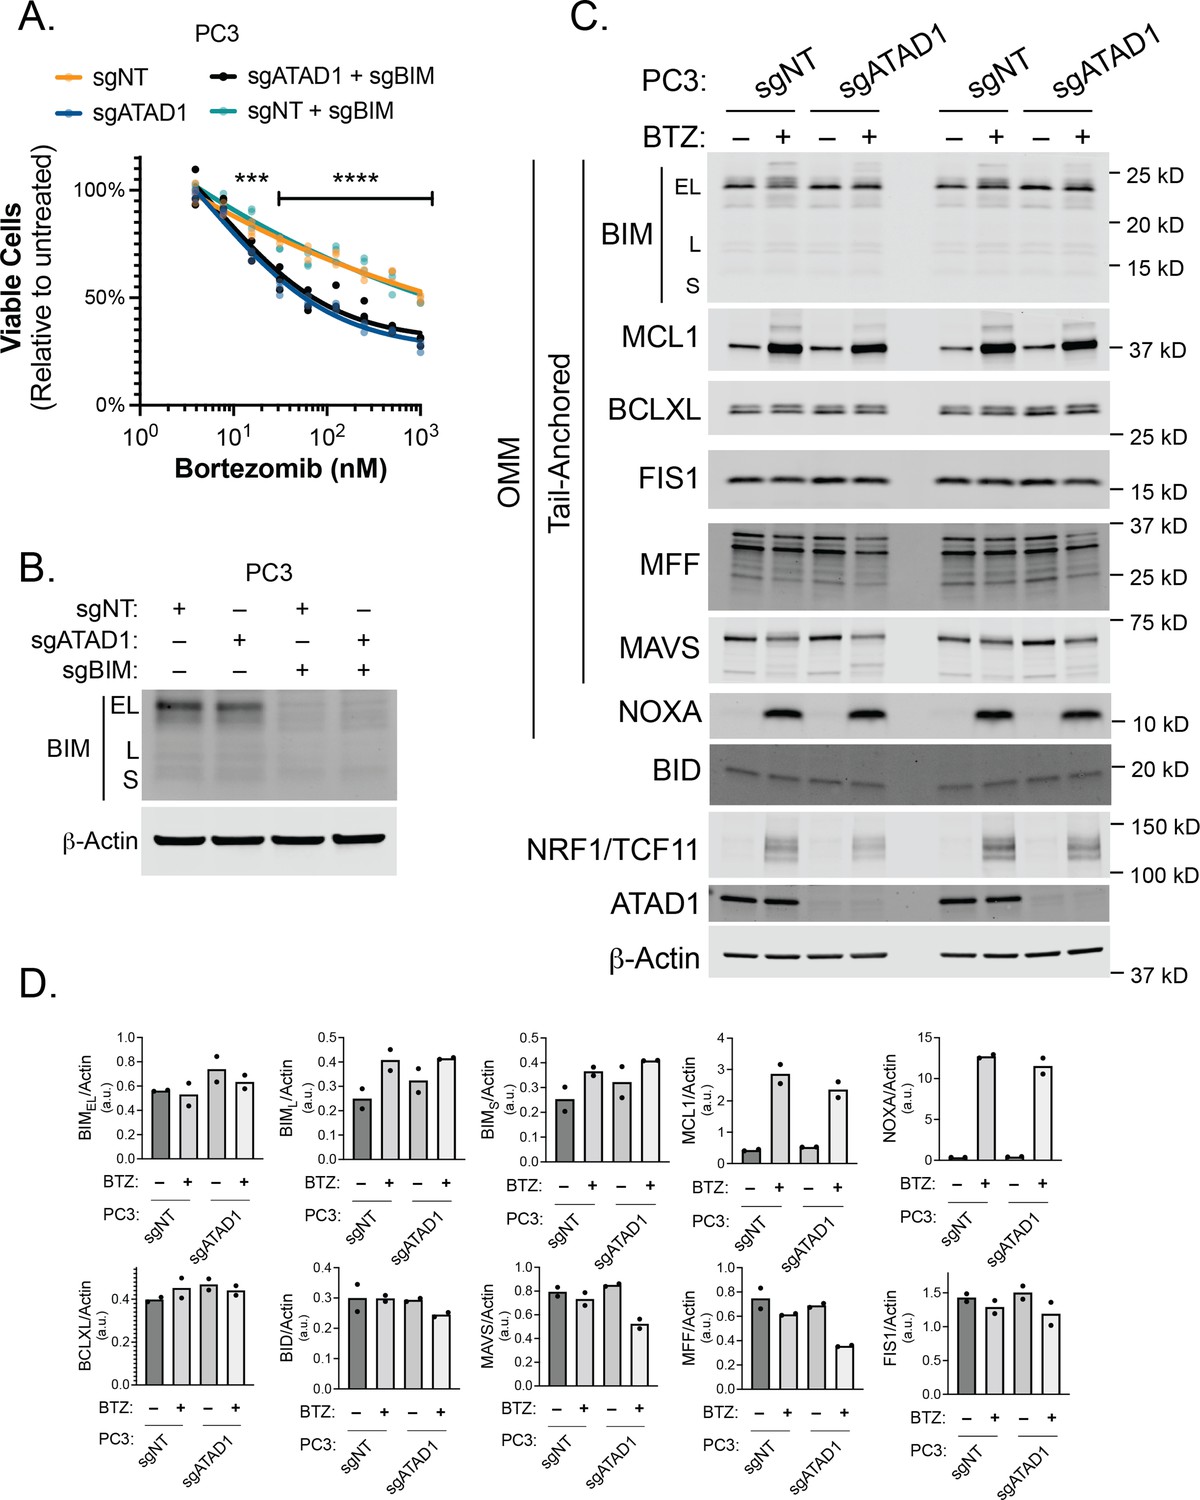
Effect of BIM knockout in PC3 cells treated with bortezomib (BTZ).
(A) Viability of PC3 cells transduced with lentiCRISPRv2-GFP+sgNT/sgATAD1 with or without lentiCRISPRv2-Puro sgBIM, treated with BTZ for 16 hr. n=3 biological replicates, 2 independent experiments. (B) Western blot of whole cell lysates from PC3 cells as described in (A) treated with BTZ (1 µM, 16 hr) and probed for BIM. (C) Western blot of whole cell lysates from PC3 cells. Cells were treated with or without 1 µM BTZ for 16 hr. n=2 independent experiments. BIK and PUMA were undetectable by western blot. (D) Quantification of blots shown in (C) normalized to beta-actin.
-
Figure 3—figure supplement 4—source data 1
Source data used to make Figure 3—figure supplement 4.
- https://cdn.elifesciences.org/articles/82860/elife-82860-fig3-figsupp4-data1-v2.zip
Figure 4 with 2 supplements
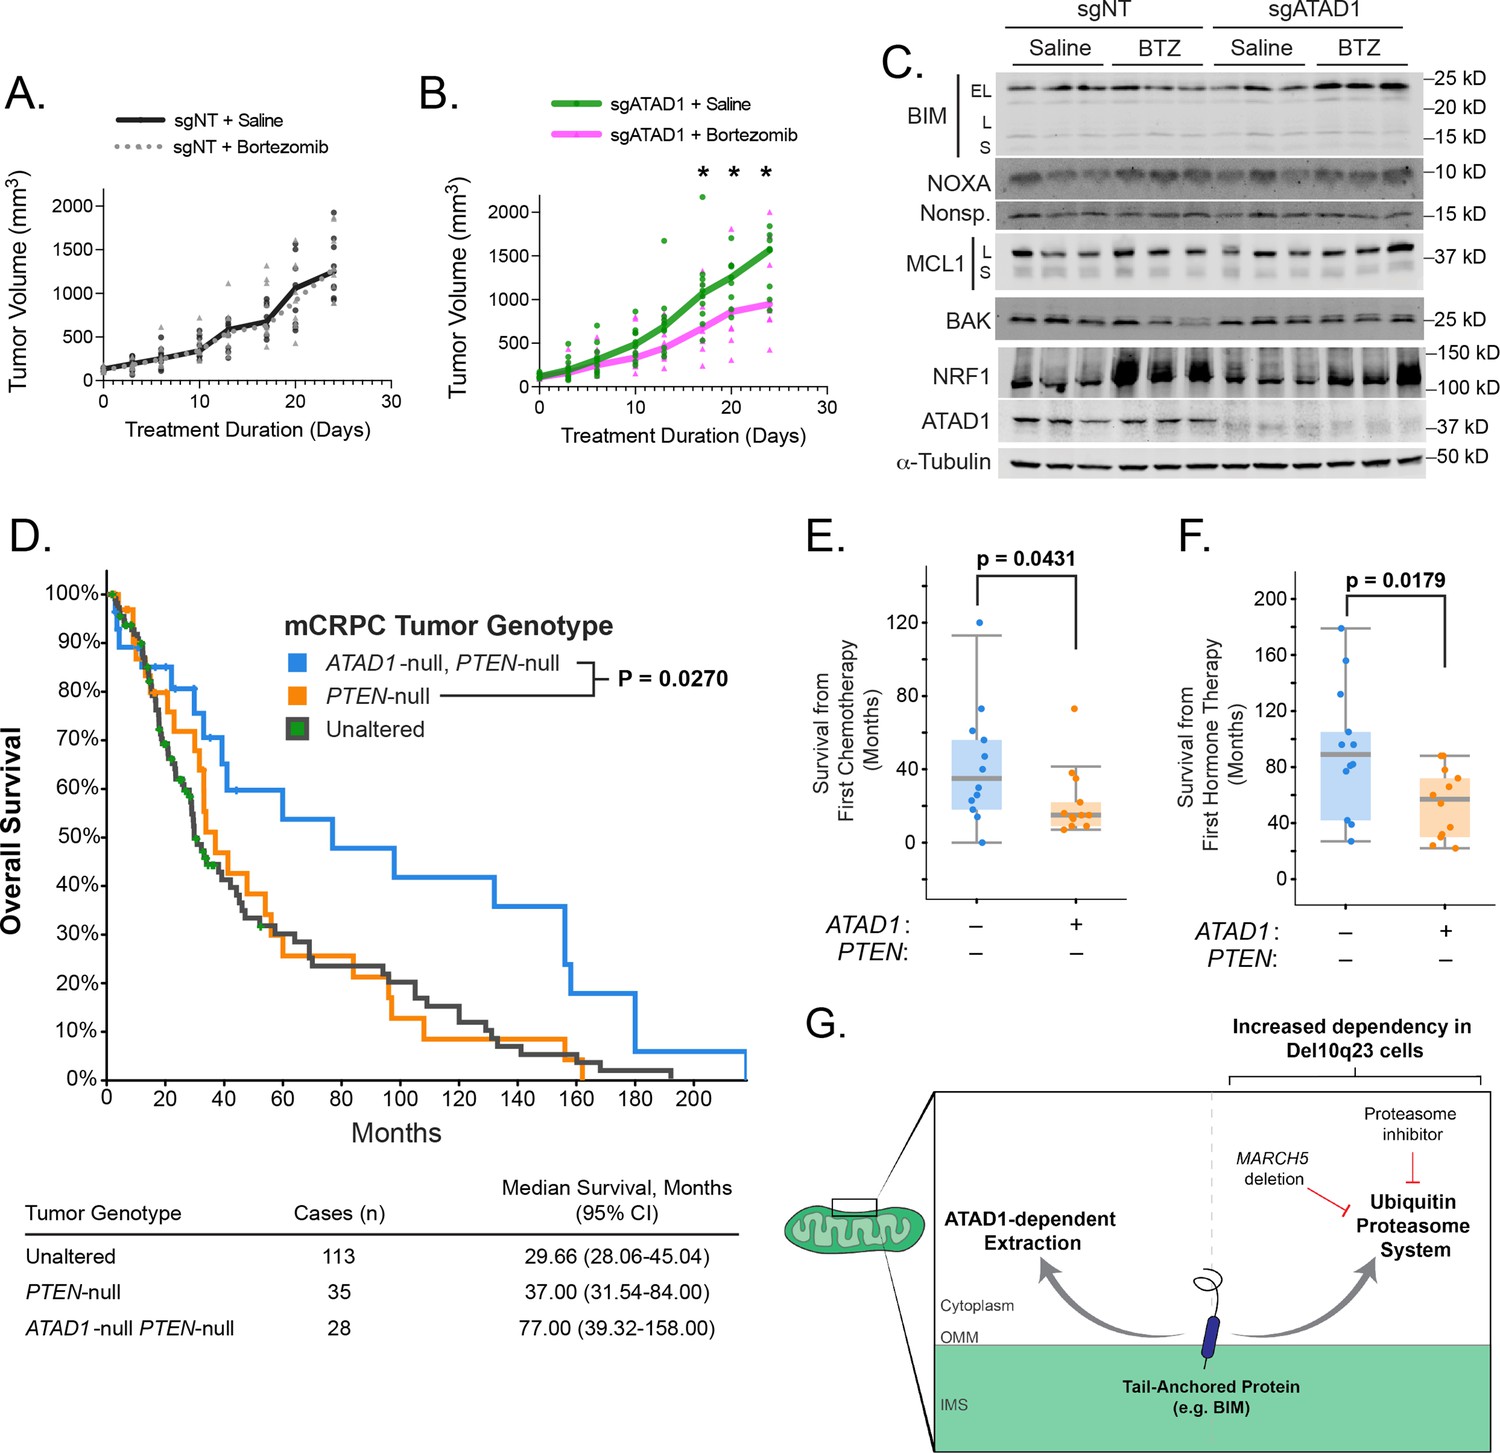
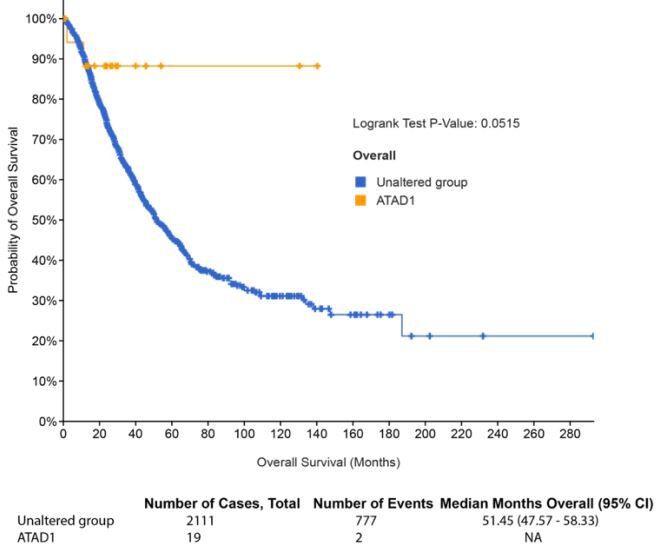
ATAD1 loss sensitizes PC3 xenografts to proteasome inhibition and predicts improved survival in patients with metastatic prostate cancer.
(A) Tumor volume over time for mice with flank xenografts of PC3 cells treated with saline (vehicle) or 1 mg/kg bortezomib (BTZ). (B) Tumor volume over time for mice with flank xenografts of ATAD1-knockout PC3 cells treated with saline (vehicle) or 1 mg/kg BTZ. (C) Western blots of whole cell lysates from tumor samples taken from animals as in (A,B) sacrificed 24 hr after receiving saline/BTZ. (D) Kaplan-Meier curve of overall survival from patients with metastatic, castrate-resistant prostate cancer (mCRPC), stratified based on tumor genotype at the ATAD1 and PTEN loci, with accompanying table below. (E) Survival (months) after initiating chemotherapy or hormone therapy (F) in patients with mCRPC, based on tumor genotype. (G) Graphical summary.
-
Figure 4—source data 1
Source data used to make Figure 4.
- https://cdn.elifesciences.org/articles/82860/elife-82860-fig4-data1-v2.zip
Figure 4—figure supplement 1
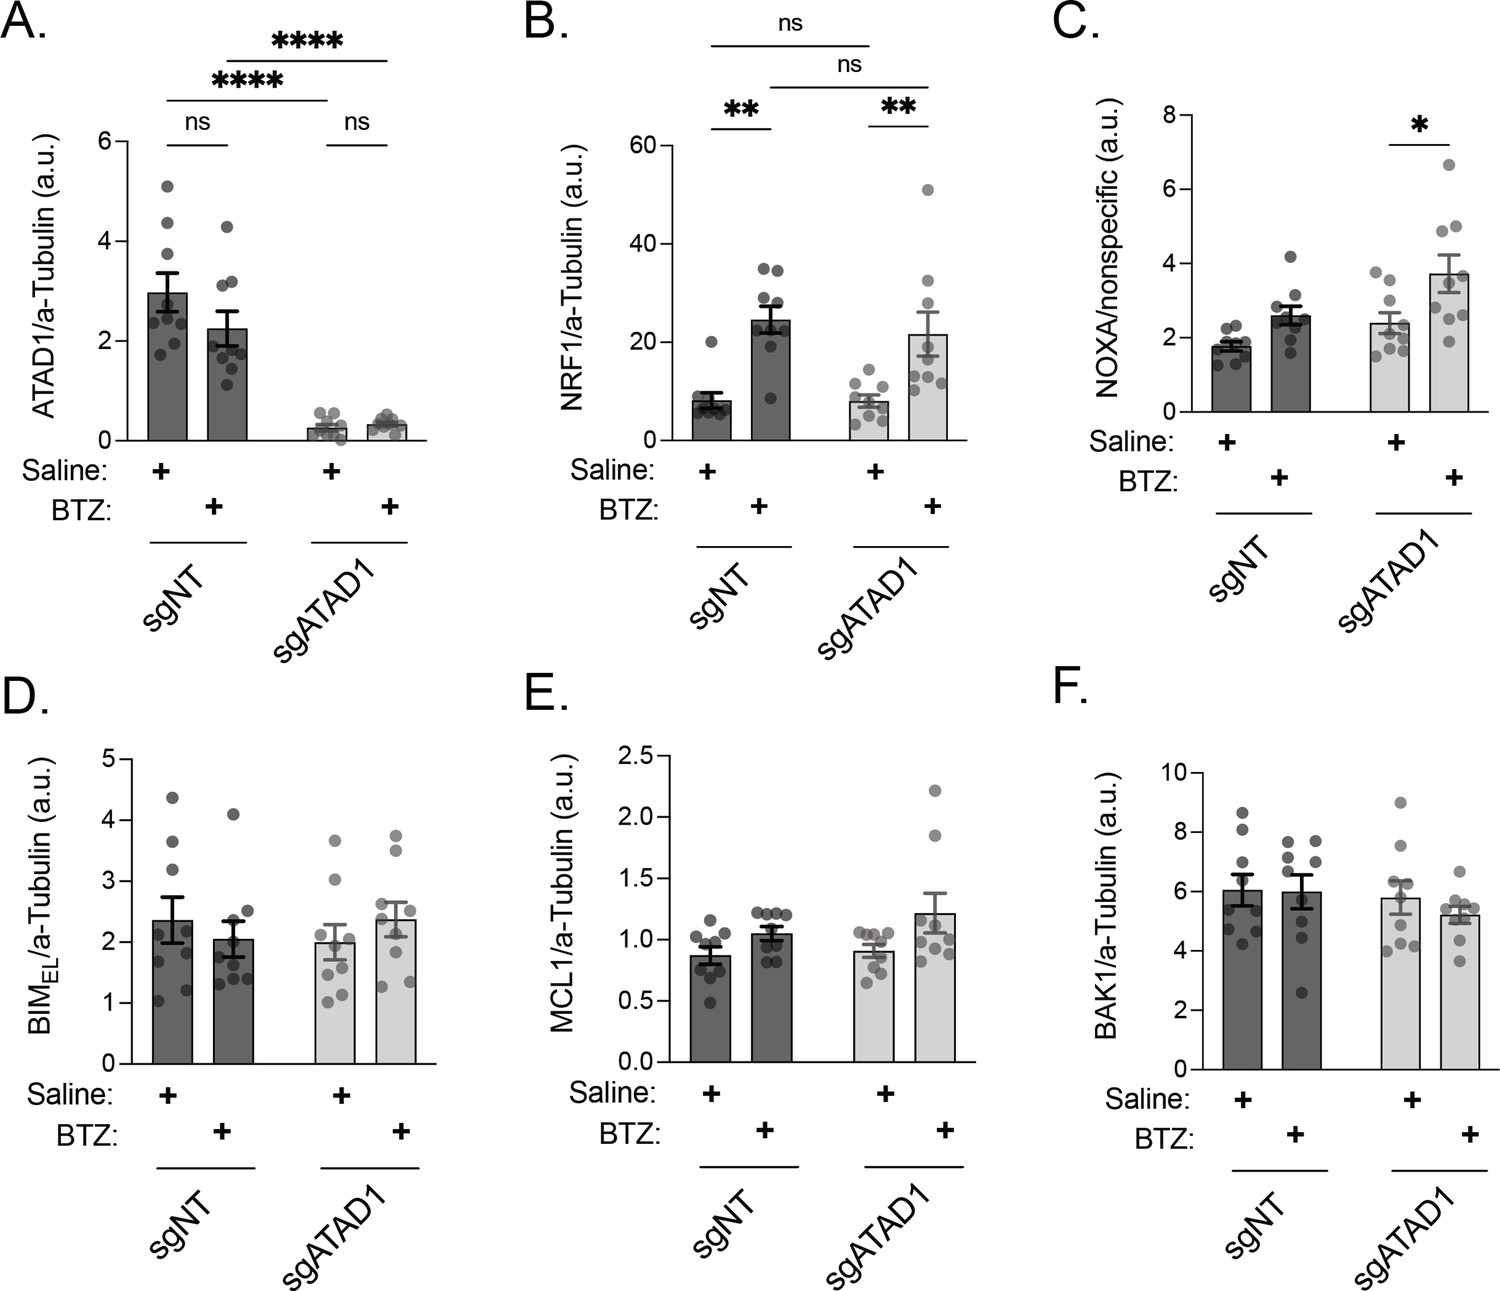
Quantification of western blots from PC3 xenograft lysates.
(A) ATAD1 normalized to alpha-tubulin; PC3 xenografts. (B) NRF1/TCF11 normalized to alpha-tubulin; PC3 xenografts. (C) NOXA normalized to nonspecific band with molecular weight of ≈15 kD; PC3 xenografts. (D) BIMEL normalized to alpha-tubulin; PC3 xenografts. (E) MCL1 normalized to alpha-tubulin; PC3 xenografts. (F) BAK normalized to alpha-tubulin; PC3 xenografts. Data were analyzed by two-way ANOVA with Tukey’s multiple comparisons test.
Figure 4—figure supplement 2
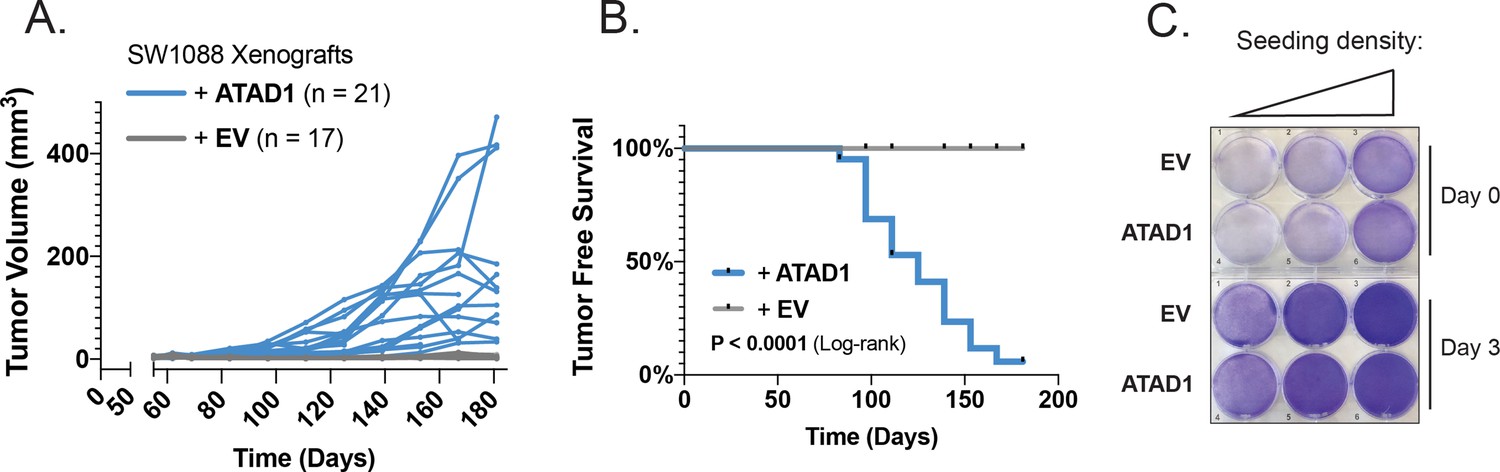
ATAD1 re-expression confers tumorigenicity to SW1088 cells.
(A) Tumor volume as a function of time for SW1088 flank xenografts; n=17 mice injected with SW1088 cells transduced with empty vector (EV); n=21 mice injected with SW1088 cells transduced with ATAD1-FLAG. (B) Tumor-free survival over time for the two groups of mice. (C) Crystal violet staining of SW1088 cells transduced with EV/ATAD1 and cultured for 3 days; representative of two independent experiments.
Author response image 1
Author response image 2
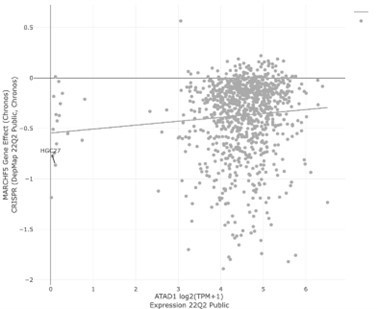
Author response image 3
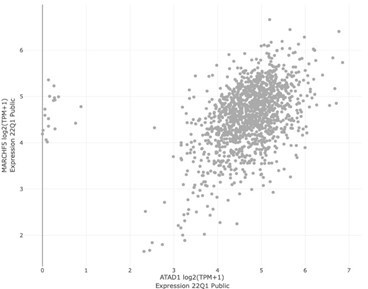
MARCH5 vs ATAD1 expression across all DepMap cell lines.
Author response image 4
Author response image 5
Author response image 6
Author response image 7
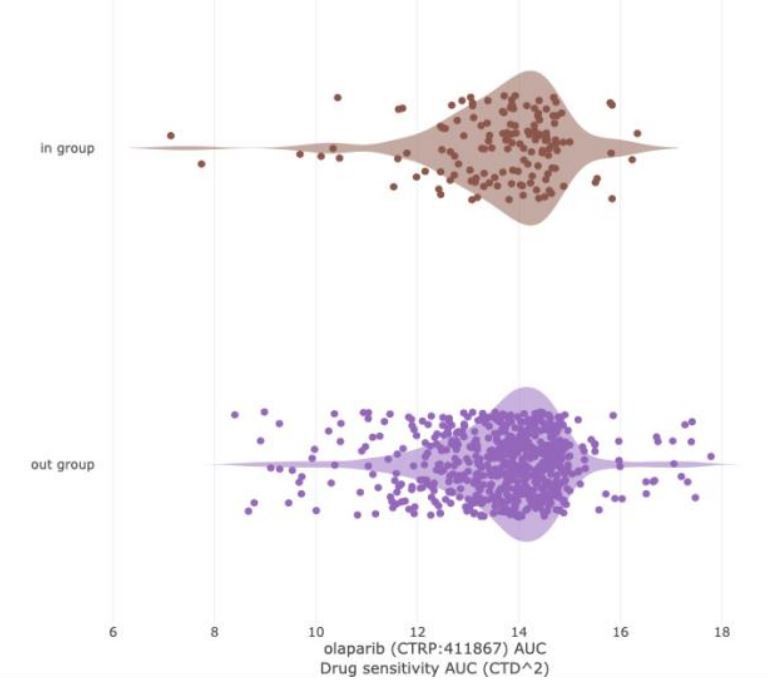
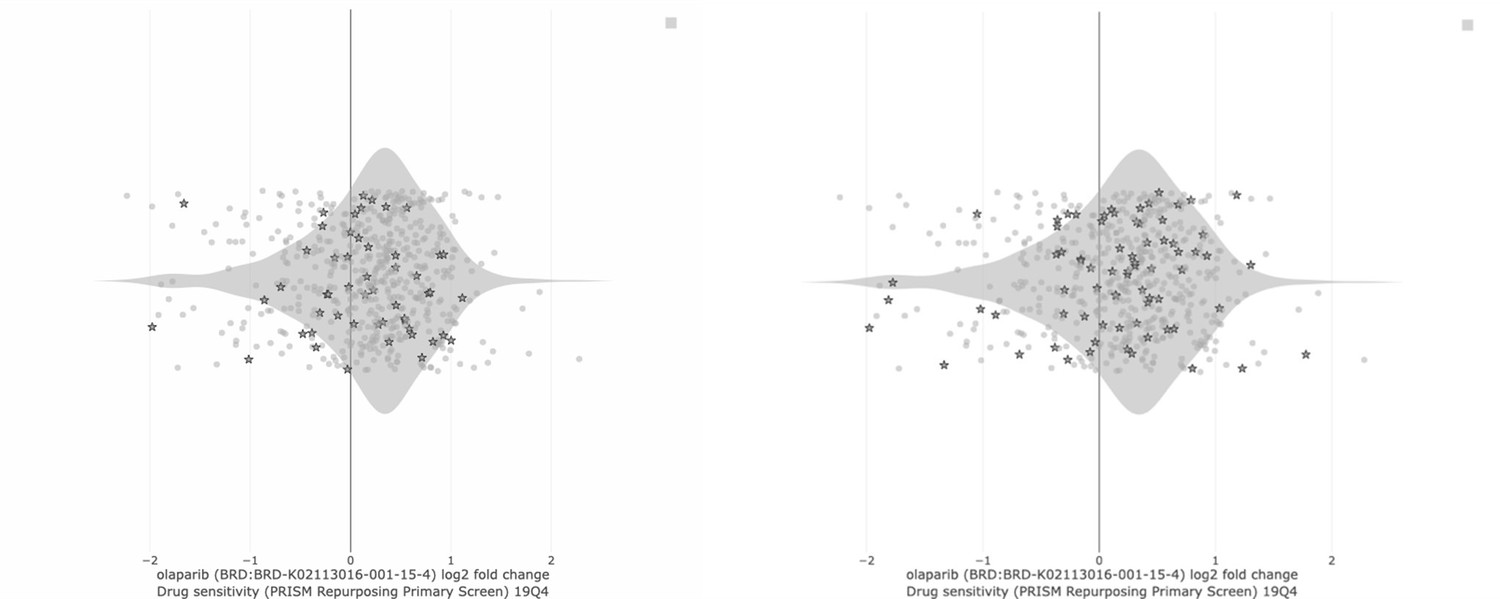
LEFT: PARP inhibitor sensitivity (Olaparib, AUC) in DepMap cell lines based on BRCA1/2 status.
“In group” consists of all DepMap cell lines harboring BRCA1 and/or BRCA2 mutation. The “out group” is all remaining cell lines. The parameter shown is sensitivity to Olaparib, as measured by area under the curve (AUC) from the CTD2 dataset. Lower values (left direction) on the x-axis indicate lower AUC and increased sensitivity. Based on extensive literature, we would expect BRCA mutant cell lines to be more sensitive than the “out group.” That is not the case (Q = 0.867; Author response table 3).
Author response image 8
Author response image 9
Author response image 10
Author response image 11
Author response image 12
Author response image 13
Tables
Appendix 1—key resources table
| Reagent type (species) or resource | Designation | Source or reference | Identifiers | Additional information |
|---|---|---|---|---|
| Cell line (human) | HEK293T cells | ATCC | #CRL-11268, RRID:CVCL_1926 | |
| Cell line (human) | Jurkat E6.1 | ATCC | TIB-152 | |
| Cell line (human) | H4 | ATCC | HTB-148 | |
| Cell line (human) | RPMI-7951 | ATCC | HTB-66 | |
| Cell line (human) | SW1088 | ATCC | HTB-12 | |
| Cell line (human) | PC3 | ATCC | CRL-1435 | |
| Cell line (human) | HGC27 | HGC27 | 94042256 | |
| Antibody | Anti-Flag Mouse mAB | Sigma-Aldrich | #F7425, RRID:AB_439687 | 1:5000 |
| Antibody | Anti-V5 Mouse mAB | Abcam | #ab9116, RRID:AB_307024 | 1:5000 |
| Antibody | Anti-GFP Rabbit mAB | Cell Signaling | #2956S | 1:5000 |
| Antibody | Anti-ATAD1 Mouse mAB | NeuroMab | 75–157 | 1:1000 |
| Antibody | Anti-PTEN Rabbit mAB | CST | #9188 | 1:1000 |
| Antibody | Anti-beta actin Rabbit mAB | CST | #4970 | 1:20,000 |
| Antibody | Anti-alpha tubulin Mouse mAB | CST | #3873 | 1:20,000 |
| Antibody | Anti-MCL1 Rabbit mAB | CST | 94296 | 1:1000 |
| Antibody | Anti-BCLXL Rabbit mAB | CST | 2764 | 1:1000 |
| Antibody | Anti-pBIM(Ser69) Rabbit mAB | CST | 4585 | 1:1000 |
| Antibody | Anti-pBIM(Ser77) Rabbit mAB | CST | 12433 | 1:1000 |
| Antibody | Anti-pBIM(Thr112) Rabbit mAB | Thermo Fisher | PA5-64655 | 1:1000 |
| Antibody | Anti-NRF1/TCF11 Rabbit mAB | CST | 8052 | 1:1000 |
| Antibody | Anti-BID Rabbit mAB | CST | 2002 | 1:1000 |
| Antibody | Anti-MAVS Rabbit mAB | CST | 24930 | 1:1000 |
| Antibody | Anti-MFF Rabbit mAB | Abcam | AB129075 | 1:1000 |
| Antibody | Anti-FIS1 Rabbit mAB | Abcam | AB156856 | 1:1000 |
| Antibody | Anti-BIM Rabbit mAB | CST | #2933 | 1:1000 |
| Antibody | Anti-BAK Rabbit mAB | CST | #12105 | 1:1000 |
| Antibody | Anti-ubiquitin Rabbit mAB | CST | #43124 | 1:1000 |
| Antibody | Anti-ubiquitin Mouse mAB | Abcam | #ab7254 | 1:1000 |
| Antibody | Anti-GAPDH Mouse mAB | CST | #97166S | 1:5000 |
| Antibody | Anti-PARP Rabbit mAB | CST | #9532 | 1:1000 |
| Antibody | Anti-Caspase 3 Rabbit mAB | CST | #14220S | 1:1000 |
| Antibody | Goat Anti-Mouse IgG (H&L) Antibody Dylight 800 Conjugated | Rockland | #610-145-002-0.5 | 1:10,000 |
| Antibody | Donkey anti-Rabbit IgG (H+L) Highly Cross-Adsorbed Secondary Antibody, Alexa Fluor 680 | Invitrogen | #A10043 | 1:10,000 |
| Antibody | Goat Anti-Mouse IgG (H+L) Antibody, Alexa Fluor 680 Conjugated | Invitrogen | #A21057, RRID:AB_141436 | 1:10,000 |
| Antibody | Donkey Anti-Rabbit IgG (H&L) Antibody Dylight 800 Conjugated | Rockland | #611-145-002-0.5, AB_11183542 | 1:10,000 |
| Antibody | Goat anti-Mouse IgG (H+L), Superclonal Recombinant Secondary Antibody, HRP | Thermo Fisher | #A28177, RRID:AB_2536163 | 1:10,000 |
| Antibody | Goat anti-Rabbit IgG (H+L), HRP | ProteinTech | RRID:AB_2722564 | 1:10,000 |
| Recombinant DNA reagent | psPAX2 | Addgene | ||
| Recombinant DNA reagent | pMD2.G | Addgene | ||
| Recombinant DNA reagent | pSpCas9(BB)–2A-GFP (PX458) | Addgene | ||
| Recombinant DNA reagent | LentiCRISPRv2GFP-sgNT | Addgene | ||
| Recombinant DNA reagent | Px458_sgATAD1_1 | This study | sgRNA targeting ATAD1 in Px458 vector; see Materials and methods | |
| Recombinant DNA reagent | Px458_sgATAD1-2 | This study | sgRNA targeting ATAD1 in Px458; see Materials and methods | |
| Recombinant DNA reagent | LRCherry2.1-sgMARCH5_10 | This study | sgRNA targeting MARCH5 in LRCherry2.1; see Materials and methods | |
| Recombinant DNA reagent | LRCherry2.1-sgPCNA | Addgene | ||
| Recombinant DNA reagent | LRCherry2.1-sgAAVS1 | Addgene | ||
| Recombinant DNA reagent | pLenti-Blast | Addgene | ||
| Recombinant DNA reagent | pQCXIP | Clontech | ||
| Recombinant DNA reagent | pQCXIP-ATAD1-FLAG/HA | Chen et al., 2014 | ||
| Recombinant DNA reagent | pQCXIP-ATAD1^E193Q-FLAG/HA | Chen et al., 2014 | ||
| Recombinant DNA reagent | pQCXIP-mito-mCherry | This study | Cox8-MTS upstream of mCherry, in PQCXIP | |
| Recombinant DNA reagent | pQCXIP-mRFP-SKL | This study | SKL amino acids fused to C-terminus of mRFP in pQCXIP | |
| Recombinant DNA reagent | pLenti-Blast-ATAD1-FLAG | This study | ATAD1 CDS with C-terminal FLAG tag cloned into pLenti-Blast | |
| Recombinant DNA reagent | pLVX-TetOne-Puro | Takara | ||
| Recombinant DNA reagent | pLVX-TetOne-Puro-GFP | This study | GFP CDS cloned into pLVX-TetOne-Puro | |
| Recombinant DNA reagent | pLVX-TetOne-Puro-GFP-BIMEL | This study | GFP-BIMEL fusion cloned into pLVX-TetOne-Puro | |
| Recombinant DNA reagent | pLVX-TetOne-Puro-GFP-BIMEL∆BH3 | This study | GFP-BIMEL fusion with 3 amino acids in BH3 domain mutated, cloned into pLVX-TetOne-Puro | |
| Recombinant DNA reagent | pLenti-GFP-Puro | Addgene | ||
| Recombinant DNA reagent | pLenti-Myc-MCL1 | This study | MCL1 with N-terminal Myc tag swapped with GFP in pLenti-GFP-Puro | |
| Recombinant DNA reagent | Brunello CRISPR knockout sgRNA library | Addgene | ||
| Recombinant DNA reagent | pET21: Msp1-His (S. cerevisiae) | Wohlever et al., 2017 | ||
| Recombinant DNA reagent | pET28: His-TEV-∆1–32-Msp1 (S. cerevisiae) | Wohlever et al., 2017 | ||
| Recombinant DNA reagent | pET28: His-TEV-∆1-39-ATAD1 (R. norvegicus) | This study | Wohlever Lab; see Materials and methods | |
| Recombinant DNA reagent | pET28: His-Flag-Sumo-Sec22 TMD-Opsin | Wang et al., 2010 | ||
| Recombinant DNA reagent | pET28: His-Flag-Sumo-BimL-Opsin | This study | Wohlever Lab; see Materials and methods | |
| Recombinant DNA reagent | pET28: His-Flag-Sumo-Fis1 TMD-Opsin | This study | Wohlever Lab; see Materials and methods | |
| Recombinant DNA reagent | pET28: His-Flag-Sumo-Bik-Opsin | This study | Wohlever Lab; see Materials and methods | |
| Recombinant DNA reagent | pET28: His-Flag-Sumo-Puma-Opsin | This study | Wohlever Lab; see Materials and methods | |
| Recombinant DNA reagent | pGEX6p1: GST-SGTA | Mateja et al., 2015 | ||
| Recombinant DNA reagent | pGEX6p1: GST-Calmodulin | Shao and Hegde, 2011 | ||
| Commercial assay or kit | Pierce BCA | Thermo | 23225 | |
| Commercial assay or kit | CellTiterGlo Luminescent Viability Assay | Promega | G7572 | |
| Chemical compound, drug | DDM | GoldBio | DDM25 | |
| Chemical compound, drug | Lipofectamine 3000 | Thermo Fisher | L3000008 | |
| Chemical compound, drug | Lipofectamine RNAiMAX | Invitrogen | 13778150 | |
| Chemical compound, drug | MitoTracker Red CMXRos | Invitrogen | M7512 | |
| Chemical compound, drug | LysoTracker Blue DND-22 | Invitrogen | L7525 | |
| Chemical compound, drug | MitoTracker Deep Red FM | Invitrogen | M22426 | |
| Chemical compound, drug | Crystal Violet | Sigma | C0775 | |
| Chemical compound, drug | RIPA Buffer | Cell Signaling | 9806 | |
| Chemical compound, drug | SE Cell Line 4D-Nucleofector X Kit L | Lonza | V4XC-1012 | |
| Chemical compound, drug | Adenosine Triphosphate | Acros Organics | AC10280-0100 | |
| Chemical compound, drug | Bovine liver phosphatidyl inositol | Avanti | 840042C-10mg | |
| Chemical compound, drug | Synthetic DOPS | Avanti | 840035C-10mg | |
| Chemical compound, drug | Synthetic DOGS-Ni-NTA | Avanti | 790404C-5mg | |
| Chemical compound, drug | Chicken egg phosphatidyl ethanolamine | Avanti | 840021C-25mg | |
| Chemical compound, drug | Chicken egg phosphatidyl choline | Avanti | 840051C-200mg | |
| Chemical compound, drug | Synthetic TOCL | Avanti | 710335C-25mg | |
| Chemical compound, drug | Bortezomib | EMD Millipore | 5043140001 | |
| Chemical compound, drug | Carfilzomib | Selleck Chem | S2853 | |
| Chemical compound, drug | Marizomib | Selleck Chem | S7504 | |
| Chemical compound, drug | zVAD-FMK | Sigma-Aldrich | V116 | |
| Software, algorithm | metap | Michael Dewey, 2020 | ||
| Software, algorithm | R | R Core Team | ||
| Software, algorithm | Ggplot2 | Wickham, 2009 | ||
| Other | SuperSep PhosTag precast gels, 12.5% ac | Wako/Fujifilm | 195-17991 |
Author response table 1
| Gene | Deep Deletion | Shallow Deletion | Amplification | Gain | No CNAs |
|---|---|---|---|---|---|
| PTEN | 8 | 15 | 5 | 3 | 233 |
| ATAD1 | 3 | 4 | 5 | 3 | 249 |
Author response table 2
| Jurkat Screen | HGC27 Screen | |
|---|---|---|
| Tissue of origin | Blood; T-ALL | Gastric cancer |
| Growth substrate | Suspension | Adherent |
| Media | RPMI1640 | EMEM |
| sgRNA library | Sabatini/Lander (10 sgRNA/gene) | Brunello (4 sgRNA/gene) |
| Location | Whitehead Institute | University of Utah |
| Year | 2018 | 2021 |
| CNA (Del) | CDKN2A/B, MSH2, MSH6 | |
| CNA (Amp) | TERT | MYC, AKT1 |
| Mutations | BAX, | PIK3CA, APC, JAK1 |
Author response table 3
| Olaparib sensitivity (PRISM AUC) | |||||
|---|---|---|---|---|---|
| In Group | Out Group | Effect size | P- Value | Q- Value | Number of cell lines |
| BRCA1 and/or BRCA2 mutant | All other cell lines | -0.000769 | 0.203 | 0.826 | 338 |
| Olaparib sensitivity (CTD2 AUC) | |||||
| In Group | Out Group | Effect size | P- Value | Q- Value | Number of cell lines |
| BRCA1 and/or BRCA2 mutant | All other cell lines | 0.00537 | 0.905 | 0.867 | 772 |
Author response table 4
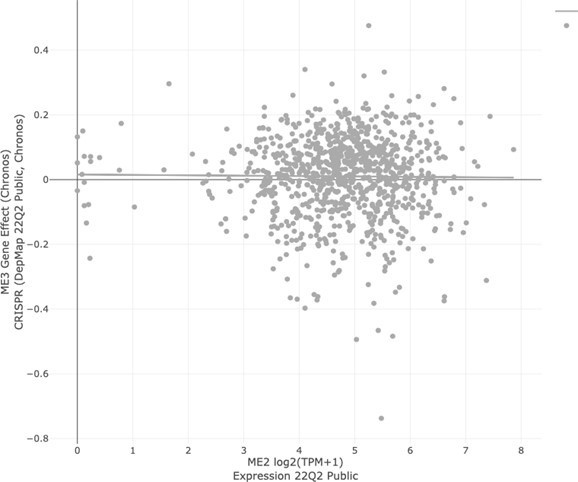
DepMap: Expression of Gene 1 vs.Dependency on Gene 2.
| Paper | Gene 1 (Deletedgene) | Gene 2 (Syntheticlethal partner) | Pearson | Spearman | P-Value | |
|---|---|---|---|---|---|---|
| Dey et al. Nature 2017 | ME2 | ME3 | -0.011 | 0 | 7.46E-01 | |
| Zhao et al., Nature 2017 | PTEN | CHD1 | 0.049 | 0.039 | 1.36E-01 | |
| Fan et al., eLife | ||||||
| 2017 | FXR2 | FXR1 | 0.022 | -0.011 | 5.07E-01 | |
| Kryukov et al., | ||||||
| Science 2016; Mavrakis et al., | ||||||
| Science 2016 | MTAP | PRMT5 | 0.170 | 0.162 | 1.52E-7 | |
| Muller et al., Nature | ||||||
| 2012 | ENO2 | ENO1 | 0.279 | 0.296 | 2.27E-18 | |
| BRCA1 | PARP1 | 0.151 | 0.159 | 3.14E-06 | ||
| BRCA2 | PARP1 | 0.096 | 0.090 | 3.12E-03 | ||
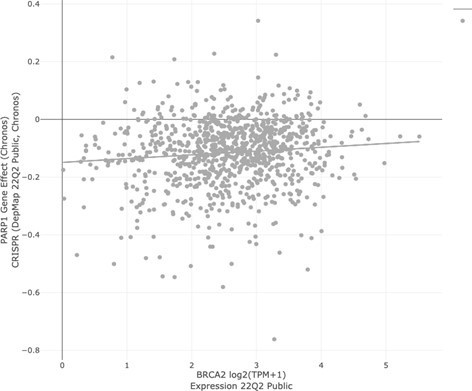
| Winter et al. | ATAD1 | MARCH5 | 0.086 | 0.116 | 8.14E-03 |
Additional files
-
MDAR checklist
- https://cdn.elifesciences.org/articles/82860/elife-82860-mdarchecklist1-v2.docx
-
Source data 1
Gene-level data from Jurkat CRISPR screen, used to make Figure 1E.
- https://cdn.elifesciences.org/articles/82860/elife-82860-data1-v2.csv
-
Source data 2
Gene-level data from HGC27 CRISPR screen, used to make Figure 1G.
- https://cdn.elifesciences.org/articles/82860/elife-82860-data2-v2.csv
-
Source data 3
Raw survival data from patient with metastatic, castrate-resistant prostate cancer (mCRPC), used to make Figure 4D.
- https://cdn.elifesciences.org/articles/82860/elife-82860-data3-v2.txt
Download links
A two-part list of links to download the article, or parts of the article, in various formats.
Downloads (link to download the article as PDF)
Open citations (links to open the citations from this article in various online reference manager services)
Cite this article (links to download the citations from this article in formats compatible with various reference manager tools)
Collateral deletion of the mitochondrial AAA+ ATPase ATAD1 sensitizes cancer cells to proteasome dysfunction
eLife 11:e82860.
https://doi.org/10.7554/eLife.82860


