Reevaluation of Piezo1 as a gut RNA sensor
- National Center for Complementary and Integrative Health, National Institutes of Health, United States
- Department of Neuroscience, Howard Hughes Medical Institute, Dorris Neuroscience Center, Scripps Research Institute, United States
Figures
Figure 1
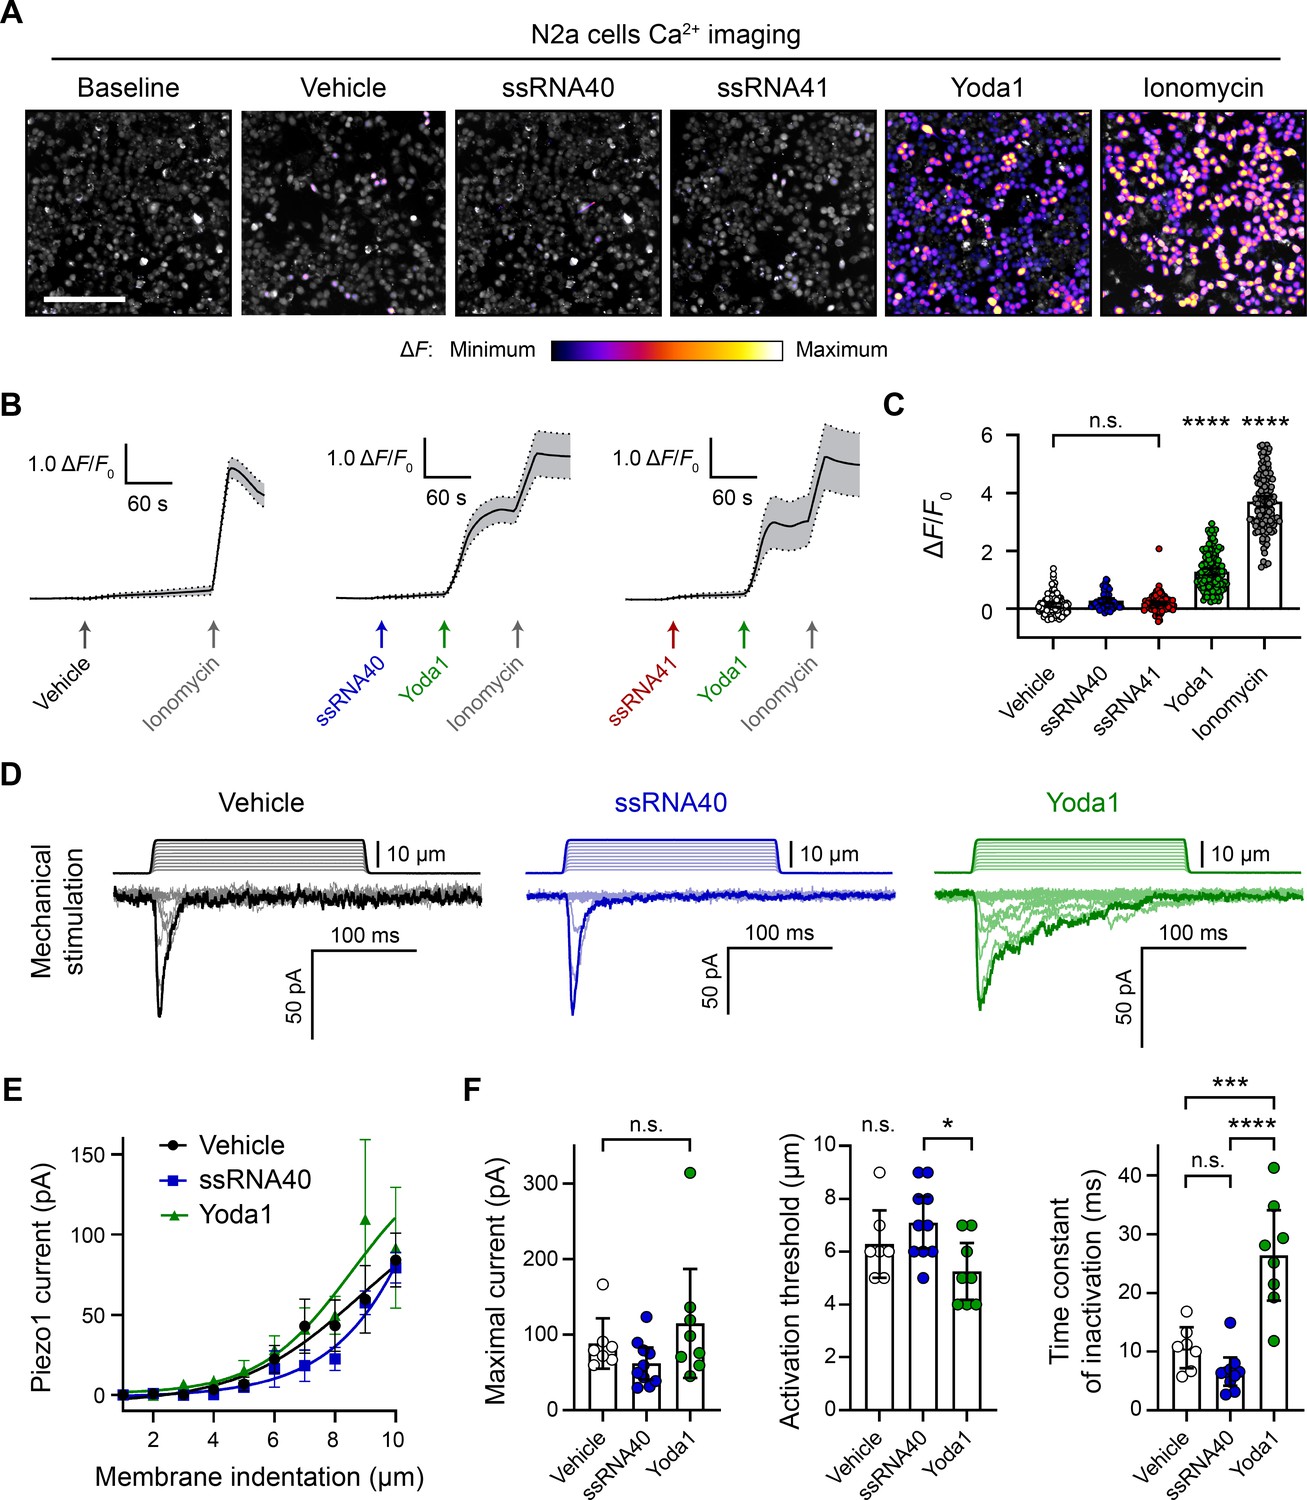
ssRNA40 does not alter calcium activity or mechanotransduction in N2a cells.
(A) Fluo-4 calcium imaging of N2a cells during exposure to different treatments, representative of ≥3 independent recordings for each condition. The magnitude of the change in fluorescence (ΔF) is represented on a fire color scale and is superimposed on a grayscale baseline fluorescence image. Cells were exposed to buffer only (vehicle) or 10 µg/mL ssRNA40 or ssRNA41 for up to 3 min, followed by 30 µM Yoda1 and 10 µM ionomycin. Scale bar is 200 µm. (B) Example calcium imaging traces of vehicle, ssRNA40, or ssRNA41, as well as Yoda1 and ionomycin control treatments. Fluorescence values are shown as ΔF normalized to the initial fluorescence (ΔF/F0). n = 50 cells plotted as mean ± 95% CI. (C) Quantification of calcium responses to different treatments. n = 50 cells per condition. Error bars indicate mean ± 95% CI. One-way ANOVA with Bonferroni correction: not significant (n.s.) p≥0.05, **** p<0.0001. (D) Example whole-cell voltage-clamp recordings of N2a cells during mechanical stimulation. Top traces indicate the magnitude of plasma membrane indentation in 1 µm steps, and bottom traces show whole-cell currents elicited by the stimuli. Vehicle, 10 µg/mL ssRNA40, or 30 µM Yoda1 were bath-applied 10 min prior to recording. (E) Piezo1 current versus membrane indentation to illustrate stimulus–response relationships. n = 7–10 cells per condition are plotted to show the mean current per level of indentation, with error bars indicating the standard error of the mean (SEM). (F) Quantification of mechanically evoked current amplitude, threshold, and inactivation. n = 7–10 cells per condition. Error bars represent mean ± 95% CI. One-way ANOVA with Bonferroni correction: n.s. p≥0.05, *p<0.05, ***p<0.001, ****p<0.0001.
Figure 2 with 1 supplement
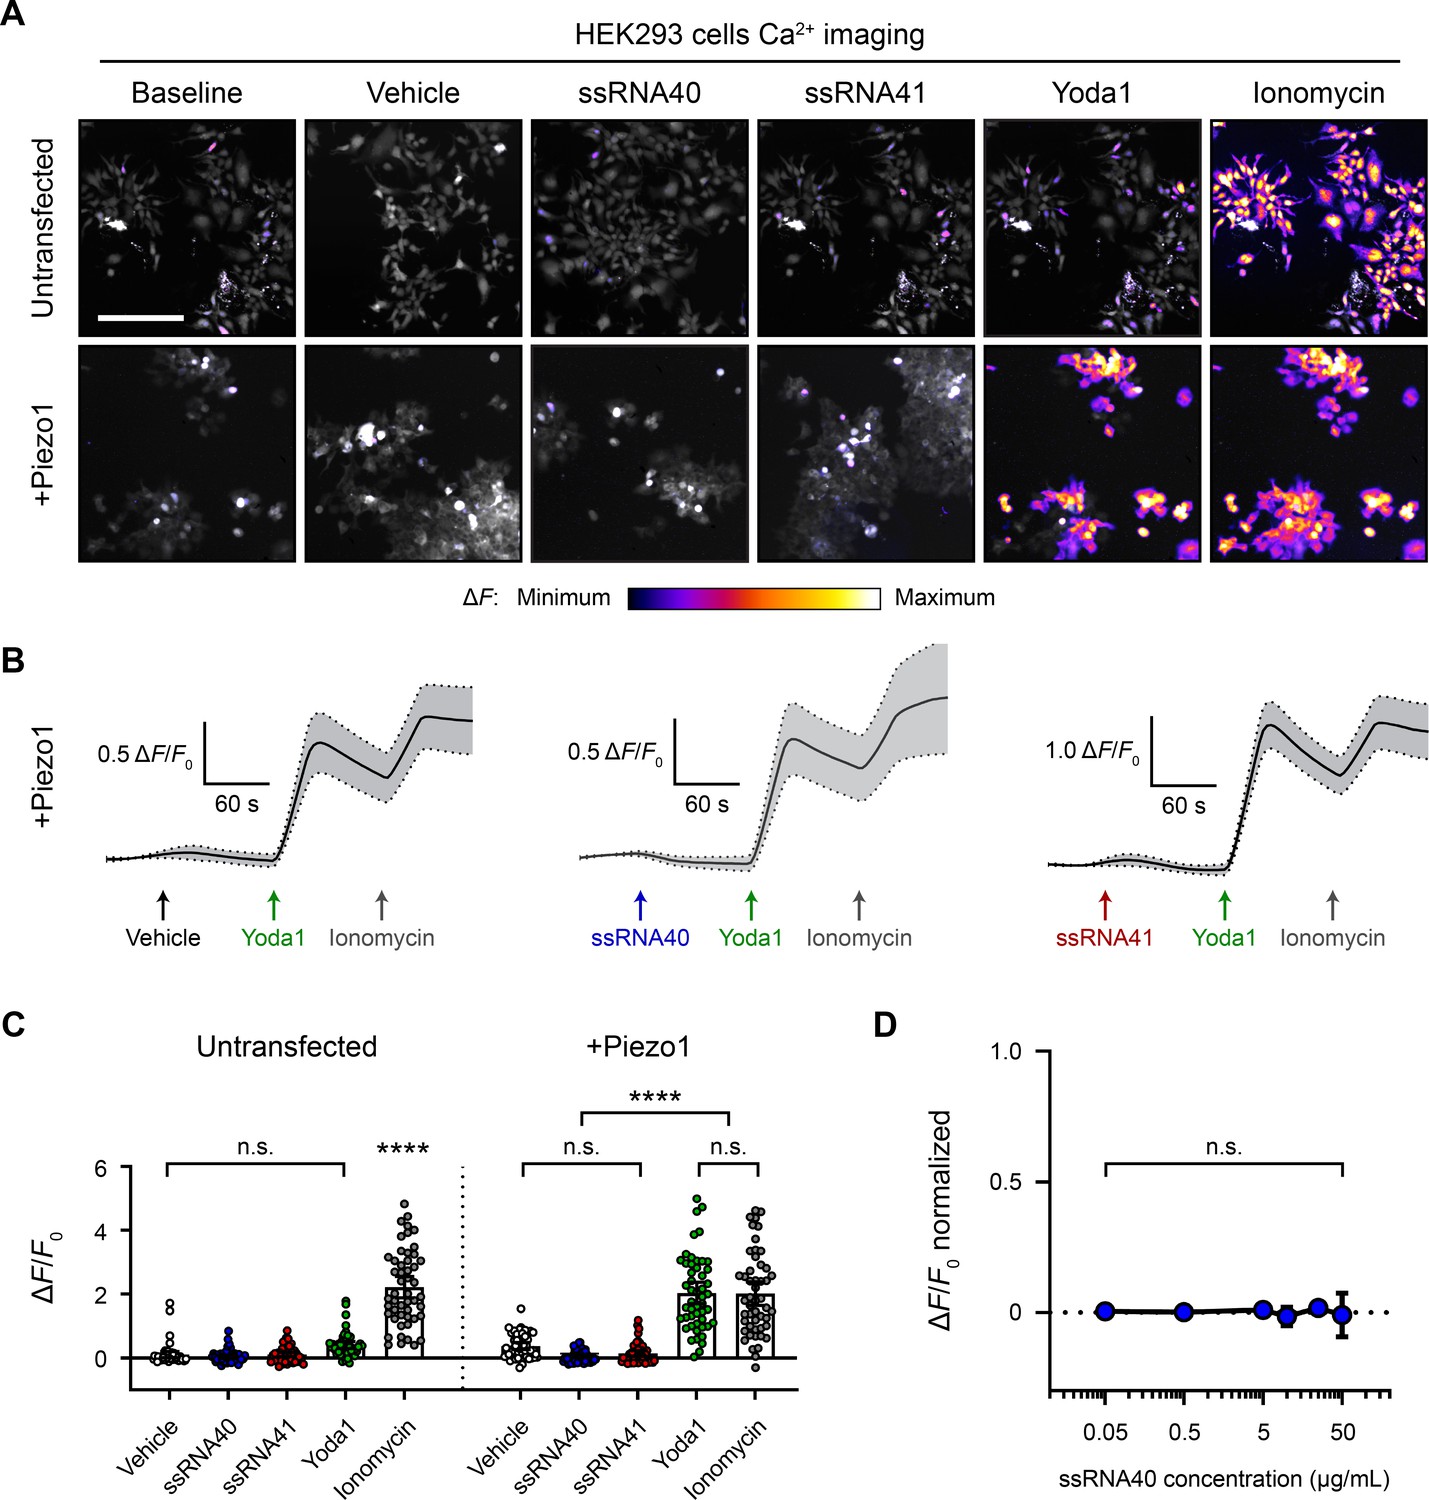
ssRNA40 does not activate Piezo1-transfected HEK293 cells.
(A) Fluo-4 calcium imaging of HEK293 cells, with or without transfection of mouse Piezo1, representative of ≥3 independent recordings for each condition. Treatment concentrations are 10 µg/mL ssRNA40 or ssRNA41, 30 µM Yoda1, and 10 µM ionomycin. Scale bar is 200 µm. (B) Example calcium imaging traces of Piezo1-transfected HEK293 cells during different treatments. Yoda1 was applied 90 s after any given RNA sample, and only cells that responded to Yoda1 (presumably Piezo1-transfected) were analyzed. Transfection efficiency was generally >60% of the cell culture. n = 50 cells plotted as mean ± 95% CI. (C) Quantification of HEK293 cell calcium responses. n = 50 cells per condition plotted as mean ± 95% CI. One-way ANOVA with Bonferroni correction: n.s. p≥0.05, ****p<0.0001. (D) Dose–response curve of ssRNA40 treatment on Piezo1-transfected GCaMP6s-expressing HEK293 cells. After 1 min of baseline measurement, ssRNA40 was administered for 3 min followed by ionomycin for 1 min. A random selection of cells was analyzed from each recording. The responses are normalized, with the ionomycin response being ΔF/F0 = 1. n = 25 cells per dose plotted as mean ± 95% CI. One-way ANOVA with Bonferroni correction: n.s. p≥0.05.
Figure 2—figure supplement 1

ssRNA40 does not activate Piezo1 or modify its response to Yoda1.
(A) Fluorescence imaging plate reader (FLIPR) assay on HEK293 Piezo1-KO cells, with or without transfection of human Piezo1. Treatment concentrations are 5 µg/mL ssRNA40 and 5 µM Yoda1. n = 4 wells per condition plotted as mean ± SEM. (B) Quantification of FLIPR calcium recordings of ssRNA40 dose–response and its effect on Yoda1 response. n = 4 wells per condition plotted as mean ± SEM. Pairwise comparisons between untransfected and transfected recordings using multiple unpaired t-tests with 5% false discovery rate: n.s. p≥0.05, ****p<0.0001.
Figure 3 with 1 supplement
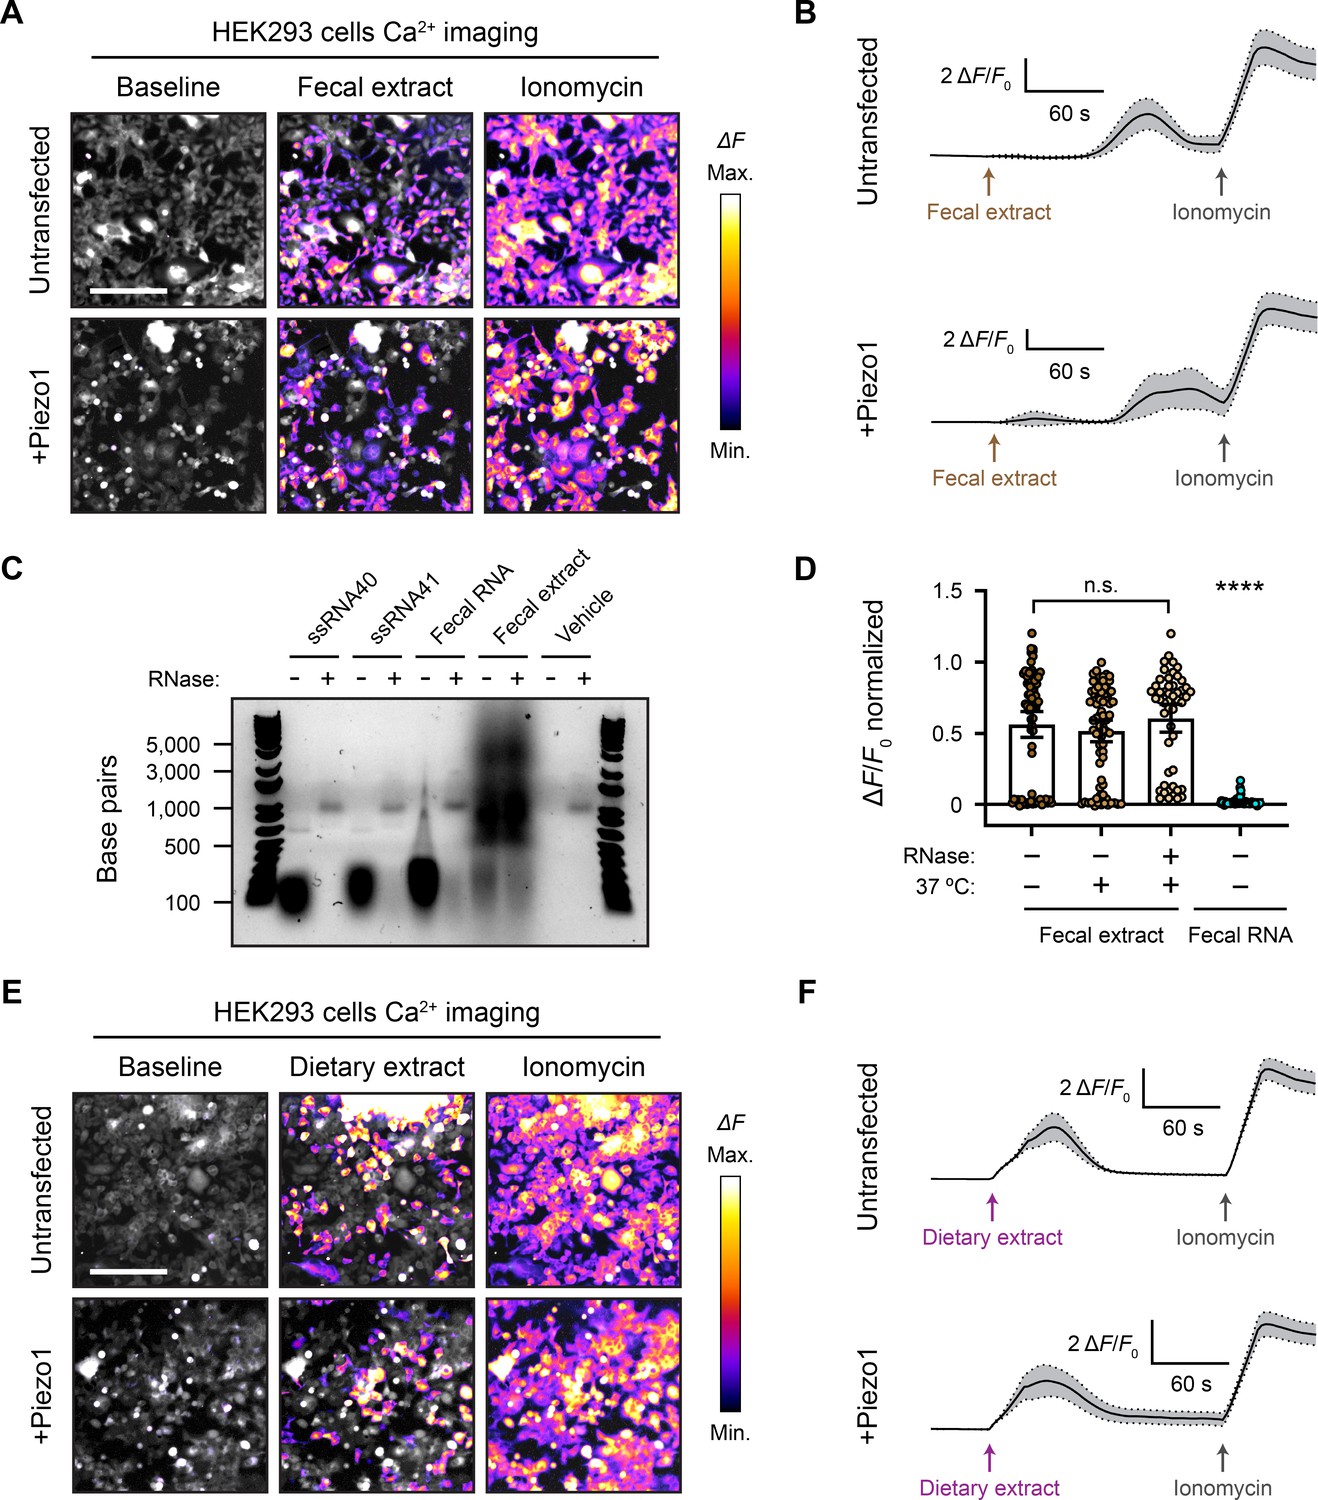
Fecal and dietary extracts activate HEK293 cells independently of Piezo1.
(A) GCaMP6s calcium imaging of HEK293 cells during exposure to 5 mg/mL fecal extract, with or without Piezo1 transfection, representative of ≥3 independent recordings for each condition. Scale bar is 200 µm. (B) Example calcium imaging traces of HEK293 cell responses to fecal extract. n = 50 cells per condition plotted as mean ± 95% CI. (C) Agarose gel showing the nucleic acid content of 50 µg/mL purified fecal RNA and 100 mg/mL crude fecal extract. 50 µg/mL of ssRNA40 and ssRNA41 were used as positive controls since they are pure RNA samples of a defined mass and sequence. Ringer’s solution was used as vehicle negative control. Treating the samples with RNase A eliminated the low-molecular-weight nucleic acid (<500 bp). The crude fecal extract additionally had a high-molecular-weight smear (500–5000 bp) that was unaffected by RNase A treatment, which is likely DNA. (D) Quantification of Piezo1-transfected HEK293 cell responses to 5 mg/mL fecal extracts that were untreated (control), heat-treated (mock), or heat + RNase A-treated (RNase), as well as 10 µg/mL fecal RNA. The ΔF/F0 values are normalized, with the ionomycin response being ΔF/F0 = 1. n = 50 cells per condition plotted as mean ± 95% CI. Kruskal–Wallis with Dunn’s multiple-comparisons test: n.s. p≥0.05, ****p<0.0001. (E) GCaMP6s calcium imaging of HEK293 cells during exposure to 5 mg/mL dietary extract, with or without Piezo1 transfection, representative of ≥2 independent recordings for each condition Scale bar is 200 µm. (F) Example calcium imaging traces of HEK293 cell responses to dietary extract. n = 50 cells per condition plotted as mean ± 95% CI.
-
Figure 3—source data 1
Original uncropped RNA gel RNA and fecal samples, untreated or RNase-treated, separated on a 1% agarose gel to examine the RNA content and effect of RNase on the samples.
- https://cdn.elifesciences.org/articles/83346/elife-83346-fig3-data1-v2.zip
Figure 3—figure supplement 1
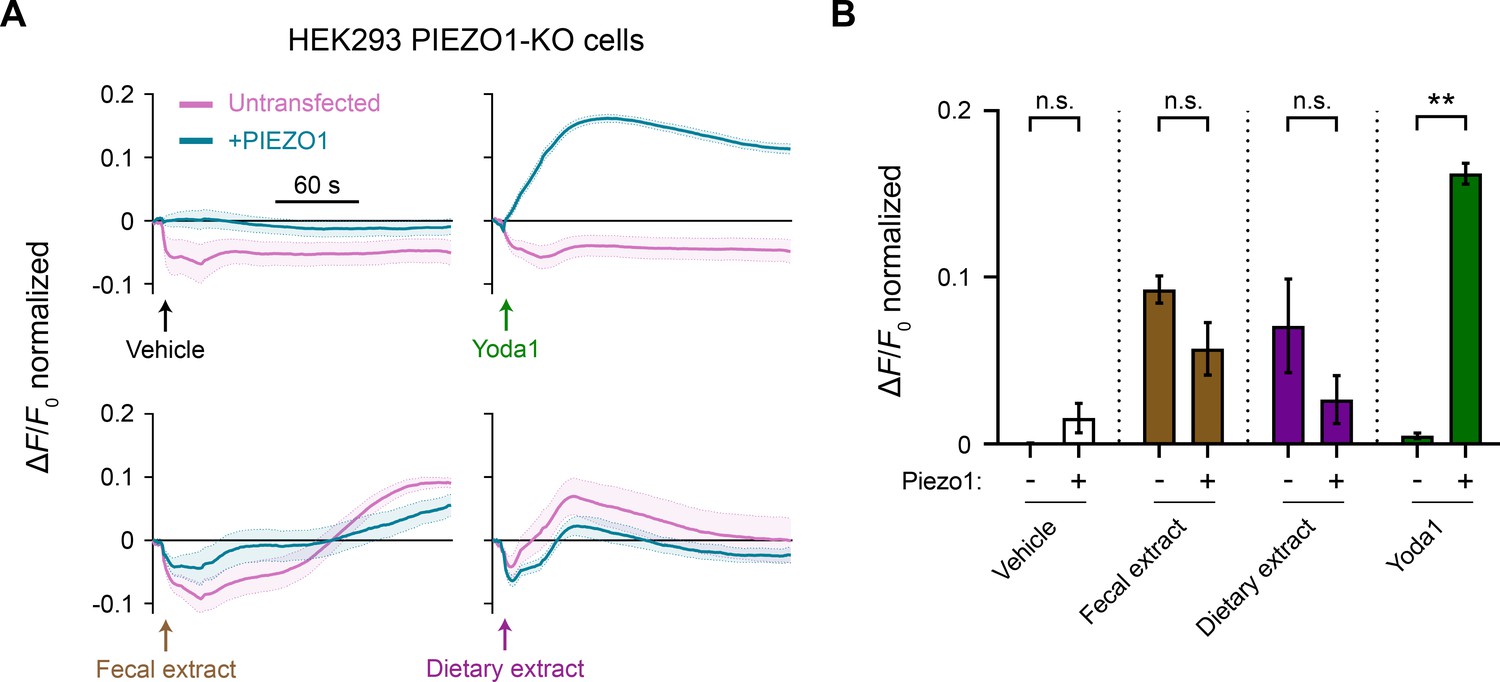
Fecal and dietary extracts activate HEK293 Piezo1-KO cells.
(A) Fluorescence imaging plate reader (FLIPR) assays on HEK293 Piezo1-KO cells, with or without transfection of human Piezo1. Each treatment condition was followed up with ionomycin to elicit maximum response for normalization (not shown). Treatment concentrations are 5 mg/mL fecal or dietary extract, 5 µM Yoda1, and 10 µM ionomycin. n = 4 wells per condition plotted as mean ± SEM. (B) Quantification of FLIPR calcium recordings for different treatments. n = 4 wells per condition plotted as mean ± SEM. Kruskal–Wallis with Dunn’s multiple-comparisons test: n.s. p≥0.05, **p<0.01.
Figure 4
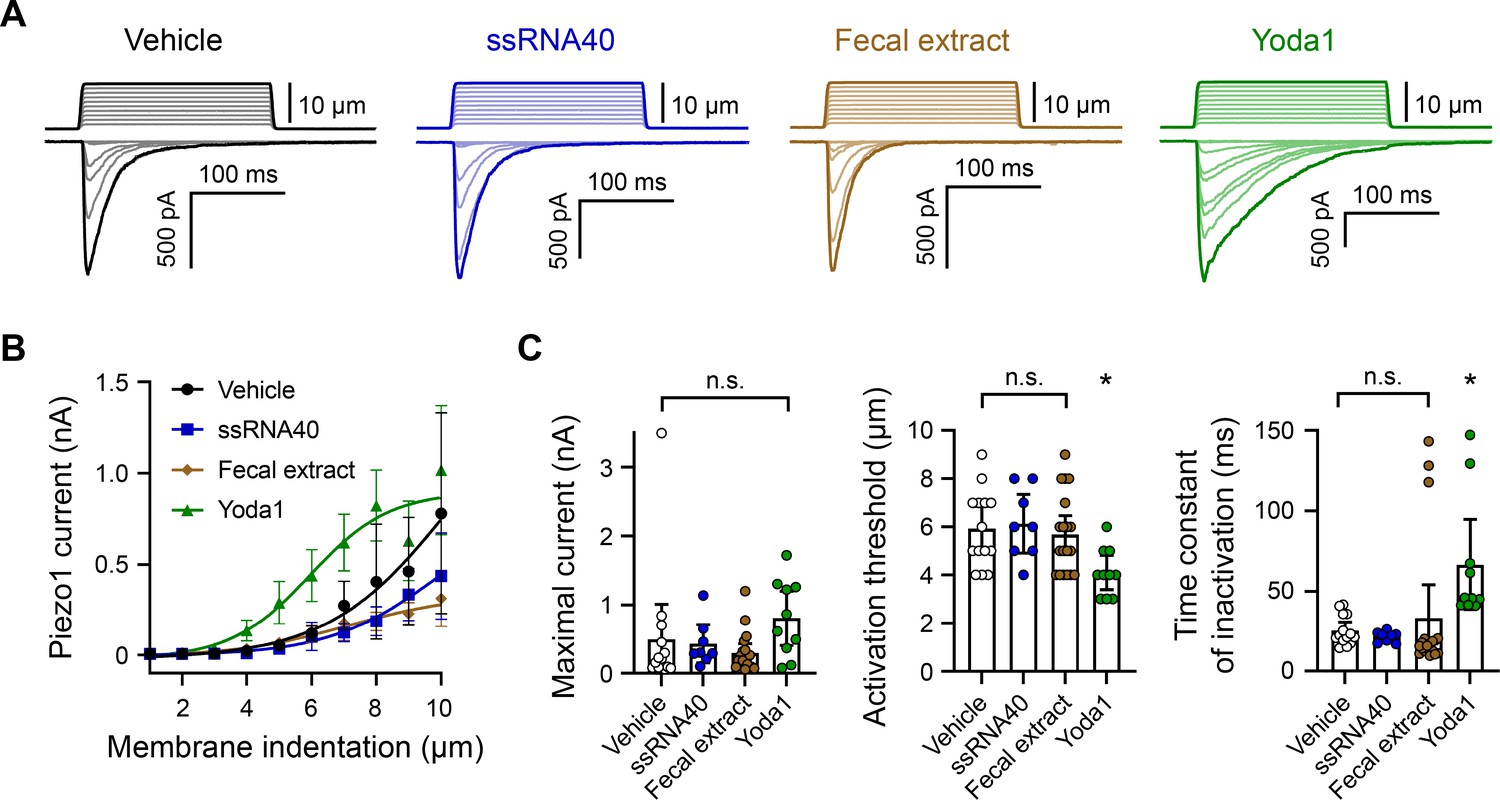
ssRNA40 and fecal extract do not modify Piezo1 mechanotransduction.
(A) Example whole-cell voltage-clamp recordings of Piezo1-transfected HEK293 cells during mechanical stimulation. Top traces indicate the magnitude of plasma membrane indentation in 1 µm steps, and bottom traces show whole-cell currents elicited by the stimuli. Vehicle, 10 µg/mL ssRNA40, 5 mg/mL fecal extract, or 30 µM Yoda1 were bath-applied 5 min prior to recording. (B) Piezo1 current versus membrane indentation demonstrates the stimulus–response relationships across conditions. n = 8–19 cells per condition are shown as mean ± SEM. (C) Quantification of mechanically evoked current amplitude, threshold, and inactivation. Individual cell responses are plotted: n = 14 vehicle, n = 8 ssRNA40, n = 19 fecal extract, and n = 10 Yoda1. Error bars represent mean ± 95% CI. One-way ANOVA with Bonferroni correction: n.s. p≥0.05, *p<0.05.
Figure 5
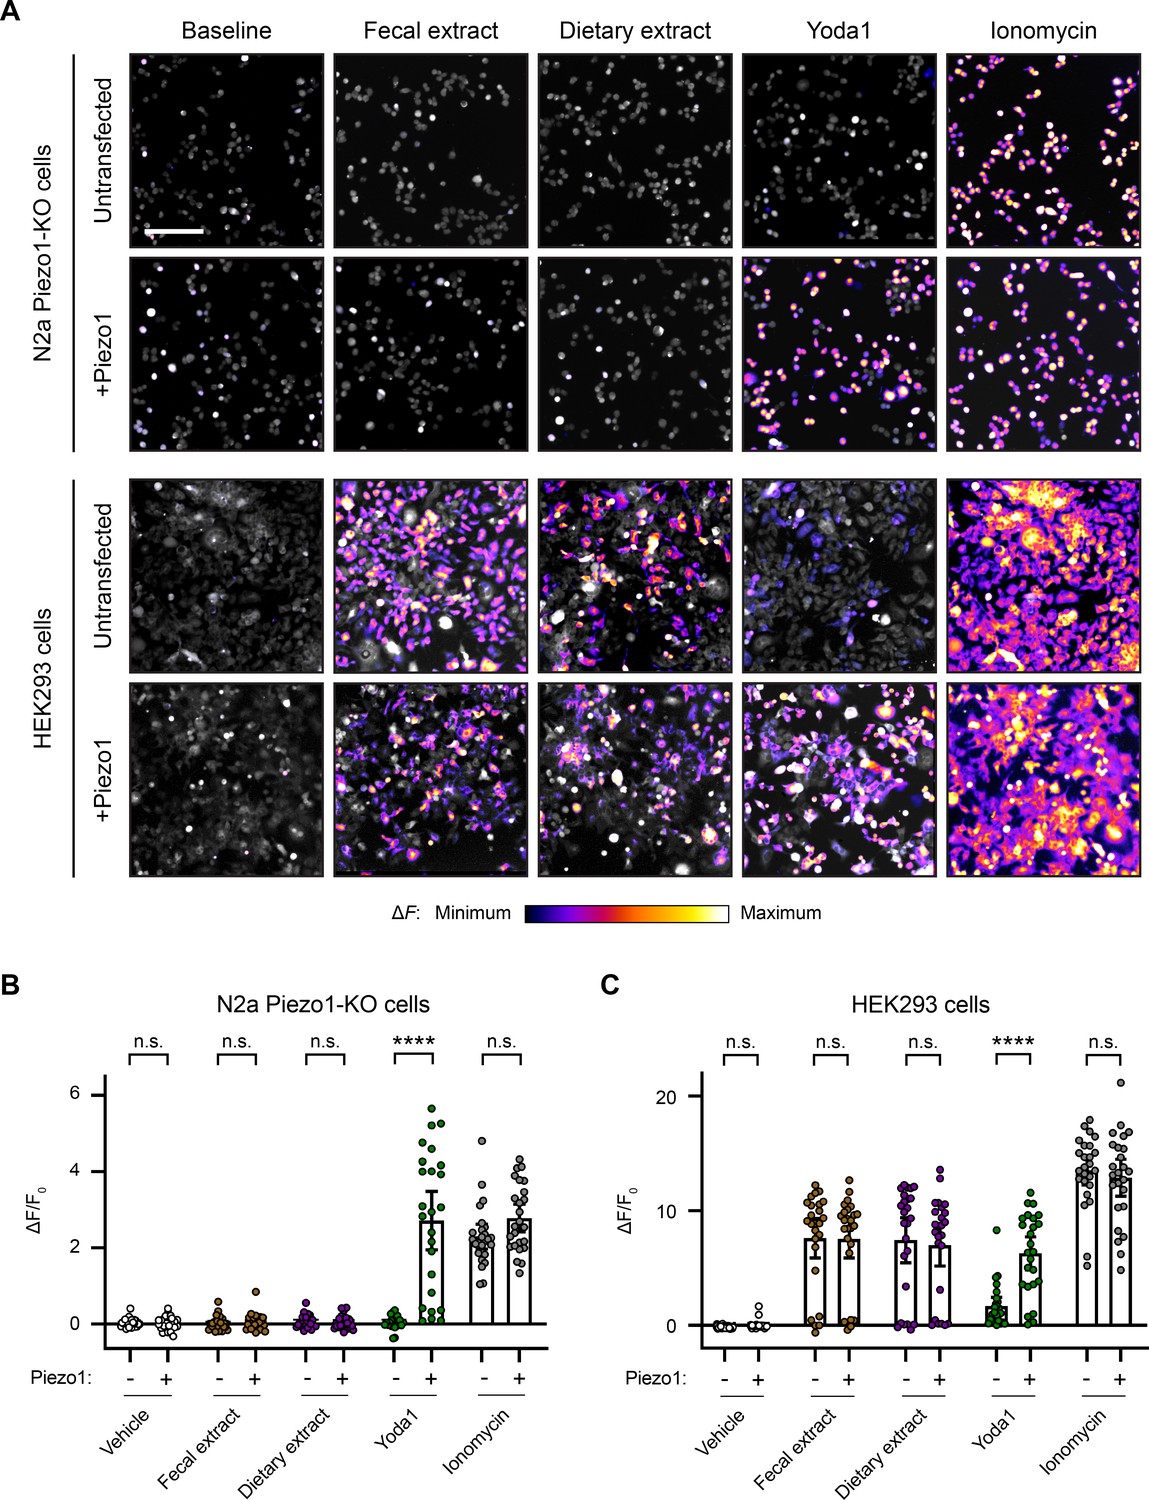
Fecal and dietary extracts induce cell line-specific activity independently of Piezo1.
(A) Calcium imaging of N2a Piezo1-KO cells and HEK293 cells, with or without Piezo1 transfection, representative of ≥2 independent recordings for each condition. Fluo-4 or GCaMP6s were used to image the N2a cells or HEK293 cells, respectively. Treatment concentrations are 5 mg/mL fecal or dietary extract, 30 µM Yoda1, or 10 µM ionomycin. Scale bar is 200 µm. (B) Quantification of calcium responses. n = 25 cells per condition plotted as mean ± 95% CI. Pairwise comparisons between untransfected and transfected recordings using Kruskal–Wallis with Dunn’s multiple-comparisons test: n.s. p≥0.05, **** p<0.0001.
Figure 6 with 1 supplement
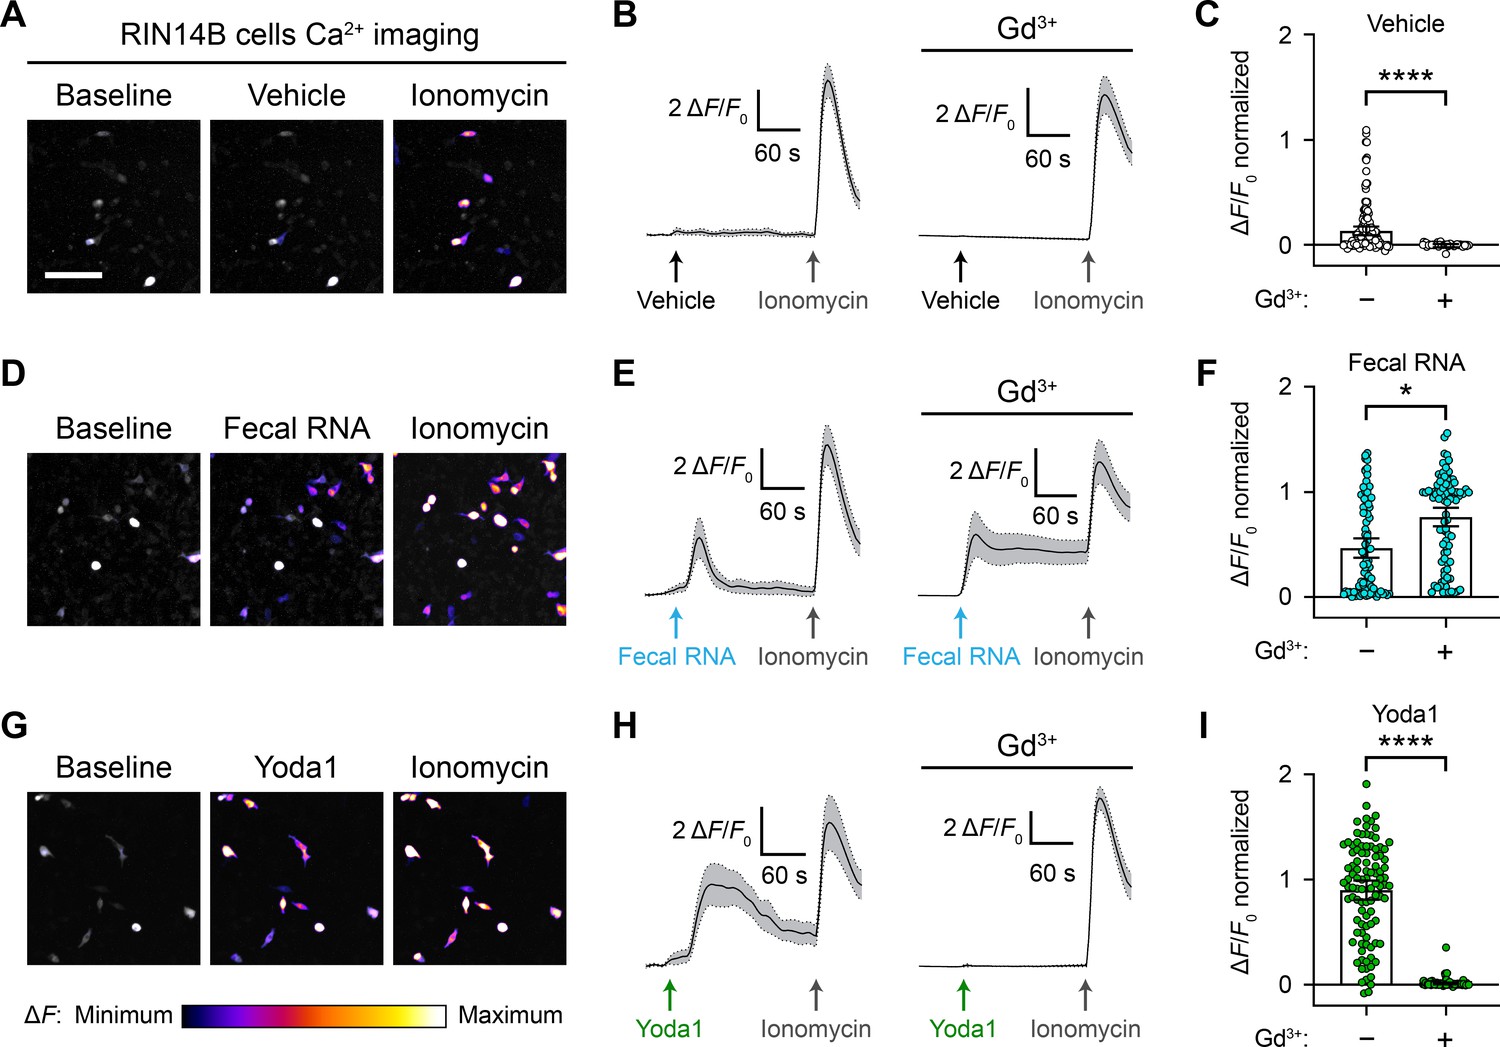
RNA activates RIN14B cells independently of Piezo1.
(A–C) Calcium imaging of RIN14B cell activity during application of negative control vehicle with and without gadolinium inhibition of Piezo1. Gadolinium visibly reduced spontaneous calcium transients. (D–F) RIN14B cell calcium influx in response to fecal RNA, with and without gadolinium. (G–I) RIN14B cell calcium influx in response to the positive control Piezo1 agonist Yoda1, which is blocked by gadolinium. The calcium imaging was performed on GCaMP6s-transfected cells. GCaMP6s calcium responses were measured during stimulation with 25 µg/mL fecal RNA, 15 µM Yoda1, and 10 µM ionomycin. To block Piezo1, 30 µM gadolinium was preincubated on the cells for 5 min and included throughout the calcium imaging recording. Line graphs represent mean ± 95% CI of a single recording each of n = 50 cells. Bar graphs represent n = 100–150 cells from ≥2 independent recordings for each condition, with fluorescence values normalized to the response to ionomycin = 1.0, and the bars indicate mean ± 95% CI. Pairwise comparisons between untreated and gadolinium (Gd3+)-treated recordings using Kruskal–Wallis with Dunn’s multiple-comparisons test: *p<0.05, ****p<0.0001. The scale bar for the microscope images is 100 µm.
Figure 6—figure supplement 1

RNA activates RIN14B cells independently of Trpa1.
(A) Calcium imaging of ssRNA40 and ssRNA41 responses in RIN14B cells loaded with Fluo-4 AM, representative of ≥3 independent recordings for each condition. Cells were stimulated with 25 µg/mL ssRNA40 or ssRNA41 and 10 µM ionomycin. The mean ΔF/F0 ± 95% CI is shown for a single recording each of n = 50 cells. (B) To block Trpa1, 10 µM A-967079 was preincubated on the cells for 5 min and included throughout the calcium imaging recording. 10 µM AITC was used as a positive control for Trpa1 activation. Bar graphs represent n = 50–200 cells from 1 to 4 independent recordings for each condition, with fluorescence values normalized to the response to ionomycin = 1.0, and the bars indicate mean ± 95% CI. Pairwise comparisons between untreated and A-967079-treated recordings using Kruskal–Wallis with Dunn’s multiple–comparisons test: n.s. p≥0.05, ****p<0.0001.
Videos
Video 1
N2a cells do not respond to ssRNA40.
5 min time-lapse recording of fluo-4 AM fluorescence in N2a cells during sequential exposure to 10 µg/mL ssRNA40, 30 µM Yoda1, and 10 µM ionomycin. 1 s of video is equivalent to 30 s of real time.
Video 2
Mechanical stimulation assay.
A HEK293 cell during simultaneous mechanical stimulation and whole-cell current recording. The patch pipette (left) is sealed onto the plasma membrane, and the mechanical probe (right) indents the cell membrane to evoke Piezo1 activity. The video depicts a single 5 µm indentation as part of a larger train of step-wise indentations from 1 to 10 µm.
Video 3
HEK293 cells respond to fecal extract.
5 min time lapse of GCaMP6s fluorescence in HEK293 cells during exposure to 5 mg/mL fecal extract and then 10 µM ionomycin. 1 s of video is equivalent to 30 s of real time.
Video 4
HEK293 cells respond to dietary extract.
5 min time lapse of GCaMP6s fluorescence in HEK293 cells during exposure to 5 mg/mL dietary extract and then 10 µM ionomycin. 1 s of video is equivalent to 30 s of real time.
Video 5
RIN14B cells respond to fecal RNA.
5 min time lapse of GCaMP6s fluorescence in RIN14B cells during exposure to 25 µg/mL fecal RNA and then 10 µM ionomycin. 1 s of video is equivalent to 30 s of real time.
Tables
Table 1
Ion channels and G protein-coupled receptors (GPCRs) in RIN14B cells.
| ‘Ion channel activity’ genes | Percent of cells expressing gene | ‘GPCR activity’ genes | Percent of cells expressing gene | |
|---|---|---|---|---|
| Asic1 | 19.5 | Adgra2 | 7.7 | |
| Asic2 | 42.7 | Adgra3 | 8 | |
| Chrna7 | 7.7 | Adgrb2 | 9.2 | |
| Clcn3 | 42.1 | Adgrb3 | 51 | |
| Gabrb3 | 16 | Adgrg1 | 16.9 | |
| Kcnd3 | 13.5 | Adgrg4 | 15.8 | |
| Kcnh2 | 8.6 | Adgrl1 | 22.1 | |
| Kcnk3 | 12.3 | Adgrl2 | 37.2 | |
| Mcub | 37.5 | Adgrl3 | 61.3 | |
| Tmem120a | 16.3 | Adgrv1 | 9.2 | |
| Trpa1 | 15.2 | Celsr2 | 9.2 | |
| Celsr3 | 10.9 | |||
| Glp1r | 56.4 | |||
| ‘Cation transmembrane transport’ genes | Percent of cells expressing gene | Gpr146 | 10.9 | |
| Gpr158 | 53.6 | |||
| Gpr176 | 9.7 | |||
| Ano10 | 10.6 | Gpr6 | 28.7 | |
| Atp13a1 | 18.6 | Gprc5b | 14.3 | |
| Atp13a3 | 30.7 | Gprc5c | 19.8 | |
| Atp1b1 | 17.2 | Grm1 | 23.5 | |
| Cnga1 | 8.9 | Lgr4 | 19.8 | |
| Grina | 10.6 | Lpar6 | 9.7 | |
| Mcoln1 | 16.9 | Oxtr | 8 | |
| Nalcn | 9.5 | Tas1r2 | 20.6 | |
| Pex5l | 63 | Tm2d1 | 22.9 | |
| Piezo1 | 9.2 | Tpra1 | 9.2 | |
| Slc29a4 | 9.2 | Vom2r44 | 9.5 | |
| Slc30a7 | 38.4 | |||
| Slc30a9 | 71.1 | |||
| Slc41a2 | 16.6 | |||
| Tmem63a | 13.2 | |||
| Tmem63b | 35.5 | |||
| Tmem63c | 36.4 | |||
| Tomm40 | 11.2 | |||
| Trpm3 | 49.3 | |||
| Trpm7 | 65.9 | |||
| Unc80 | 41.3 |
Key resources table
| Reagent type (species) or resource | Designation | Source or reference | Identifiers | Additional information |
|---|---|---|---|---|
| Strain, strain background (Mus musculus) | C57BL/6 | Jax | Strain # 000664 | Maintained in Chesler lab |
| Other (rodent chow) | Dietary extract | LabDiet | Prolab RMH 1800 5LL2 | Autoclaved in Chesler lab and used in Chesler and Patapoutian labs |
| Biological sample (rodent feces) | Fecal extract | This study | Derived from C57BL/6 mice | Freshly isolated in Chesler lab and used in Chesler and Patapoutian labs |
| Cell line (M. musculus) | Neuro-2a cells | ATCC | CCL-131 | Maintained in Chesler lab |
| Cell line (M. musculus) | Piezo1-KO Neuro-2a cells | Max Delbrück Center for Molecular Medicine; Moroni et al., 2018 | Maintained in Chesler lab | |
| Cell line (Homo sapiens) | HEK293 cells | ATCC | CRL-1573 | Maintained in Chesler lab |
| Cell line (H. sapiens) | PIEZO1-KO HEK293 cells | Scripps Research; Dubin et al., 2017 | Maintained in Patapoutian lab | |
| Cell line (H. sapiens) | GCaMP6s HEK293 cells | This study | Derived from the Flp-In T-Rex 293 cell line (Thermo Fisher, R78007) | Maintained in Chesler lab |
| Cell line (Rattus norvegicus) | RIN14B cells | ATCC | CRL-2059 | Maintained in Chesler lab |
| Recombinant DNA reagent | CMV-mPiezo1-IRES-eGFP | Addgene | 80925 | Used in Chesler lab |
| Recombinant DNA reagent | CMV-mPiezo1 | This study | Derived from pcDNA5-FRT (Thermo Fisher, V601020) | Used in Chesler lab |
| Recombinant DNA reagent | CMV-hPIEZO1 | This study | Derived in A. Patapoutian lab | Used in Patapoutian lab |
| Recombinant DNA reagent | CMV-GCaMP6s | Addgene | 40753 | Used in Chesler lab |
| Recombinant DNA reagent | pLV-CMV-GCaMP6s-PGK-Hyg | This study | Derived from pLV-CMV-PGK-Hyg (Cellomics Technology, LVR-1046) | Used in Chesler lab |
| Chemical compound, drug | ssRNA40 | Invivogen | A40-41-02 | Used in Chesler and Patapoutian labs |
| Chemical compound, drug | ssRNA41 | Invivogen | A41-41-02 | Used in Chesler lab |
| Chemical compound, drug | Yoda1 | Sigma-Aldrich | SML558-5MG | Used in Chesler and Patapoutian labs |
| Chemical compound, drug | Ionomycin | Sigma-Aldrich | I0634 | Used in Chesler lab |
| Chemical compound, drug | Gadolinium (III) chloride | Sigma-Aldrich | 439770 | Used in Chesler lab |
| Chemical compound, drug | AITC | Sigma-Aldrich | 377430 | Used in Chesler lab |
| Chemical compound, drug | A-967979 | Sigma-Aldrich | SML0085 | Used in Chesler lab |
| Chemical compound, drug | Fluo-4 AM dye | Fisher Scientific | F14201 | Used in Chesler lab |
| Chemical compound, drug | Fluo-8 AM dye | AAT Bioquest | 21080 | Used in Patapoutian lab |
Additional files
-
Transparent reporting form
- https://cdn.elifesciences.org/articles/83346/elife-83346-transrepform1-v2.pdf
-
Supplementary file 1
RIN14B single-nuclei RNA sequencing results.
A list of all gene transcripts detected in RIN14B cells and their prevalence in the cell population with a weak cutoff limit.
- https://cdn.elifesciences.org/articles/83346/elife-83346-supp1-v2.xlsx
Download links
A two-part list of links to download the article, or parts of the article, in various formats.
Downloads (link to download the article as PDF)
Open citations (links to open the citations from this article in various online reference manager services)
Cite this article (links to download the citations from this article in formats compatible with various reference manager tools)
Reevaluation of Piezo1 as a gut RNA sensor
eLife 11:e83346.
https://doi.org/10.7554/eLife.83346


