Divergent regulation of KCNQ1/E1 by targeted recruitment of protein kinase A to distinct sites on the channel complex
- Department of Molecular Pharmacology and Therapeutics, Columbia University, United States
- Department of Physiology and Cellular Biophysics, Columbia University, United States
- Doctoral Program in Neurobiology and Behavior, Columbia University, United States
Figures
Figure 1 with 1 supplement

Differential functional effects of nanoRIIα targeted to either KCNE1 or KCNQ1 on IKs.
(A) Cartoon showing targeting GFP/YFP nanobody (nano) to Q1/E1 channel complex via a YFP tag on E1. (B) Exemplar IKs traces elicited by test pulses (+60 mV, –40 mV return) reconstituted in Chinese hamster ovary (CHO) cells expressing Q1/E1-YFP+nano at 1 min (black traces) or 3 min (red traces) after break-in to whole-cell configuration. Cells were dialyzed with internal solution either lacking (left) or including (right) 0.2 mM cAMP+0.2 μM okadaic acid (cAMP/OA). (C) Diary plot of population tail-current amplitudes (mean ± SEM) vs time with cAMP/OA either lacking (black symbols, n=10) or included (red symbols, n=11) in the patch pipette solution. (D–F) Cartoon, exemplar currents and population tail-current amplitude vs time for CHO cells expressing Q1/E1-YFP+nanoRIIα. Same format as (A–C). **p<0.01, two-tailed unpaired t-test. (G) Cartoon showing nanoRIIα targeting to Q1/E1 channel complex via YFP tag on Q1. (H) Exemplar IKs traces reconstituted in CHO cells expressing Q1-YFP/E1 with either nano (left) or nanoRIIα (right). (I) Population current densities (nano, n=26; nanoRIIα, n=17). ***p<0.001, two-tailed unpaired t-test.
-
Figure 1—source data 1
Differential functional effects of nanoRIIα targeted to either KCNE1 or KCNQ1 on IKs.
- https://cdn.elifesciences.org/articles/83466/elife-83466-fig1-data1-v2.zip
Figure 1—figure supplement 1
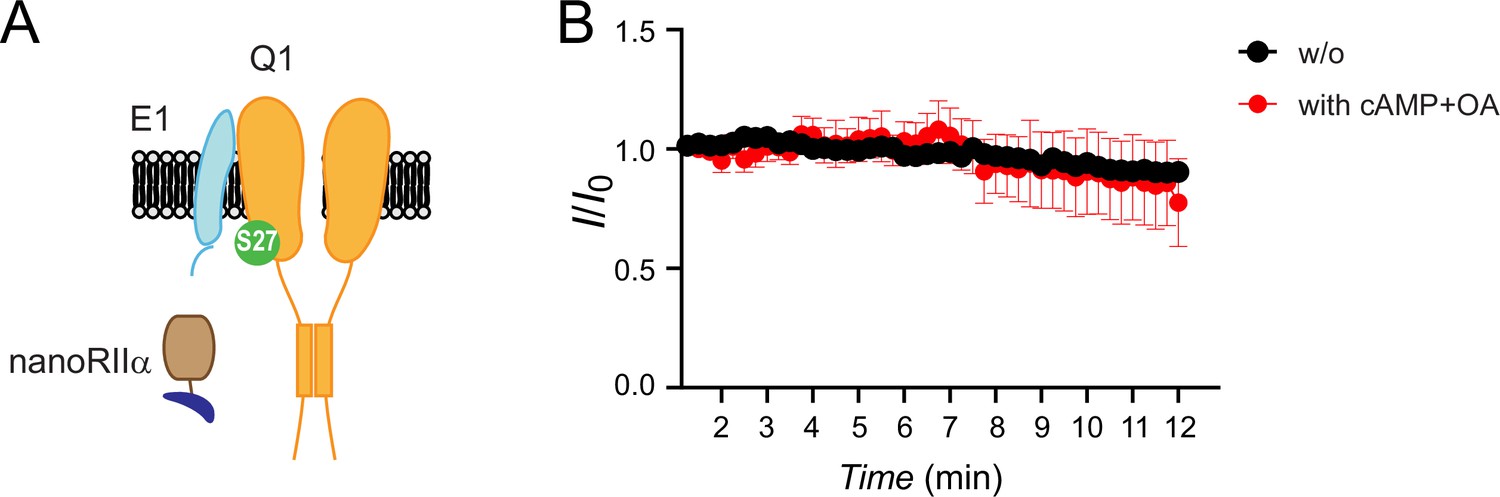
NanoRIIα does not reconstitute protein kinase A (PKA) regulation of IKs when co-expressed with untagged KCNQ1+KCNE1.
(A) Schematic showing nanoRIIα co-expressed with Q1/E1 channel complex. (B) Diary plot of population tail-current amplitudes (mean ± SEM) vs time with cAMP/OA either lacking (black symbols, n=5) or included (red symbols, n=5–9) in the patch pipette solution.
-
Figure 1—figure supplement 1—source data 1
NanoRIIα does not reconstitute protein kinase A (PKA) regulation of IKs when co-expressed with untagged KCNQ1+KCNE1.
- https://cdn.elifesciences.org/articles/83466/elife-83466-fig1-figsupp1-data1-v2.zip
Figure 2 with 2 supplements
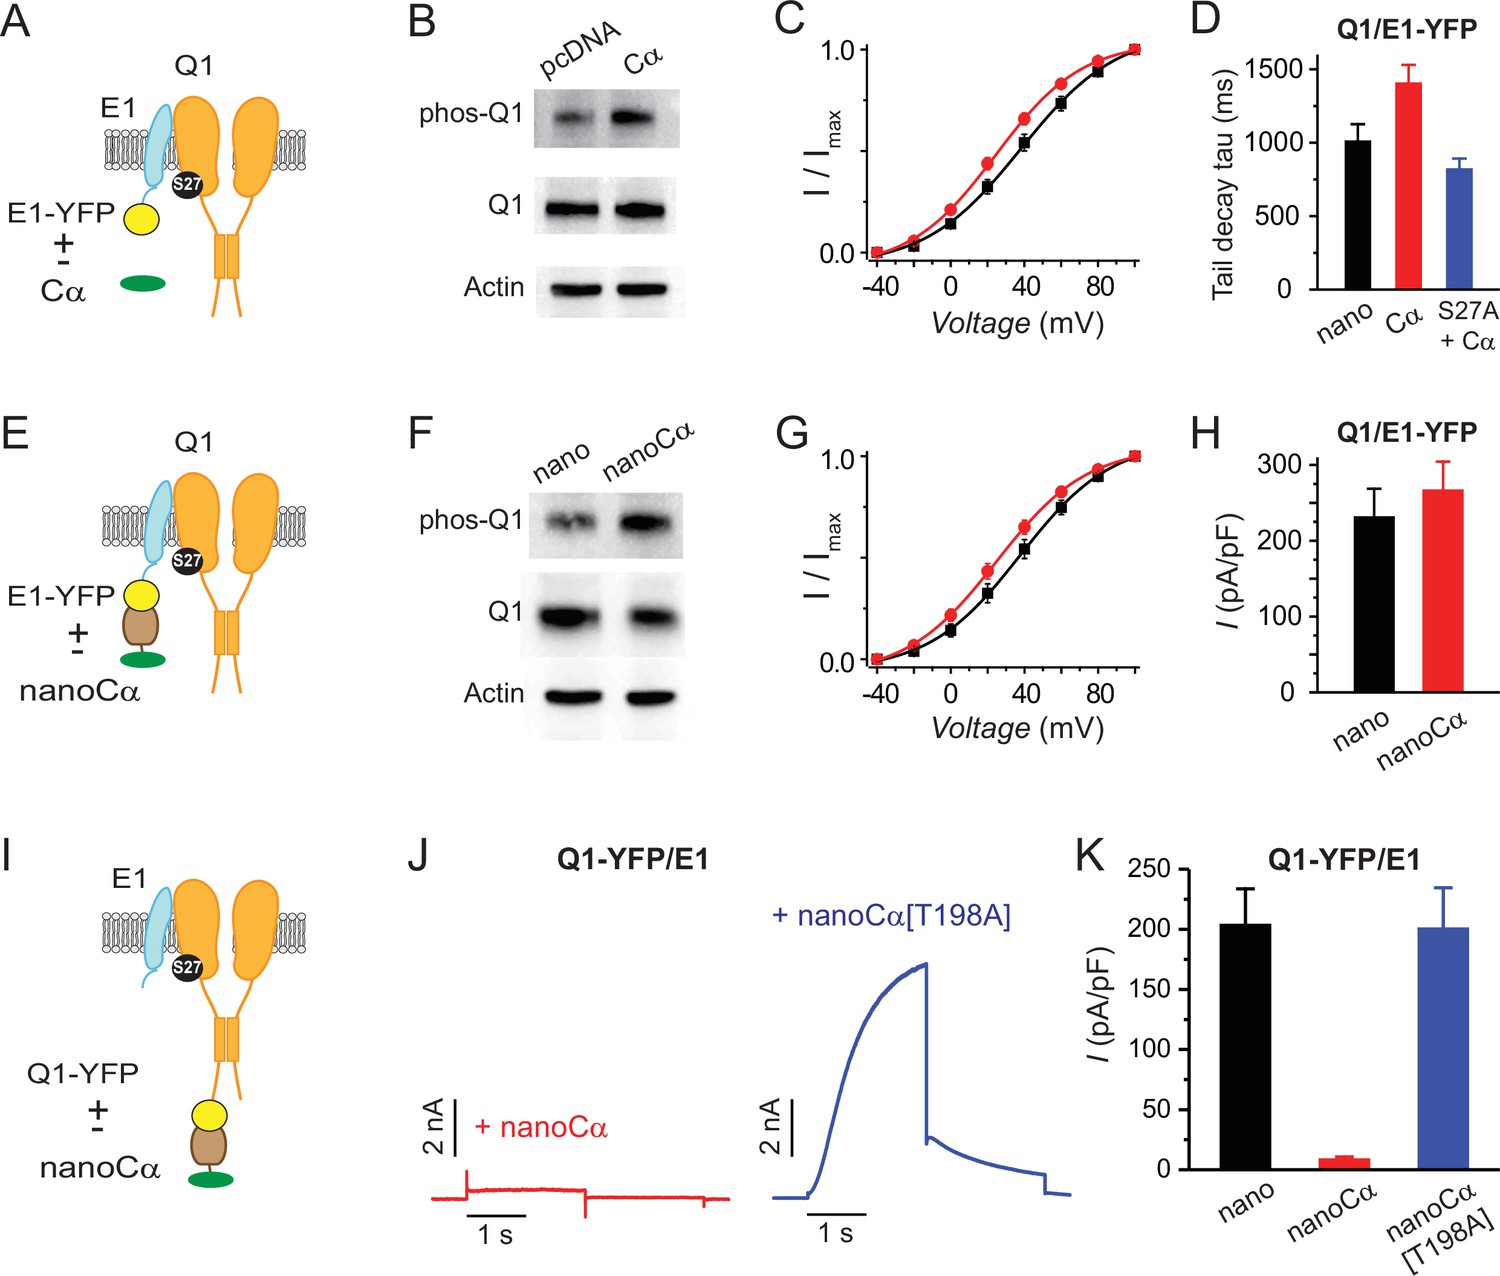
Differential functional effects of nano-Cα targeted to either Q1 or E1 on IKs.
(A) Cartoon showing Q1/E1-YFP complex co-expressed with or without free protein kinase A (PKA) Cα subunit. (B) Representative immunoblots of lysates from HEK293 cells co-expressing Q1/E1-YFP with either empty pcDNA3.1 vector or free Cα. Anti-pKCNQ1 (top) detects phosphorylated KCNQ1-S27, anti-KCNQ1 (middle) detects total KCNQ1, and anti-actin (bottom) detects total actin. N=1. (C) IKs activation curves in Chinese hamster ovary (CHO) cells co-expressing Q1, E1-YFP with either empty pcDNA3.1 vector (black symbols, n=13) or free PKA Cα (red symbols, n=13). (D) Tail-decay times for currents recorded from cells co-expressing Q1/E-YFP+yotiao and either nano or free PKA Cα, or cells co-expressing Q1[S27A]/E1-YFP+yotiao and free PKA Cα (p=0.0532, one-way ANOVA). (E–H) Cartoon, immunoblots, IKs activation curves, and population current densities of Q1/E1-YFP complex expressed with either nano (n=10) or nanoCα (n=10). (I) Cartoon showing targeting of nanoCα to Q1/E1 complex via YFP tag on Q1 C-terminus. (J) Exemplar IKs traces from CHO cells co-expressing Q1-YFP/E1 with either nanoCα (left) or catalytically inactive nanoCα [T198A] mutant (right). (K) Population current densities (nano, n=26; nanoCα, n=19; nanoCα[T198A], n=10).
-
Figure 2—source data 1
Differential functional effects of nano-Cα targeted to either Q1 or E1 on IKs.
- https://cdn.elifesciences.org/articles/83466/elife-83466-fig2-data1-v2.zip
-
Figure 2—source data 2
Differential functional effects of nano-Cα targeted to either Q1 or E1 on IKs.
- https://cdn.elifesciences.org/articles/83466/elife-83466-fig2-data2-v2.zip
Figure 2—figure supplement 1
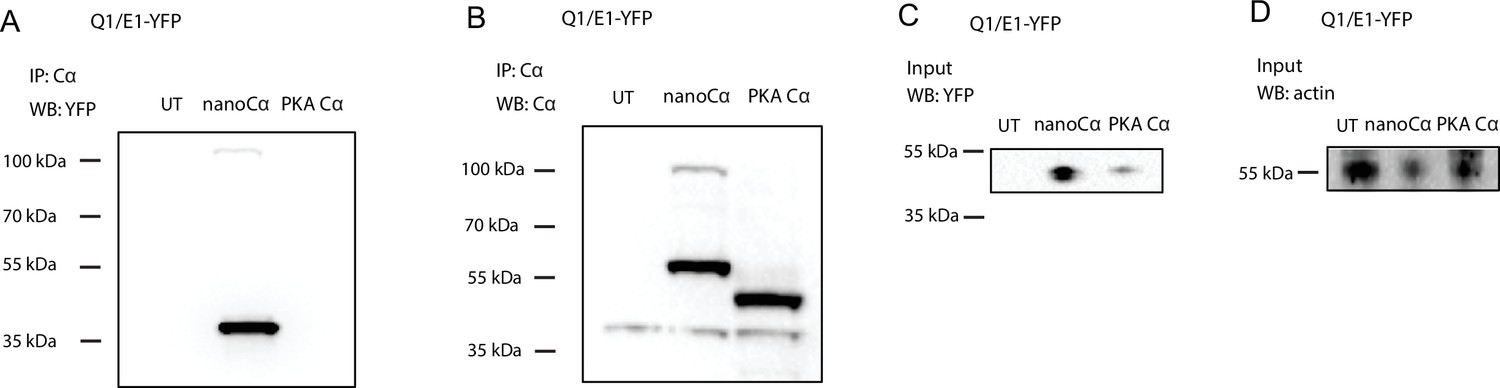
Evidence that nanoCα but not free protein kinase A (PKA) Cα is recruited to E1-YFP in the Q1/E1-YFP channel complex.
Representative immunoblots of lysates from untransfected HEK293 cells (UT) or co-expressing Q1/E1-YFP with either nanoCα or free Cα, immunoprecipitated with anti-PKA Cα and probed with (A) anti-YFP to detect E1-YFP, or (B) anti-PKA Cα to detect nanoCα and free Cα, respectively. (C) Input controls from same samples blotted with anti-YFP. (D) Anti-actin loading controls. N=2 for each blot.
-
Figure 2—figure supplement 1—source data 1
Full immunoblots of experiments showing nanoCα but not free PKA Cα is recruited to E1-YFP in the Q1/E1-YFP channel complex.
- https://cdn.elifesciences.org/articles/83466/elife-83466-fig2-figsupp1-data1-v2.zip
Figure 2—figure supplement 2
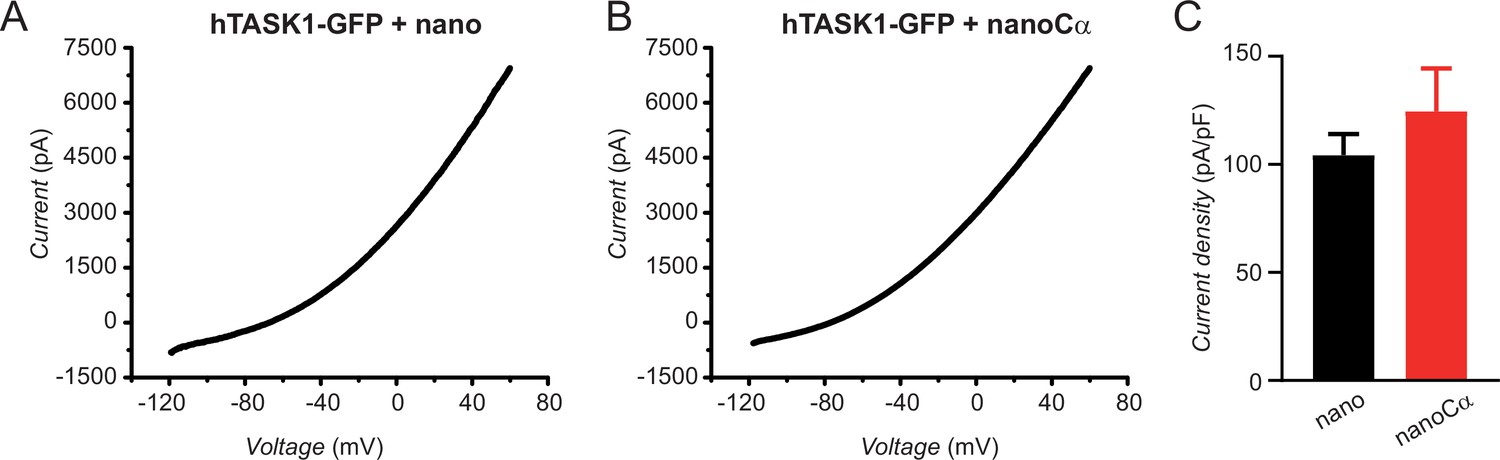
NanoCα targeted to the C-terminus of TASK1 via a GFP tag does not inhibit K+ current.
(A) Exemplar current-voltage relationship elicited by a ramp stimulus (–120 to +60 mV) in a Chinese hamster ovary (CHO) cell expressing hTASK1-GFP+nano. (B) Exemplar current-voltage relationship elicited by a ramp stimulus in a CHO cell expressing hTASK1-GFP+nanoCα. (C) Population current density at 0 mV for cells expressing hTASK1-GFP with either nano (black bar, n=7) or nanoCα (red bar, n=9).
-
Figure 2—figure supplement 2—source data 1
NanoCα targeted to the C-terminus of TASK1 via a GFP tag does not inhibit K+ current.
- https://cdn.elifesciences.org/articles/83466/elife-83466-fig2-figsupp2-data1-v2.zip
Figure 3
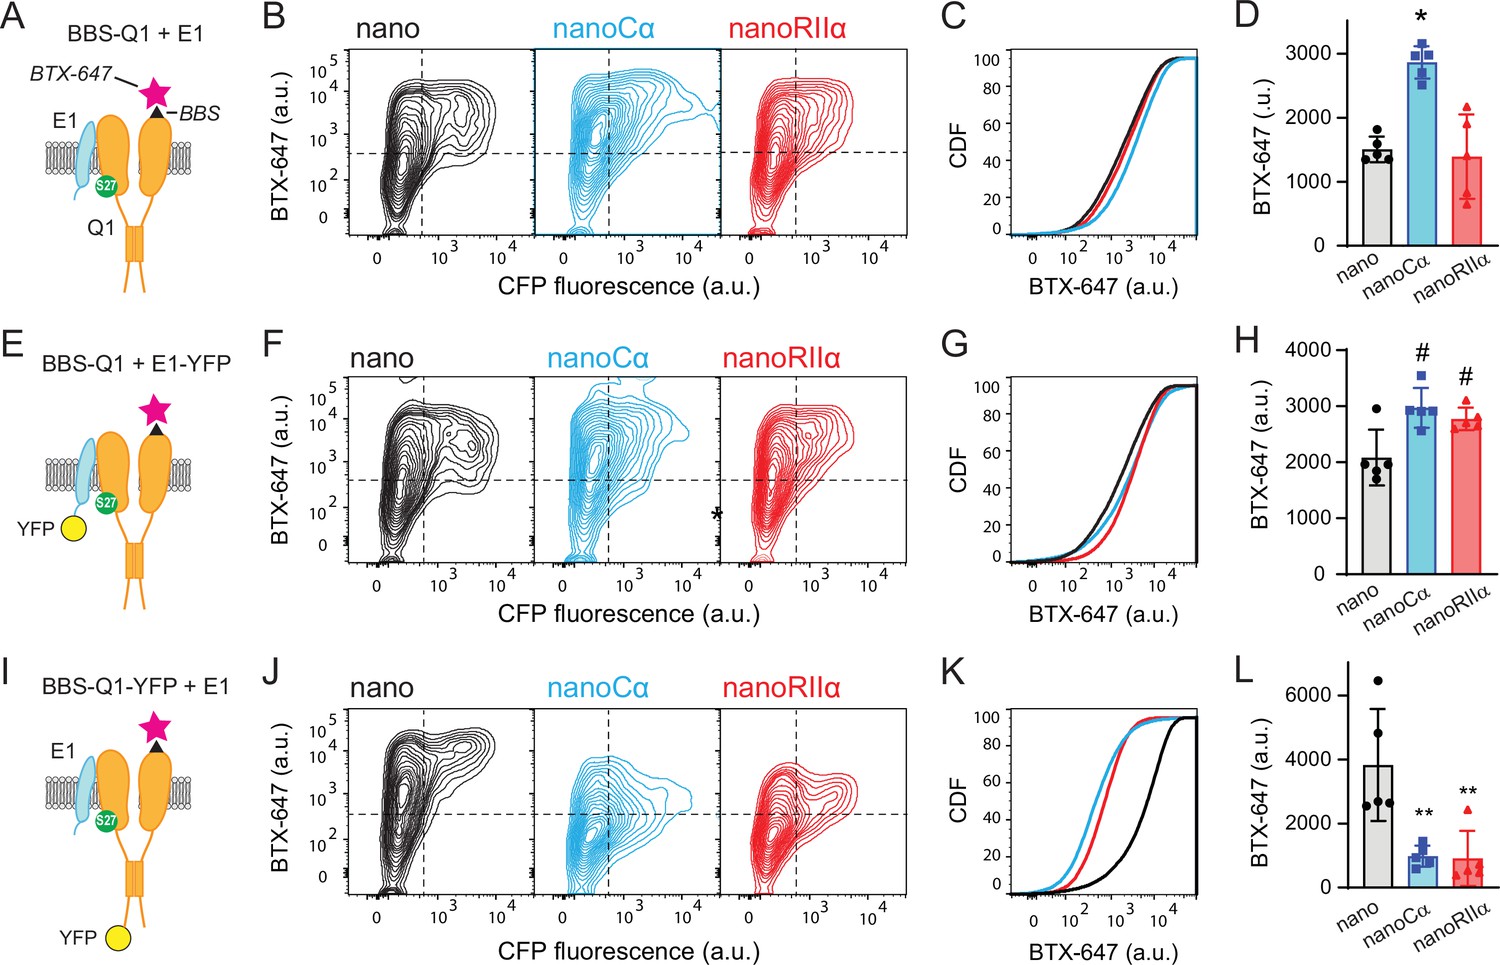
Tethering Cα and RIIα to either E1 or Q1 yields differential effects on channel surface density.
(A) Cartoon showing strategy for surface labeling of BBS-Q1/E1 using BTX-647. (B) Flow cytometry contour plots showing surface channels (BTX-647 fluorescence) and nano expression (CFP fluorescence) in cells expressing BBS-Q1/E1 with nano (left), nanoCα (middle), or nanoRIIα (right). (C) Corresponding cumulative distribution (CDF) histograms of BTX-647 fluorescence. Plot generated from population of CFP-positive cells. (D) Channel surface density (mean BTX-647 fluorescence in CFP-positive cells). *p=0.0003, one-way ANOVA and Tukey HSD post hoc test. (E–H) Cartoon, contour plots, CDF, and average surface labeling of BBS-Q1 in cells expressing BBS-Q1/E1-YFP with nano, nanoCα, or nanoRIIα, same format as A–D. #p<0.05, one-way ANOVA and Tukey HSD post hoc test. (I–L) Cartoon, contour plots, CDF, and normalized average surface labeling of BBS-Q1-YFP in cells expressing BBS-Q1-YFP/E1 with nano, nanoCα, or nanoRIIα, same format as A–D. **p<0.05, one-way ANOVA and Tukey HSD post hoc test.
-
Figure 3—source data 1
Tethering Cα and RIIα to either E1 or Q1 yields differential effects on channel surface density.
- https://cdn.elifesciences.org/articles/83466/elife-83466-fig3-data1-v2.zip
Figure 4
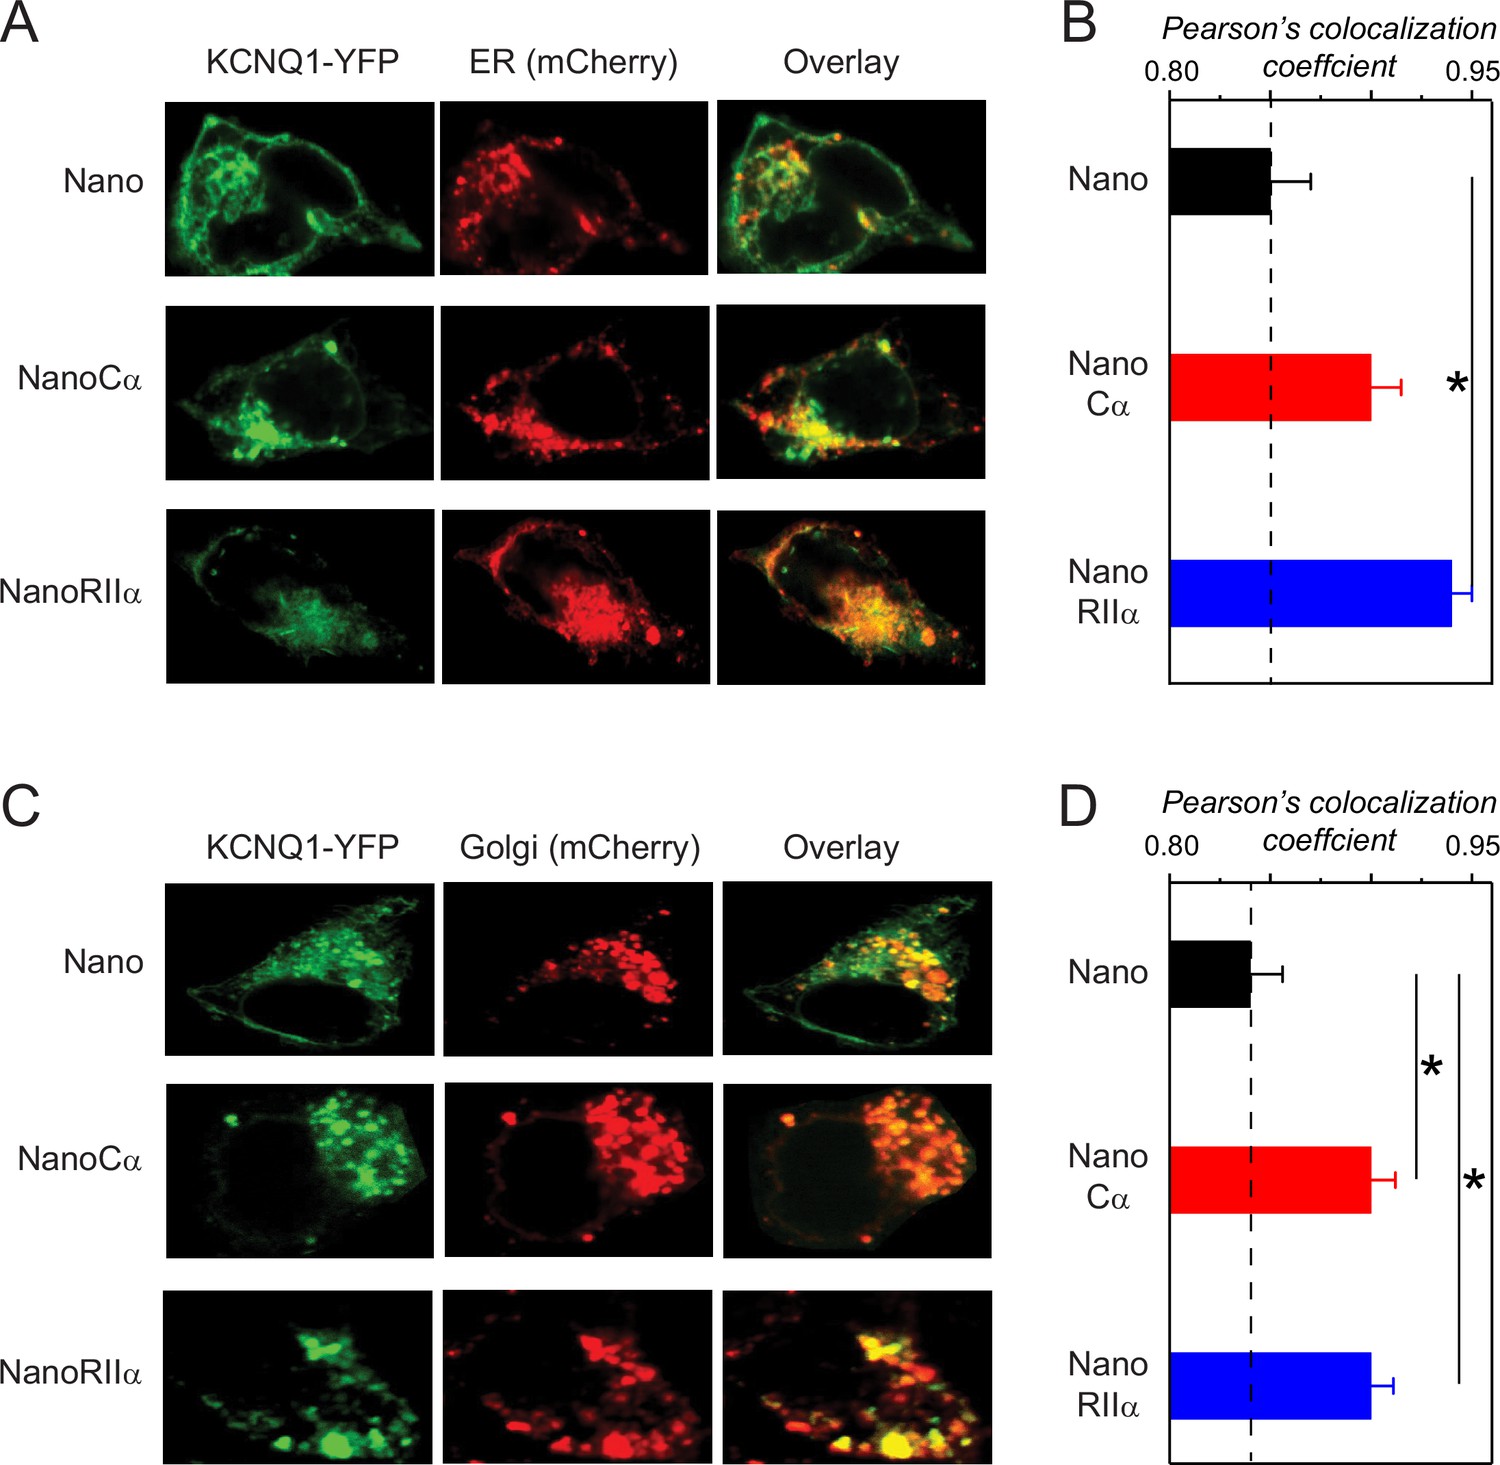
Subcellular localization of KCNQ1 tethered to nano, nanoCα, or nanoRIIα.
(A) Representative confocal images of HEK293 cells expressing Q1-YFP/E1 and ER-mCherry marker with nano, nanoCα, or nanoRIIα. (B) Co-localization of Q1-YFP with ER-mCherry assessed by Pearson’s co-localization coefficient; n=9 for nano, n=7 for nanoCα and n=8 for nanoRIIα. (C) Representative confocal images of HEK293 cells expressing Q1-YFP/E1 and Golgi-mCherry marker with nano, nanoCα, or nanoRIIα. (D) Co-localization of Q1-YFP with ER-mCherry assessed by Pearson’s co-localization coefficient; n=9 for nano, n=8 for nanoCα, and n=6 for nanoRIIα. *p<0.05, one-way ANOVA and Tukey HSD post hoc test.
Figure 5
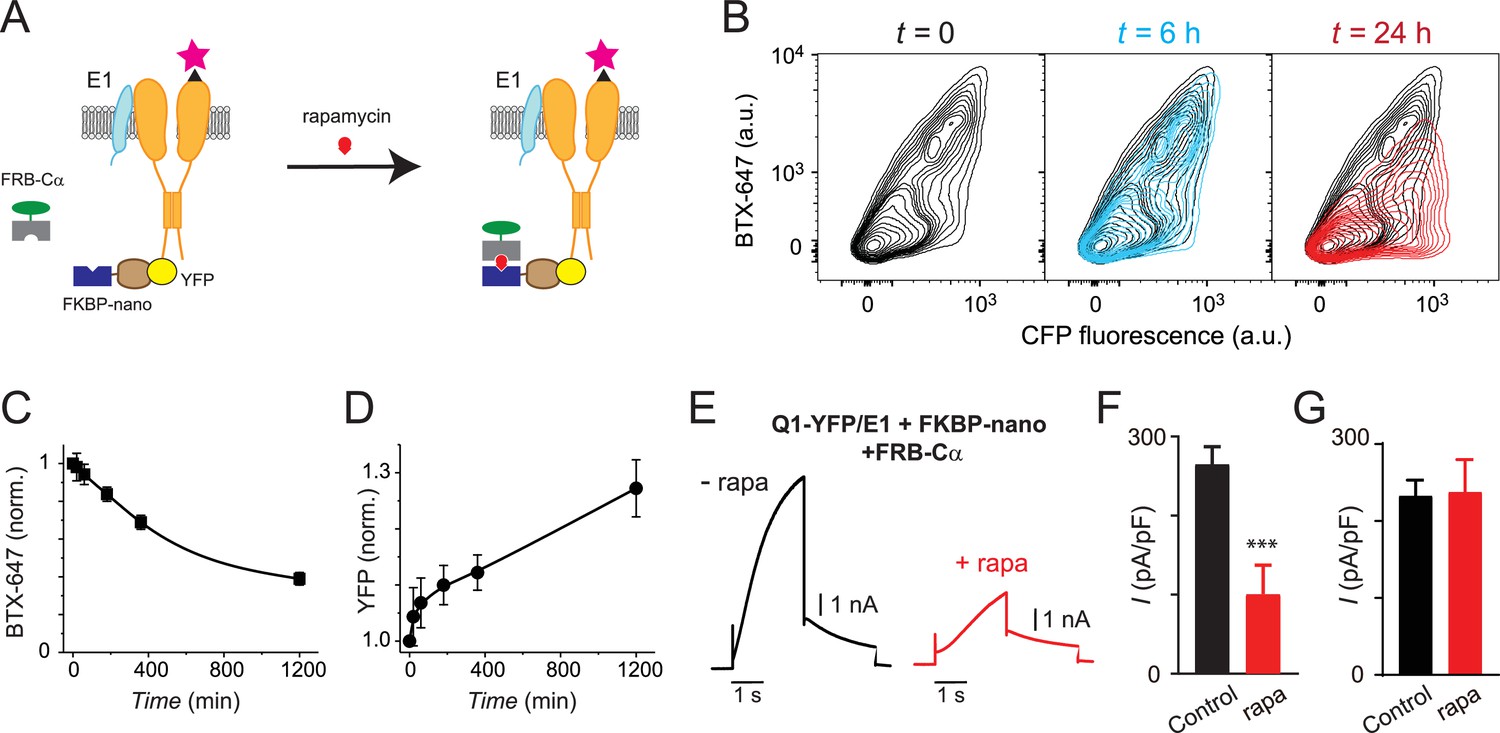
Slow temporal regulation of channel trafficking by targeted induced recruitment of nanoCα to Q1 C-terminus.
(A) Cartoon of FK506 binding protein (FKBP)/FKBP-rapamycin binding domain (FRB) heterodimerization strategy utilized for rapamycin-induced recruitment of engineered Cα to BBS-Q1-YFP/E1. (B) Exemplar flow cytometry contour plots showing surface expression (BTX-647 fluorescence) and CFP fluorescence in cells expressing BBS-Q1-YFP/E1 with FRB-Cα and FKBP-nano at times t=0 (left), t=6 hr (middle), and t=24 hr (right) after rapamycin addition. (C) Normalized mean Q1 surface density (BTX-647 fluorescence) plotted as a function of time after rapamycin induction. (D) Normalized mean Q1 total expression (YFP fluorescence) plotted as a function of time after rapamycin induction. (E) Exemplar IKs traces recorded in Chinese hamster ovary (CHO) cells co-expressing KCNQ1-YFP/KCNE1/nano-FKBP-FRB-Cα incubated 20 hr either without (left) or with (right) rapamycin. (F) Mean current densities in CHO cells co-expressing KCNQ1-YFP/KCNE1/nano-FKBP-FRB-Cα without rapamycin (black, n=10) or after 20 hr rapamycin incubation (red, n=14). ***p<0.001, paired t test. (G) Mean current densities in control cells co-expressing KCNQ1-YFP/KCNE1 without rapamycin (black, n=8) or after 20 hr rapamycin incubation (red, n=9).
-
Figure 5—source data 1
Slow temporal regulation of channel trafficking by targeted induced recruitment of nanoCα to Q1 C-terminus.
- https://cdn.elifesciences.org/articles/83466/elife-83466-fig5-data1-v2.zip
Figure 6 with 1 supplement
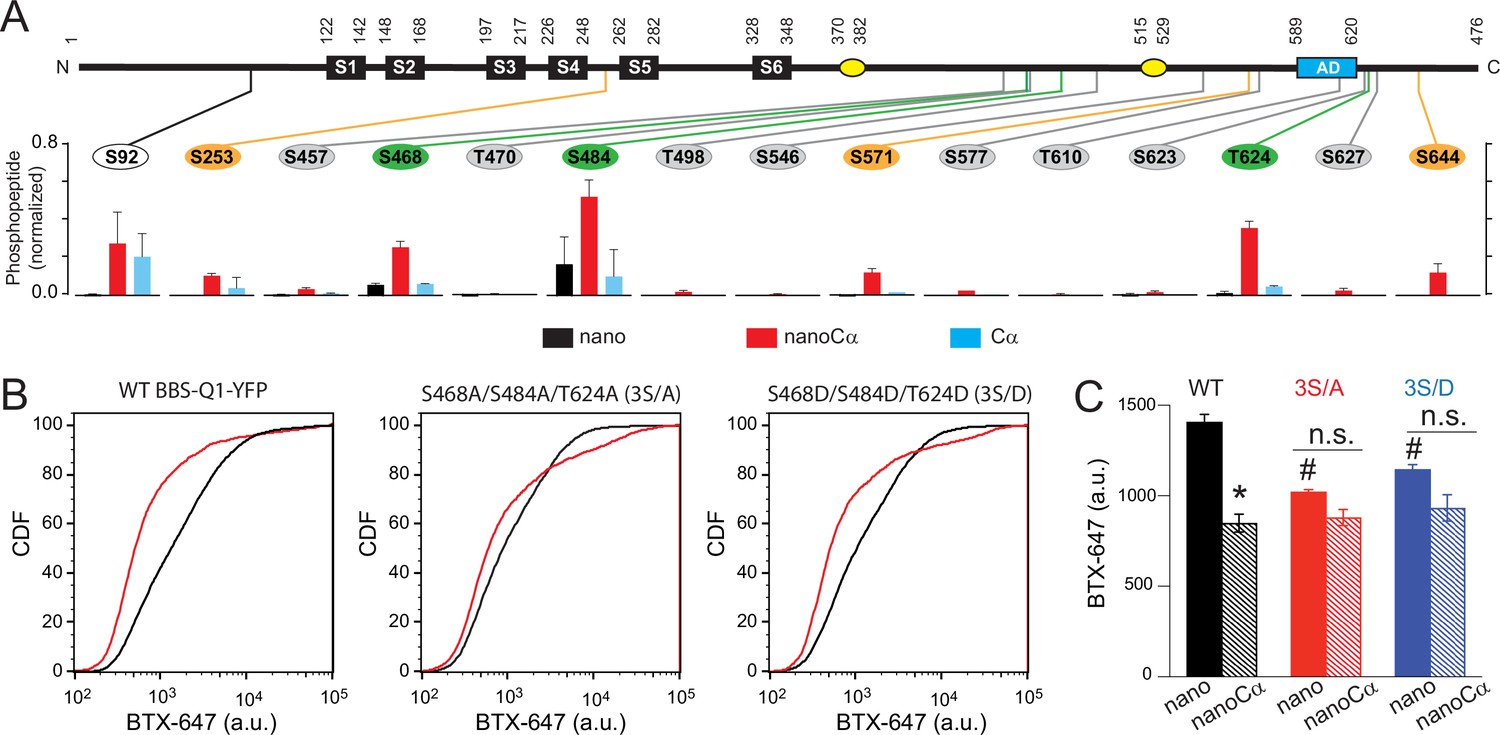
Potential phosphorylation sites involved in protein kinase A (PKA) modulation of KCNQ1 trafficking.
(A) Top, schematic of Q1 showing positions of Ser and Thr residues where phosphorylation was increased when nanoCα was targeted to Q1 C-terminus. Bottom, relative abundance of phosphorylated KCNQ1-YFP peptides identified using mass spectrometry in cells co-expressing nano (black), nanoCα (red), or free Cα (cyan). (B) Exemplar CDF plots showing channel surface density in cells expressing WT BBS-Q1-YFP (left), BBS-3S/A-YFP (middle), or BBS-3S/D-YFP (right) in the absence (black traces) or presence (red traces) of nanoCα. (C) Channel surface density (mean BTX-647 fluorescence in YFP-positive cells) in cells expressing WT BBS-Q1-YFP, BBS-3S/A-YFP, or BBS-3S/D-YFP in the presence of either nano or nanoCα. WT BBS-Q1-YFP (nano, N=4; nanoCα, N=4; *p<0.001, unpaired t-test). BBS-3S/A-YFP (nano, N=4; nanoCα, N=4; p=0.063, unpaired t-test). BBS-3S/D-YFP (nano, N=4; nanoCα, N=4; p=0.079, unpaired t-test). #p<0.001 compared to WT+nano, one-way ANOVA and Tukey HSD post hoc test.
-
Figure 6—source data 1
Potential phosphorylation sites involved in protein kinase A (PKA) modulation of KCNQ1 trafficking.
- https://cdn.elifesciences.org/articles/83466/elife-83466-fig6-data1-v2.zip
-
Figure 6—source data 2
Potential phosphorylation sites involved in protein kinase A (PKA) modulation of KCNQ1 trafficking.
- https://cdn.elifesciences.org/articles/83466/elife-83466-fig6-data2-v2.zip
Figure 6—figure supplement 1
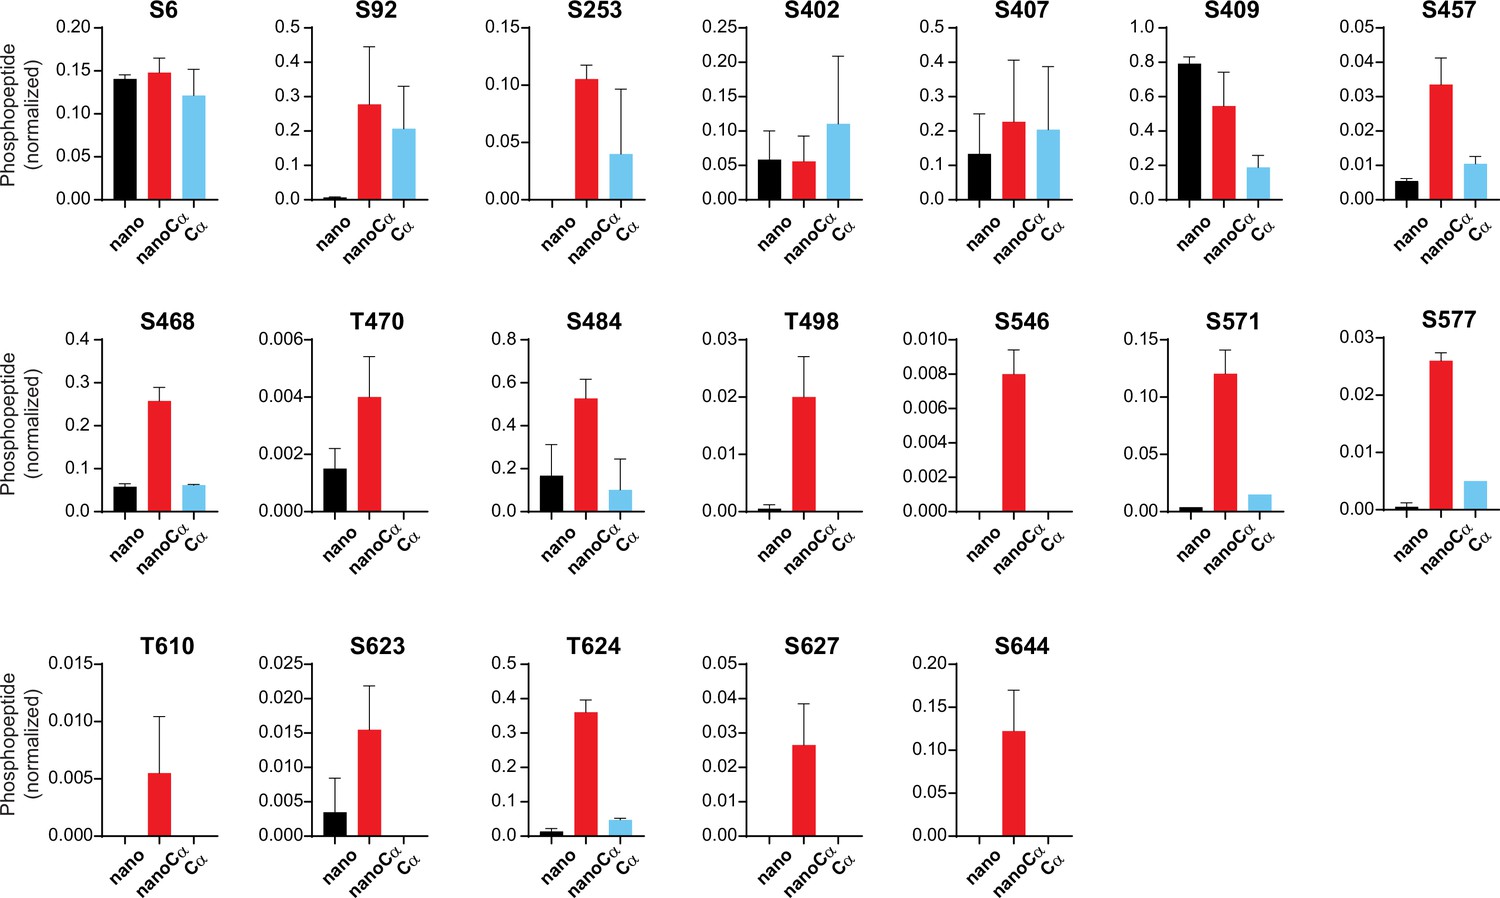
Relative abundance of phosphorylated KCNQ1-YFP peptides identified using mass spectrometry in cells co-expressing nano (black), nanoCα (red), or free Cα (cyan).
-
Figure 6—figure supplement 1—source data 1
Relative abundance of phosphorylated KCNQ1-YFP peptides identified using mass spectrometry in cells co-expressing nano, nanoCα, or free Cα.
- https://cdn.elifesciences.org/articles/83466/elife-83466-fig6-figsupp1-data1-v2.zip
Tables
Key resources table
| Reagent type (species) or resource | Designation | Source or reference | Identifiers | Additional information |
|---|---|---|---|---|
| Cell line (Homo sapiens) | HEK293 | ATCC | RRID:CVCL_0045 | Laboratory of Dr. Robert Kass |
| Cell line (Homo sapiens) | CHO | ATCC | RRID:CVCL_0214 | CHO-K1, ATCC, CCL-61 |
| Antibody | Anti-Q1 (Rabbit polyclonal) | Alomone | RRID:AB_2040099 | IP (1:1000), WB (1:1000) |
| Antibody | Anti-PKA (Rabbit monoclonal) | Abcam | Cat# ab76238, RRID:AB_1523259 | IP(1:1000) WB (1:1000) |
| Antibody | Anti-actin (Rabbit polyclonal) | Abcam | Cat# ab197345 | WB (1:2000) |
| Antibody | Anti-pQ1 (Rabbit polyclonal) | PMID:12566567 | WB (1:250) | |
| Recombinant DNA reagent | BBS-Q1-YFP (plasmid) | PMID:25344363 | ||
| Recombinant DNA reagent | BBS-Q1 (plasmid) | PMID:25344363 | ||
| Recombinant DNA reagent | Q1-YFP (plasmid) | PMID:25344363 | ||
| Recombinant DNA reagent | Q1 (plasmid) | PMID:25344363 | From the lab of William Kobertz | |
| Recombinant DNA reagent | E1-YFP (plasmid) | PMID:25344363 | ||
| Recombinant DNA reagent | E1 (plasmid) | PMID:25344363 | From the lab of William Kobertz | |
| Recombinant DNA reagent | Yotiao (plasmid) | PMID:15528278 | ||
| Recombinant DNA reagent | Q1[S27A]-YFP | This paper | Made by site-directed mutagenesis; see Plasmid constructs and mutagenesis | |
| Recombinant DNA reagent | NanoCα-P2A-CFP (plasmid) | This paper | Made by gene synthesis (Genewiz) and cloning; see Plasmid constructs and mutagenesis | |
| Recombinant DNA reagent | NanoCα[T198A]-P2A-CFP (plasmid) | This paper | Made by site-directed mutagenesis; see Plasmid constructs and mutagenesis | |
| Recombinant DNA reagent | Cα-P2A-CFP (plasmid) | This paper | Made by gene synthesis (Genewiz) and cloning; see Plasmid constructs and mutagenesis | |
| Recombinant DNA reagent | NanoRIIα-P2A-CFP (plasmid) | This paper | Made by gene synthesis (Genewiz) and cloning; see Plasmid constructs and mutagenesis | |
| Recombinant DNA reagent | Nano-P2A-CFP (plasmid) | PMID:29256394 | ||
| Peptide, recombinant protein | Protein A/G Sepharose beads | Rockland | Cat# PAG50-00-0002 | |
| Peptide, recombinant protein | α-Bungarotoxin, Alexa Fluor 647 conjugate | Thermo Fisher scientific | Cat# B35450 | |
| Commercial assay or kit | Quik-Change Site-Directed Mutagenesis Kit | Agilent Technologies | Cat# 200523 | |
| Chemical compound, drug | Rapamycin | Sigma | Cat# 553211-1MG | |
| Software, algorithm | FlowJo | FlowJo, LLC | RRID:SCR_008520 | |
| Software, algorithm | GraphPad Prism | GraphPad Software Inc | RRID:SCR_002798 | |
| Software, algorithm | Origin | OriginLab Corporation | RRID:SCR_014212 | |
| Software, algorithm | PulseFit | HEKA |
Additional files
Download links
A two-part list of links to download the article, or parts of the article, in various formats.
Downloads (link to download the article as PDF)
Open citations (links to open the citations from this article in various online reference manager services)
Cite this article (links to download the citations from this article in formats compatible with various reference manager tools)
Divergent regulation of KCNQ1/E1 by targeted recruitment of protein kinase A to distinct sites on the channel complex
eLife 12:e83466.
https://doi.org/10.7554/eLife.83466


