CD8+ tissue-resident memory T cells induce oral lichen planus erosion via cytokine network
- State Key Laboratory of Oral Diseases, National Clinical Research Center for Oral Diseases, Research Unit of Oral Carcinogenesis and Management, Chinese Academy of Medical Sciences, West China Hospital of Stomatology, Sichuan University, China
- Department of Stomatology, The Second Affiliated Hospital of Chongqing Medical University, China
- Key Laboratory of Oral Biomedical Research of Zhejiang Province, Affiliated Stomatology Hospital, Zhejiang University School of Stomatology, China
Figures
Figure 1 with 1 supplement
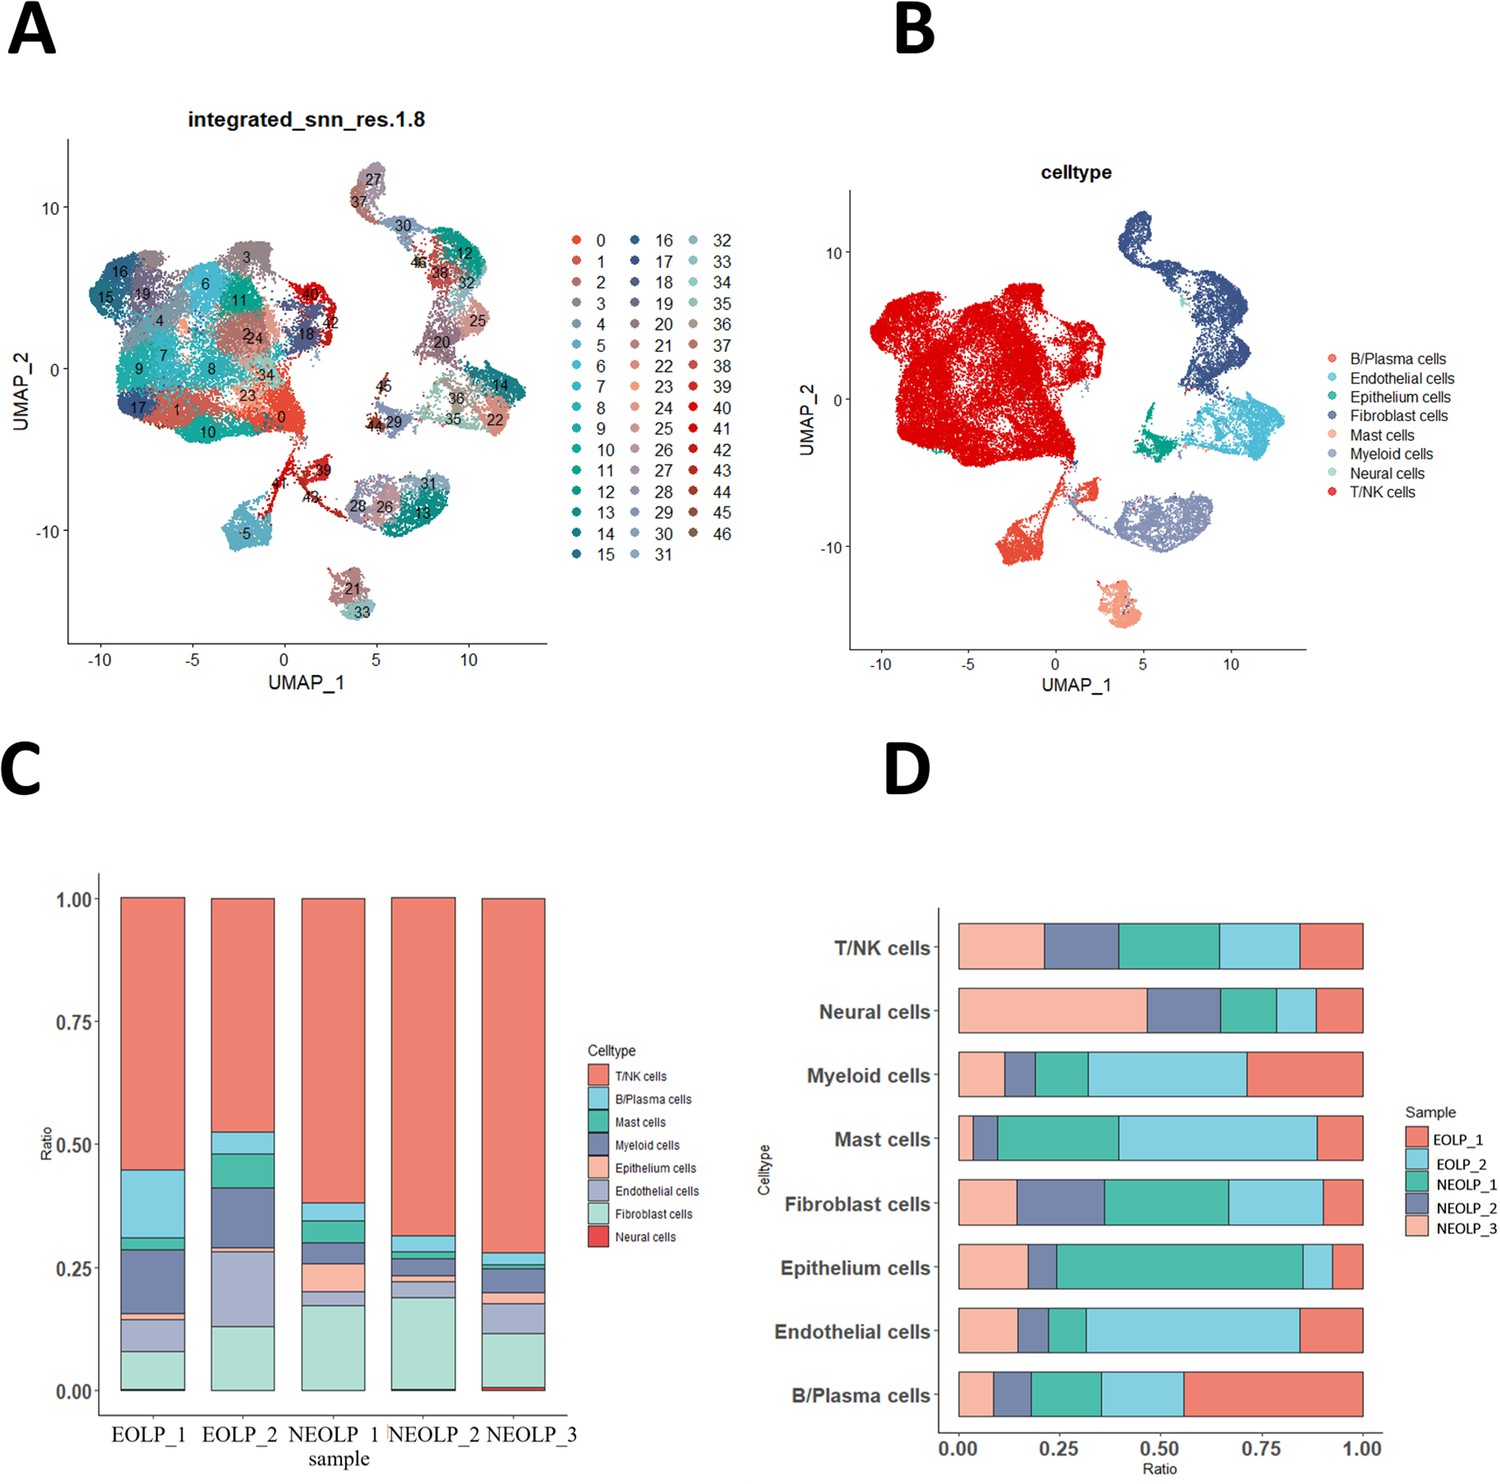
Oral lichen planus (OLP) tissue transcription atlas.
(A) Uniform manifold approximation and projection (UMAP) plot of 46,377 cells colored by cell type (erosive oral lichen planus, EOLP) (n = 2) and non-erosive oral lichen planus (NEOLP) (n = 3). (B) Eight major cell types were identified by UMAP plot. (C) Bar plot showing the percentage of cell subsets in different samples. (D) The proportion of each sample in different cell subsets.
-
Figure 1—source code 1
UMAP visualization and cell typing of OLP including identification of eight major cell types.
- https://cdn.elifesciences.org/articles/83981/elife-83981-fig1-code1-v2.zip
-
Figure 1—source data 1
Percentage of eight major cell types in each OLP sample.
- https://cdn.elifesciences.org/articles/83981/elife-83981-fig1-data1-v2.xlsx
-
Figure 1—source data 2
The proportion of each OLP sample in the eight main cell types.
- https://cdn.elifesciences.org/articles/83981/elife-83981-fig1-data2-v2.xlsx
Figure 1—figure supplement 1
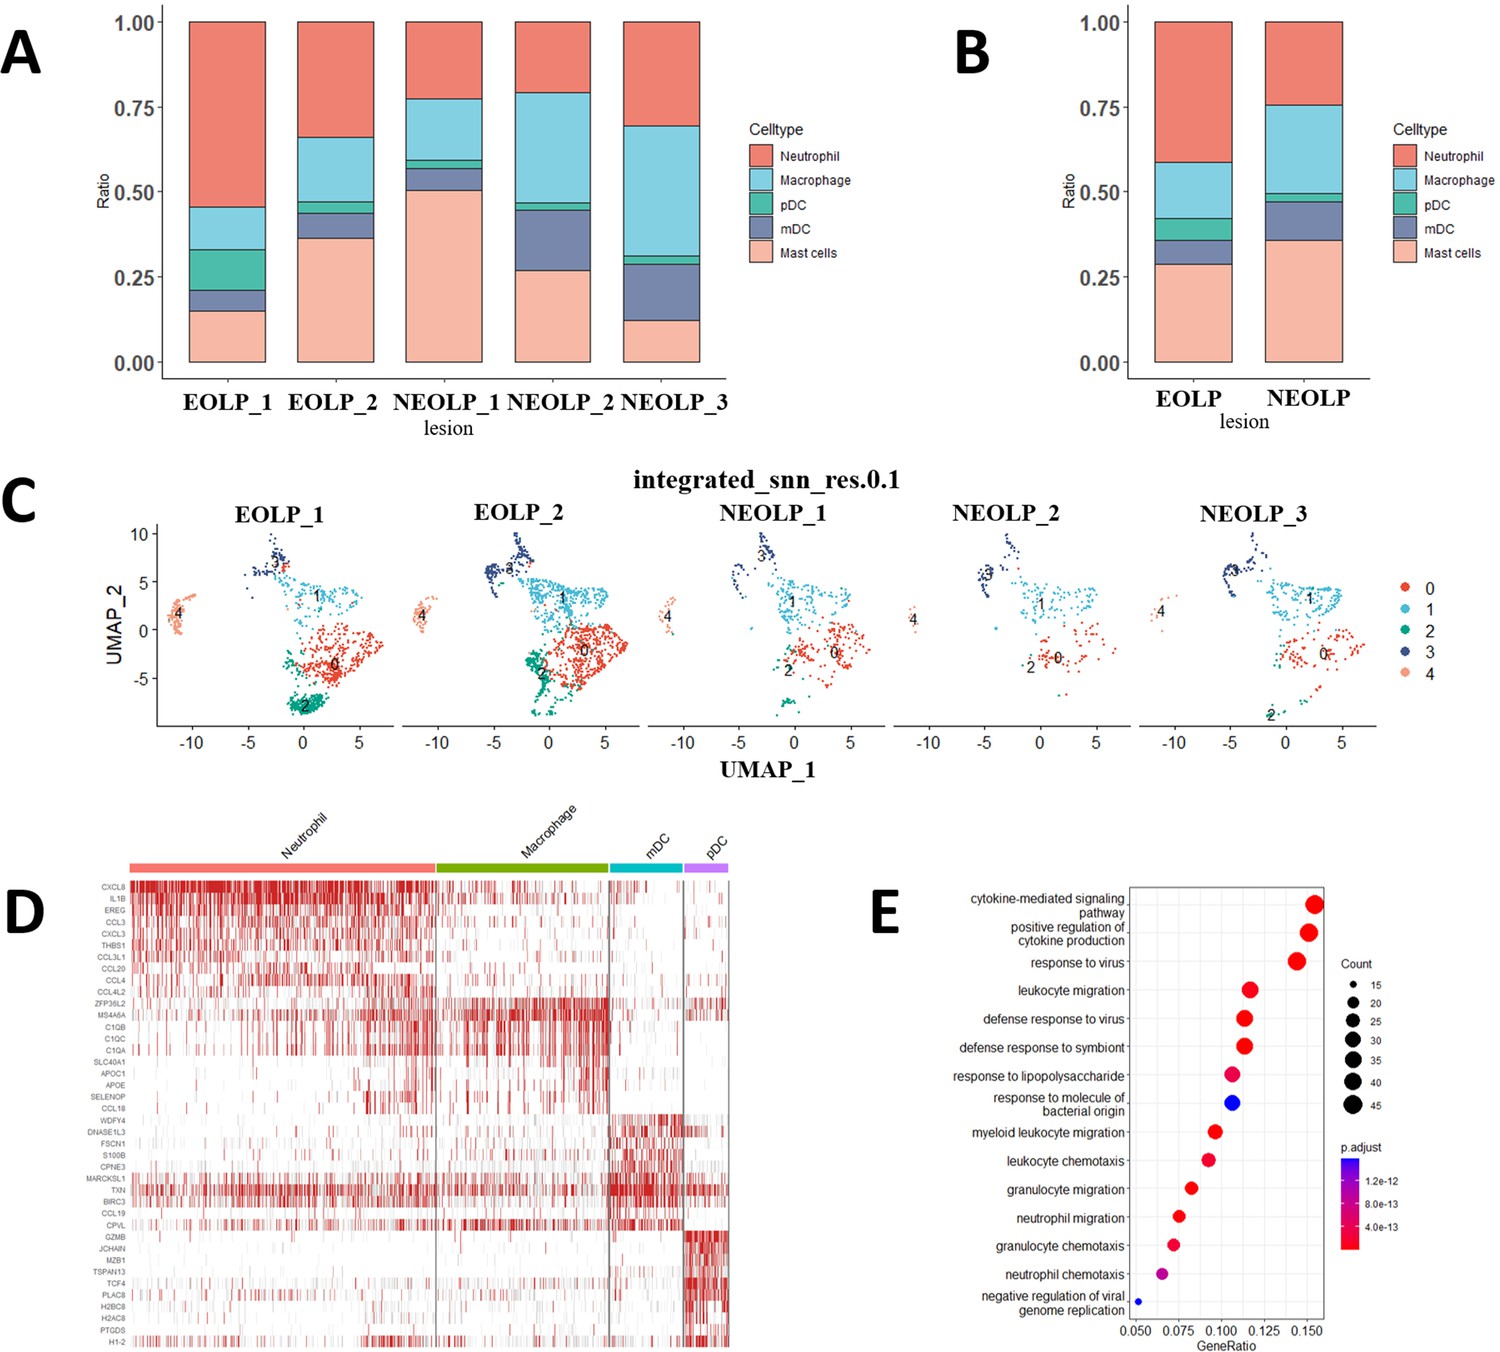
The characteristics of myeloid cells in oral lichen planus (OLPs).
(A) Bar plot showing the percentage of myeloid subsets in different samples. (B) The proportion of each cell subset of myeloid in erosive oral lichen planus (EOLP)/non-erosive oral lichen planus (NEOLP). (C) Transcription atlas of myeloid cells clustering in each OLP sample (0, 2 – neutrophil, 1 – macrophage, 3 – mDC, 4 – pDC). (D) Heatmap of expressed genes for myeloid subpopulation in OLP. (E) GO enrichment analysis dot plot of myeloid cell differentially expressed genes (DEGs) between EOLP and NEOLP.
-
Figure 1—figure supplement 1—source data 1
The percentage of myelid subsets in different OLP samples.
- https://cdn.elifesciences.org/articles/83981/elife-83981-fig1-figsupp1-data1-v2.xlsx
-
Figure 1—figure supplement 1—source data 2
Percentage of each cell subset of myeloid in EOLP and NEOLP.
- https://cdn.elifesciences.org/articles/83981/elife-83981-fig1-figsupp1-data2-v2.xlsx
-
Figure 1—figure supplement 1—source code 1
UMAP visualization and cell typing of myeloid cells in OLP samples, along with GO enrichment analysis of differentially expressed myeloid cell genes between EOLP and NEOLP.
- https://cdn.elifesciences.org/articles/83981/elife-83981-fig1-figsupp1-code1-v2.zip
Figure 2 with 2 supplements
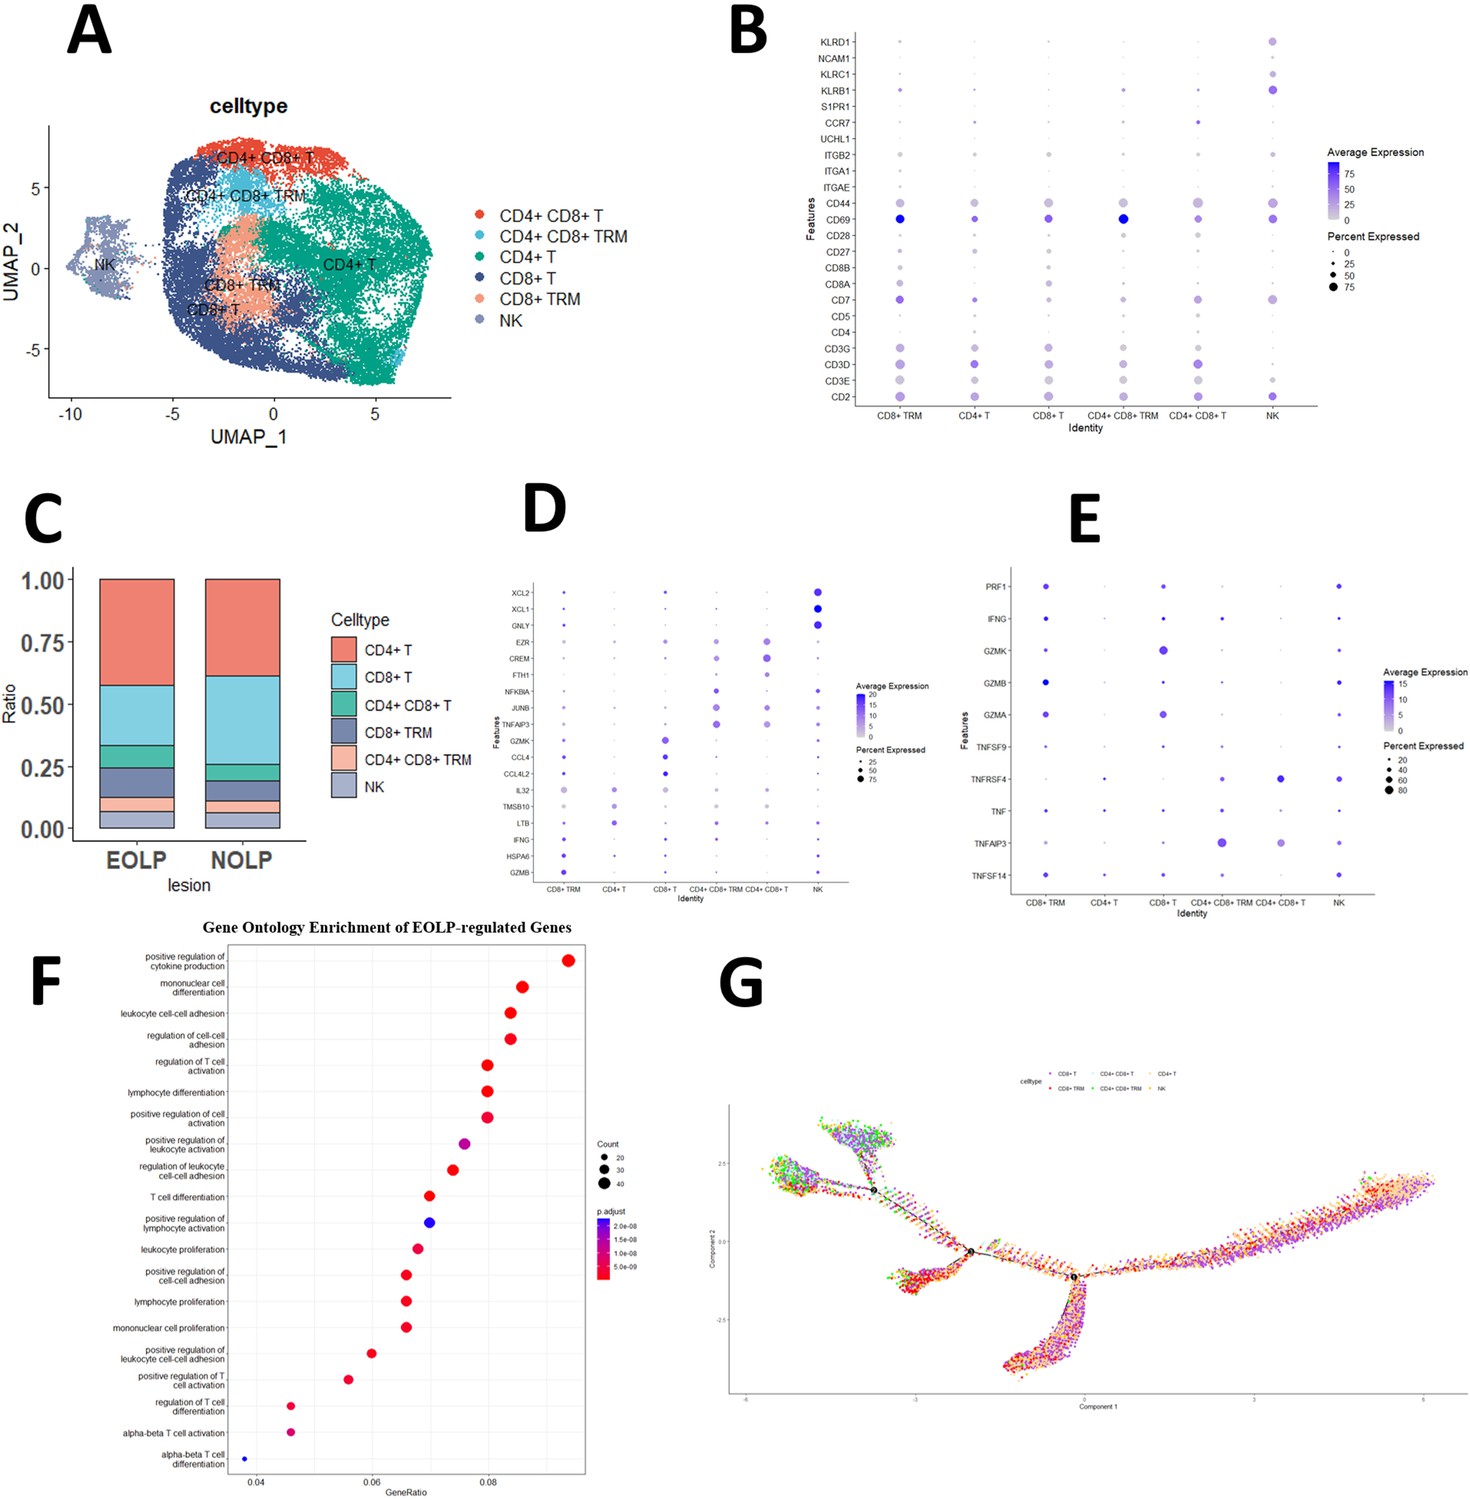
CD8+ Trm in oral lichen planus (OLP) patients have different transcriptomic landscapes in different clinical presentations.
(A) Uniform manifold approximation and projection (UMAP) plot of NK/T cells colored by subtype. (B) Dot plot of marker genes in NK/T cells subsets. (C) Proportion of NK/T cell subsets in OLP with different clinical manifestations. (D) Dot plot of significant differentially expressed genes (DEGs) in NK/T cells subsets. (E) Dot plot of differential expression of inflammatory cytokine product genes in NK/T cell subsets. (F) Dot plot of GO enrichment analysis of DEGs between erosive oral lichen planus (EOLP) and non-erosive oral lichen planus (NEOLP). (G) Pseudotime trajectory of NA/T cells in OLP.
-
Figure 2—source code 1
Comprehensive analysis of NK/T cell in OLP samples: UMAP visualization, cell typing, marker genes, DEGs, inflammatory cytokine profiles, GO enrichment analysis, and pseudotime trajectory between EOLP and NEOLP.
- https://cdn.elifesciences.org/articles/83981/elife-83981-fig2-code1-v2.zip
-
Figure 2—source data 1
Percentage of NK/T cell subsets in EOLP and NEOLP.
- https://cdn.elifesciences.org/articles/83981/elife-83981-fig2-data1-v2.xlsx
Figure 2—figure supplement 1
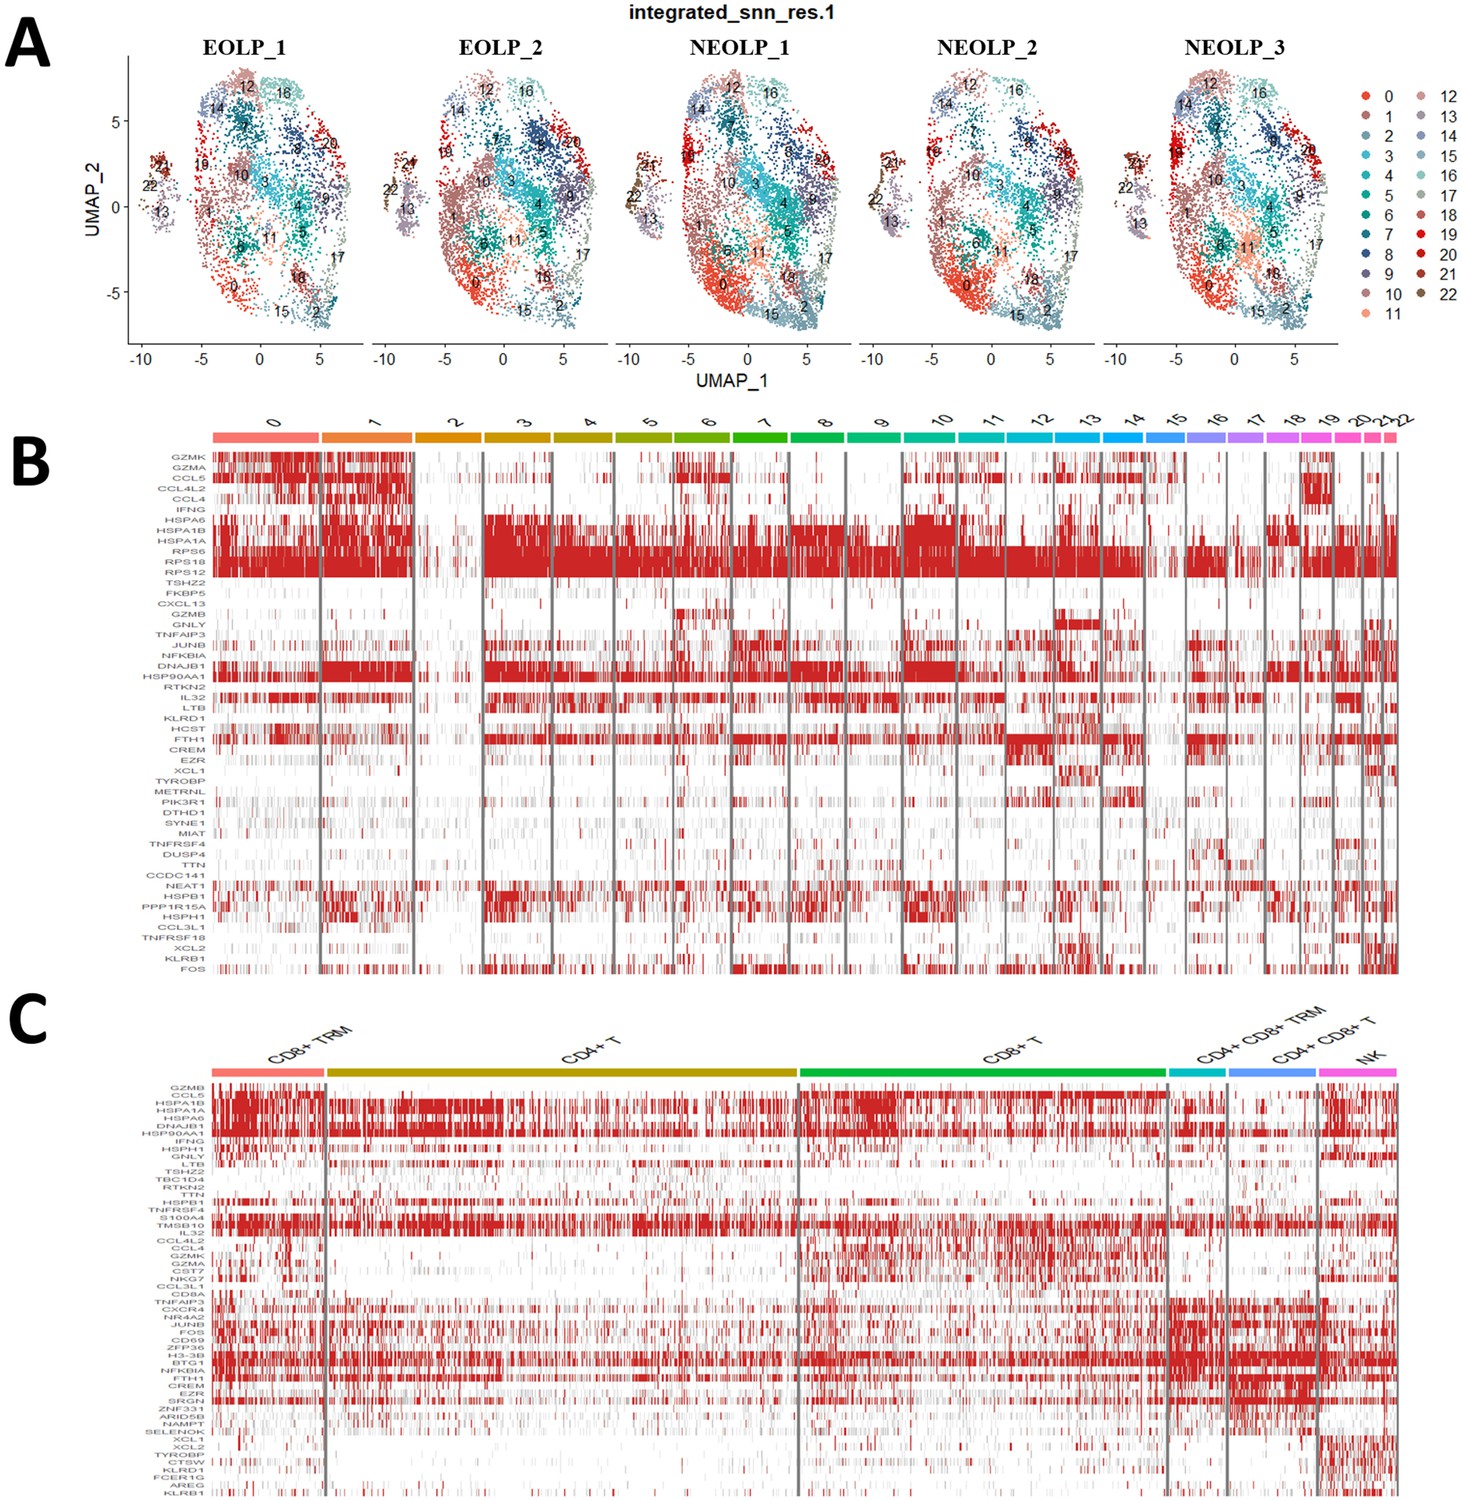
Transcriptional Profiling of NK/T Cells in OLP.
(A) Transcription atlas of NK/T cells clustering in each oral lichen planus (OLP) sample. (B) Heatmap of differentially expressed genes per cluster in NK/T cells. (C) Heatmap of expressed genes for each cell subpopulation in NK/T cells.
-
Figure 2—figure supplement 1—source code 1
Transcriptional Profiling of NK/T Cells in OLP: Clustering, DEGs, and Cell Subpopulation Expression.
- https://cdn.elifesciences.org/articles/83981/elife-83981-fig2-figsupp1-code1-v2.zip
Figure 2—figure supplement 2
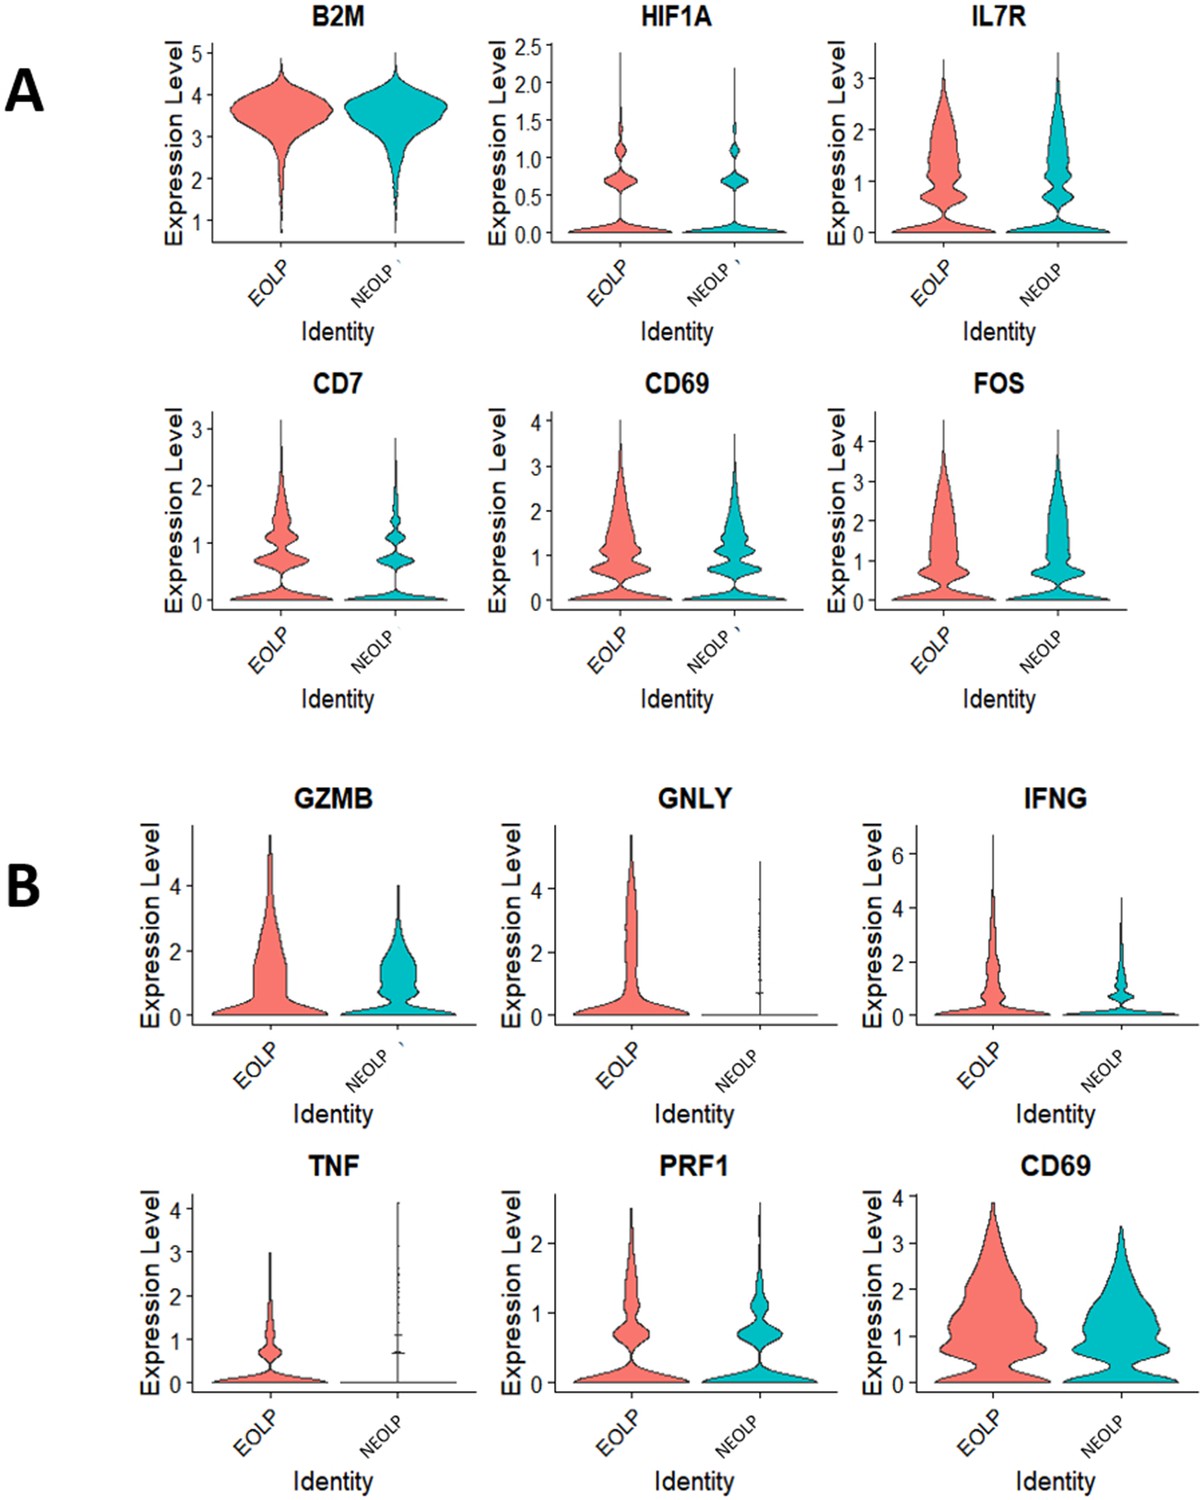
Analysis of differentially expressed genes (DEGs) in oral lichen planus (OLPs).
(A) The differential gene violin plot for erosive oral lichen planus (EOLP)/non-erosive oral lichen planus (NEOLP) with statistical significance. (B) The differential gene violin plot for CD8+ Trm cluster in EOLP/ NEOLP with statistical significance.
Figure 3
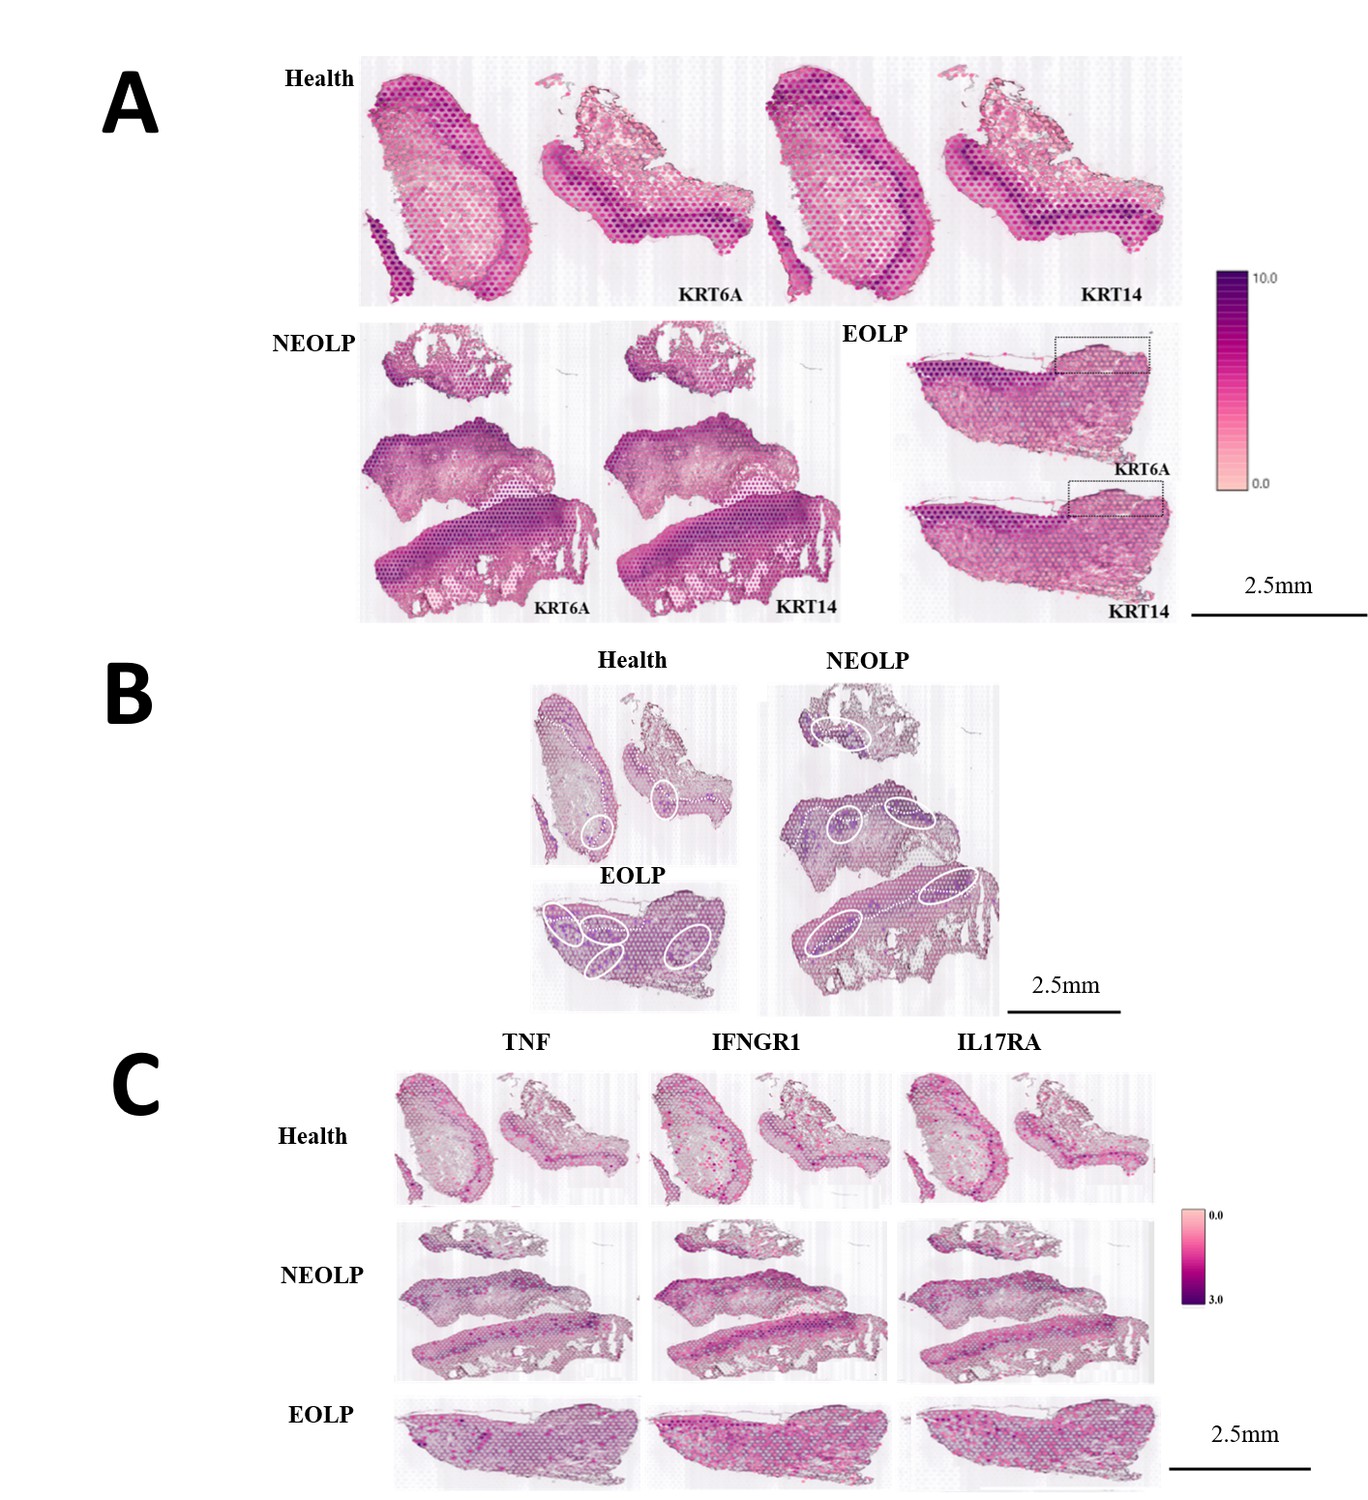
CD8+ Trm in oral lichen planus (OLP) patients have different transcriptomic landscapes in different clinical presentations.
(A) Marked the epithelial layer area of each group of samples. (B) CD8+ Trm distribution area. The dark purple spots are the CD8+ TRM marker gene co-expression spots; the area in the white circle is the CD8+ TRM distribution area; the white dotted line is the basement membrane. (C) TNF/IFNGR1/IL17RA distribution area.
Figure 4
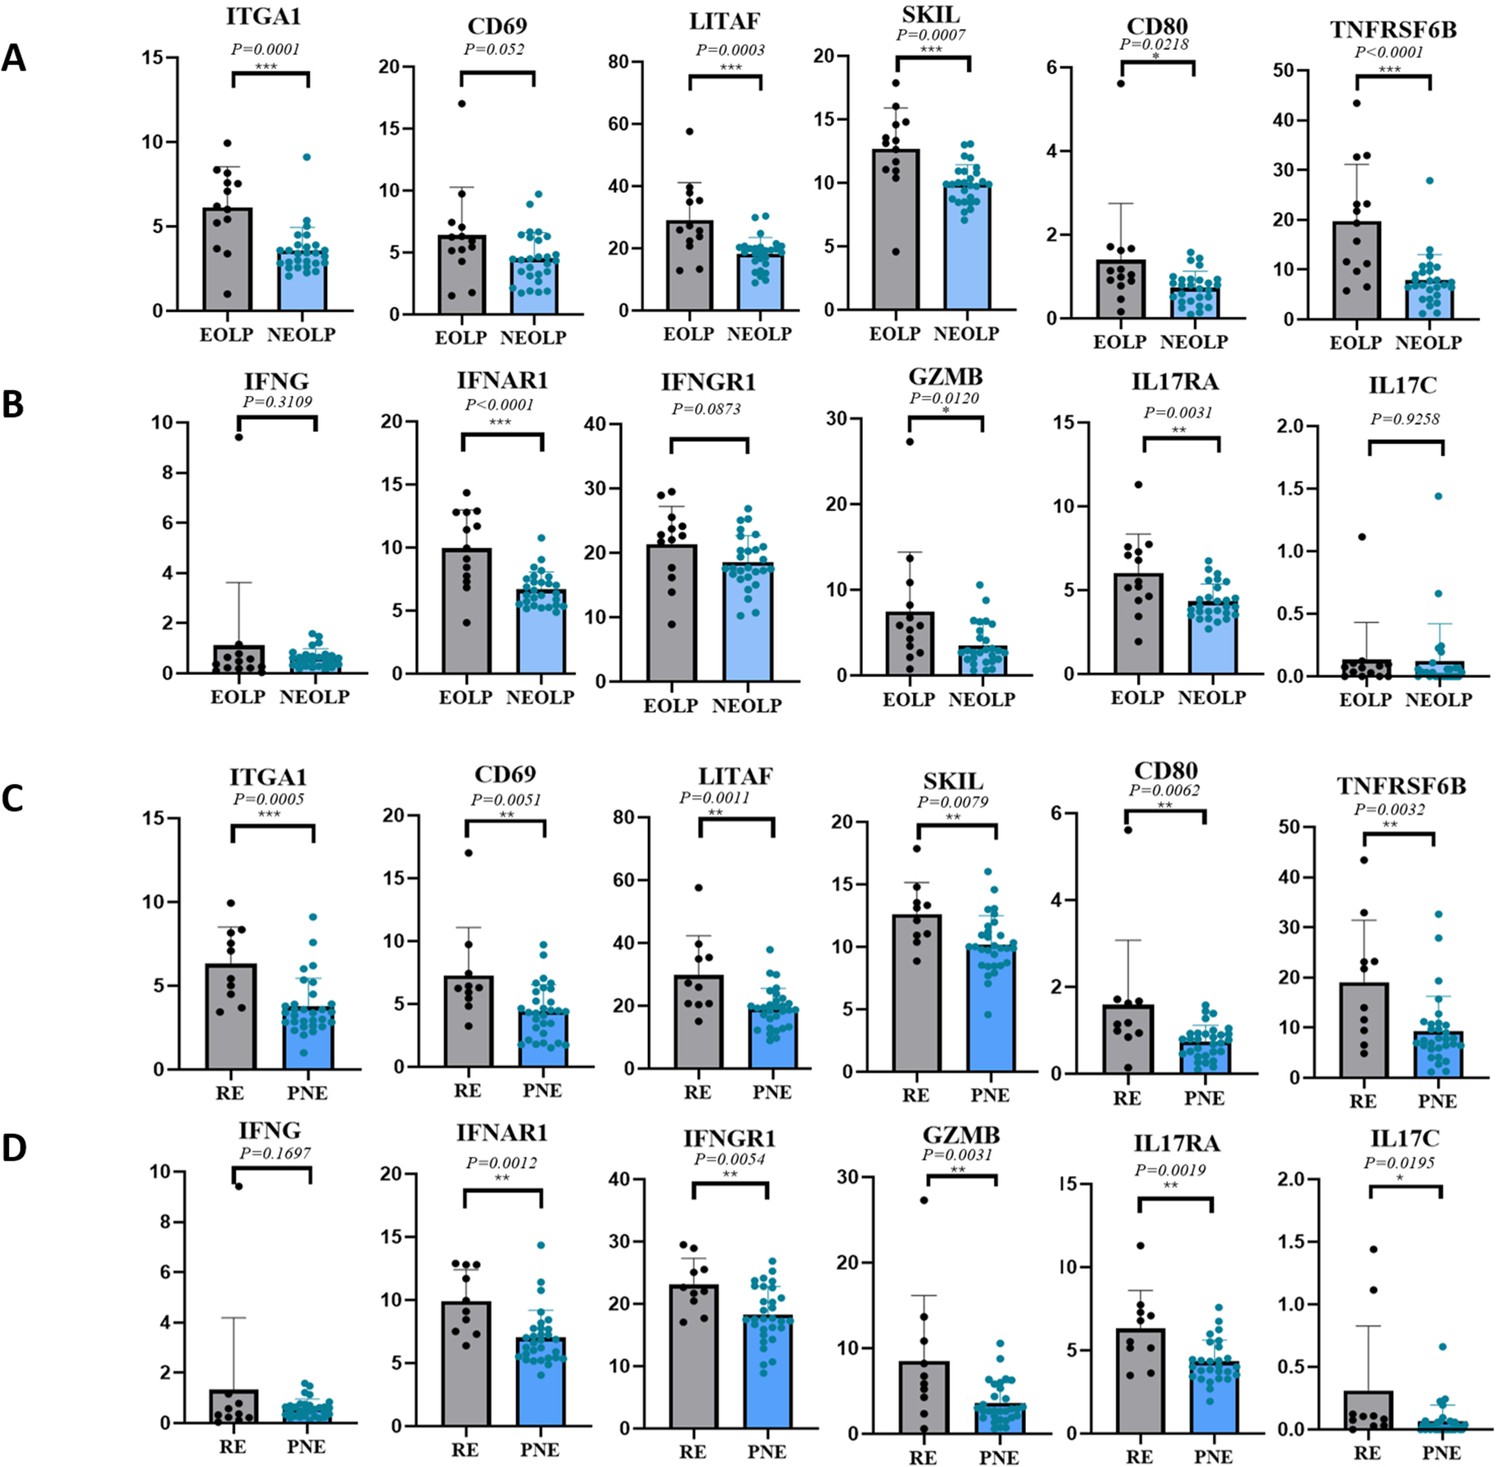
CD8+ Trm in oral lichen planus (OLP) patients have different transcriptomic expression in different clinical presentations and outcomes.
(A, B) CD8+ Trm marker genes and related inflammatory factor genes in erosive oral lichen planus (EOLP)/non-erosive oral lichen planus (NEOLP). (C, D) CD8+ Trm marker genes and related inflammatory factor genes in recurrent erosion (RE)/persistent non-erosion (PNE).
-
Figure 4—source data 1
Expression of CD8+ Trm marker genes and related inflammatory factor genes in EOLP and NEOLP in clinical cohort.
- https://cdn.elifesciences.org/articles/83981/elife-83981-fig4-data1-v2.xlsx
-
Figure 4—source data 2
Expression of CD8+ Trm marker genes and related inflammatory factor genes in RE and PNE in clinical cohort.
- https://cdn.elifesciences.org/articles/83981/elife-83981-fig4-data2-v2.xlsx
Figure 5
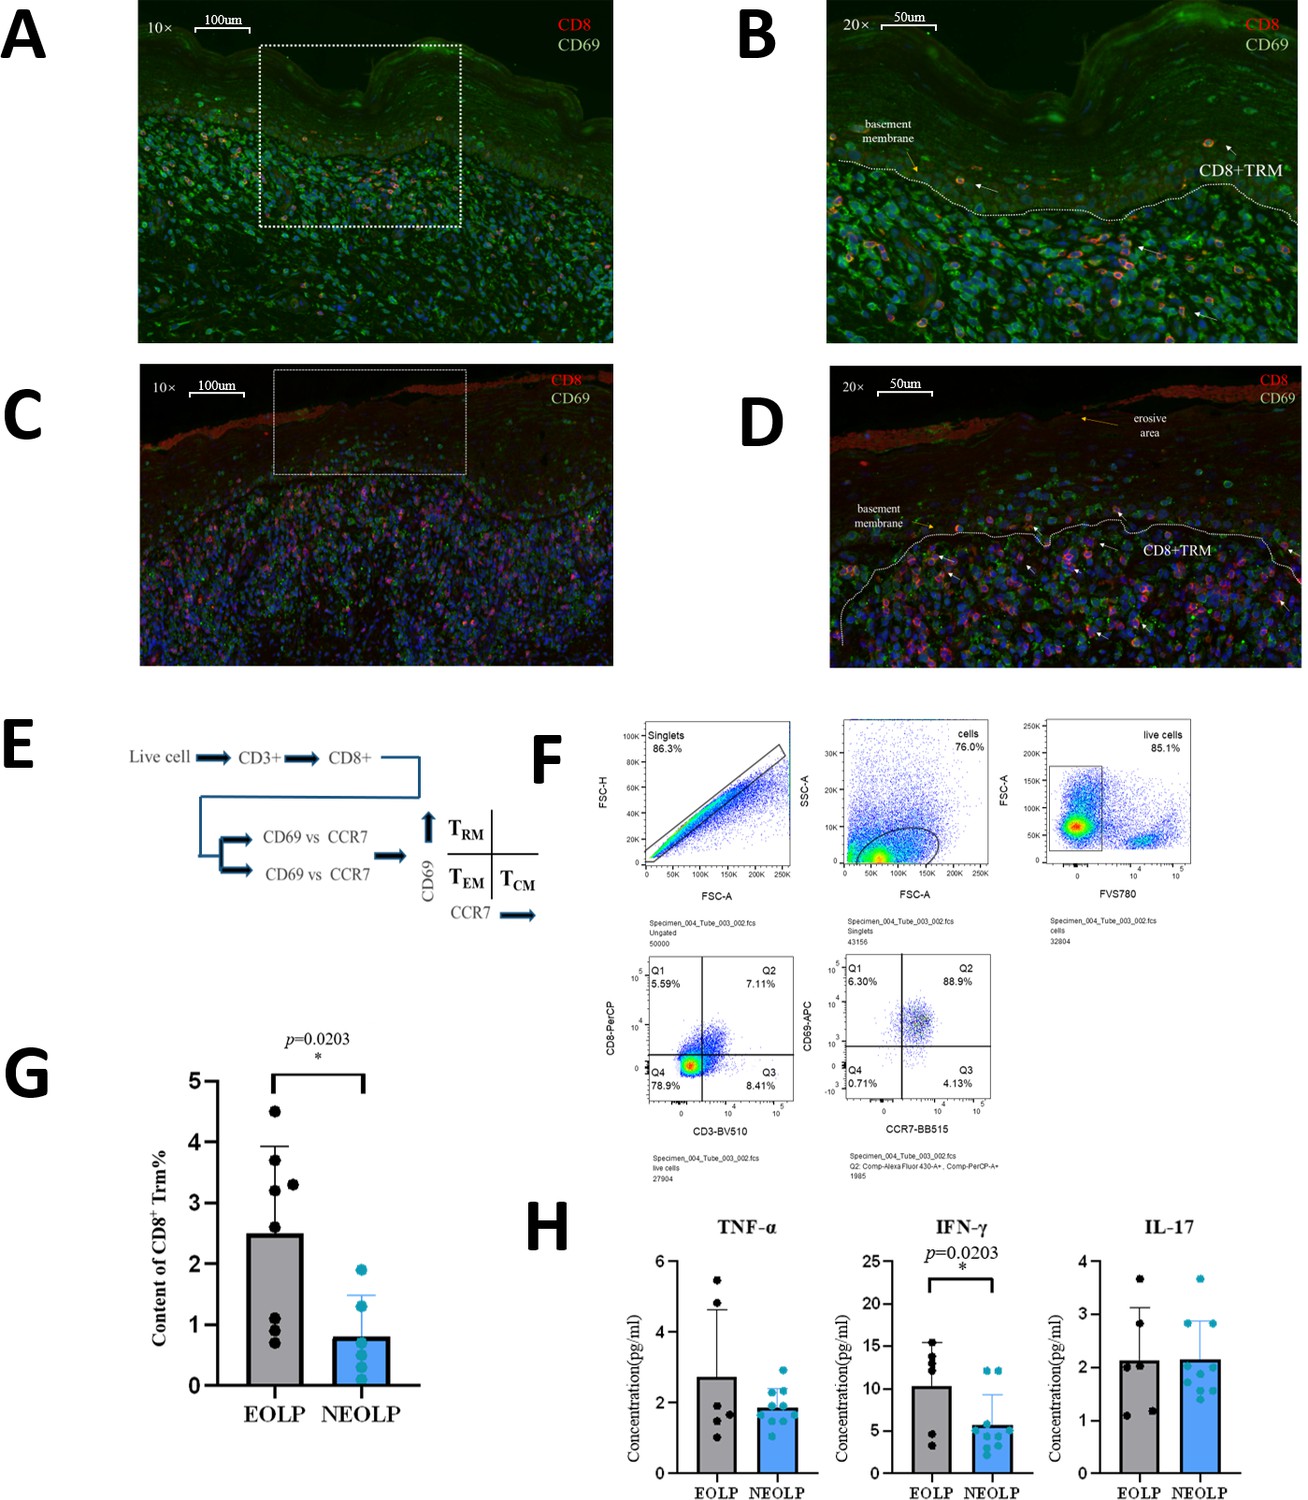
A high level of CD8+Trm in erosive oral lichen planus (EOLP) is closely related to the basement membrane and directly affects oral lichen planus’s (OLP) clinical manifestations through active secretion.
(A, B) Immunofluorescence images of CD8+ Trm cells in non-erosive oral lichen planus (NEOLP; the white dotted line is the basement membrane, and the red arrow points to the CD8+ TRM cells). (C, D) Immunofluorescence images of CD8+ Trm cells in EOLP (the white dotted line is the basement membrane, and the red arrow points to the CD8+ Trm cells). (E) Schematic diagram of CD8+ Trm sorting by flow cytometry. (F) Image of sorting CD8+ Trm flow cytometry and gating strategy. (G) Comparison of the proportion of CD8+ Trm in NEOLP versus EOLP. (H) Enzyme-linked immunosorbent assay (ELISA) detection results of CD8+ TRM secreting TNF-α, IFN-γ, and IL17 in NEOLP versus EOLP.
-
Figure 5—source data 1
CD8+ Trm content in EOLP and NEOLP by flow cytometry.
- https://cdn.elifesciences.org/articles/83981/elife-83981-fig5-data1-v2.xlsx
-
Figure 5—source data 2
ELIASA detection of CD8+ Trm secreted TNF-α, IFN-γ and IL17 contents in EOLP and NEOLP.
- https://cdn.elifesciences.org/articles/83981/elife-83981-fig5-data2-v2.xlsx
Tables
Table 1
Analysis of clinical variables in different clinical types of oral lichen planus (OLP).
| Factors | NEOLP | EOLP | t/c2 | p |
|---|---|---|---|---|
| Gender | 0.129 | 0.72 | ||
| Female | 15 | 8 | ||
| Male | 12 | 5 | ||
| Age (years) | 39.07 ± 11.34 | 45.08 ± 12.86 | −1.502 | 0.348 |
| Smoking | 0.559 | 0.455 | ||
| Yes | 7 | 2 | ||
| No | 20 | 11 | ||
| Drinking | 0.44 | 0.507 | ||
| Yes | 9 | 3 | ||
| No | 18 | 10 | ||
| VAS scoring | 1.41 ± 0.89 | 2.46 ± 1.391 | −2.91 | 0.341 |
| Course of disease (months) | 14.85 ± 27.932 | 23.38 ± 43.065 | −0.755 | 0.12 |
Table 2
Logistic regression analysis of CD8+ Trm core transcriptome in different oral lichen planus (OLP) clinical types and clinical outcomes.
| Gene | OLP clinical types | OLP clinical outcomes | ||
|---|---|---|---|---|
| p | OR (95% CI) | p | OR (95% CI) | |
| ITGA1 | 0.006* | 2.009 (1.221, 3.307) | 0.017* | 1.814 (1.114, 2.954) |
| LITAF | 0.011* | 1.197 (1.041, 1/376) | 0.026* | 1.169 (1.019, 1.342) |
| CD69 | 0.057 | 1.337 (0.991, 1.804) | 0.026* | 1.846 (1.076, 3.168) |
| SKIL | 0.006* | 1.868 (1.197, 2.914) | 0.046* | 1.482 (1.006, 2.182) |
| GZMB | 0.05 | 1.281 (1.000, 1.641) | 0.041* | 1.370 (1.012, 1.854) |
| IL17RA | 0.025* | 1.943 (1.087, 3.471) | 0.036* | 3.270 (1.084, 9.867) |
| IFNG | 0.237 | 1.467 (0.777, 2.768) | 0.412 | 1.392 (0.632, 3.067) |
| IFNGR1 | 0.086 | 1.156 (0.980, 1.365) | 0.015* | 1.386 (1.067, 1.801) |
| IFNAR1 | 0.005* | 1.987 (1.237, 3.191) | 0.022* | 1.601 (1.069, 2.399) |
| TNFRSF6B | 0.011* | 1.221 (1.047, 1.425) | 0.05 | 1.104 (1.000, 1.218) |
| RUNX1 | 0.009* | 1.703 (1.139, 2.545) | 0.07 | 1.283 (0.980, 1.682) |
| IL23A | 0.395 | 1.730 (0.489, 6.119) | 0.015* | 9.971 (1.555, 63.950) |
-
*p < 0.05; **p < 0.01; ***p < 0.001.
Table 3
Analysis of clinical variables in different clinical outcomes of oral lichen planus (OLP).
| Factors | Persistent non-erosion | Recurrent erosion | t/c2 | p |
|---|---|---|---|---|
| Gender | 0.034 | 0.853 | ||
| Female | 17 | 6 | ||
| Male | 13 | 4 | ||
| Age (years) | 39.07 ± 12.71 | 45.00 ± 9.09 | −1.214 | 0.161 |
| Smoking | 1.195 | 0.274 | ||
| Yes | 8 | 1 | ||
| No | 22 | 9 | ||
| Drinking | 0 | 1 | ||
| Yes | 9 | 3 | ||
| No | 21 | 7 | ||
| VAS scoring | 1.57 ± 0.97 | 2.30 ± 1.57 | −1.76 | 0.213 |
| Course of disease (months) | 17.63 ± 32.90 | 17.60 ± 36.20 | 0.003 | 0.965 |
| Diagnosis | 8.547 | 0.003* | ||
| NEOLP | 24 | 3 | ||
| EOLP | 6 | 7 | ||
| Medication | 5 | 0.082 | ||
| Glucocorticoids | 15 | 1 | ||
| Glucocorticoids + immunosuppressant | 10 | 6 | ||
| Other drugs | 5 | 3 |
-
*p < 0.05; **p < 0.01; ***p < 0.001.
Additional files
-
Supplementary file 1
Gene lists and quantification data for OLP and CD8+ Trm subgroups, and spot numbers of each sample in ST.
- https://cdn.elifesciences.org/articles/83981/elife-83981-supp1-v2.docx
-
MDAR checklist
- https://cdn.elifesciences.org/articles/83981/elife-83981-mdarchecklist1-v2.docx
Download links
A two-part list of links to download the article, or parts of the article, in various formats.
Downloads (link to download the article as PDF)
Open citations (links to open the citations from this article in various online reference manager services)
Cite this article (links to download the citations from this article in formats compatible with various reference manager tools)
CD8+ tissue-resident memory T cells induce oral lichen planus erosion via cytokine network
eLife 12:e83981.
https://doi.org/10.7554/eLife.83981


