Immunopeptidomics reveals determinants of Mycobacterium tuberculosis antigen presentation on MHC class I
- Department of Biological Engineering, Massachusetts Institute of Technology, United States
- Ragon Institute of Massachusetts General Hospital, Harvard, and MIT, United States
- Koch Institute for Integrative Cancer Research, United States
- Center for Precision Cancer Medicine, United States
Figures
Figure 1 with 8 supplements
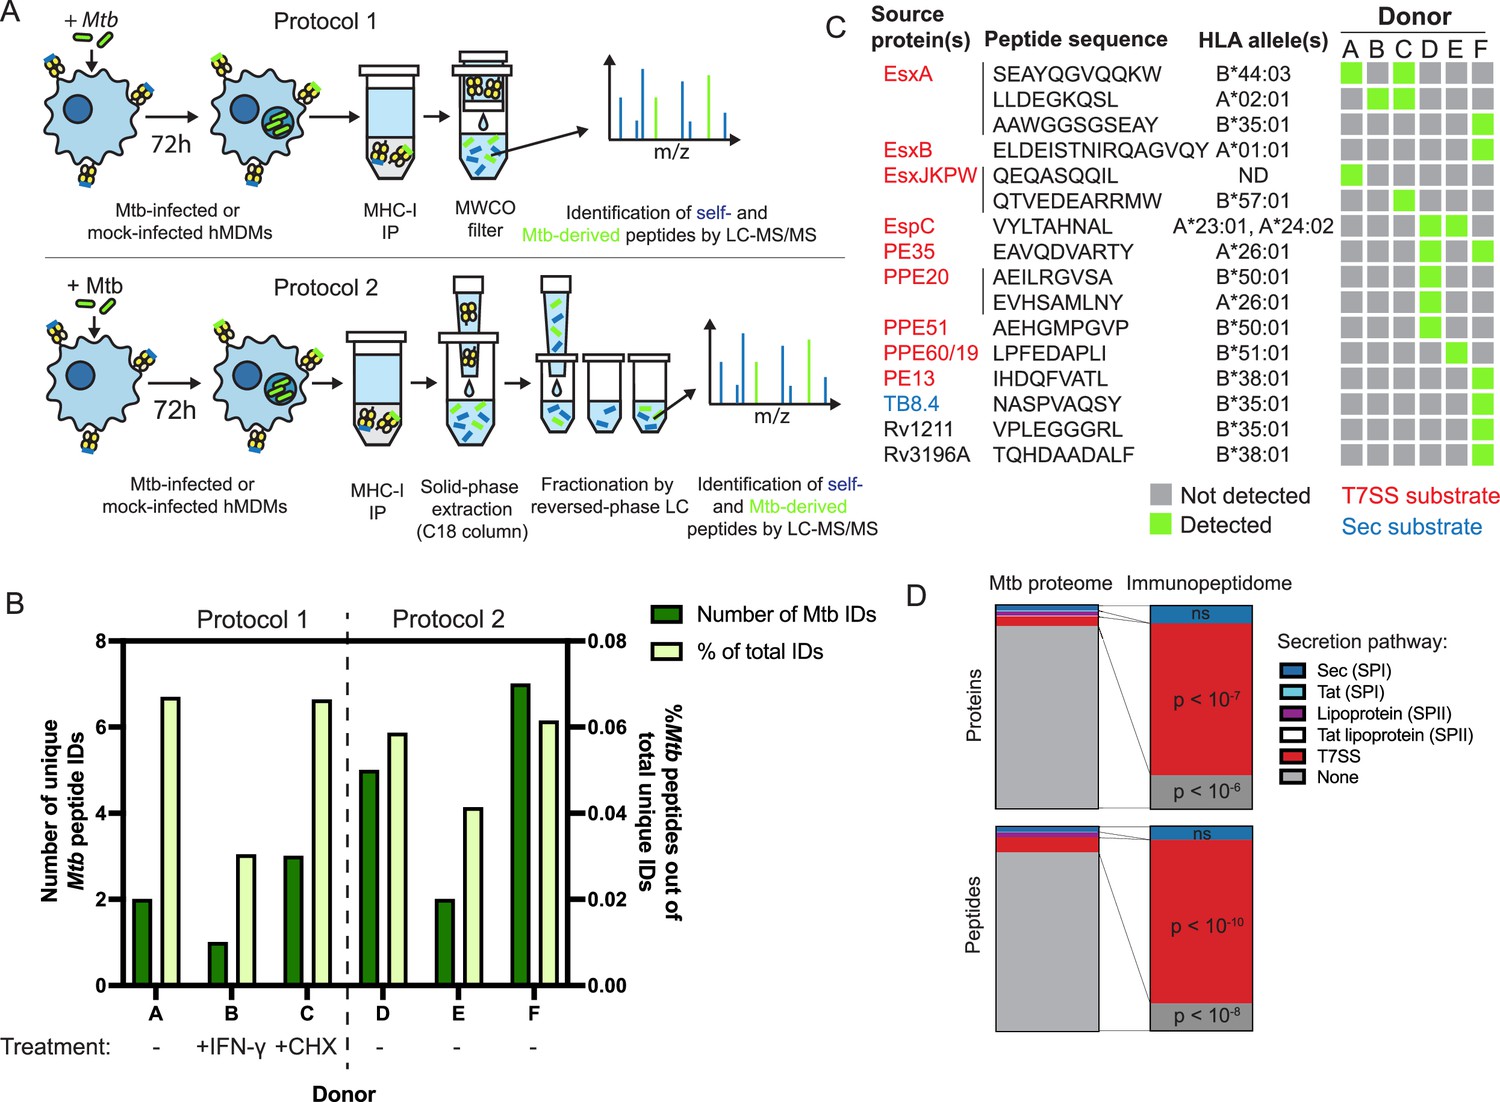
The MHC-I immunopeptidome of Mtb-infected human macrophages is enriched for T7SS substrates.
(A) Schematic representation of two immunopeptidomics workflows used to profile the MHC-I repertoire of Mtb-infected primary human macrophages. IP: immunoprecipitation. MWCO: molecular weight cutoff. LC-MS/MS: liquid chromatography coupled to tandem mass spectrometry. (B) Absolute and relative number of Mtb-derived MHC-I peptides identified for each donor. Macrophages from donor B were pre-treated for 24 hr with 10 ng/mL IFN-γ, and macrophages from donor C were treated with 0.5 µg/mL cycloheximide (CHX) for the final 6 hr of infection. (C) Sequences, source proteins, associated HLA alleles, and donors for each validated Mtb-derived MHC-I peptide. (D) Enrichment analysis of Mtb peptides presented on MHC-I and their source proteins, categorized by protein secretion pathway using SignalP 6.0 (Teufel et al., 2022) and a curated set of known or strongly suspected T7SS substrates. p-Values for enrichment analyses of proteins and peptides were determined using the binomial test and the hypergeometric test respectively (see Methods).
-
Figure 1—source data 1
Source data for enrichment analysis.
- https://cdn.elifesciences.org/articles/84070/elife-84070-fig1-data1-v2.zip
Figure 1—figure supplement 1
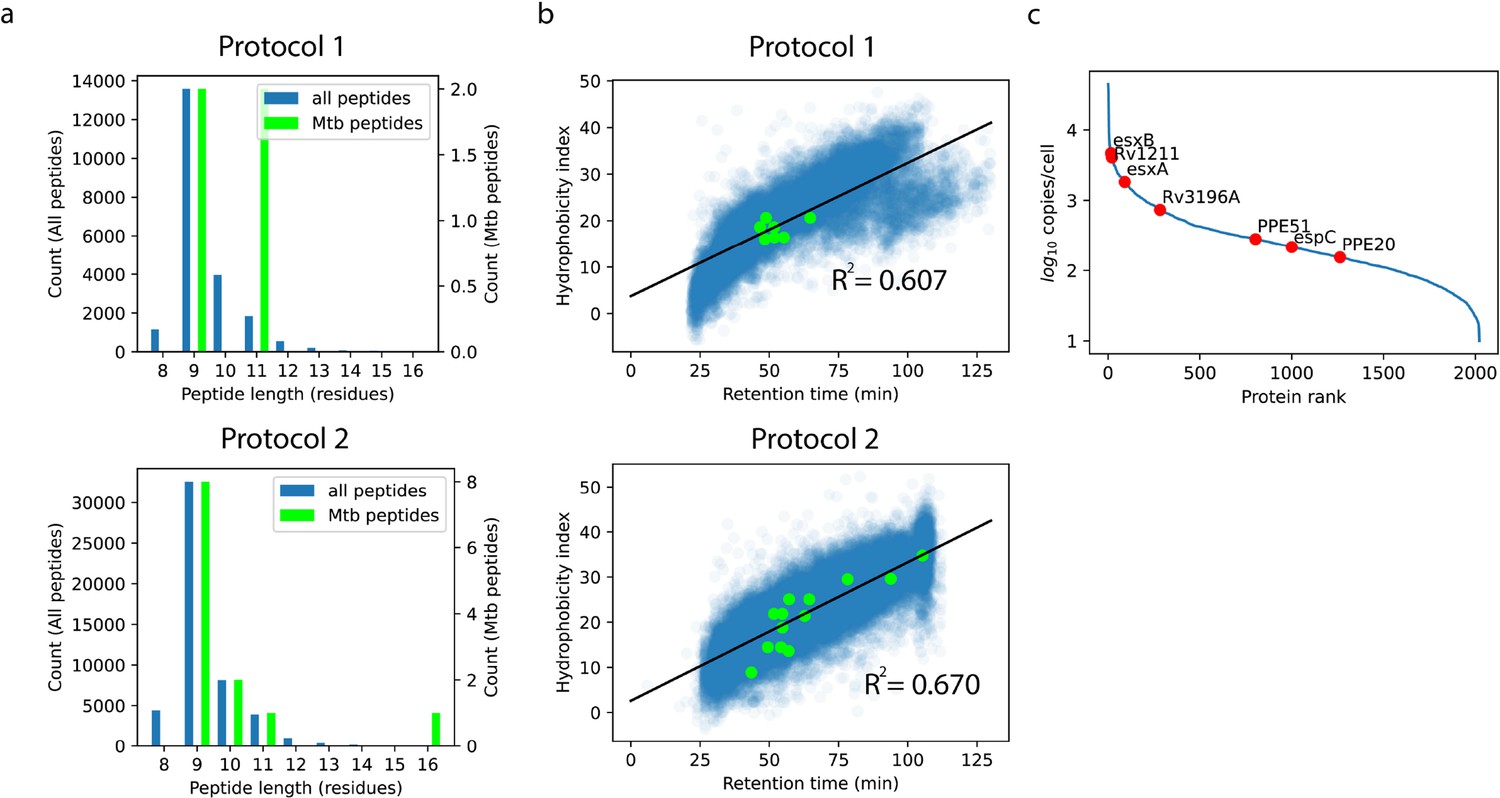
Performance of two BSL-3 compatible MHC-I immunopeptidomics workflows.
(A) Length distribution of MHC-I peptides identified by MS for protocol 1 and protocol 2 (see Figure 1A and Methods), for all detected peptides and validated Mtb-derived peptides. (B) Predicted hydrophobicity index (computed using the ProtViz R package; https://rdrr.io/cran/protViz/man/ssrc.html) as a function of retention time for protocols 1 and 2. Green points indicate validated Mtb peptides. (C) Absolute Mtb protein abundance in axenic culture as a function of protein rank, as quantified by Schubert et al., 2015. Red points indicate source proteins of peptides detected in the MHC-I repertoire of Mtb-infected macrophages (see Figure 1c).
Figure 1—figure supplement 2
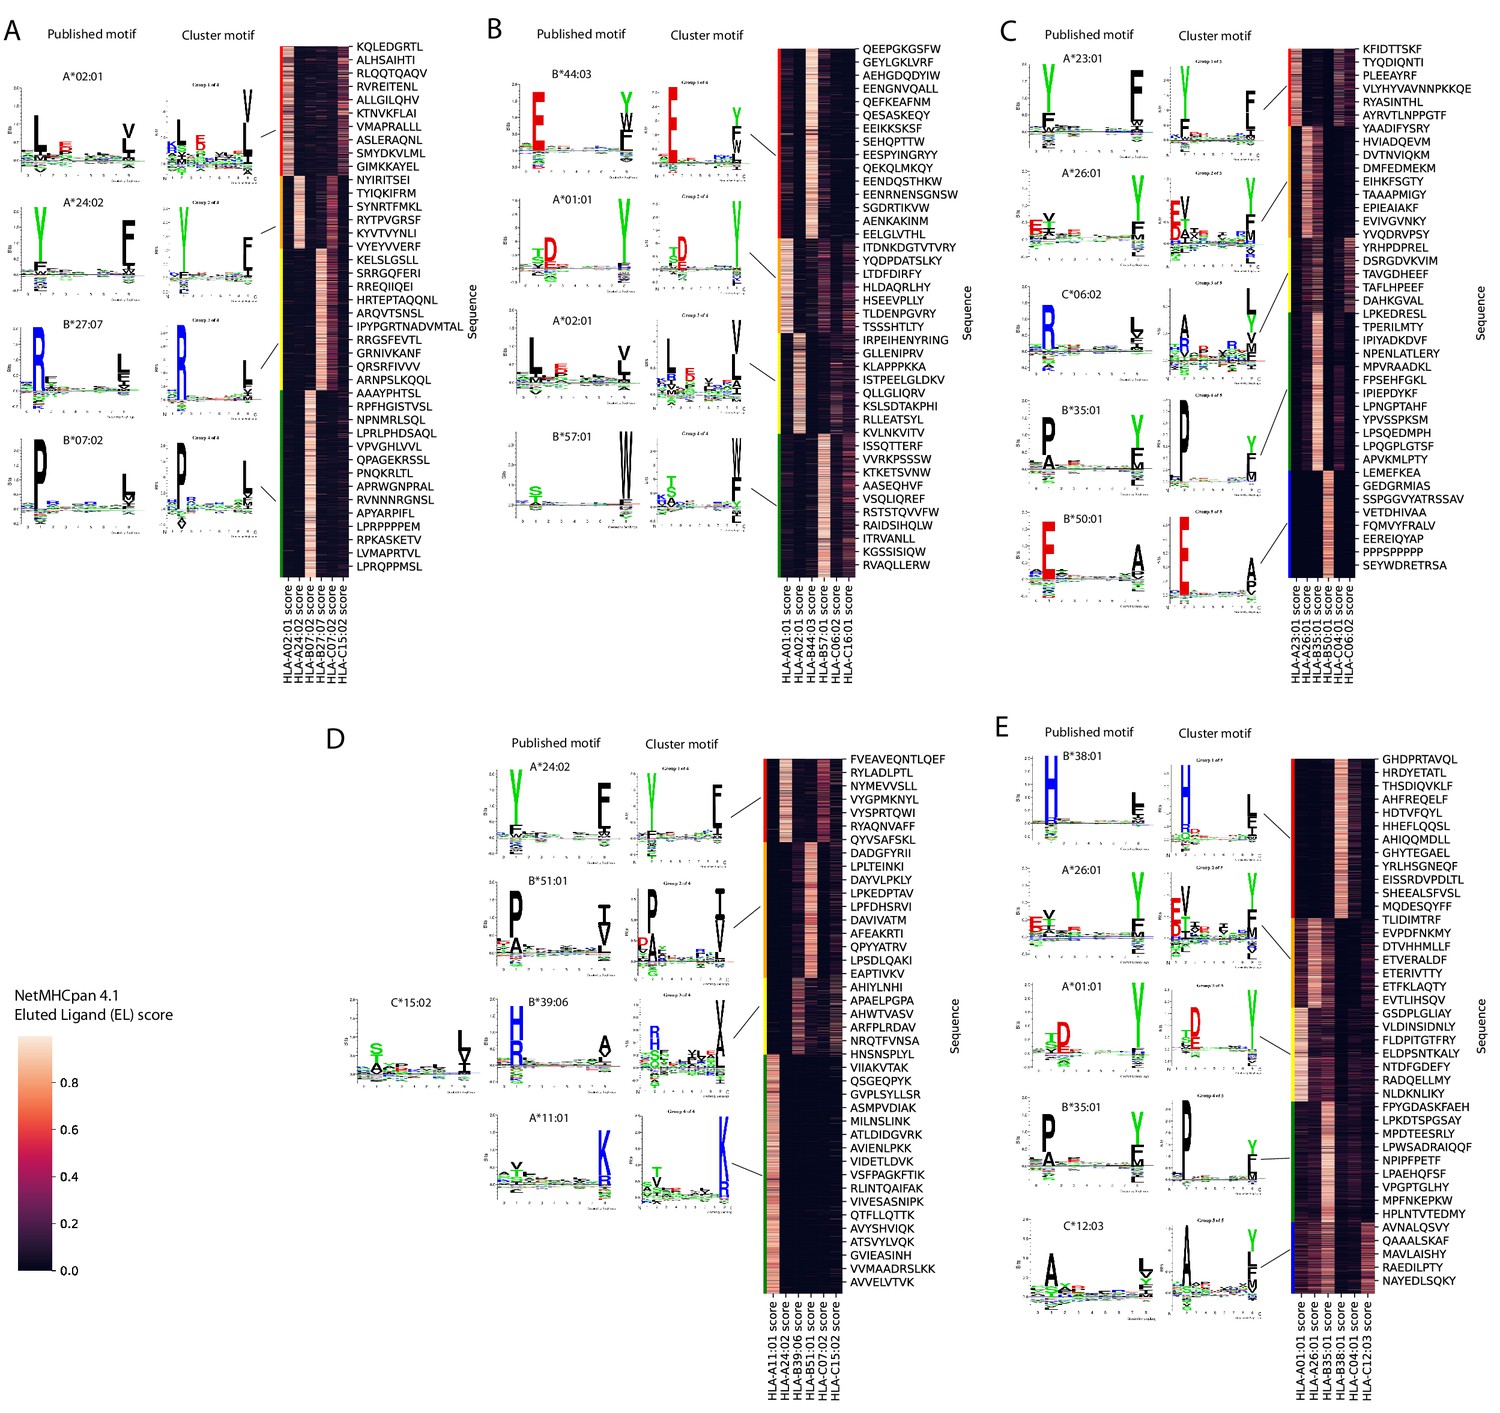
Gibbs clustering groups MHC-I peptides into clusters that correspond to HLA alleles expressed by each donor.
Heatmap of peptide binding score predicted by NetMHCpan 4.1, Gibbs clustering motif, and corresponding published binding motif for each HLA allele expressed by (A) donor B, (B) donor C, (C) donor D, (D) donor E, (E) donor F.
Figure 1—figure supplement 3
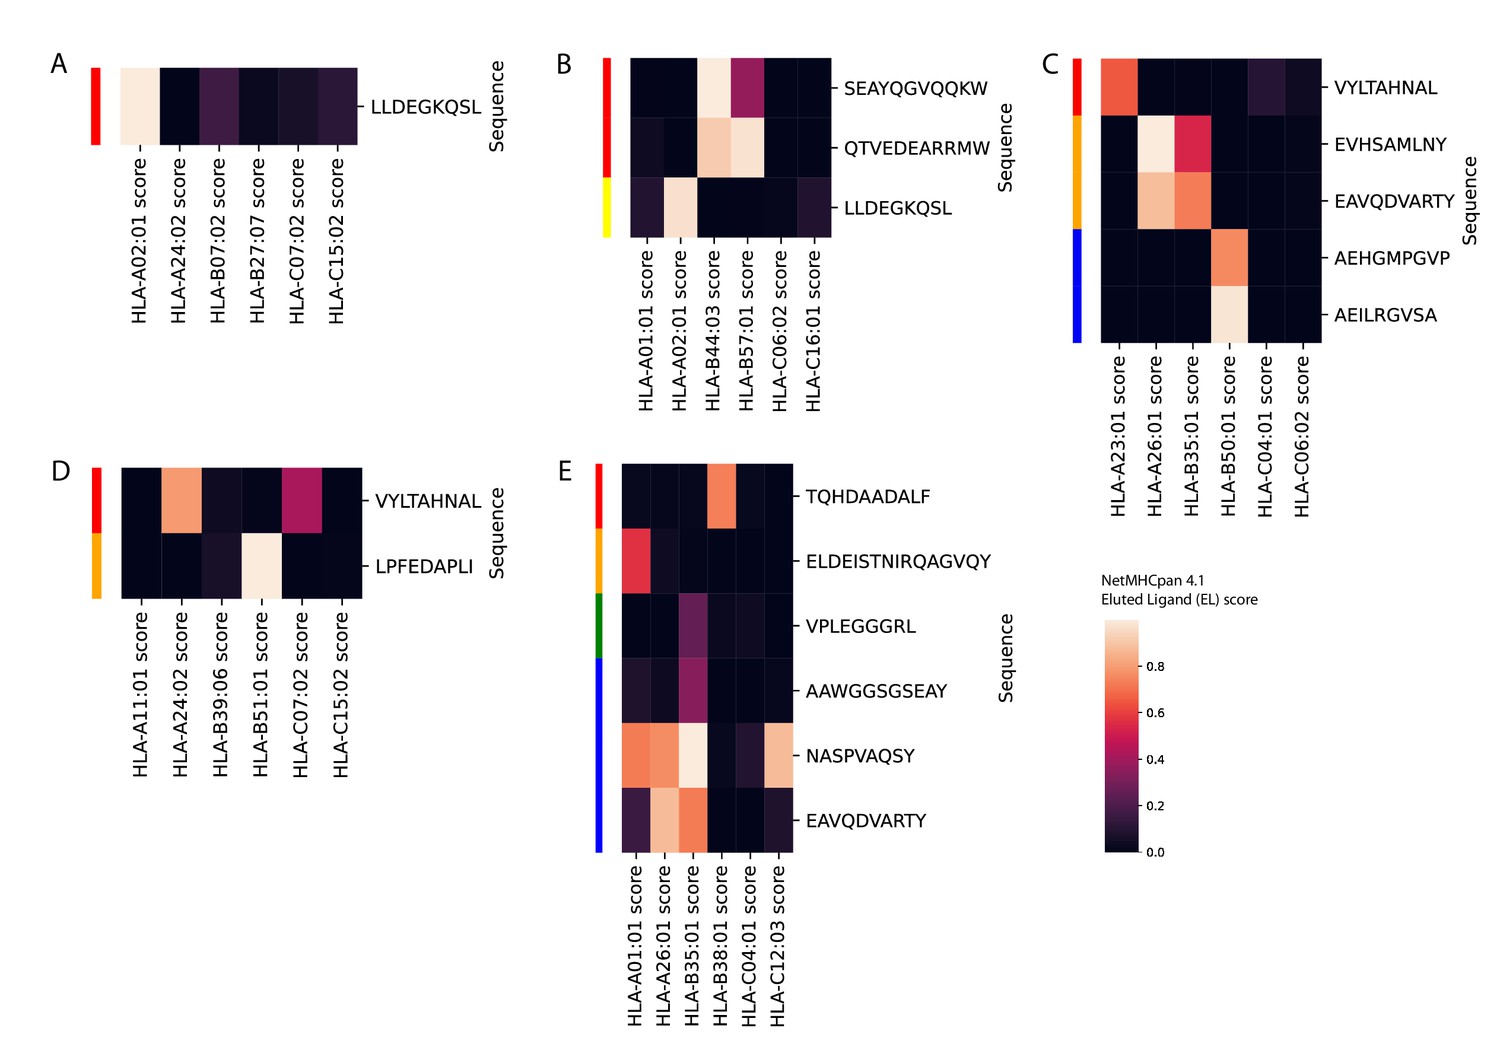
Predicted class I HLA binding of Mtb-derived MHC-I peptides.
Heatmap of peptide binding score predicted by NetMHCpan 4.1 for Mtb-derived peptides for each HLA allele expressed by (A) donor B, (B) donor C, (C) donor D, (D) donor E, (E) donor F. Label colors correspond to the clusters defined by Gibbs clustering of the full set of identified peptides (see Figure 1—figure supplement 2).
Figure 1—figure supplement 4
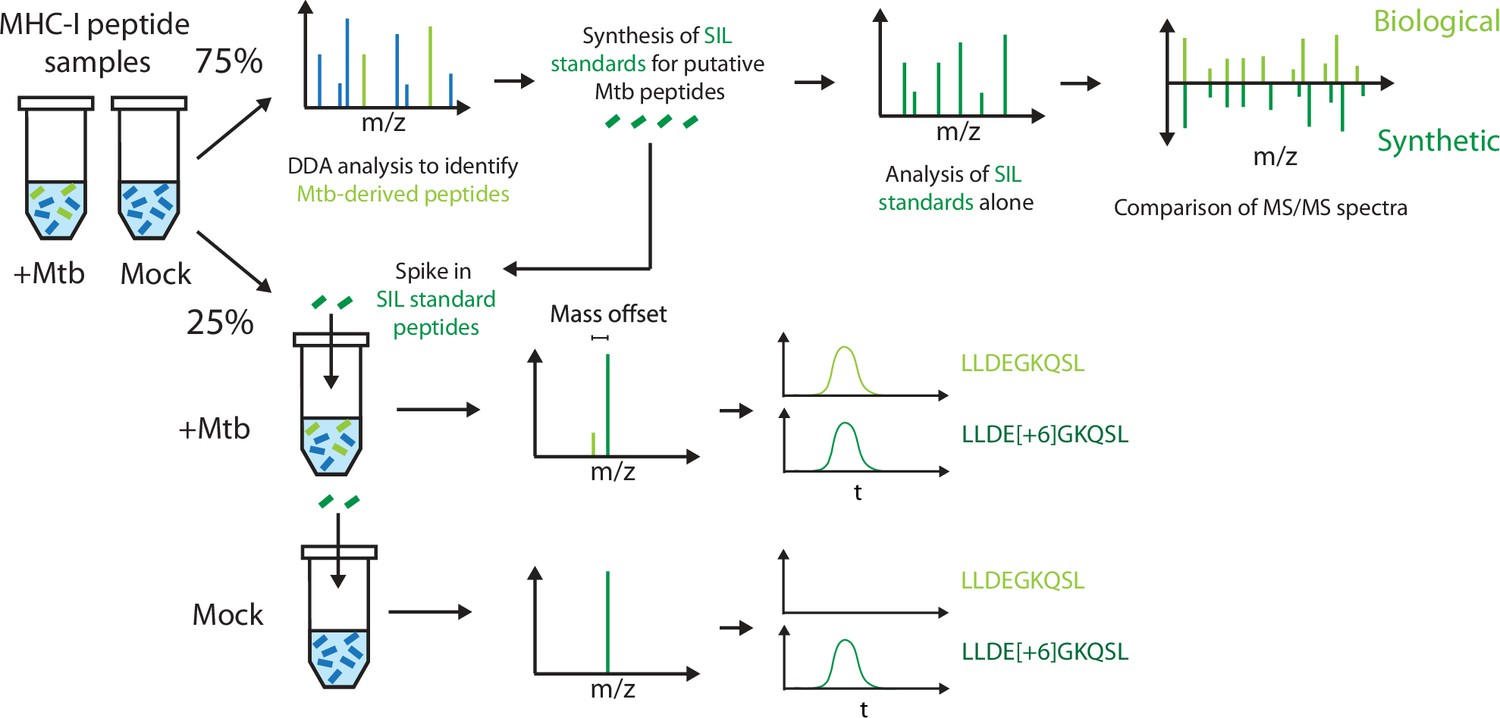
Workflow for validating Mtb-derived MHC-I peptide identifications by SureQuant.
Schematic showing how MHC-I peptide samples were divided between DDA-based discovery analyses (75%) and SureQuant-based validation analyses (25%). MS/MS spectra from survey analyses of mixtures of SIL peptide standards alone were compared to the MS/MS spectra of the corresponding biological peptides. Chromatograms demonstrating co-elution of biological peptides with the corresponding SIL standards were obtained by SureQuant.
Figure 1—figure supplement 5
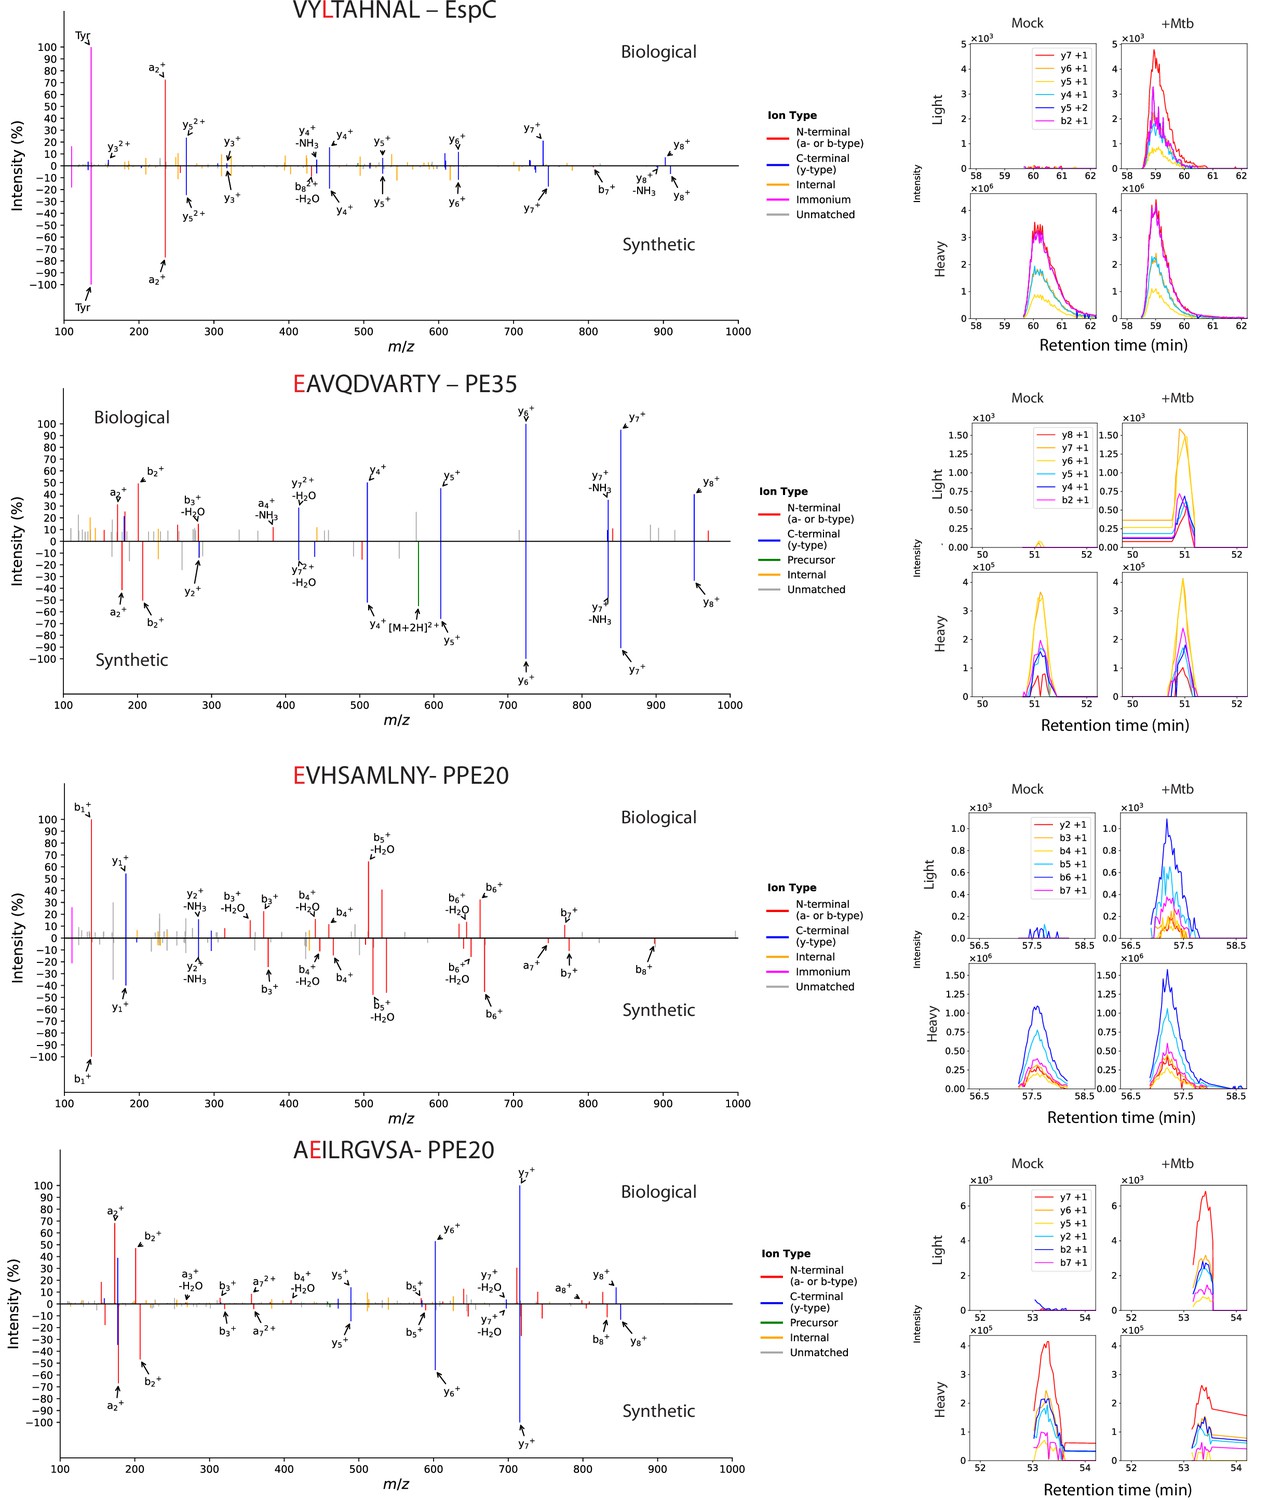
Validation of Mtb-derived MHC-I peptide identifications (VYLTAHNAL, EAVQDVARTY, EVHSAMLNY, AEILRGVSA).
Representative MS/MS spectrum comparisons (left) and SureQuant product ion chromatograms for Mtb-infected and mock-infected macrophages (right column) for each peptide. For each peptide, the amino acid that is stable isotope labeled in the synthetic standard is indicated in red.
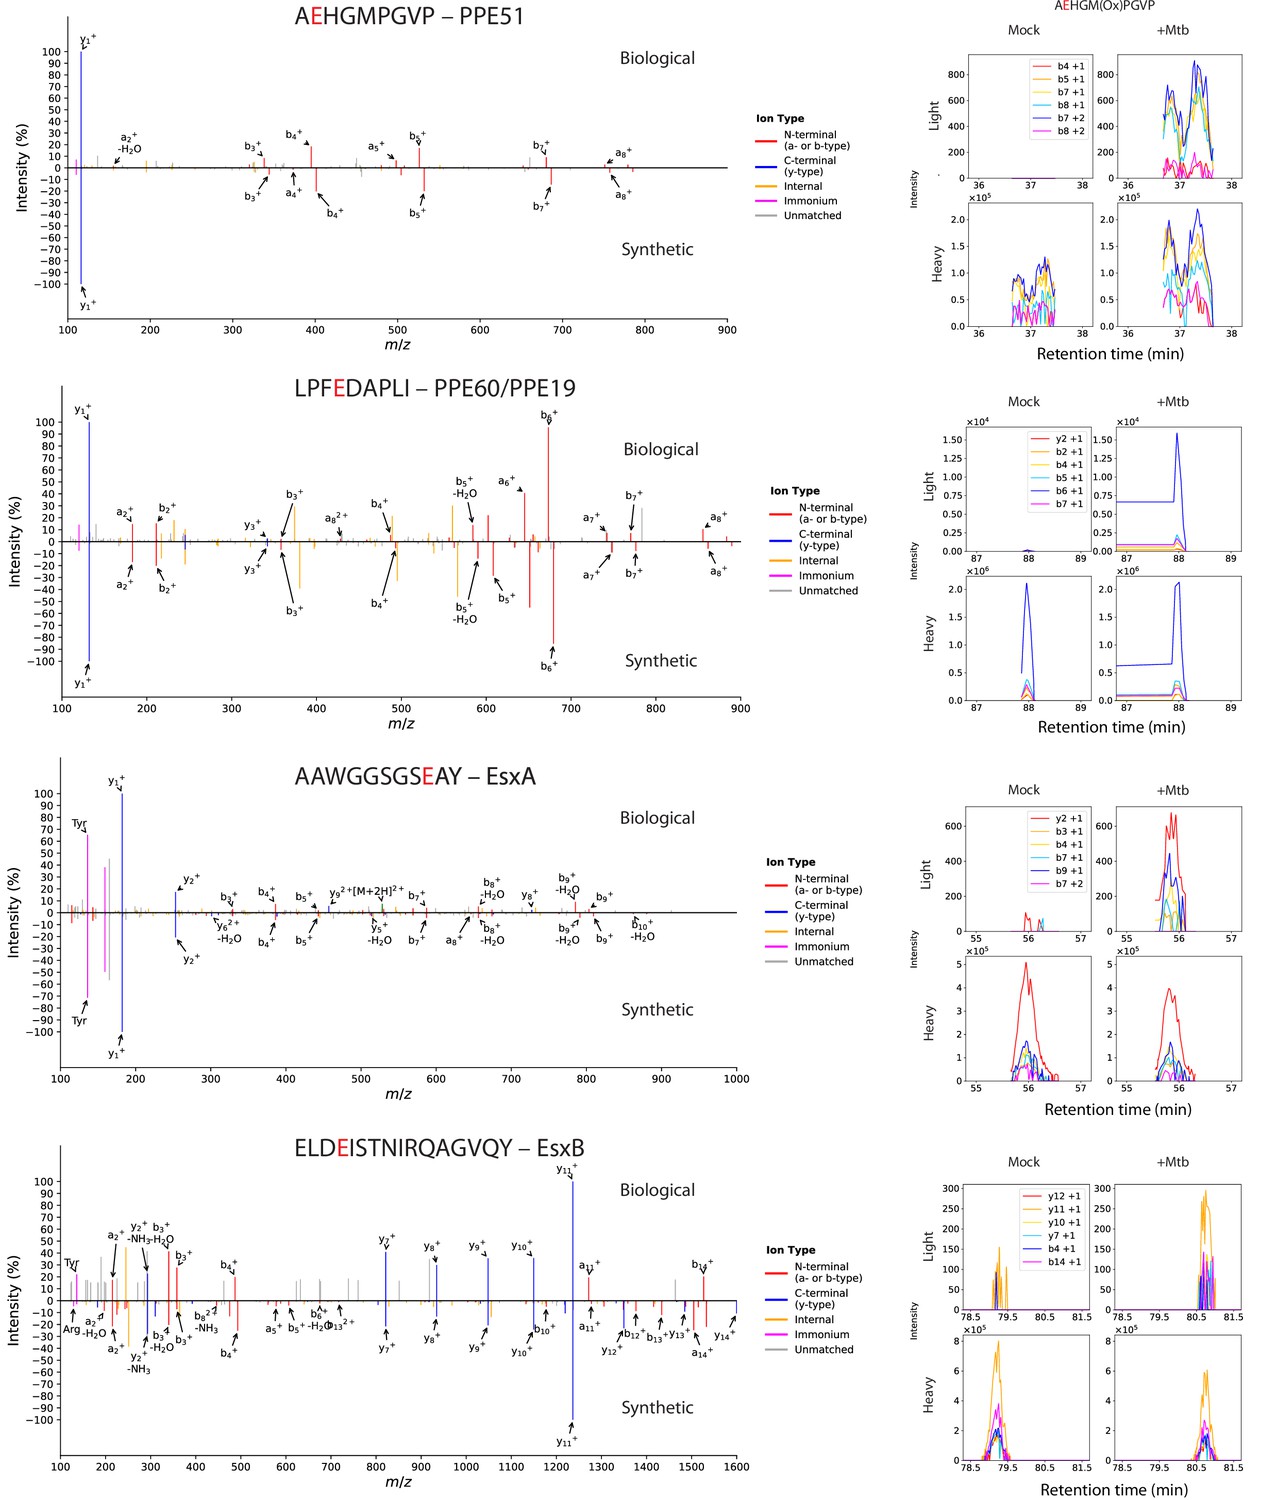
Figure 1—figure supplement 6
Validation of Mtb-derived MHC-I peptide identifications (AEHGMPGVP, LPFEDAPLI, AAWGGSGSEAY, ELDEISTNIRQAGVQY).
Representative MS/MS spectrum comparisons (left) and SureQuant product ion chromatograms for Mtb-infected and mock-infected macrophages (right column) for each peptide. For each peptide, the amino acid that is stable isotope labeled in the synthetic standard is indicated in red.
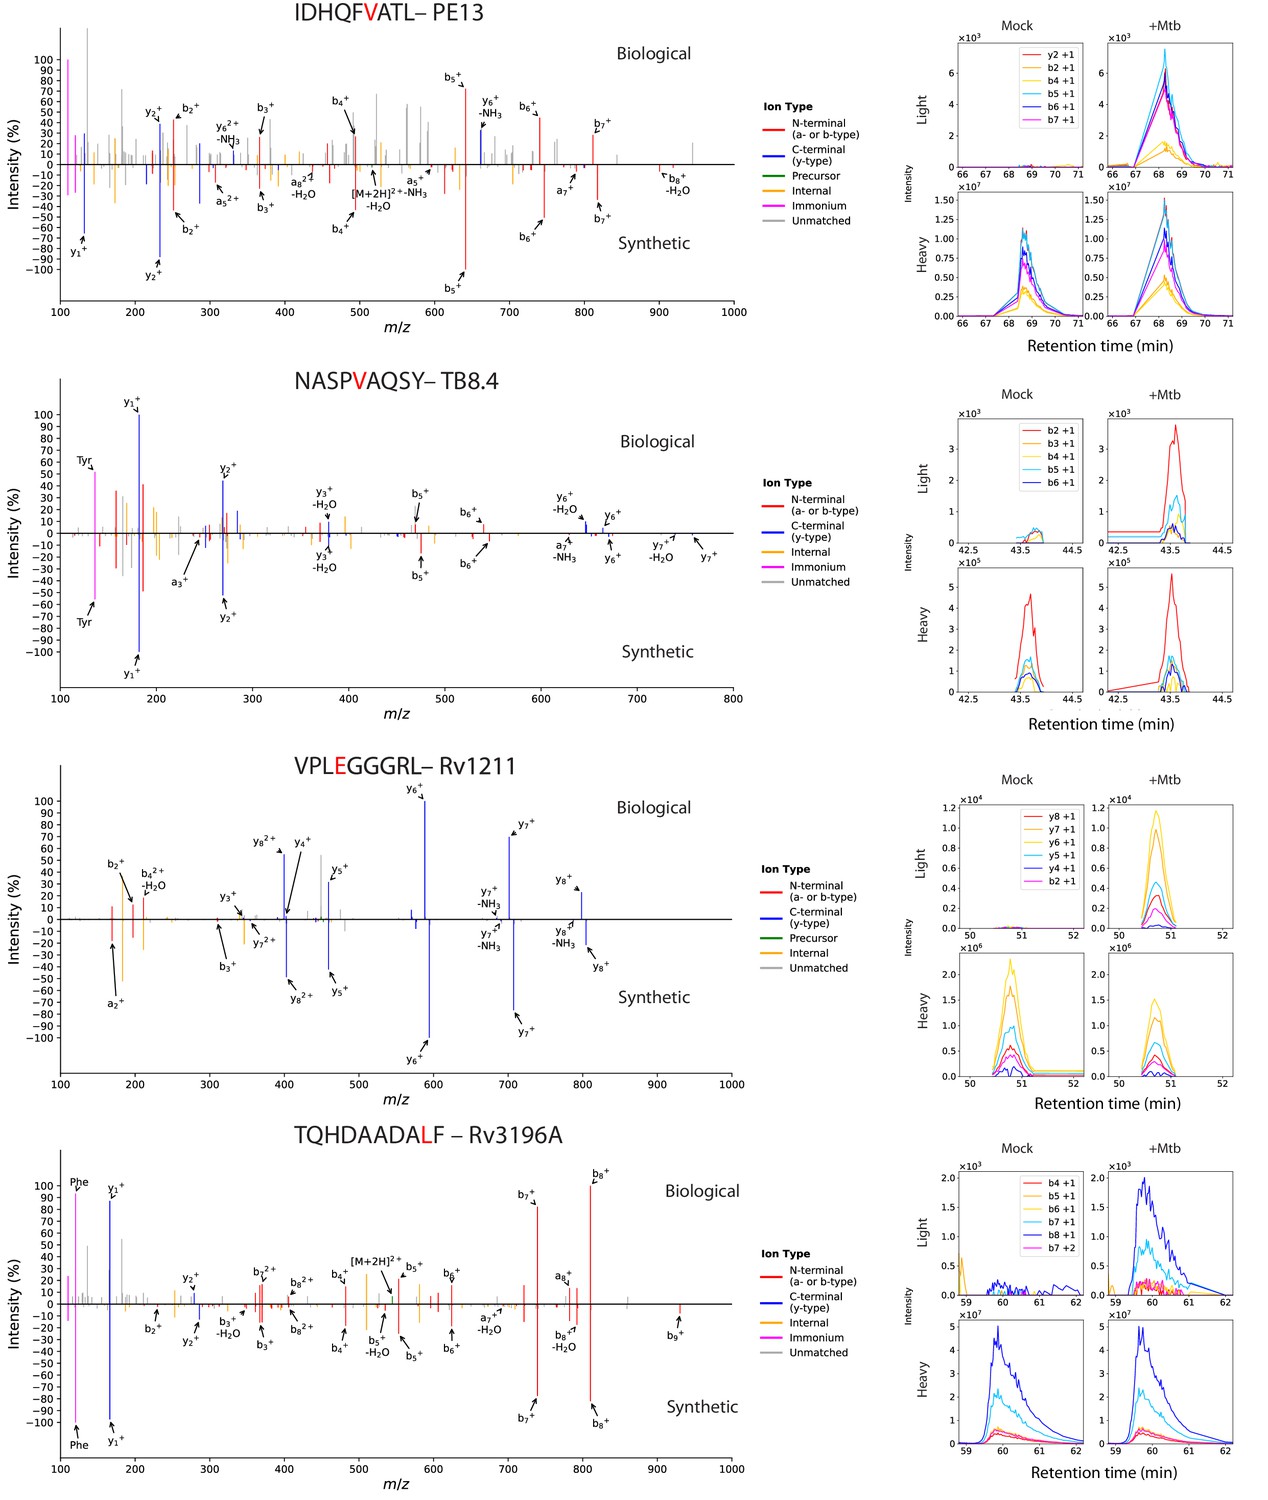
Figure 1—figure supplement 7
Validation of Mtb-derived MHC-I peptide identifications (IDHQFVATL, NASPVAQSY, VPLEGGGRL, TQHDAADALF).
Representative MS/MS spectrum comparisons (left) and SureQuant product ion chromatograms for Mtb-infected and mock-infected macrophages (right column) for each peptide. For each peptide, the amino acid that is stable isotope labeled in the synthetic standard is indicated in red.
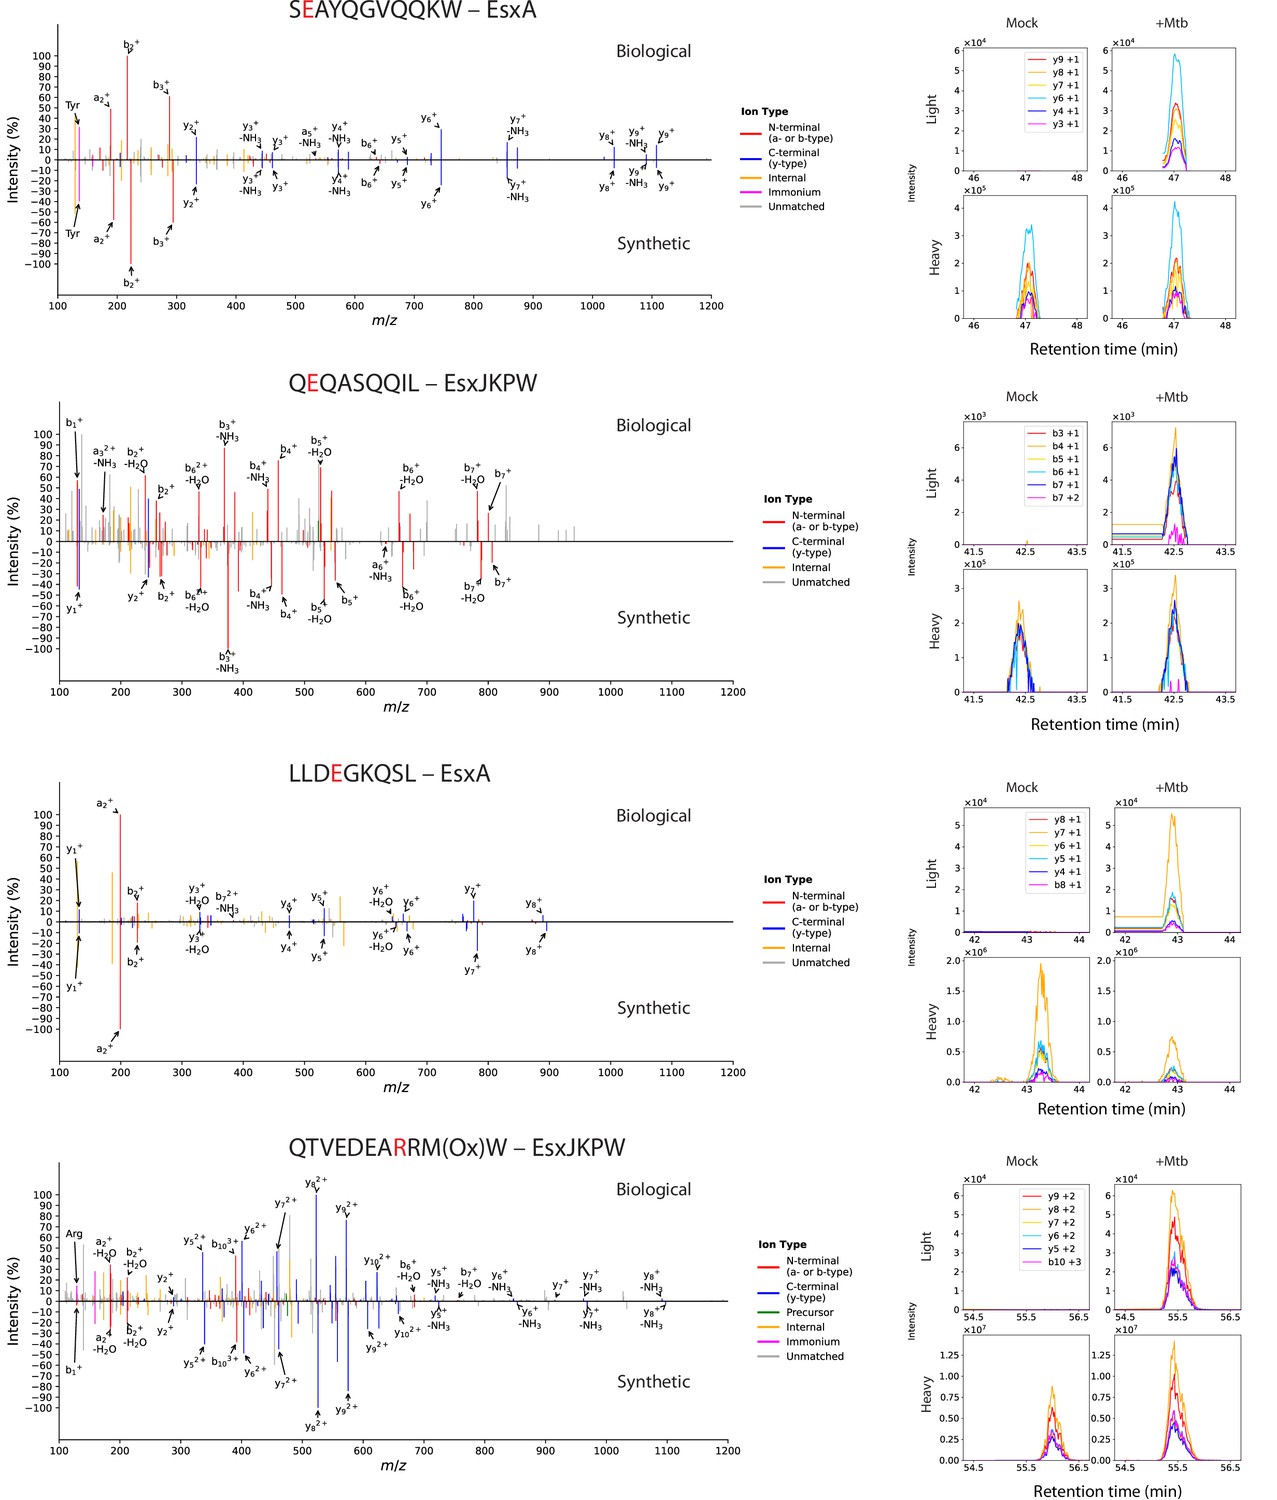
Figure 1—figure supplement 8
Validation of Mtb-derived MHC-I peptide identifications (SEAYQGVQQKW, QEQASQQIL, LLDEGKQSL, QTVEDEARRMW).
Representative MS/MS spectrum comparisons (left column) and SureQuant product ion chromatograms for Mtb-infected and mock-infected macrophages (right column) for each peptide. For each peptide, the amino acid that is stable isotope labeled in the synthetic standard is indicated in red.
Figure 2 with 1 supplement
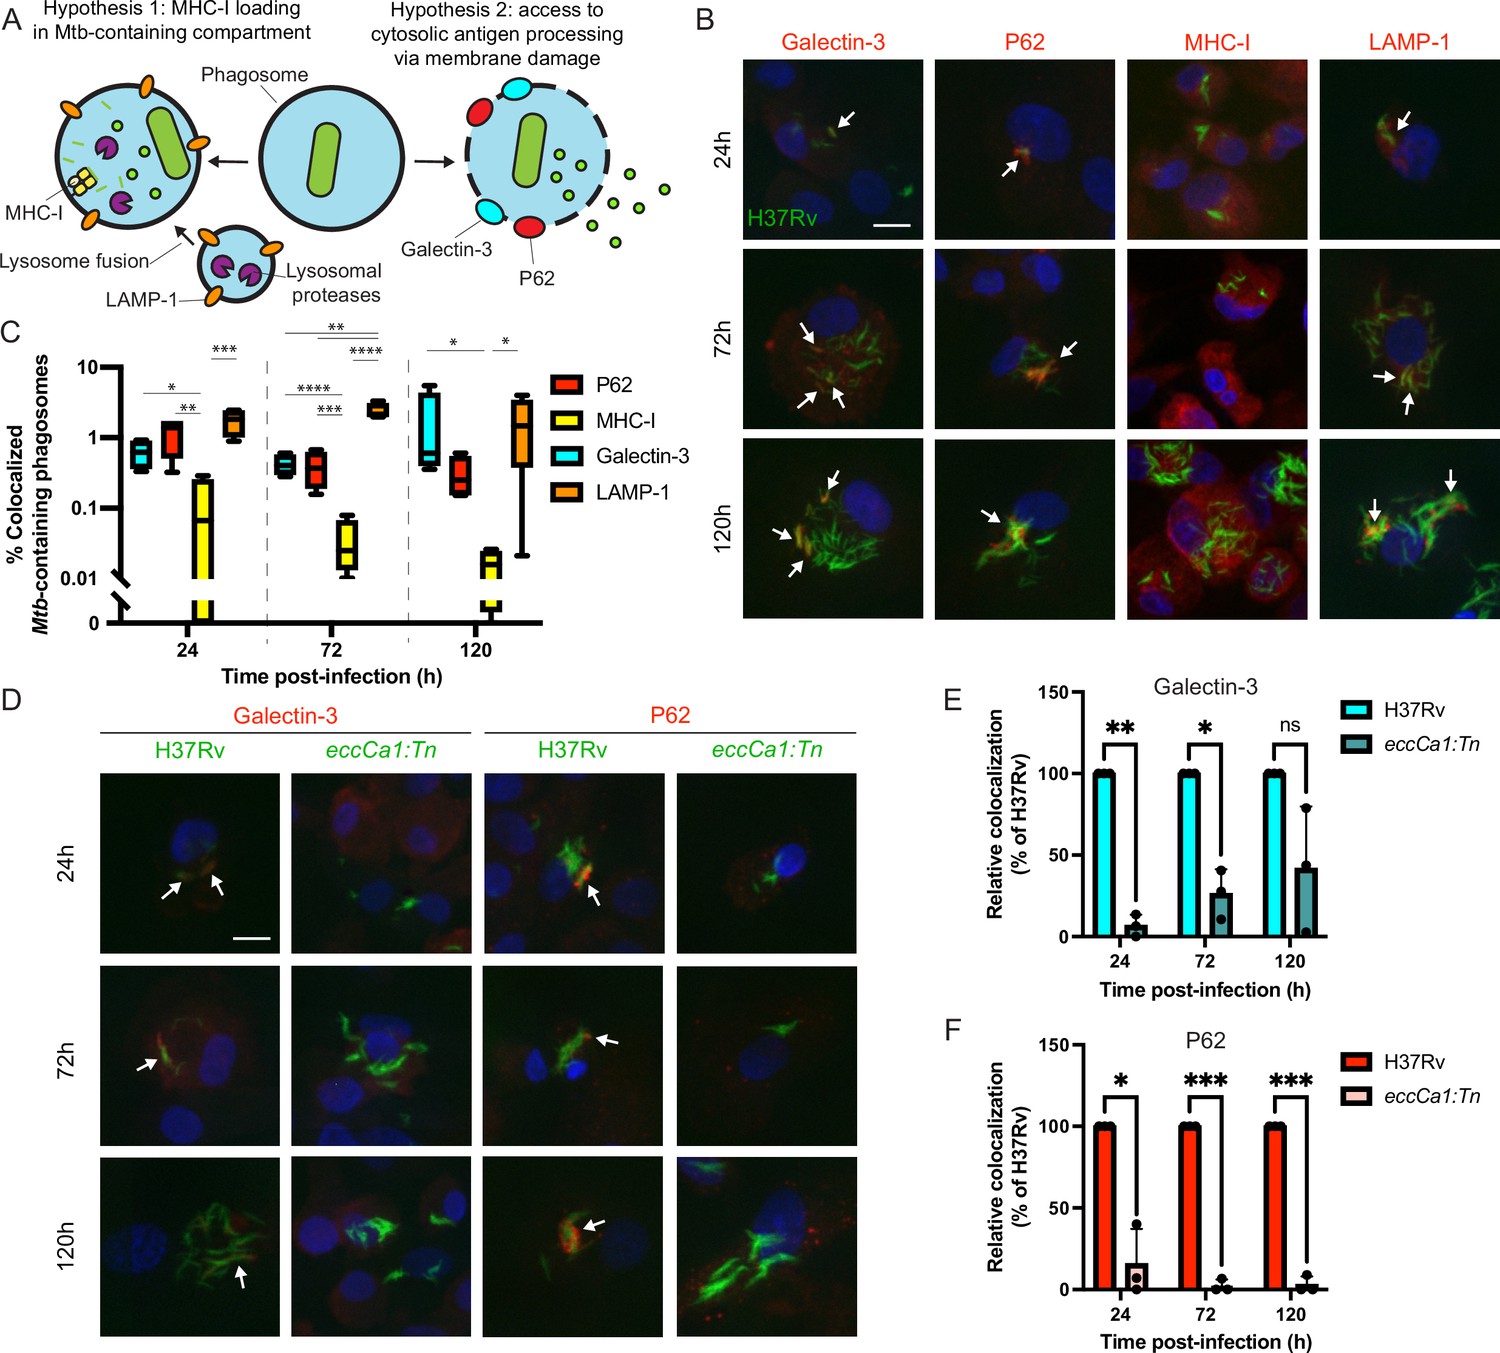
Mtb co-localizes with markers of phagosome membrane damage in an ESX-1-dependent manner and does not co-localize with MHC-I.
Primary human macrophages were infected with GFP-expressing wild-type Mtb, fixed at 24, 72, or 120 hr post-infection, stained by immunofluorescence (IF), and imaged by spinning-disk confocal microscopy. (A) Schematic showing markers associated with each of two possible pathways of Mtb antigen processing and presentation. (B) Representative images of Mtb-infected macrophages stained for Galectin-3, P62, MHC-I, or LAMP-1. Scale bar indicates 10 µm. White arrows indicate Mtb-containing phagosomes co-localizing with each marker. (C) Automated quantification (see Methods) of the proportion of co-localized Mtb-containing phagosomes for each marker for n=4 donors (* p<0.05, ** p<0.01, *** p<0.001, **** p<0.0001; one-way ANOVA with Tukey’s multiple comparisons test). (D) Representative images of macrophages infected with wild-type (H37Rv) or ESX-1-deficient (eccCa1:Tn) Mtb stained for Galectin-3 or P62. Scale bar indicates 10 µm. White arrows indicate Mtb-containing phagosomes co-localizing with each marker. (E–F) Automated quantification of the relative proportion of GFP +objects co-localized with IF staining for Galectin-3 (E) or P62 (F) as a function of time post-infection for n=3 donors, normalized to wild-type (H37Rv) (* p<0.05, ** p<0.01, *** p<0.001; paired t-test). Error bars indicate standard deviation.
-
Figure 2—source data 1
Single-channel images.
- https://cdn.elifesciences.org/articles/84070/elife-84070-fig2-data1-v2.zip
-
Figure 2—source data 2
Colocalization quantification source data.
- https://cdn.elifesciences.org/articles/84070/elife-84070-fig2-data2-v2.zip
Figure 2—figure supplement 1
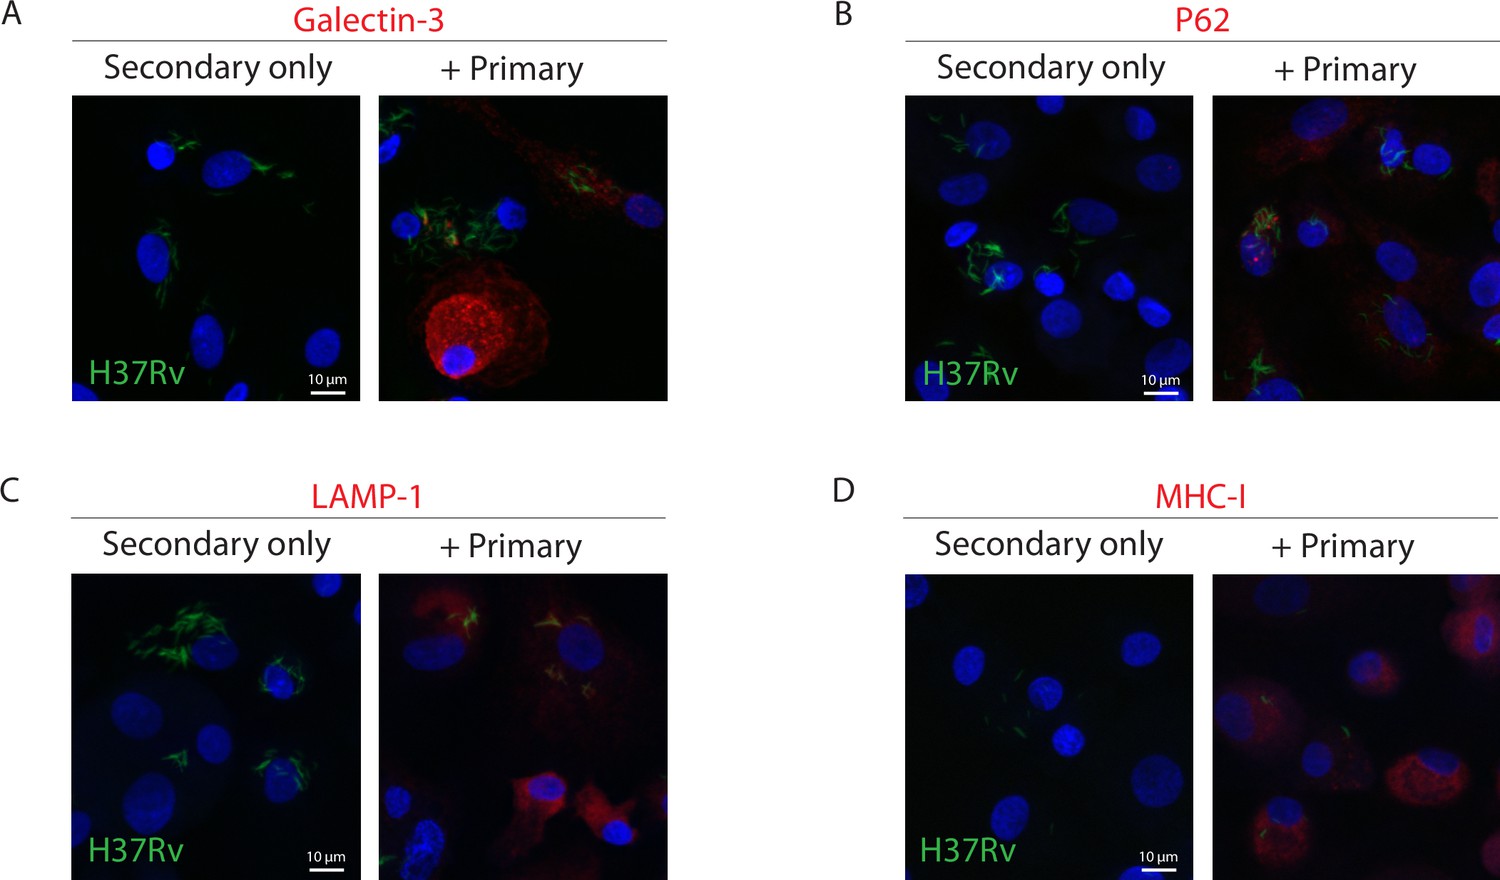
Immunofluorescence staining for Galectin-3, P62, LAMP-1, and MHC-I is specific.
Representative spinning disk confocal microscopy images comparing macrophages stained with primary antibody specific for galectin-3 (A), P62 (B), LAMP-1 (C), or MHC-I (D) to those stained with secondary antibody alone, 120 hr post-infection.
Figure 3 with 1 supplement

ESX-1 activity is required for presentation of EsxA28-36 and EsxJKPW24-34 on MHC-I, independently of type I interferon signaling.
(A) Schematic representation of the localization of EsxA and EsxJKPW in macrophages infected with wild-type Mtb H37Rv or the ESX-1-deficient eccCa1:Tn transposon mutant. (B) Schematic showing our workflow for targeted detection and quantification of Mtb-derived MHC-I peptides by SureQuant, using stable isotope labeled peptide-MHC complexes (hipMHCs) as internal standards. SIL: stable isotope labeled. (C) Relative quantification of EsxA28-36 and EsxJKPW24-34 by SureQuant in macrophages infected with no Mtb (mock), wild-type Mtb H37Rv, or eccCa1:Tn for n=3 donors (all HLA-A*02:01+, HLA-B*57:01+). As oxidation of methionine is common during sample handling, both the oxidized and non-oxidized form of EsxJKPW24-34 were quantified. (D) Luminescence as a function of time measured for macrophages infected with luciferase-expressing Mtb, in a wild-type H37Rv or eccCa1:Tn background, with or without the addition of 10 ng/mL IFN-β in the culture media. Addition of 25 µg/mL rifampicin (RIF) to the culture media was used as a control showing reduced luminescence with bacterial death. Data points and error bars represent the mean and standard deviation of n=3 donors, each of which represents the mean of three technical replicates. (* p<0.05, one-way ANOVA with Dunnett’s multiple comparisons test, relative to H37Rv as the reference condition). (E) CXCL10 concentration in the culture media 72 hr post-infection quantified by ELISA. Data points each represent the mean of three technical replicates for a given donor. (* p<0.05, ** p<0.01, one-way ANOVA with Tukey’s multiple comparisons test on log-transformed concentrations.) (f) Relative quantification of EsxA28-36 and EsxJKPW24-34 by SureQuant in macrophages infected with no Mtb (mock), wild-type Mtb H37Rv, or eccCa1:Tn for n=3 donors (all HLA-A*02:01+, HLA-B*57:01+). (**** p<0.001, one-way ANOVA with Tukey’s multiple comparisons test.). Error bars indicate standard deviation.
-
Figure 3—source data 1
Relative abundances of Mtb-derived MHC-I peptides determined by SureQuant.
- https://cdn.elifesciences.org/articles/84070/elife-84070-fig3-data1-v2.zip
-
Figure 3—source data 2
CXCL10 ELISA raw data.
- https://cdn.elifesciences.org/articles/84070/elife-84070-fig3-data2-v2.zip
Figure 3—figure supplement 1
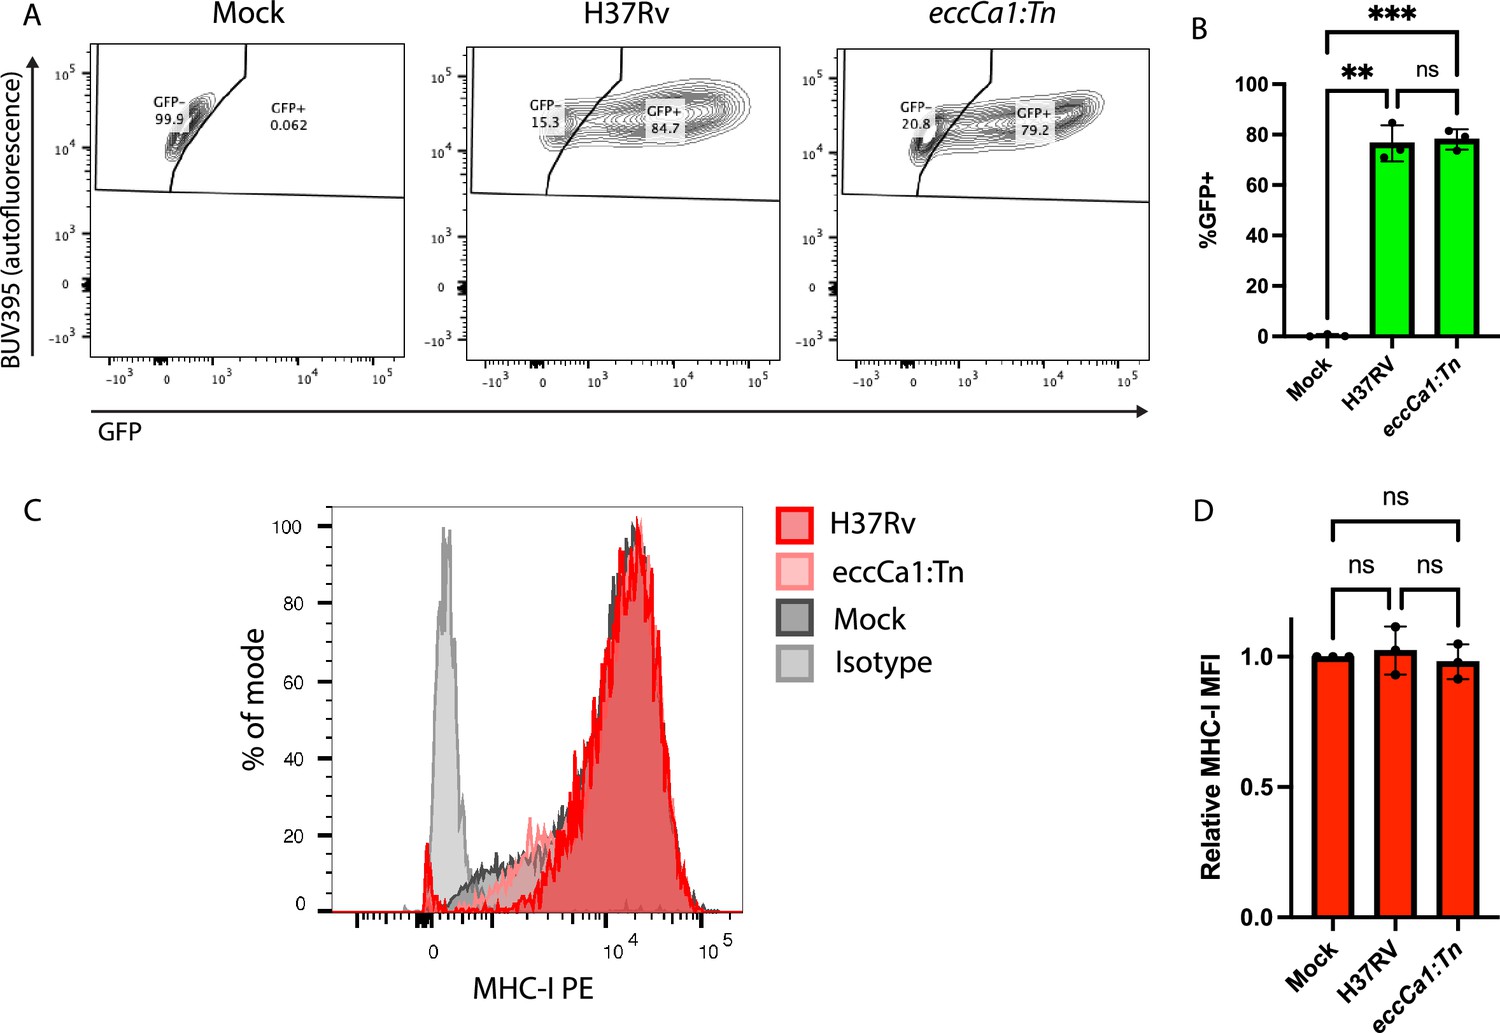
Infection of macrophages with wild-type or ESX-1-deficient Mtb strains results in similar rates of infection and does not affect surface MHC-I levels 72 hr post-infection.
Macrophages infected with GFP-expressing wild-type (H37Rv) or ESX-1-deficient (eccCa1:Tn) Mtb were surface stained for MHC-I 72 hr post-infection and analyzed by flow cytometry. (A) Representative contour plots of GFP fluorescence intensity vs. autofluorescence, showing gating for GFP +infected cells. (B) Proportion of GFP + cells for n=3 donors (** p<0.01, *** p<0.001; one-way ANOVA with Tukey’s multiple comparisons test). (C) Representative histograms of surface MHC-I fluorescence intensity. (D) Mean MHC-I fluorescence intensity (MFI) for n=3 donors (p-values determined by one-way ANOVA with Tukey’s multiple comparisons test). Error bars indicate standard deviation.
-
Figure 3—figure supplement 1—source data 1
Source data for plots.
- https://cdn.elifesciences.org/articles/84070/elife-84070-fig3-figsupp1-data1-v2.zip
Figure 4 with 4 supplements
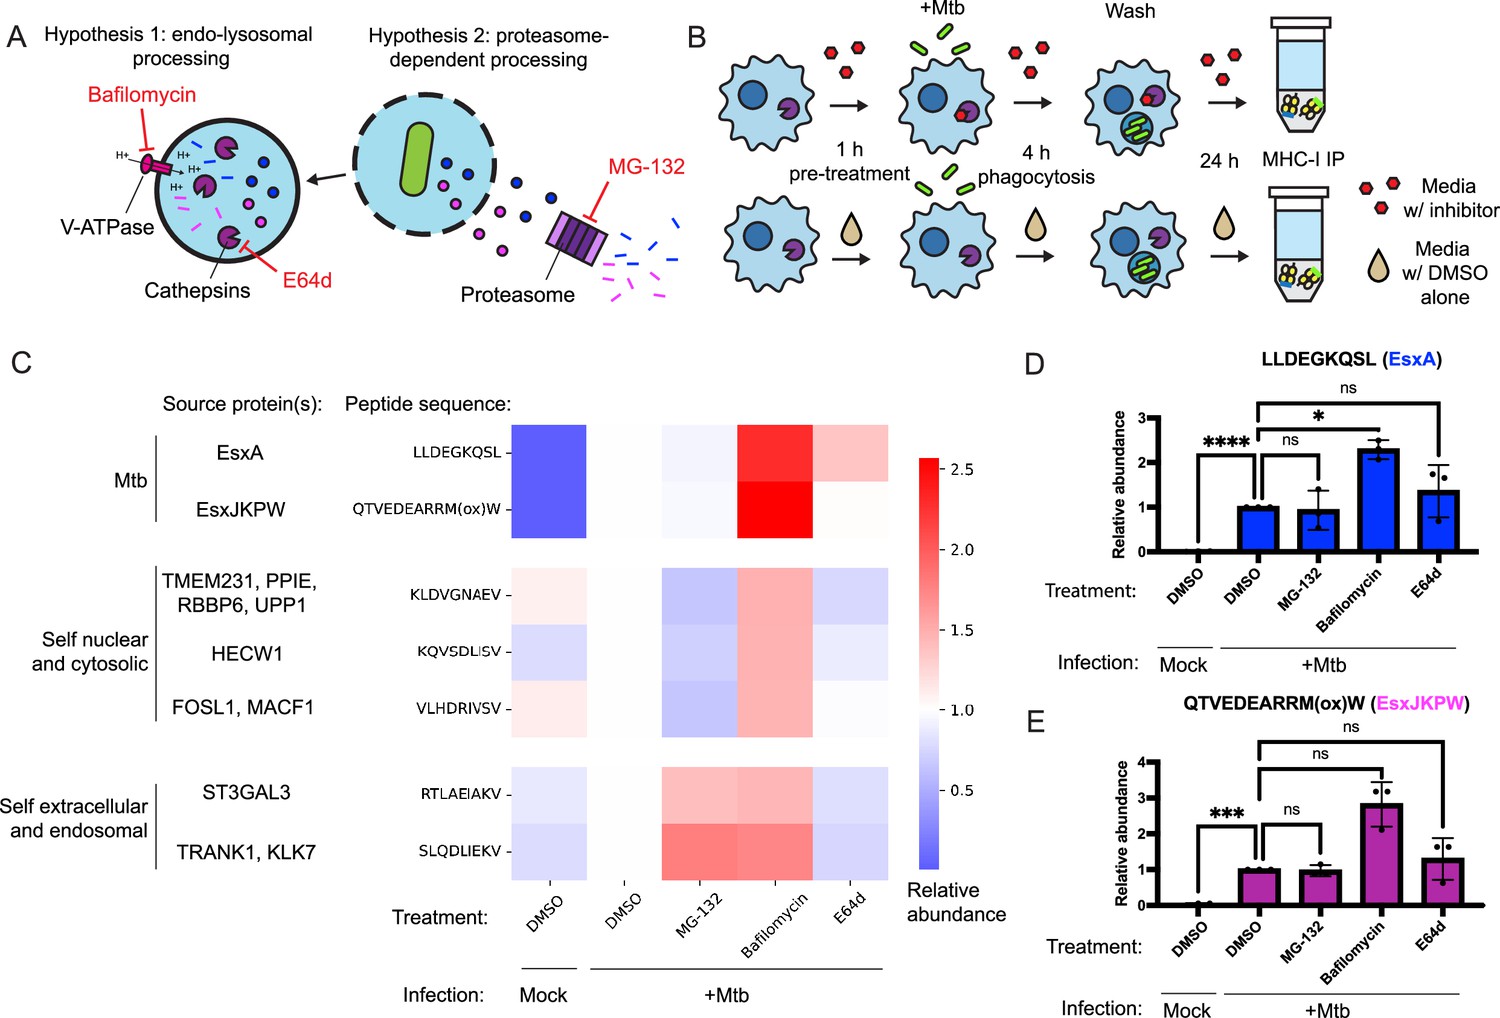
Inhibition of conventional antigen processing proteolytic pathways does not impair presentation of EsxA28-36 and EsxJKPW24-34 on MHC-I.
(A) Schematic representation of proteolytic pathways inhibited by the proteasome inhibitor MG-132, the V-type ATPase inhibitor bafilomycin, and the cysteine cathepsin inhibitor E64d. (B) Schematic showing the timing of drug treatment and Mtb infection for targeted MS experiments. (C) Heatmap showing relative abundance of self and Mtb-derived MHC-I peptides determined by SureQuant in mock-infected macrophages or Mtb-infected macrophages treated with MG-132, bafilomycin, E64d, or DMSO-only control. Colors represent the mean fold change relative to the DMSO-treated, Mtb-infected condition for n=3 donors (all HLA-A*02:01+, HLA-B*57:01+). (D–E) Relative abundance of EsxA28-36 (D) and EsxJKPW24-34 (E) determined by SureQuant in mock-infected macrophages or Mtb-infected macrophages treated with MG-132, bafilomycin, E64d, or DMSO-only control for n=3 donors (all HLA-A*02:01+, HLA-B*57:01+). Error bars indicate standard deviation.
-
Figure 4—source data 1
Relative abundances of MHC-I peptides determined by SureQuant.
- https://cdn.elifesciences.org/articles/84070/elife-84070-fig4-data1-v2.zip
Figure 4—figure supplement 1
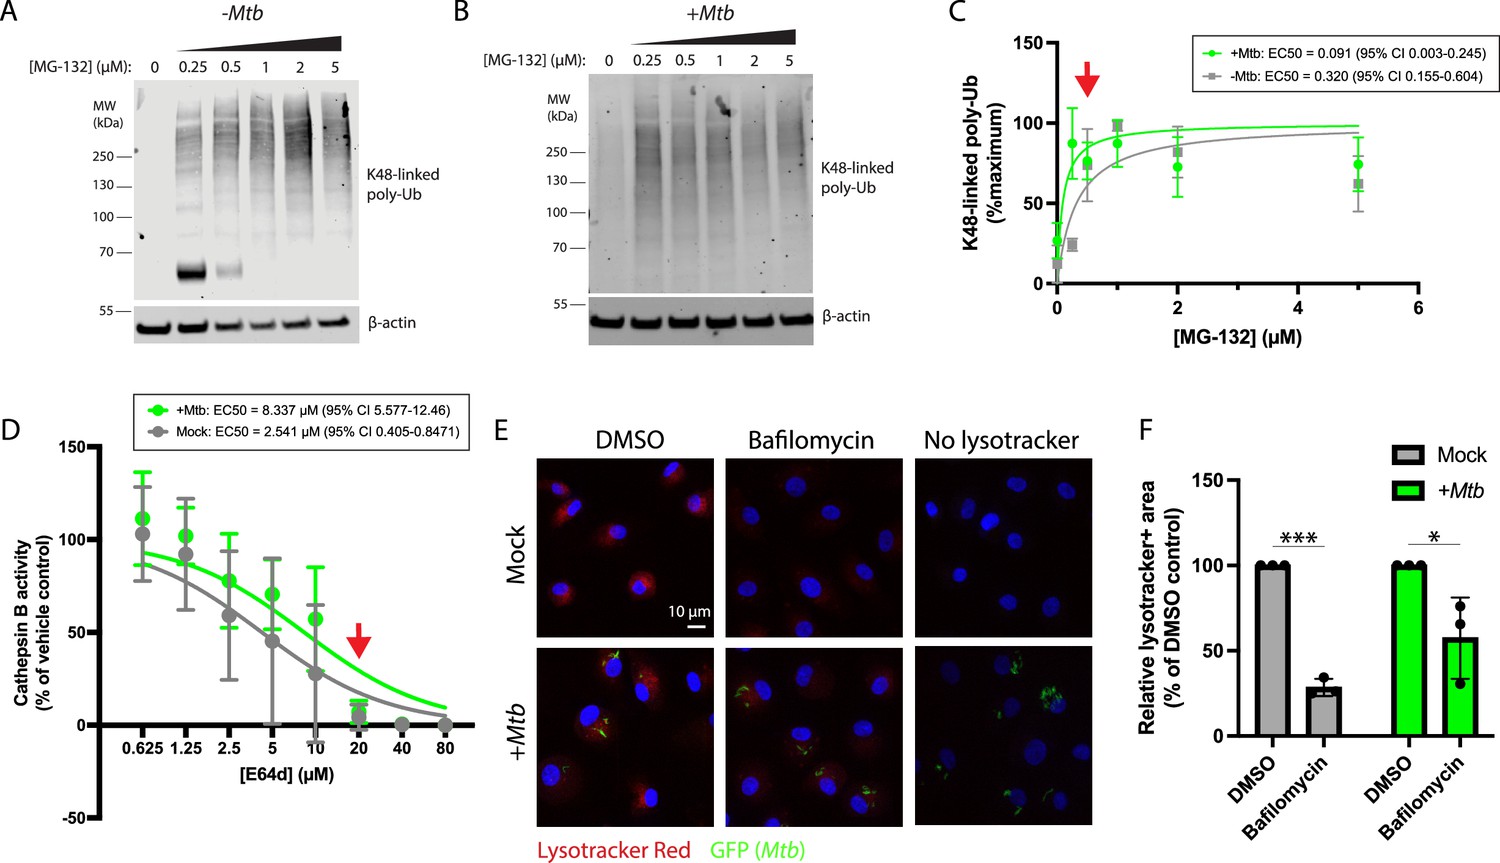
MG-132, E64d, and bafilomycin effectively inhibit their targets in Mtb-infected macrophages.
Where applicable, red arrows indicate the dose of each drug used in MS experiments. (A–B) Representative western blots for K48-linked polyubiquitinated protein in uninfected (A) or Mtb-infected (B) macrophages. β-actin is included as a loading control. (C) Quantification of K48-polyubiquitinated protein by densitometry of western blots for n=3 donors. Values are normalized to the abundance of β-actin, also quantified by densitometry of western blots. EC50 was determined by fitting a curve of the form 100% × [MG-132]/([MG-132]+EC50). Data points and error bars represent the mean ± standard deviation. (D) Relative cathepsin B activity (as measured via hydrolysis of the fluorogenic cathepsin B substrate Z-RR-AMC; see Methods) as a function of E64d concentration in mock-infected and Mtb-infected macrophages. EC50 was determined by fitting a curve of the form 100% × [1 - [E64d]/([E64d]+EC50)]. Data points and error bars represent the mean ± standard deviation. (E) Representative spinning disk confocal microscopy images of mock-infected or Mtb-infected macrophages treated with 10 nM bafilomycin for 24 hr and stained with lysotracker red. (F) Mean lysotracker-positive area per cell for n=3 donors. (* p<0.05, *** p<0.001; paired one-tailed T-test). Error bars indicate standard deviation.
-
Figure 4—figure supplement 1—source data 1
Uncropped western blot images.
- https://cdn.elifesciences.org/articles/84070/elife-84070-fig4-figsupp1-data1-v2.zip
-
Figure 4—figure supplement 1—source data 2
Source data for plots.
- https://cdn.elifesciences.org/articles/84070/elife-84070-fig4-figsupp1-data2-v2.zip
Figure 4—figure supplement 2
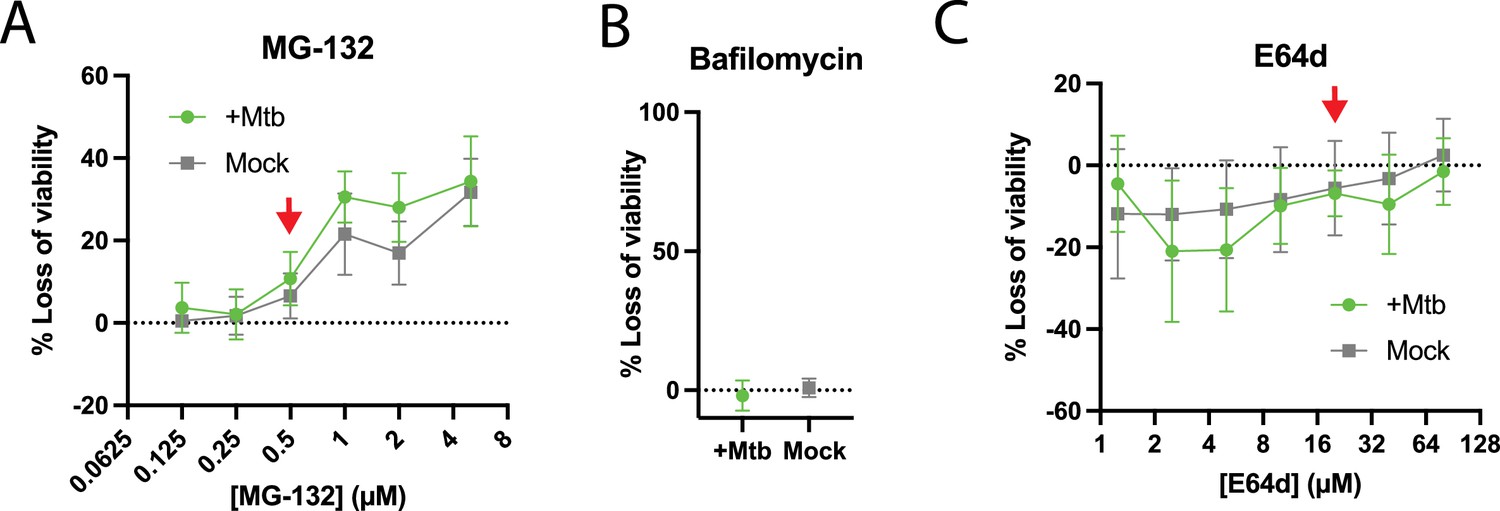
MG-132, E64d, and bafilomycin have minimal cytotoxicity at effective doses in Mtb-infected macrophages.
Mock-infected or Mtb-infected macrophages were treated with each drug at the indicated concentrations, and the change in cell viability was measured by lactate dehydrogenase (LDH) release assay. Where applicable, red arrows indicate the dose of each drug used in MS experiments. Data points and error bars represent the mean ± standard deviation. (A) MG-132 (n=4 donors), (B) bafilomycin (10 nM; n=4 donors), (C) E64d (n=3 donors).
-
Figure 4—figure supplement 2—source data 1
Source data for plots.
- https://cdn.elifesciences.org/articles/84070/elife-84070-fig4-figsupp2-data1-v2.zip
Figure 4—figure supplement 3
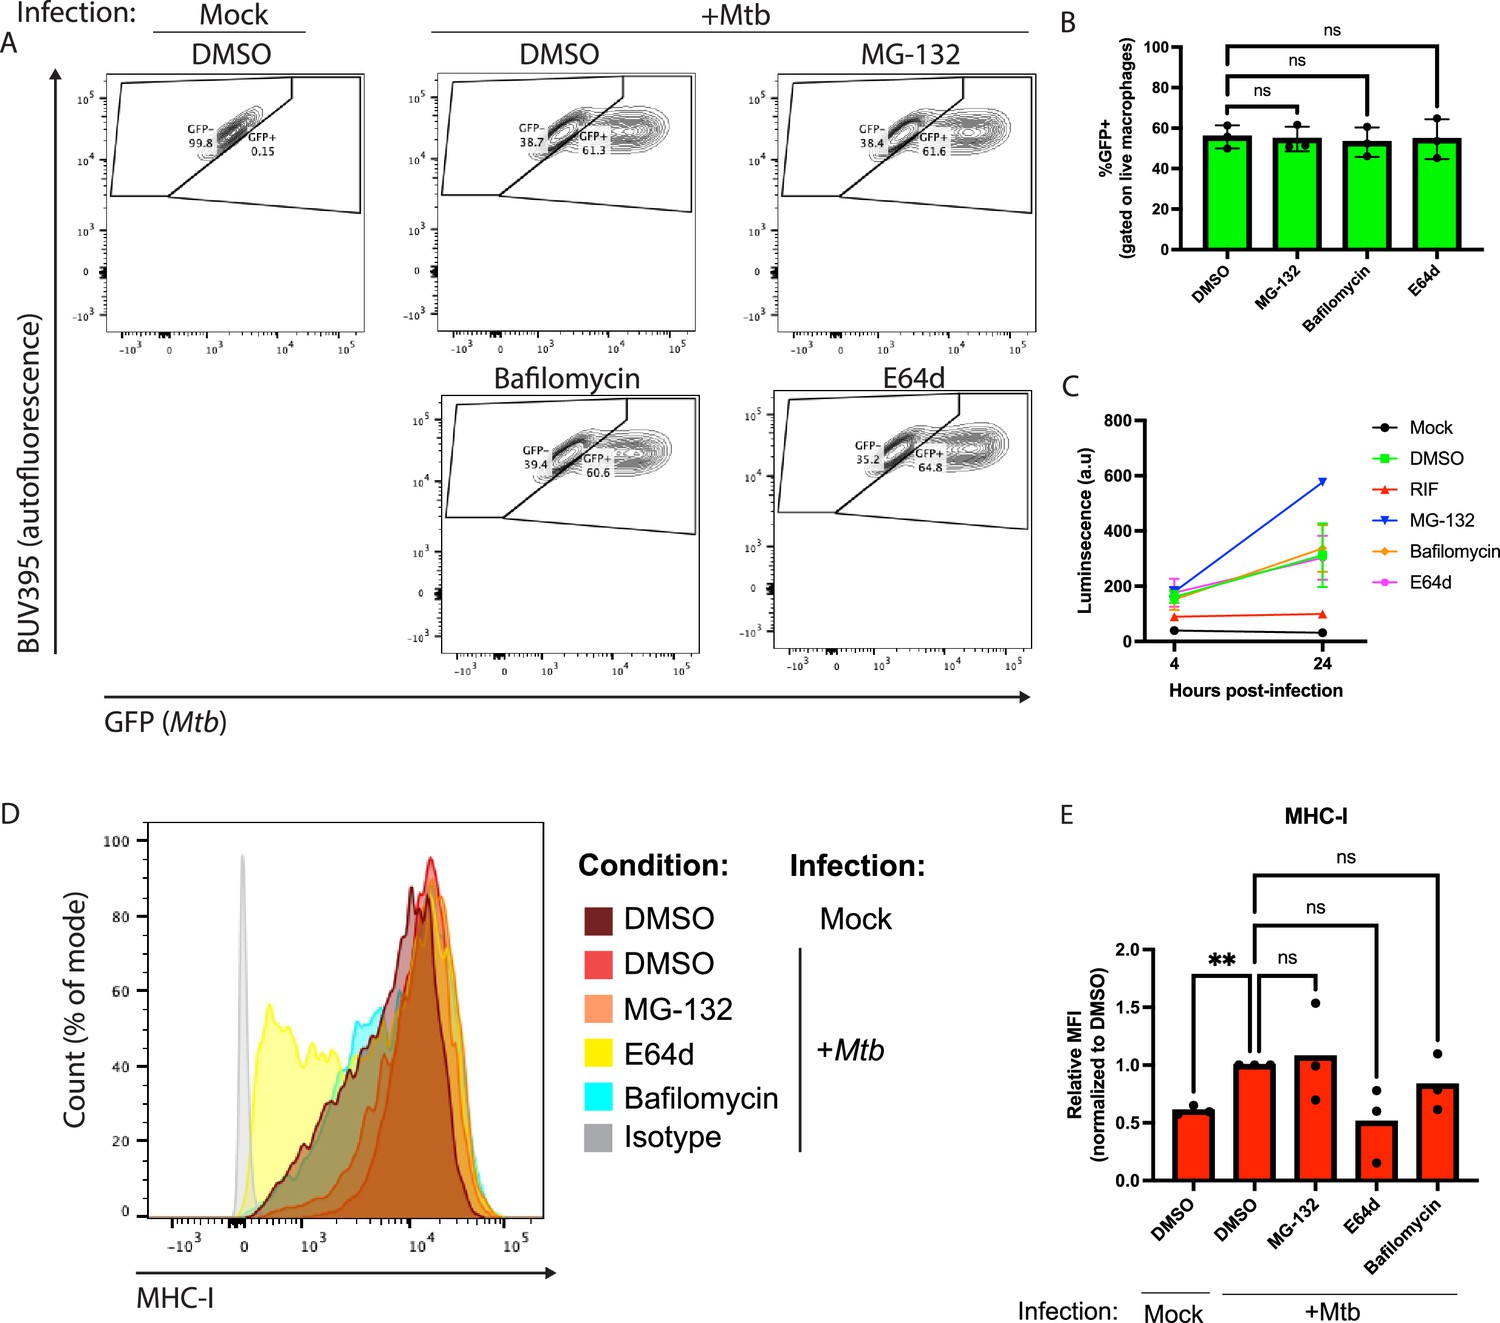
Treatment of macrophages with MG-132, E64d, and bafilomycin does not impair phagocytosis or outgrowth of Mtb.
Macrophages were pre-treated with media containing drug or vehicle control for 1 hr and infected with Mtb in media containing drug or vehicle control, as in MS experiments. (A) Representative flow cytometry contour plots of GFP fluorescence vs. autofluorescence in macrophages infected with GFP-expressing Mtb, immediately after being allowed to phagocytose Mtb for 4 hr at an MOI of 2.5. (B) Quantification of the proportion of macrophages that took up Mtb (i.e. were GFP+) (p-values determined by one-way ANOVA with Dunnett’s multiple comparisons test). (C) Luminescence as a function of time post-infection for macrophages infected with Mtb expressing a luciferase reporter. Rifampicin (RIF) is included as a control demonstrating inhibition of growth. Datapoints and error bars represent the mean ± standard deviation for n=3 donors, each representing the mean of three technical replicates. (D) Representative flow cytometry plot of MHC-I surface expression in macrophages infected with Mtb (or mock-infected) and treated with MG-132, E64d, bafilomycin, or DMSO alone for 24 hr. (E) Quantification of surface MHC-I mean fluorescence intensity (MFI) (p-values determined by one-way ANOVA with Dunnett’s multiple comparisons test).
-
Figure 4—figure supplement 3—source data 1
Source data for plots.
- https://cdn.elifesciences.org/articles/84070/elife-84070-fig4-figsupp3-data1-v2.zip
Figure 4—figure supplement 4
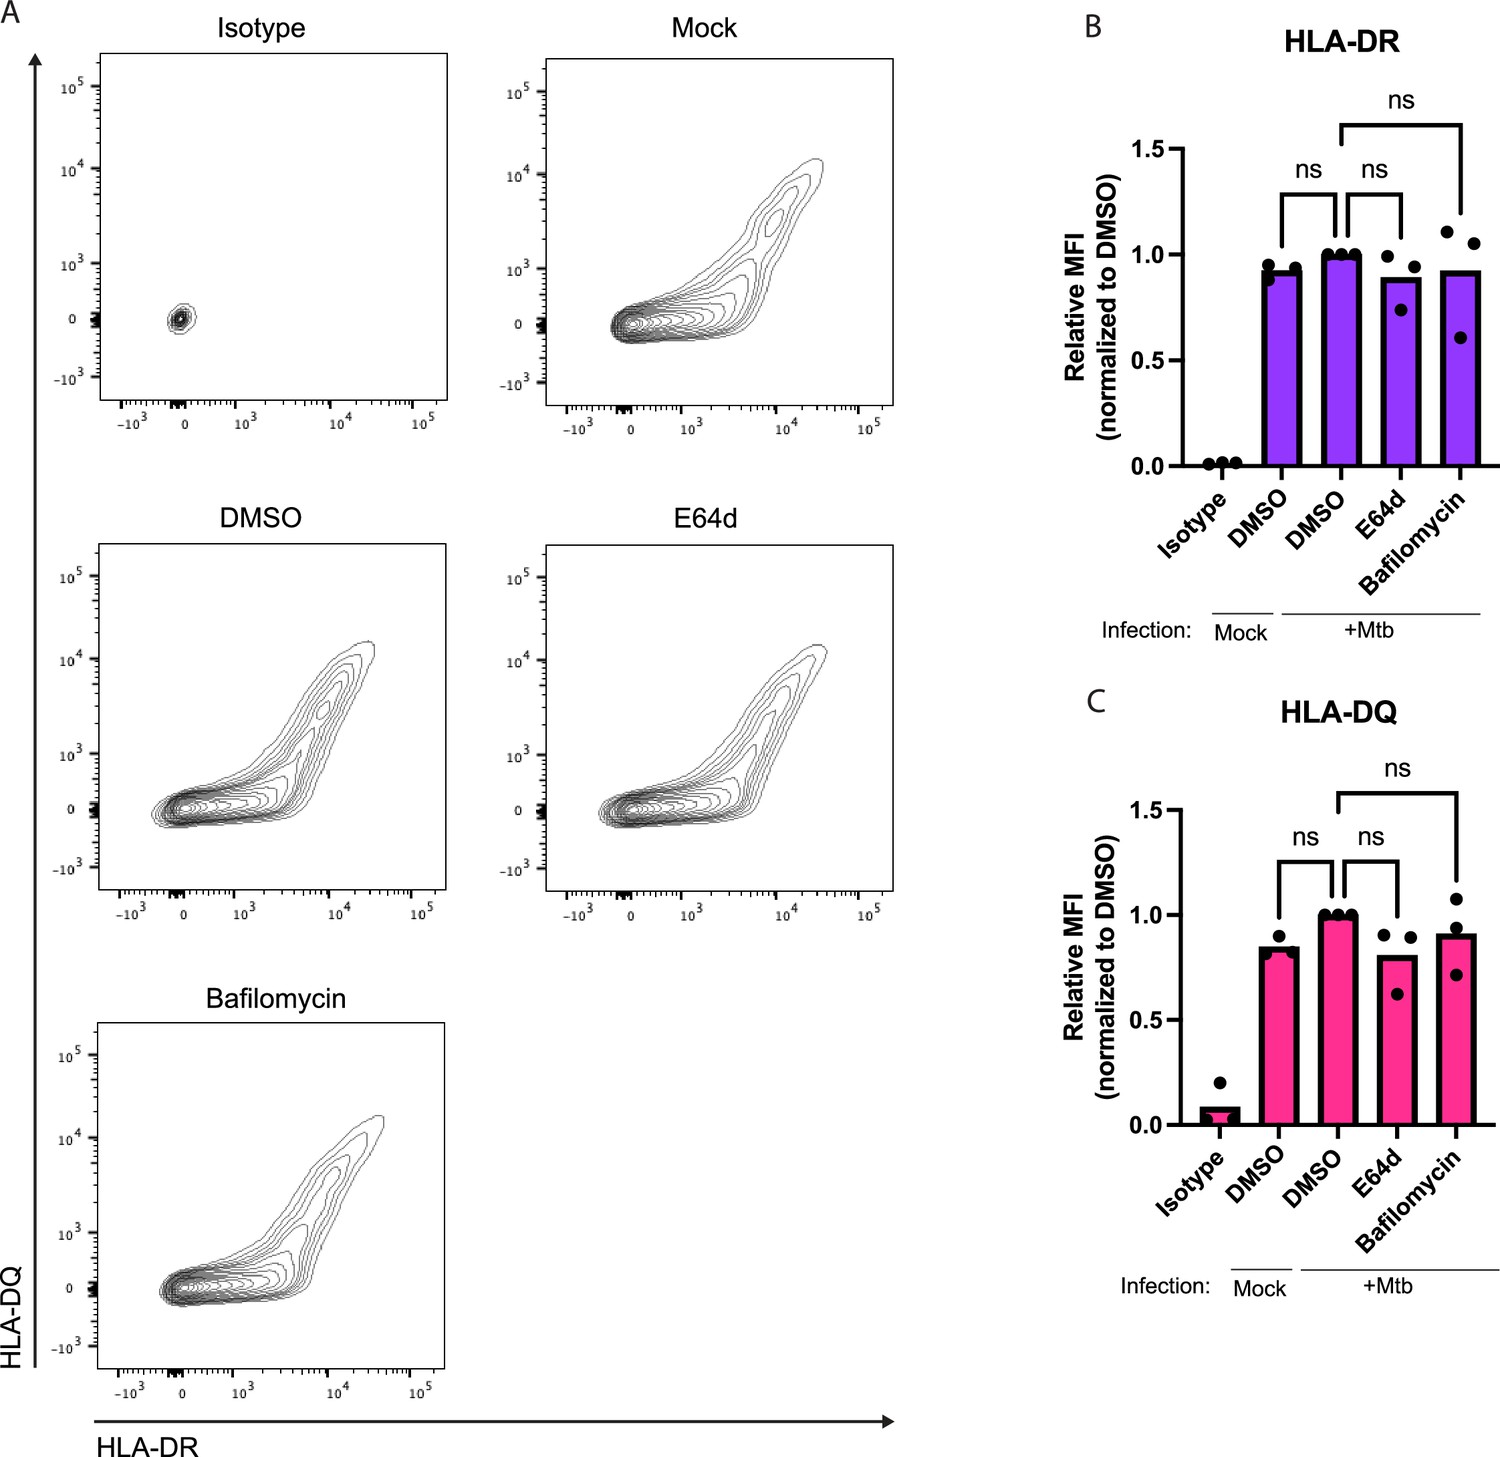
Treatment of macrophages with E64d and bafilomycin does not significantly reduce surface levels of MHC-II.
Macrophages were pre-treated with media containing drug or vehicle control for 1 hr and infected with Mtb in media containing drug or vehicle control, as in MS experiments. (A) Representative flow cytometry contour plots of HLA-DQ and HLA-DR surface staining in macrophages infected with Mtb (or mock-infected), 24 hr post-infection, treated with E64d, bafilomycin, or DMSO alone. (B–C) Quantification of mean fluorescent intensity (MFI) of surface HLA-DR (B) and HLA-DQ (C) staining in Mtb-infected macrophages for n=3 donors (p-values determined by one-way ANOVA with Dunnett’s multiple comparisons test).
-
Figure 4—figure supplement 4—source data 1
Source data for plots.
- https://cdn.elifesciences.org/articles/84070/elife-84070-fig4-figsupp4-data1-v2.zip
Tables
Table 1
Class I HLA alleles expressed by primary monocyte donors.
| Donor | HLA-A allele 1 | HLA-A allele 2 | HLA-B allele 1 | HLA-B allele 2 | HLA-C allele 1 | HLA-C allele 2 |
|---|---|---|---|---|---|---|
| A | ND | ND | ND | ND | ND | ND |
| B | 02:01 | 24:02 | 07:02 | 27:07 | 07:02 | 15:02 |
| C | 01:01 | 02:01 | 44:03 | 57:01 | 06:02 | 16:01 |
| D | 23:01 | 26:01 | 35:01 | 50:01 | 04:01 | 06:02 |
| E | 11:01 | 24:02 | 39:06 | 51:01 | 07:02 | 15:02 |
| F | 01:01 | 26:01 | 35:01 | 38:01 | 04:01 | 12:03 |
Table 2
Putative Mtb-derived peptides that passed manual inspection of DDA MS data but failed SureQuant validation.
| Source protein | Peptide sequence |
|---|---|
| Rv0383c | AAPGRPVAPG |
| pyrD | GDRLALISV |
| Rv2303c | KHPNVYLEL |
| Rv0839 | YTHGYHES |
| kgd | AERAAAAAP |
| Rv1375 | EAAQSRITA |
| GabD1 | AKVGASAAY |
| PE1 | AAGNLRAAI |
| HlfX | IPYDRGDLV |
| Rv2807 | AKWILEGIK |
| Rv3818 | IAPELVRT |
| Rv1065 | YTRIHGDEEL |
| Rv0293c | DELIAGLAY |
| Rv3779 | VAIAVGPALT |
| PPE55 | TVAPINLNP |
| Rv2263 | QEIEEGIL |
| Rv0333 | GEDPGIAR |
Additional files
Download links
A two-part list of links to download the article, or parts of the article, in various formats.
Downloads (link to download the article as PDF)
Open citations (links to open the citations from this article in various online reference manager services)
Cite this article (links to download the citations from this article in formats compatible with various reference manager tools)
Immunopeptidomics reveals determinants of Mycobacterium tuberculosis antigen presentation on MHC class I
eLife 12:e84070.
https://doi.org/10.7554/eLife.84070


