Pleiotropic effects of BAFF on the senescence-associated secretome and growth arrest
- Laboratory of Genetics and Genomics, National Institute on Aging (NIA) Intramural Research Program (IRP), National Institutes of Health, United States
- Institute for Genetic and Biomedical Research (IRGB), National Research Council, Italy
- Translational Gerontology Branch, NIA IRP, NIH, United States
- Mouse Cancer Genetics Program, Center for Cancer Research, National Cancer Institute IRP, United States
Figures
Figure 1 with 1 supplement
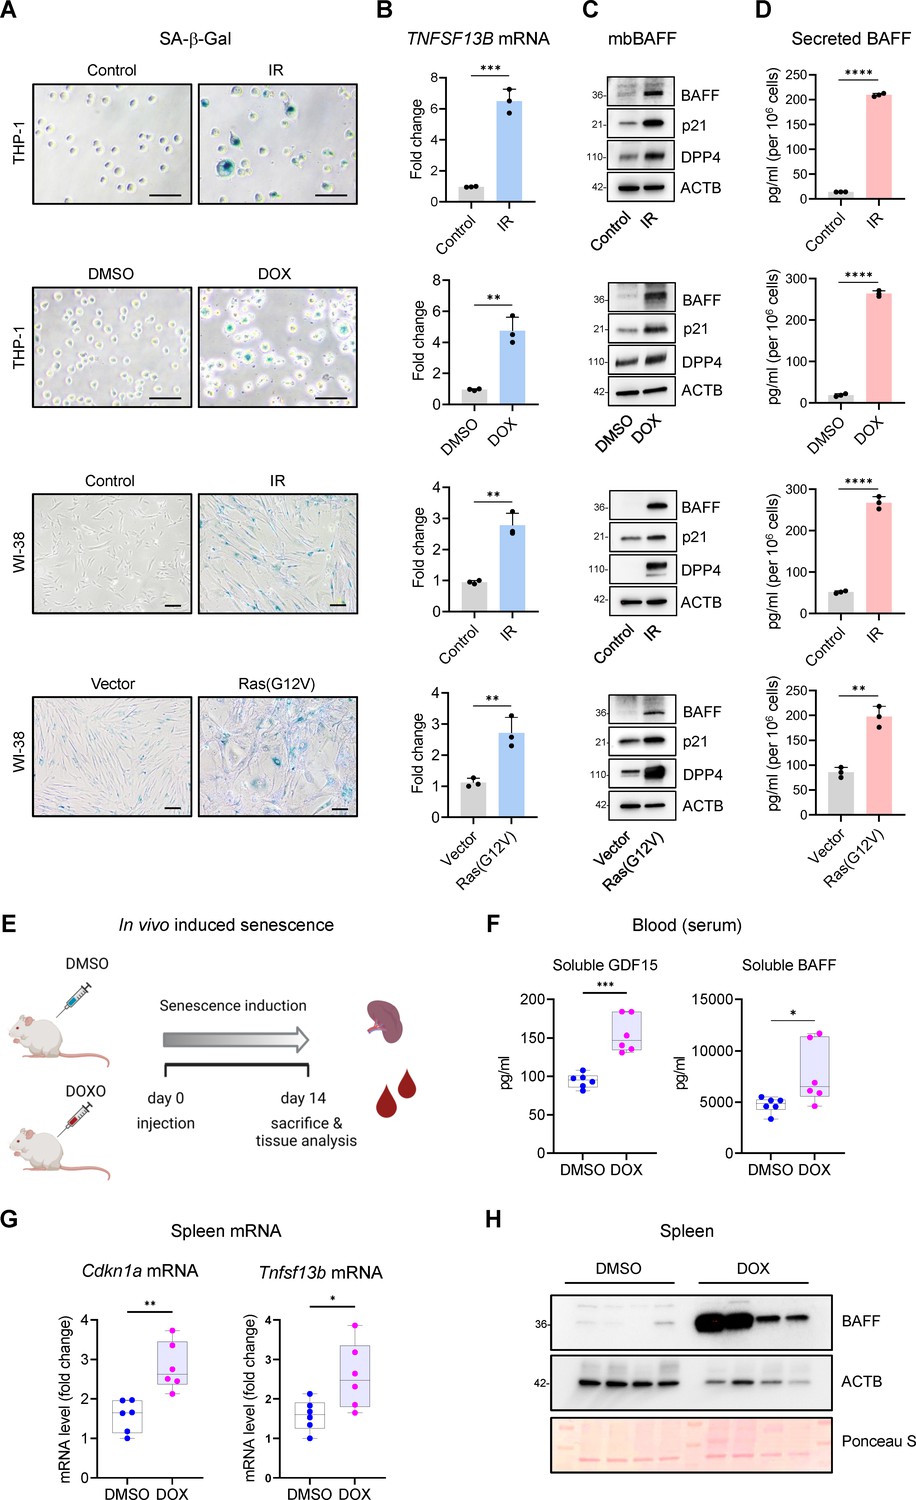
Increased BAFF expression in cultured senescent cells and in a mouse model of senescence.
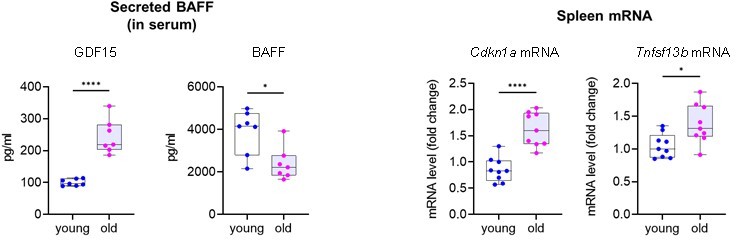
(A) Micrographs of SA-β-Gal activity in senescent cultured cells relative to corresponding proliferating controls. From top: THP-1 cells untreated (Control, proliferating) or treated with a single dose of IR (5 Gy) and cultured for an additional 6 days; THP-1 cells treated with DMSO or with a single dose of 10 nM doxorubicin (DOX) for 48 hr, followed by 4 additional days in culture without DOX (for a total of 6 days since the treatment with DOX); WI-38 fibroblasts that were proliferating or had been treated with a single dose of IR (10 Gy) and cultured for an additional 10 days; WI-38 fibroblasts transduced for 18 hr with a control lentivirus (empty vector) or with a RAS(G12V) lentivirus, whereupon culture medium was replaced and cells were cultured for an additional 8 days. (B) RT-qPCR analysis of the levels of TNFSF13B mRNA, normalized to the levels of ACTB mRNA (encoding the housekeeping protein ACTB [β-Actin]) in cells processed as in (A). (C) Western blot analysis of the levels of membrane-bound BAFF (mbBAFF), DPP4, p21, and loading control ACTB in cells processed as in (A). (D) Levels of BAFF secreted in the culture media in cells treated as described in (A), quantified by ELISA. (E) Schematic of the strategy to induce senescence in DOX-treated mice (Materials and methods), created with BioRender. (F) Quantification of the levels of soluble GDF15 and BAFF in the blood (serum) of mice treated as in (E) using ELISA (Materials and methods). GDF15 was used as a positive control of induced senescence (Basisty et al., 2020). (G) RT-qPCR analysis of the levels of Cdkn1a and Tnfsf13b mRNAs in spleens of mice treated as in (E). 18 S rRNA levels were measured and used for data normalization. (H) Representative western blot analysis of the levels of BAFF in spleen homogenates obtained from mice treated as in (E). ACTB and Ponceau S staining served as loading controls. Significance (*, p<0.05; **, p<0.01; ***, p<0.001; ****, p<0.0001) was assessed by Student’s t-test in all panels. Scale bars, 100 μm.
-
Figure 1—source data 1
Uncropped immunoblots for Figure 1.
- https://cdn.elifesciences.org/articles/84238/elife-84238-fig1-data1-v1.zip
Figure 1—figure supplement 1
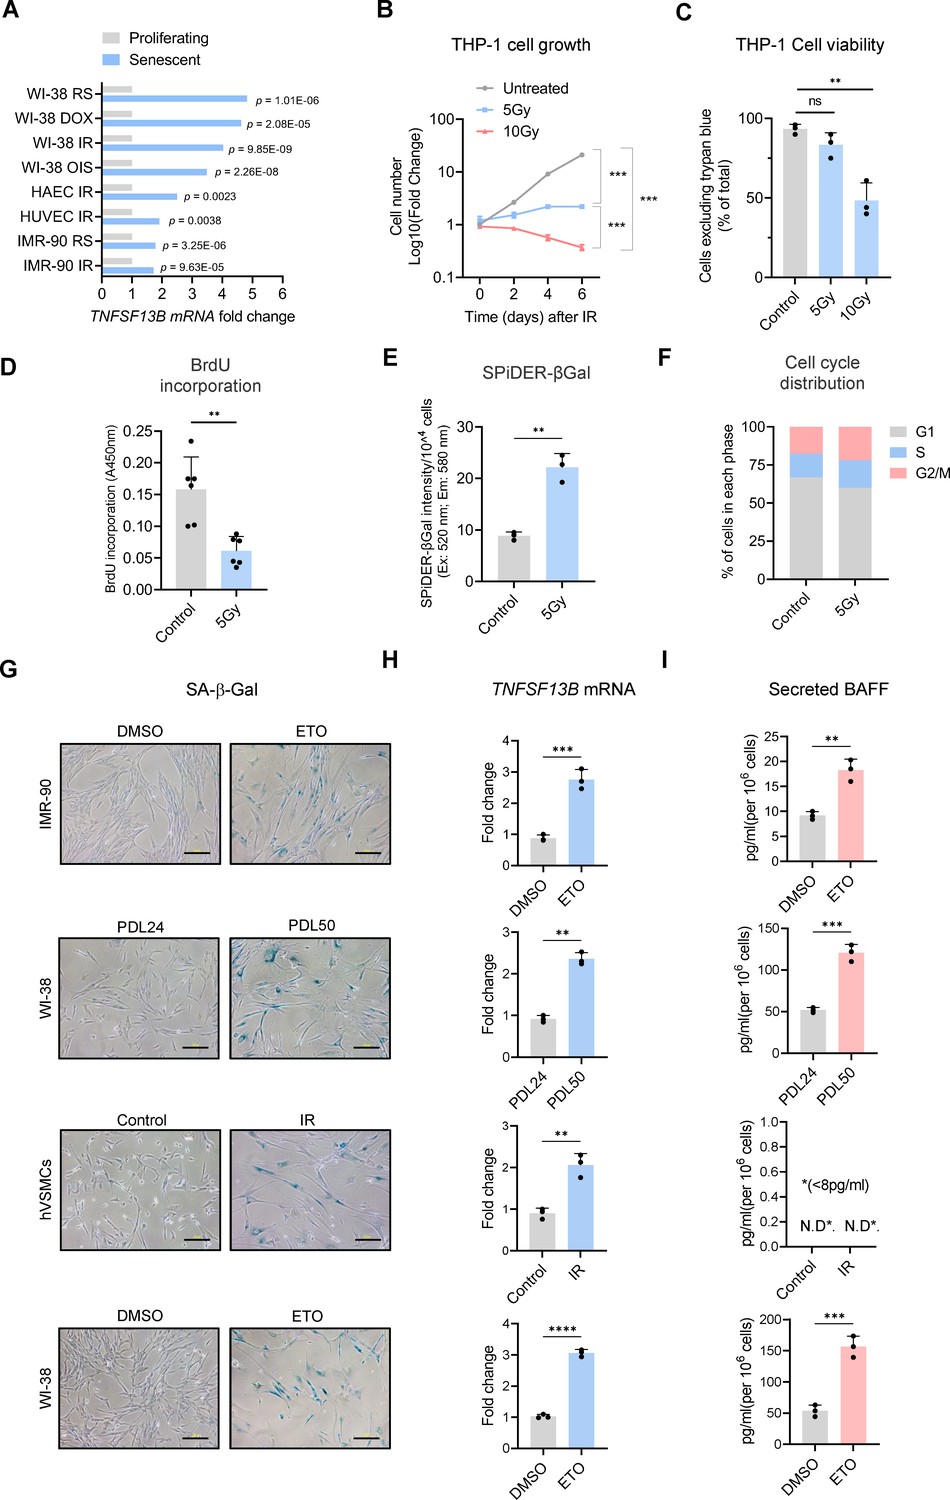
Extended data from Figure 1.
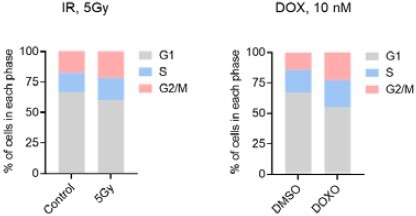
(A)TNFSF13B mRNA levels across different senescence models; raw data were obtained from our earlier transcriptomic analysis (Casella et al., 2019). (B) Growth curve of THP-1 cultures that were left untreated or treated with IR (5 or 10 Gy) and were counted at the indicated times. (C) Trypan blue exclusion assay [% cells excluding trypan blue (intact cells) relative to total cells (blue + not blue)] to evaluate the viability of THP-1 cells treated as in (B) and evaluated at day 6. (D–F) BrdU incorporation assay (for 24 hr) (D), quantitative SPiDER-β-Gal assay (E), and cell cycle distribution (F), as assessed in THP-1 cells left untreated or treated with IR (5 Gy) and assayed 6 days later (Materials and methods). (G) Analysis of SA-β-Gal activity to visualize senescent cells relative to corresponding controls. From top: IMR-90 fibroblasts that were either proliferating (treated with DMSO) or rendered senescent by treatment with a single dose of 50 μM etoposide (ETO) for 72 hr and cultured for an additional 7 days, for a total of 10 days; WI-38 fibroblasts that were proliferating [population doubling level (PDL) 24] or rendered senescent by passaging them until replicative exhaustion (PDL 50); hVSMCs that were either proliferating and otherwise untreated (Control) or were treated with a single dose of IR (10 Gy) and cultured for an additional 7 days; WI-38 fibroblasts that were proliferating treated with DMSO or were treated with a single dose of 50 μM ETO and cultured for 10 days. (H) RT-qPCR analysis of TNFSF13B mRNA levels, normalized to ACTB mRNA levels, in the various cells described in (G). ACTB mRNA levels were calculated and used for sample normalization. (I) Levels of soluble BAFF in the culture media of cells treated as in (G) as measured by ELISA. Significance (*, p<0.05; **, p<0.01; ***, p<0.001; ****, p<0.0001) was assessed by applying Student’s t-test. N.D., not detected (<8 pg/ml). Scale bars, 100 μm.
Figure 2 with 1 supplement
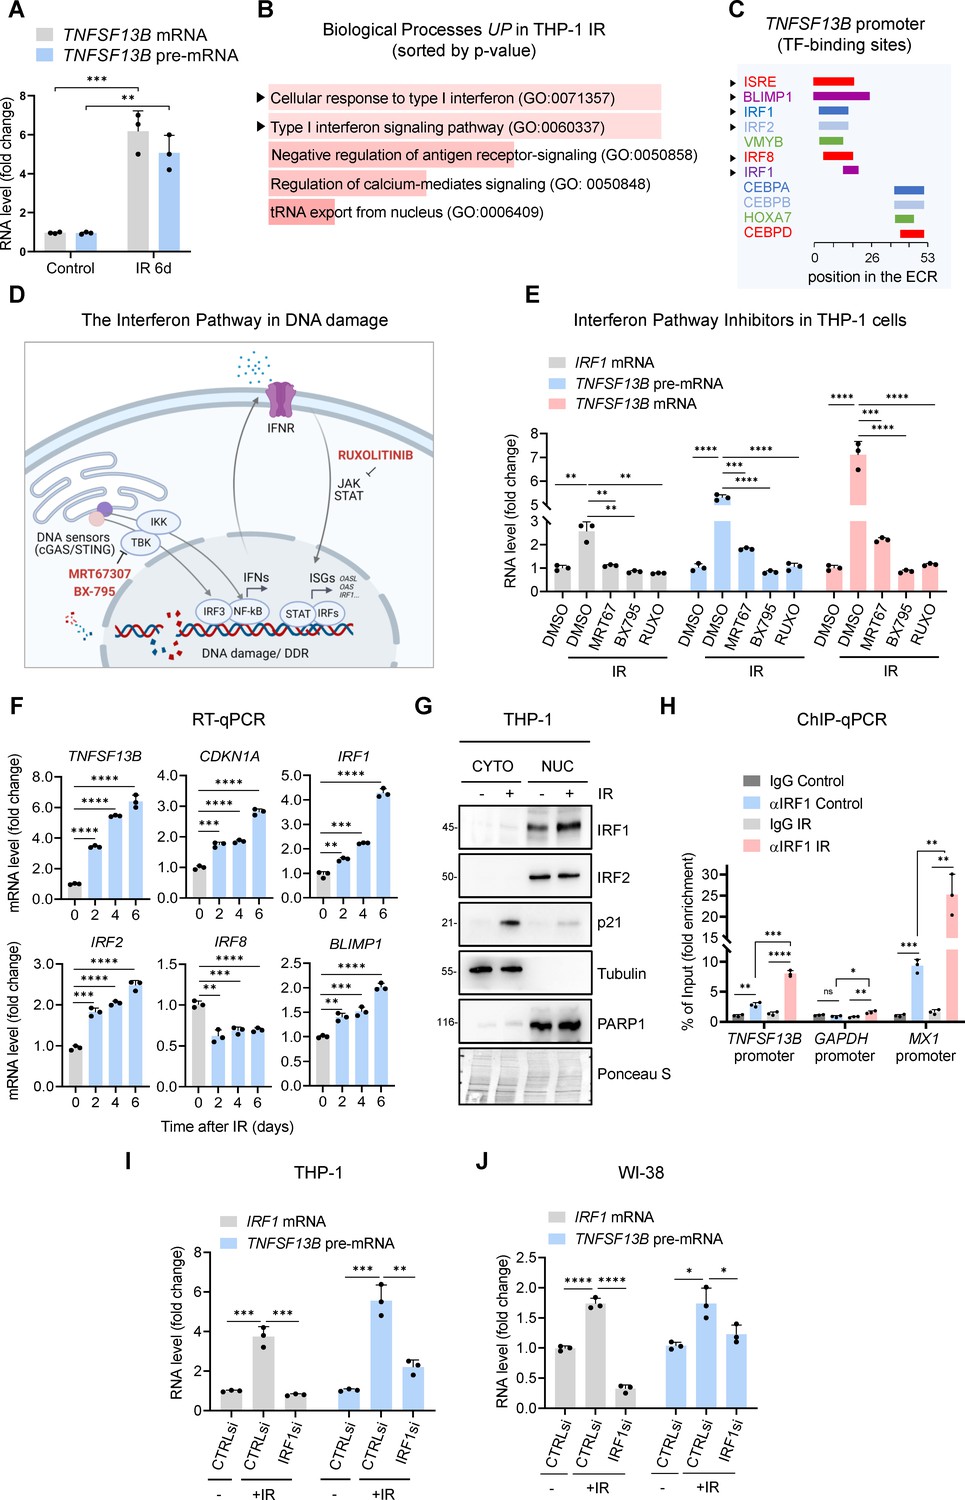
Interferon response pathway and IRF1 promote TNFSF13B transcription in senescence.
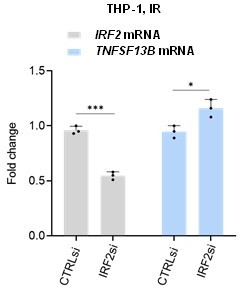
(A) RT-qPCR analysis of the levels of TNFSF13B mRNA and TNFSF13B pre-mRNA in THP1 cells that were either untreated (Control) or treated with IR (5 Gy) and analyzed 6 days later. The levels of ACTB mRNA, encoding the housekeeping protein ACTB (β-Actin), were measured and used for data normalization. (B) Gene Ontology terms enriched after proteomic analysis of THP-1 cells that were rendered senescent by IR relative to untreated control cells. Proteomic analysis is available as Figure 2—source data 1. GO terms were sorted by p-value ranking (EnrichR analysis). (C) Schematic of conserved TF-binding sites on the TNFSF13B promoter, as analyzed using ECR browser and rVista 2.0. (D) Schematic of the interferon response triggered by DNA damage, highlighting the targets affected by the different interferon inhibitors used in our study (Fu et al., 2020; Härtlova et al., 2015; Li and Chen, 2018), created using BioRender. (E) RT-qPCR analysis of the levels of TNFSF13B mRNA, TNFSF13B pre-mRNA, and IRF1 mRNA in THP-1 cells after treatment with the inhibitors of the interferon pathway indicated in (D) [Ruxolitinib (Ruxo, 1 μM), MRT67307 (MRT67, 5 μM), and BX-795 (5 μM)] or with control vehicle DMSO for 5 days after treatment with IR. IRF1 mRNA was included as a positive control of interferon-stimulated mRNAs. ACTB mRNA levels were measured and used for data normalization. (F) RT-qPCR analysis of the expression levels of TNFSF13B and p21 mRNAs and other interferon-regulated transcripts (IRF1, IRF2, IRF8, and BLIMP1 mRNAs) in THP-1 cells that were left untreated or were treated with IR and cultured for the indicated times. ACTB mRNA levels were used for data normalization. (G) Western blot analysis of the levels of IRF1 and IRF2 in the cytoplasmic and nuclear fractions of THP-1 cells that were left untreated or were irradiated and assayed 6 days later. The cytoplasmic protein tubulin, the nuclear protein PARP1, and the senescence-associated protein p21 were included in the analysis. Ponceau staining of the transfer membrane was included to monitor differences in loading and transfer among samples. (H) ChIP-qPCR analysis of endogenous IRF1 in control (proliferating) or IR-treated THP-1 cells (5 Gy IR, assayed 72 hr later). The purified DNA was analyzed by qPCR using primers binding to TNFSF13B promoter, GAPDH promoter (negative control) and MX1 promoter (positive control). Data are presented as fold enrichment of the antibody signal versus the negative control IgG using the comparative 2–∆∆Ct method normalized to the percentage of the input. (I) RT-qPCR analysis of the levels of IRF1 mRNA and TNFSF13B pre-mRNA in THP-1 cells transfected with control (CTRLsi) or IRF1-directed (IRF1si) siRNAs 72 hr after either no treatment (-) or treatment with IR. ACTB mRNA levels were used for data normalization. (J) RT-qPCR analysis of the levels of TNFSF13B pre-mRNA in WI-38 cells transfected with CTRLsi or IRF1si and either left untreated (-) or treated with IR (10 Gy) and assayed 5 days later. ACTB mRNA levels were measured and used for data normalization. Significance (ns, not significant; *, p<0.05; **, p<0.01; ***, p<0.001; ****, p<0.0001) was assessed by Student’s t-test.
-
Figure 2—source data 1
Proteomic analysis performed in control THP-1 cells treated with IR.
- https://cdn.elifesciences.org/articles/84238/elife-84238-fig2-data1-v1.zip
-
Figure 2—source data 2
Uncropped western blot images for Figure 2.
- https://cdn.elifesciences.org/articles/84238/elife-84238-fig2-data2-v1.zip
Figure 2—figure supplement 1
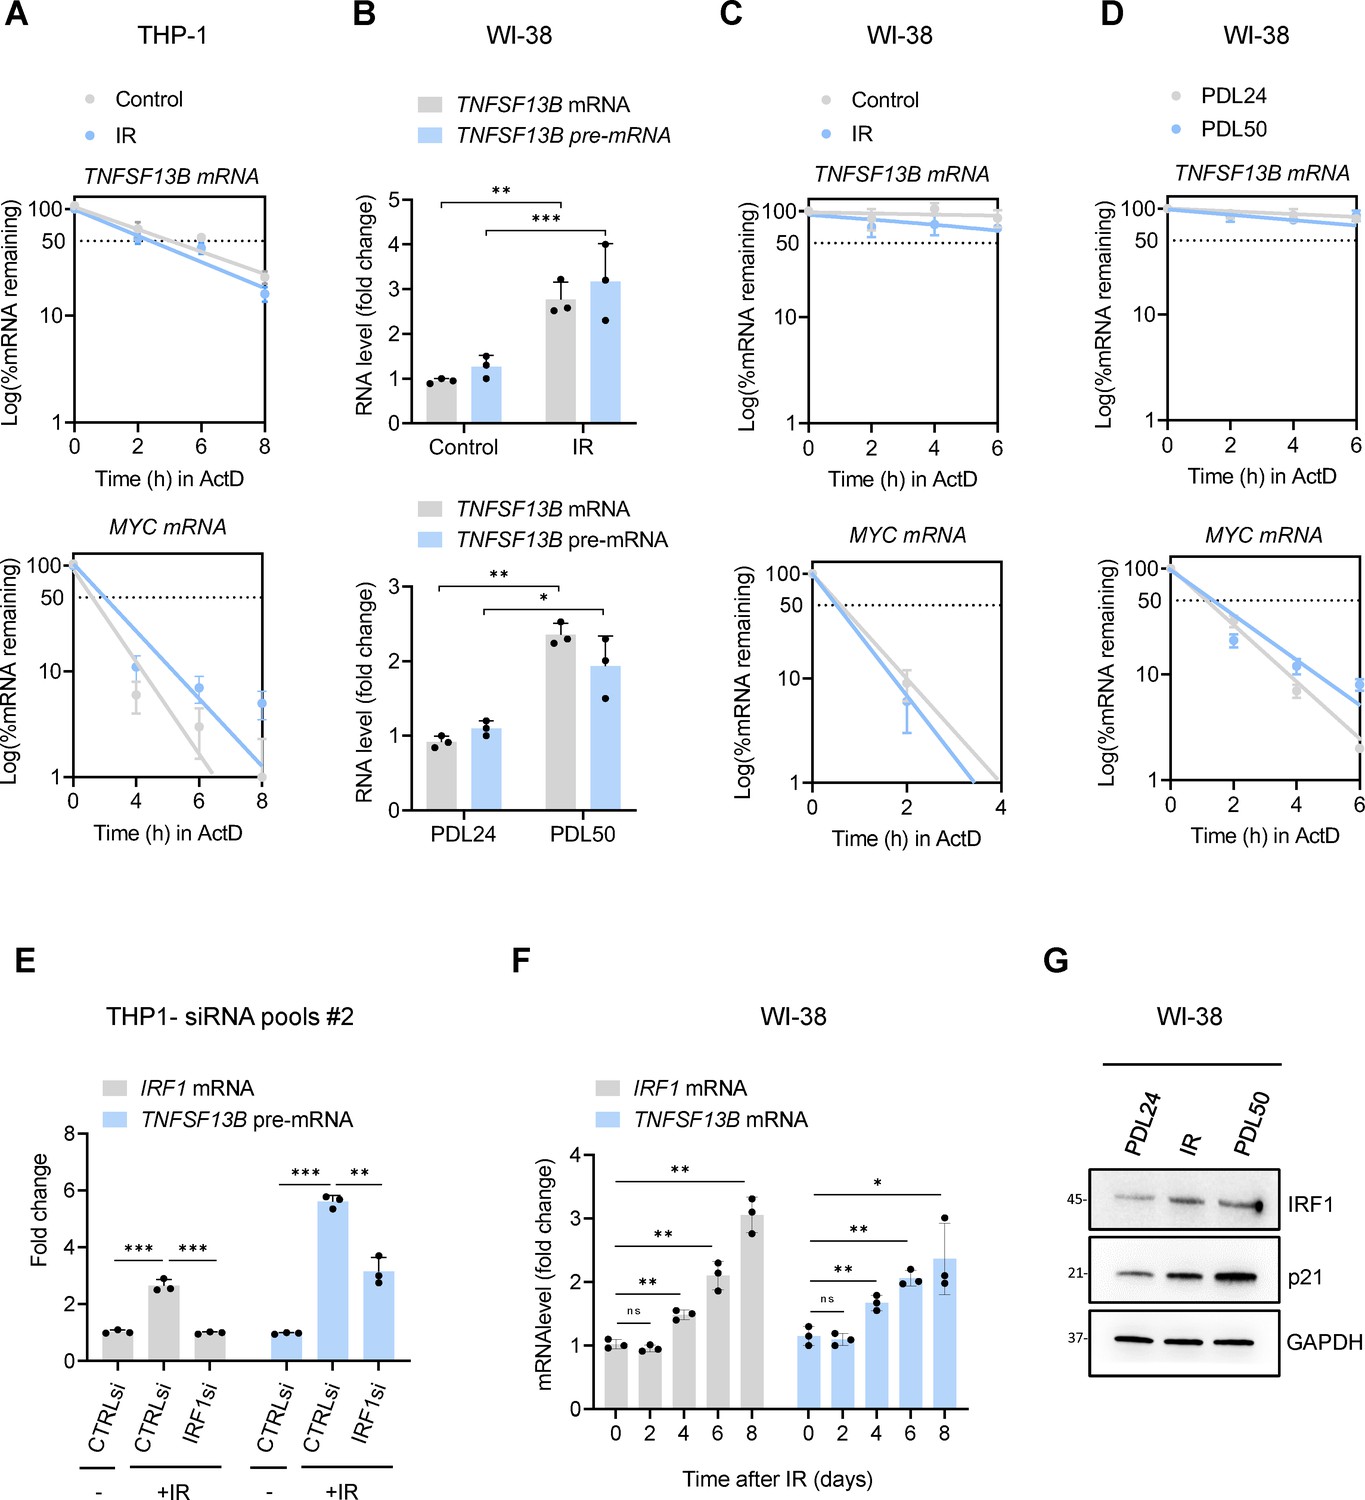
Extended Data from Figure 2.
(A) Measurement of mRNA stability in THP-1 cells. The levels of TNFSF13B mRNA (top) and labile control MYC mRNA (bottom) remaining (% of untreated) after treating cells with the inhibitor of RNA polymerase II actinomycin D (ActD) (2 μg/ml); THP-1 cells were either untreated or had been treated with 5 Gy IR 6 days earlier, and mRNA levels were measured by RT-qPCR analysis of total RNA collected at the times shown after addition of ActD. RNA levels in each sample were normalized to 18 S rRNA levels. Half-lives are estimated as the time needed for each mRNA to reach one-half (50%, discontinuous line) of their abundance at time 0 hr. (B) RT-qPCR analysis of the levels of TNFSF13B mRNA and pre-mRNA in WI-38 cells that were either untreated or treated with a single dose of IR (10 Gy) and cultured for 10 days (top) or in WI-38 cells that were proliferating (PDL 24) or replicatively senescent (PDL50) (bottom). ACTB mRNA levels were calculated and used for sample normalization. (C,D) Stability of TNFSF13B mRNA (top) and MYC mRNA (bottom) as determined following treatment with ActD as explained in (A), in WI-38 cells rendered senescent by exposure to IR (10 Gy) and culture for 10 days (C) or by replicative exhaustion (PDL50) (D). 18 S rRNA levels were calculated and used for sample normalization. (E) RT-qPCR analysis of the levels of IRF1 mRNA and TNFSF13B pre-mRNA in THP-1 cells transfected with control (CTRLsi) or IRF1-directed (IRF1si) siRNAs 72 hr after either no treatment (-) or treatment with IR. ACTB mRNA levels were used for sample normalization. (F) RT-qPCR analysis showing the levels of TNFSF13B and IRF1 mRNAs in WI-38 cells treated with IR (10 Gy) and collected at the indicated times. (G) Western blot analysis of the levels of IRF1 protein in WI-38 fibroblasts that were proliferating (PDL24), rendered senescent following exposure to IR (10 Gy) and cultured for 10 days, or rendered senescent through replicative exhaustion (PDL50); p21 was used as positive marker for senescence and GAPDH as loading control. Significance (*, p<0.05; **, p<0.01; ***, p<0.001) was assessed with Student’s t test.
-
Figure 2—figure supplement 1—source data 1
Uncropped western blots.
- https://cdn.elifesciences.org/articles/84238/elife-84238-fig2-figsupp1-data1-v1.zip
Figure 3 with 1 supplement
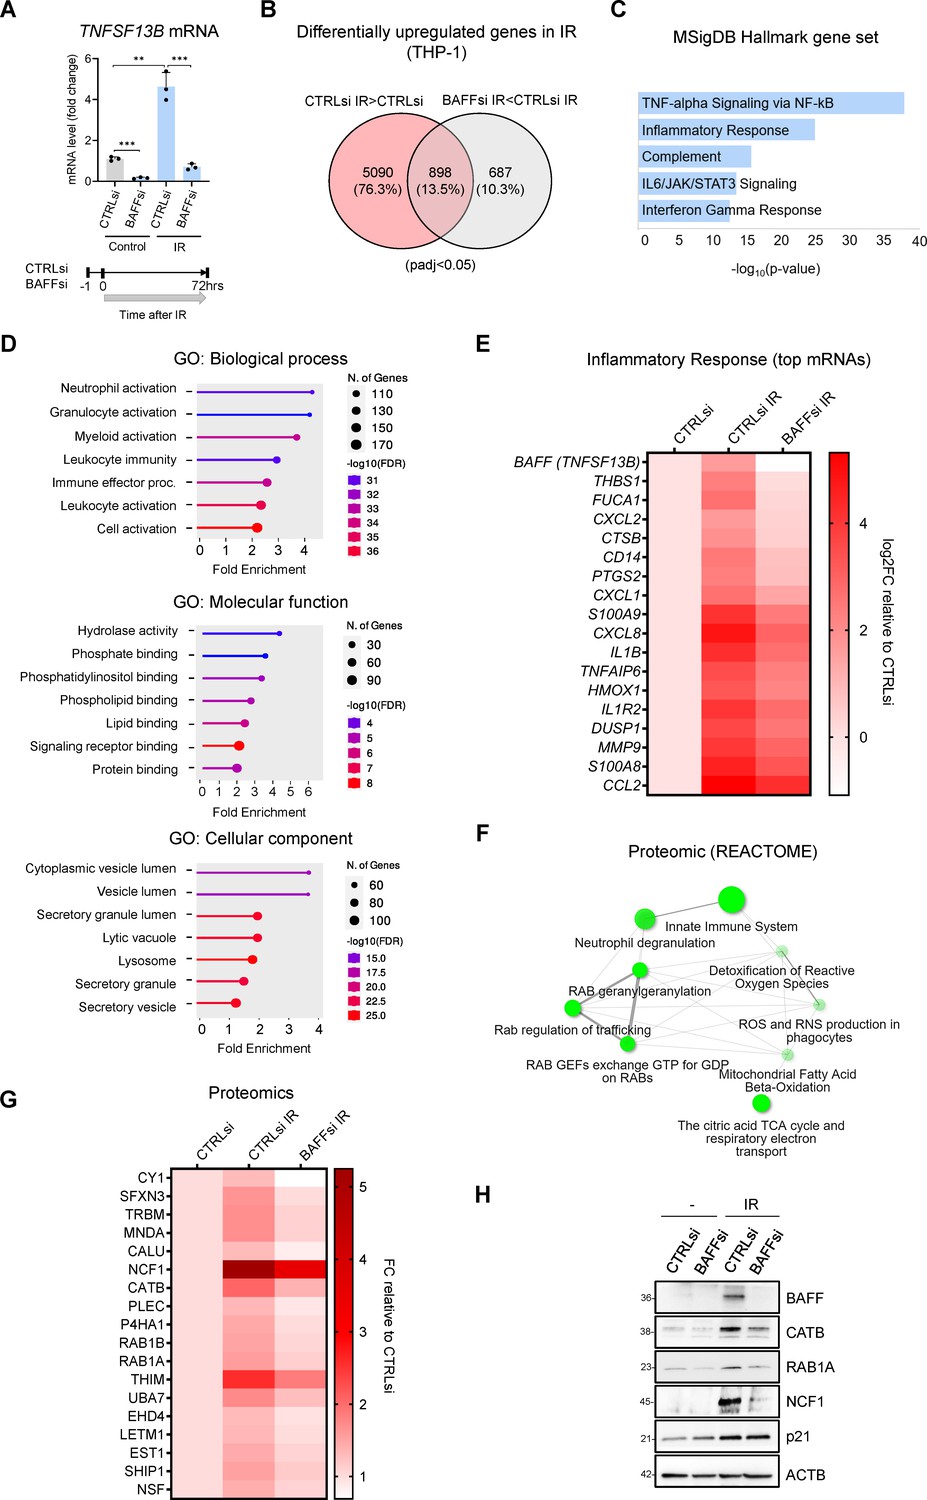
Transcriptomic and proteomic analysis in THP-1 cells suggests a role for BAFF in senescence-associated inflammation.
(A) RT-qPCR analysis of the levels of TNFSF13B mRNA in THP-1 cells transfected with CTRLsi or BAFFsi, irradiated 18 hr later (5 Gy), and assessed 72 hr after that. ACTB mRNA levels were measured and used for data normalization. Bottom, schematic of the timeline of BAFF silencing and exposure to IR in THP-1 cells. (B) Venn diagram of mRNAs identified by RNA-seq analysis as being differentially upregulated in THP-1 cells transfected with a control siRNA (CTRLsi) or BAFF siRNA (BAFFsi) following exposure to IR (5 Gy, collected 72 hr later). Red circle: mRNAs upregulated in CTRLsi exposed to IR (CTRLsi IR) relative to non-irradiated cells (CTRLsi). Gray circle: mRNAs less induced in BAFFsi cells exposed to IR (BAFFsi IR) relative to CTRLsi exposed to IR (CTRLsi IR). A complete list of genes from the RNA-seq analysis is available (GSE213993 and Figure 3—source data 1); padj <0.05. (C) Molecular Signatures Database (MSigDB) hallmark gene set summarizing the differentially expressed genes obtained from (B); diagram was created with EnrichR and gene sets were ordered by p value. (D) Gene ontology (Biological Processes, Molecular Function and Cellular Component) of the differentially upregulated mRNAs identified in (B). (E) Heatmap of the differentially upregulated genes identified in (B) and included in the GO terms ‘Leukocyte activation’, and ‘Immune effector process’, as well as those present in the MSigDB Hallmark term ‘Inflammatory Response’. Values are averages of duplicates. Top genes upregulated in IR were sorted according to their greater reduction after BAFF silencing. Data are shown as Log2FC in gene expression relative to untreated cells (CTRLsi: log2FC = 0). (F) Reactome network showing the most highly enriched categories of proteins differentially upregulated in THP-1 cells transfected with control (CTRLsi) or BAFF-directed (BAFFsi) siRNAs and the next day exposed to 5 Gy IR or left untreated and collected 72 hr later (complete proteomic datasets are in Figure 3—source data 2; Cutoff fold change was 1.3). Two pathways (nodes) are connected if they share 10% or more proteins. Darker nodes are more significantly enriched protein sets; larger nodes represent larger protein sets. Thicker edges represent more overlapped proteins. (G) Heatmap of the top differentially upregulated proteins between CTRLsi and BAFFsi. Top proteins increased after IR were sorted according to their greater reduction after BAFF silencing. Data are shown as fold change between PSM (peptide spectrum matches) relative to the untreated (CTRLsi: FC = 1). Cutoff: ([FC]>1.3, protein with PSM above 15). A complete list of differentially upregulated proteins is available in Figure 3—source data 2. (H) Western blot analysis of representative proteins identified from the proteomic analysis in (G). p21 was included as a control for senescence and ACTB as a loading control. Diagrams in (D,F) were created with ShinyGO.
-
Figure 3—source data 1
RNA-seq analysis performed in THP-1 cells transfected with CTRLsi or BAFFsi and treated with IR.
- https://cdn.elifesciences.org/articles/84238/elife-84238-fig3-data1-v1.zip
-
Figure 3—source data 2
Proteomic analysis performed in THP-1 cells transfected with CTRLsi or BAFFsi and treated with IR.
- https://cdn.elifesciences.org/articles/84238/elife-84238-fig3-data2-v1.zip
-
Figure 3—source data 3
Uncropped immunoblots for Figure 3.
- https://cdn.elifesciences.org/articles/84238/elife-84238-fig3-data3-v1.zip
Figure 3—figure supplement 1
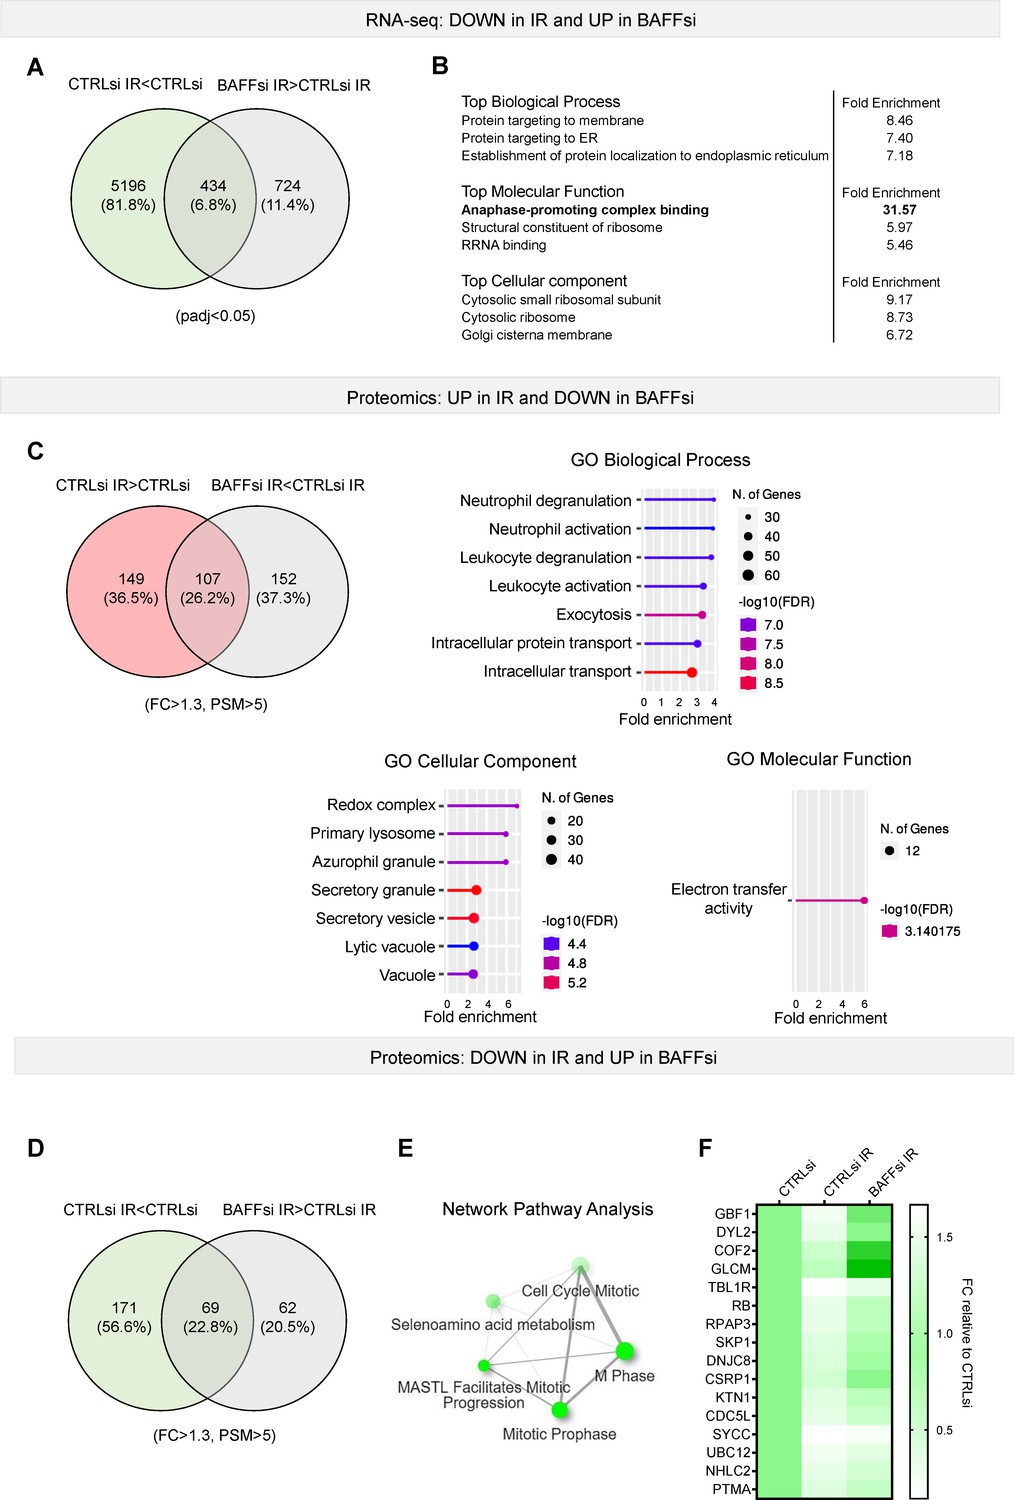
Extended data from Figure 3.
(A) Venn diagram showing the mRNAs differentially downregulated in THP-1 cells transfected with control siRNA (CTRLsi) or BAFF siRNA (BAFFsi) upon IR (5 Gy IR, collected 72 hr later). Green circle: THP-1 cells exposed to IR (CTRLsi IR) relative to untreated cells (CTRLsi). Gray circle: BAFFsi THP-1 cells exposed to IR relative to CTRLsi THP-1 cells exposed to IR. A complete list of genes from the RNA-seq analysis is available (GSE213993 and Figure 3—source data 1); cutoffs: padj <0.05. (B) Gene ontology analysis performed on the differentially downregulated mRNAs identified in (A). (C) Top left, Venn diagram showing the proteins increased after IR (red) and those less upregulated in IR after silencing BAFF (gray) in THP-1 cells. Cells were collected and processed for proteomics as described in Materials and methods. Cutoff for proteomic data: [fold change]>1.3. Right and bottom, GO analysis (Biological Processes, Molecular Function and Cellular Component) was performed on the differentially upregulated proteins. (D) Venn diagram showing the proteins reduced after IR (green) and those less downregulated in IR after BAFF silencing in THP-1 cells (gray). (E) Reactome network analysis highlighting the most highly enriched categories of proteins differentially reduced in CTRLsi or BAFFsi THP-1 cells 72 hr after treatment with IR (5 Gy). The plot shows the relationship between the enriched pathways. Two pathways (nodes) are connected if they share 10% or more proteins. Darker nodes are more significantly enriched protein sets; bigger nodes represent larger protein sets; thicker edges represent protein sets with greater overlap. (F) Heatmap of the top proteins differentially reduced in BAFFsi IR and CTRLsi IR. Data are shown as fold change between PSM relative to the control (CTRLsi: FC = 1). Cutoff: [FC]>1.3, proteins with detected PSM score above 5. Diagrams in (C, E) were created with ShinyGO.
Figure 4 with 1 supplement
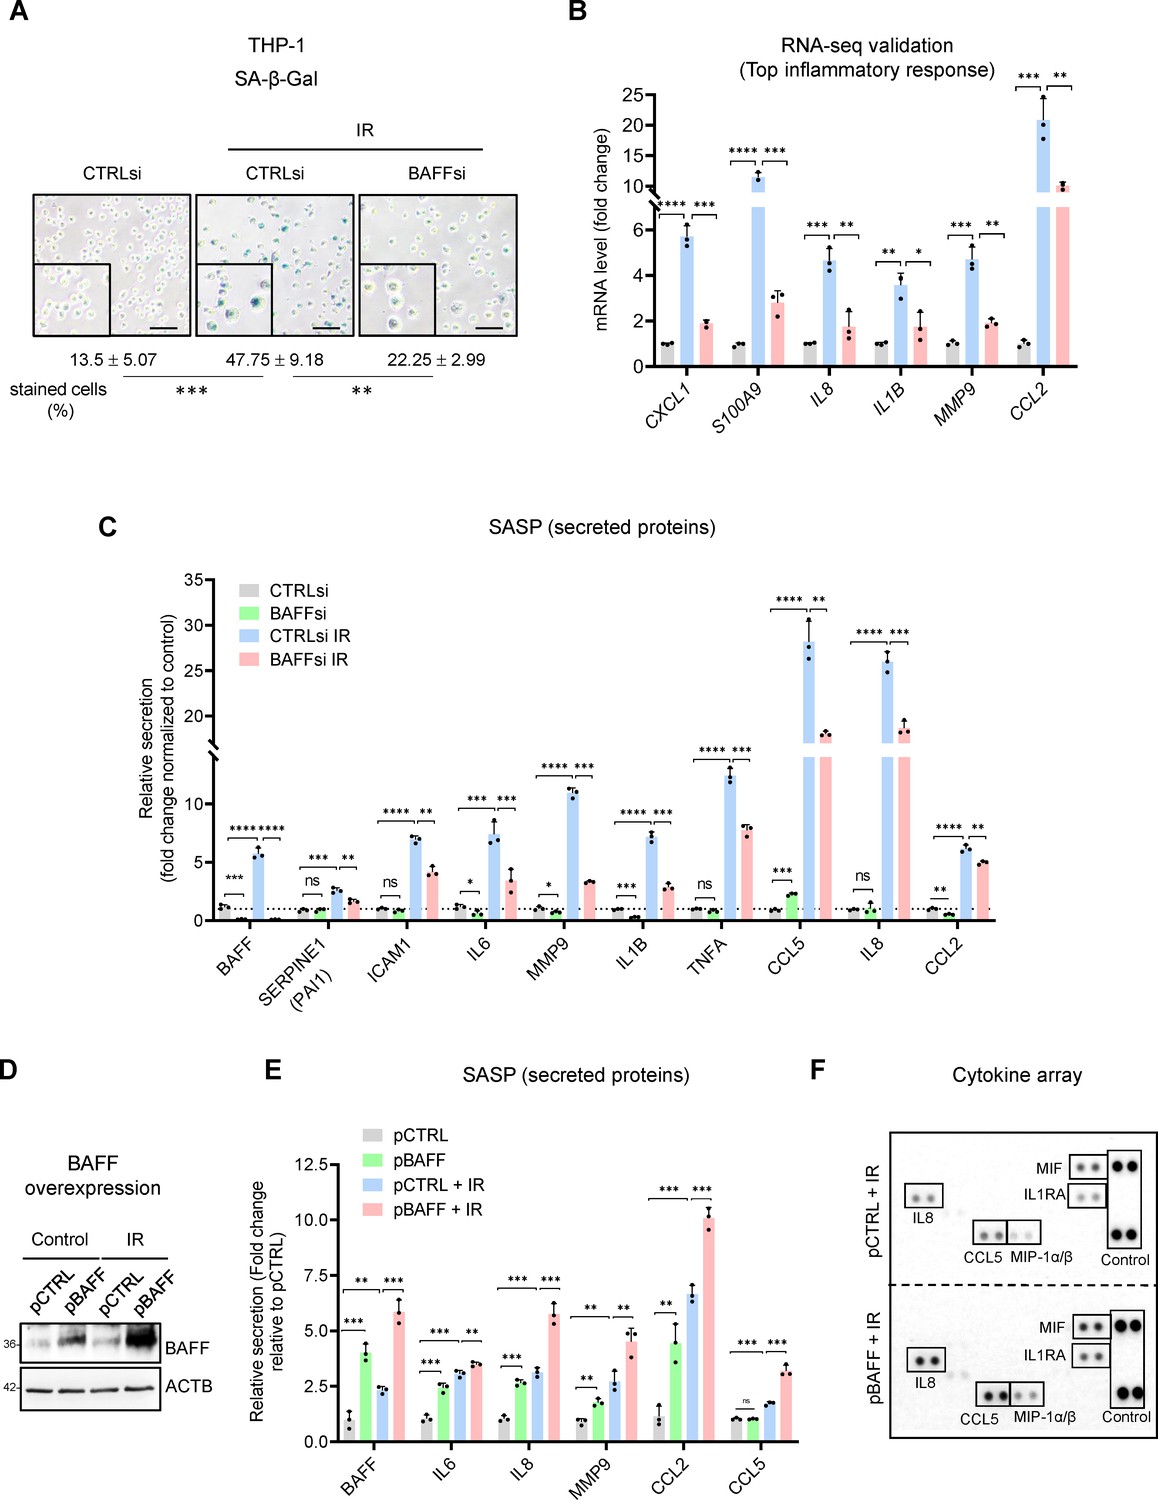
BAFF silencing reduces senescence traits in irradiated monocytes, BAFF overexpression increases SASP secretion.
(A) SA-β-Gal activity assay in THP-1 cells transfected with a control siRNA (CTRLsi) or BAFF siRNA (BAFFsi), following exposure to IR (5 Gy, collected 72 hr later); SA-β-Gal-positive cells (% of total cells) were quantified by percentage (%) of positively stained cells as described (Materials and methods). Scale bars, 100 μm. (B) RT-qPCR analysis of a subset of differentially expressed mRNAs identified through RNA-seq analysis (Figure 3E) and encoding SASP factors. ACTB mRNA levels were measured and used for data normalization. (C) Relative levels (fold change) of secreted cytokines and chemokines in THP-1 cells processed as in (A), as measured by multiplex ELISA 72 hr after IR (5 Gy). (D,E) THP-1 cells were transfected for 16 hr with a control plasmid (pCTRL) or a plasmid to express BAFF (pBAFF) and then were either left untreated or treated with IR (5 Gy); 72 hr later, whole-cell lysates were studied by western blot analysis (D), and multiplex ELISA assay to detect BAFF and additional SASP factors (E). Secretion levels are shown as relative fold change compared to pCTRL group. (F) Cytokine array analysis performed on the media of THP-1 cells that were transfected with Control (pCTRL) or BAFF (pBAFF) plasmids, treated with IR (5 Gy) 18 hr later, and assayed 72 hr after that. Reference control spots are present on each individual array. Media were collected from 2×10⁶ cells per sample. Significance (*, p<0.05; **, p<0.01; ***, p<0.001; ****, p<0.0001) was assessed by Student’s t-test.
-
Figure 4—source data 1
Uncropped western blots for Figure 4.
- https://cdn.elifesciences.org/articles/84238/elife-84238-fig4-data1-v1.zip
Figure 4—figure supplement 1
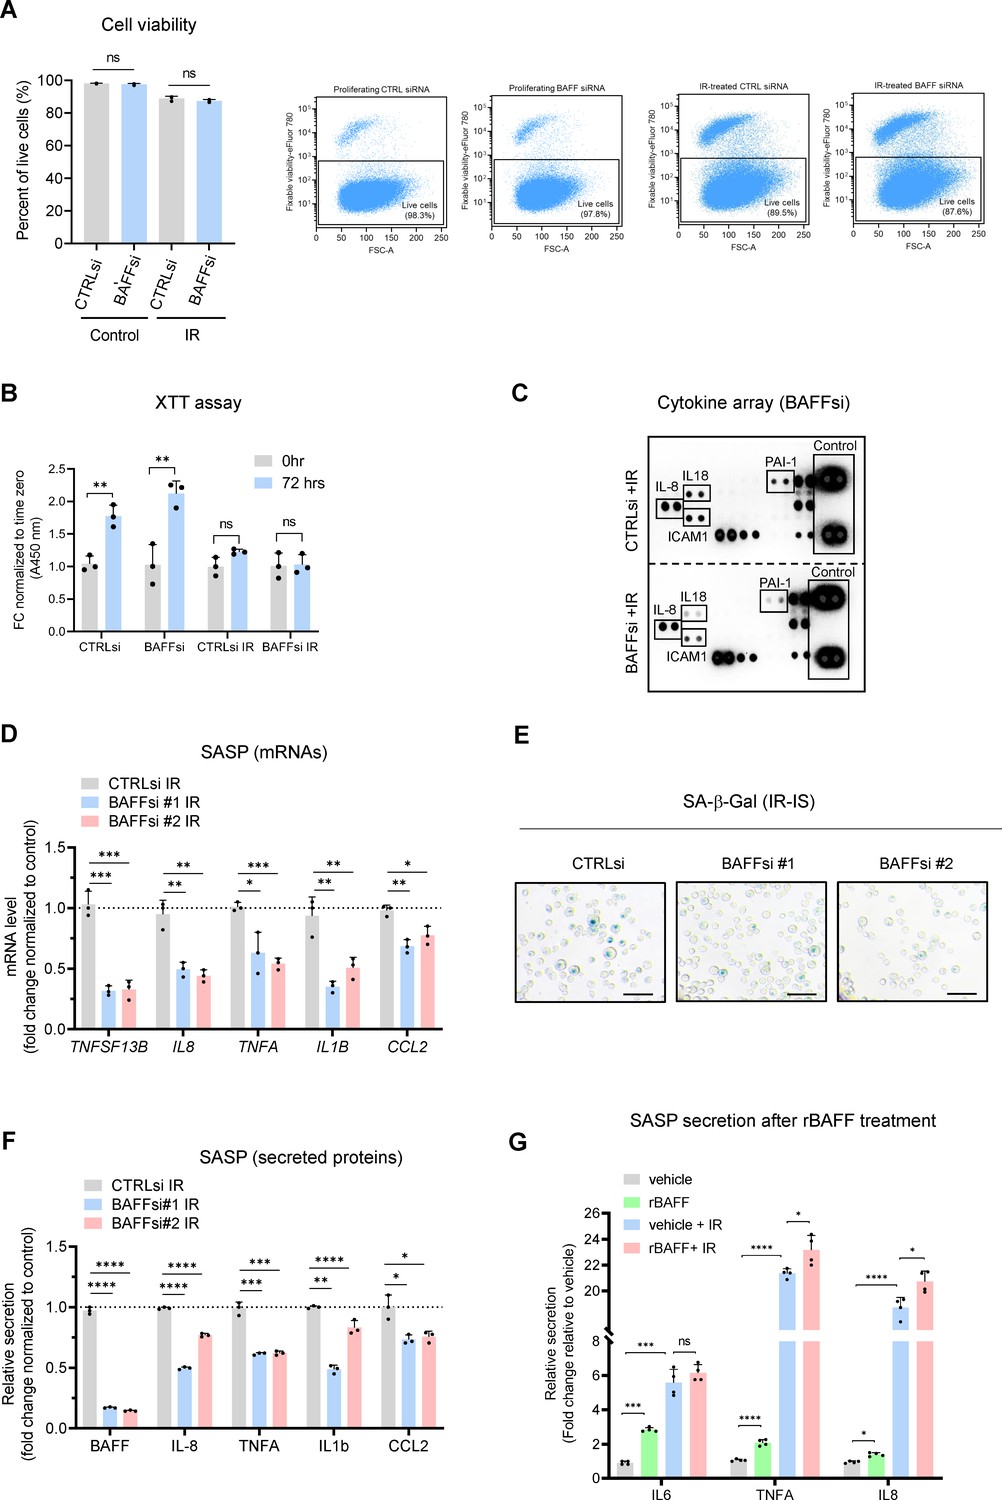
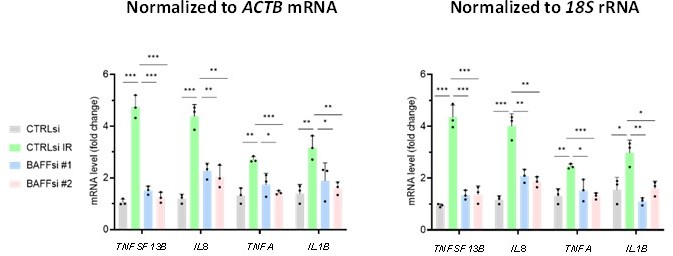
Extended data from Figure 4.
(A) THP-1 cells were transfected with CTRLsi or BAFFsi; 18 hr later, they were left untreated (Control) or irradiated with 5 Gy (IR), and 72 hr after that they were assayed for cell viability by flow cytometry (see Materials and methods). (B) THP-1 cells treated as in (A) were assayed for cell growth/viability by the XTT assay at the indicated times. (C) Cytokine array performed using the media of THP-1 cells treated as in (A). The high exposure was chosen to appreciate differences in low-abundance proteins like IL18 and PAI-1. Positive control spots are present on each individual array. Media were collected from 2×10⁶ cells per sample. (D–F) THP-1 cells were transfected with CTRLsi or with two different individual BAFF-directed siRNAs; 18 hr later, cells were irradiated with 5 Gy (IR) and evaluated 72 hr later by RT-qPCR analysis (D), detection of SA-β-Gal signals (E) and multiplex ELISA (F). Scale bars, 100 μm. The levels of ACTB mRNA were used for sample normalization. (G) Multiplex ELISA to measure secreted factors in THP-1 cells that were treated with either vehicle (DMSO) or 200 ng/ml human recombinant 60-mer BAFF (Adipogen), in untreated cells or irradiated cells (5 Gy) immediately after irradiation and up to 72 hr. Significance (*, p<0.05; **, p<0.01; ***, p<0.001; ****, p<0.0001) was assessed with Student’s t-test.
-
Figure 4—figure supplement 1—source data 1
Uncropped western blots.
- https://cdn.elifesciences.org/articles/84238/elife-84238-fig4-figsupp1-data1-v1.zip
Figure 5 with 1 supplement
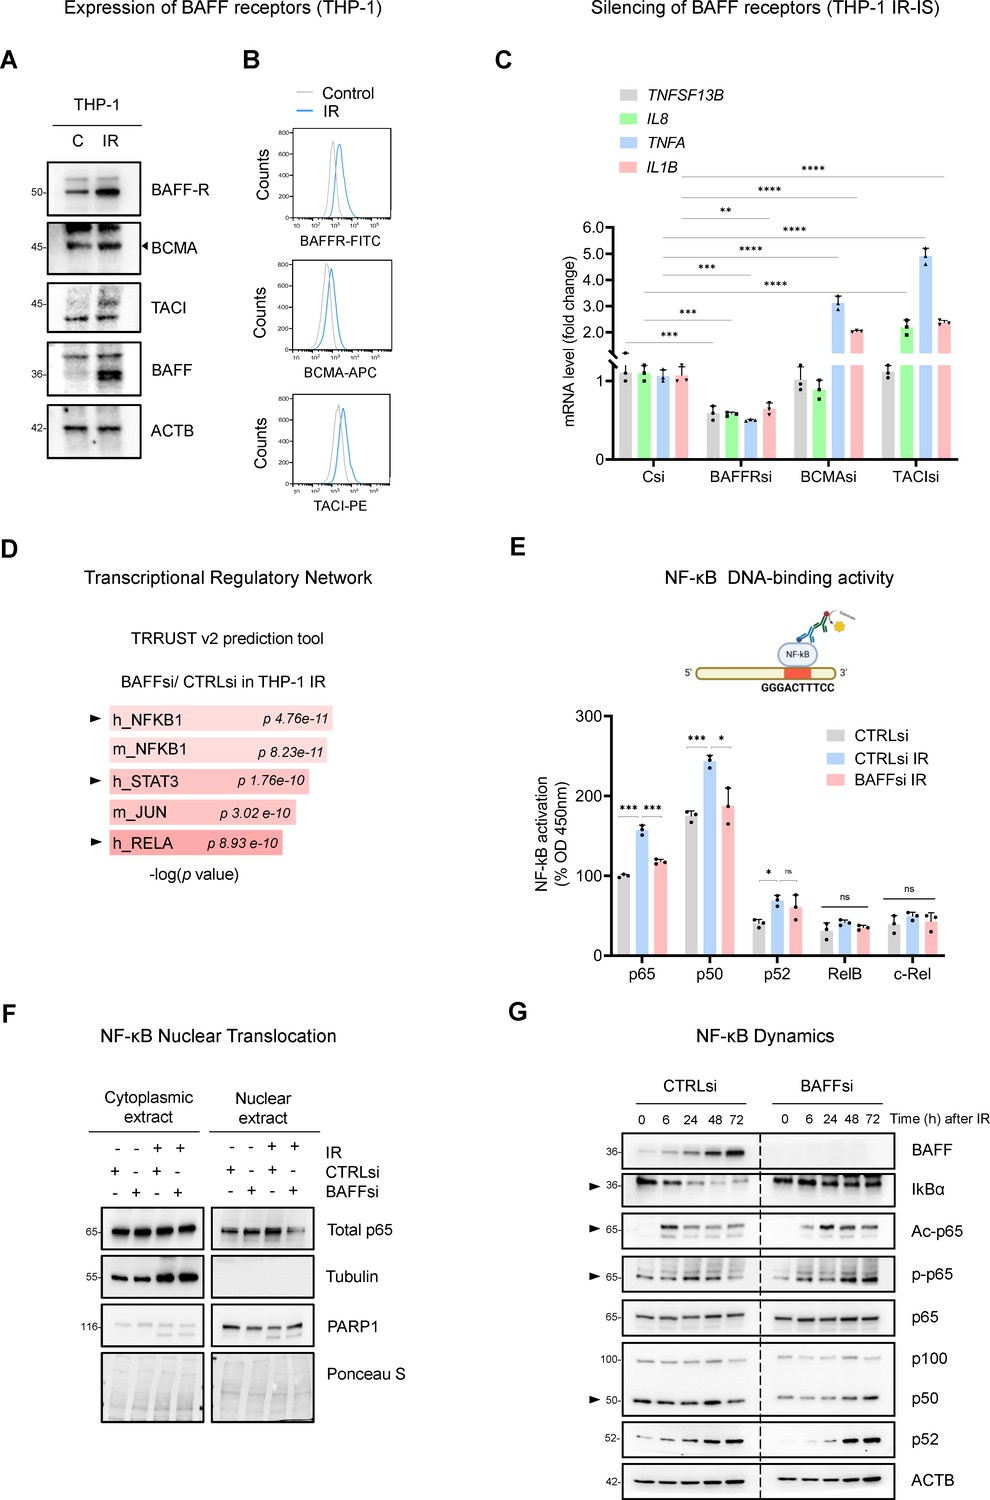
BAFF promotes NF-κB activation in IR-treated THP-1 cells.
(A) Western blot analysis of BAFF receptors in THP-1 cells untreated or irradiated with 5 Gy and cultured for 6 days. Due to the low levels of TACI, contrast was increased on the acquired image. (B) Flow cytometry analysis of THP-1 cells expressing surface BAFF receptors 6 days after either no treatment or treatment with IR (5 Gy). (C) RT-qPCR analysis of the levels of representative SASP mRNAs in THP-1 cells transfected with CTRLsi or siRNA targeting BAFF receptors, irradiated 18 hr later (5 Gy), and assessed 72 hr after that. ACTB mRNA levels were measured and used for data normalization. (D) EnrichR analysis of the differentially abundant mRNAs obtained from Figure 3B. The TRRUST v2 analysis predicts the transcription factors potentially affected by BAFF silencing in THP-1 cells. (E) TransAM NF-κB Activation Assay (Materials and methods) performed using THP-1 nuclear extracts to evaluate the binding of different NF-κB subunits to a DNA consensus sequence (top), as measured at 450 nm. Each antibody-specific signal was normalized to the respective blank control. Finally, the basal activity of p65 in the untreated control sample (CTRLsi) was set at 100% and all other values were normalized to it. (F) Western blot analysis of p65 levels in nuclear and cytoplasmic fractions of THP-1 cells that were transfected overnight with CTRLsi or BAFFsi and the next day were either left untreated or irradiated and collected 72 hr later. Cytoplasmic and nuclear markers (Tubulin and PARP1, respectively) were included to monitor the fractionation procedure; Ponceau S staining served to assess equal loading and transfer. (G) Western blot analysis of the proteins in whole-cell extracts prepared from THP-1 cells that were transfected with either CTRLsi or BAFFsi, then exposed to IR (5 Gy) and assessed at the indicated times. Arrowheads point to signals showing differences in NF-κB kinetics after BAFF silencing. Significance (*, p<0.05; **, p<0.01; ***, p<0.001; ****, p<0.0001) was assessed by Student’s t-test.
-
Figure 5—source data 1
Uncropped western blots for Figure 5.
- https://cdn.elifesciences.org/articles/84238/elife-84238-fig5-data1-v1.zip
Figure 5—figure supplement 1
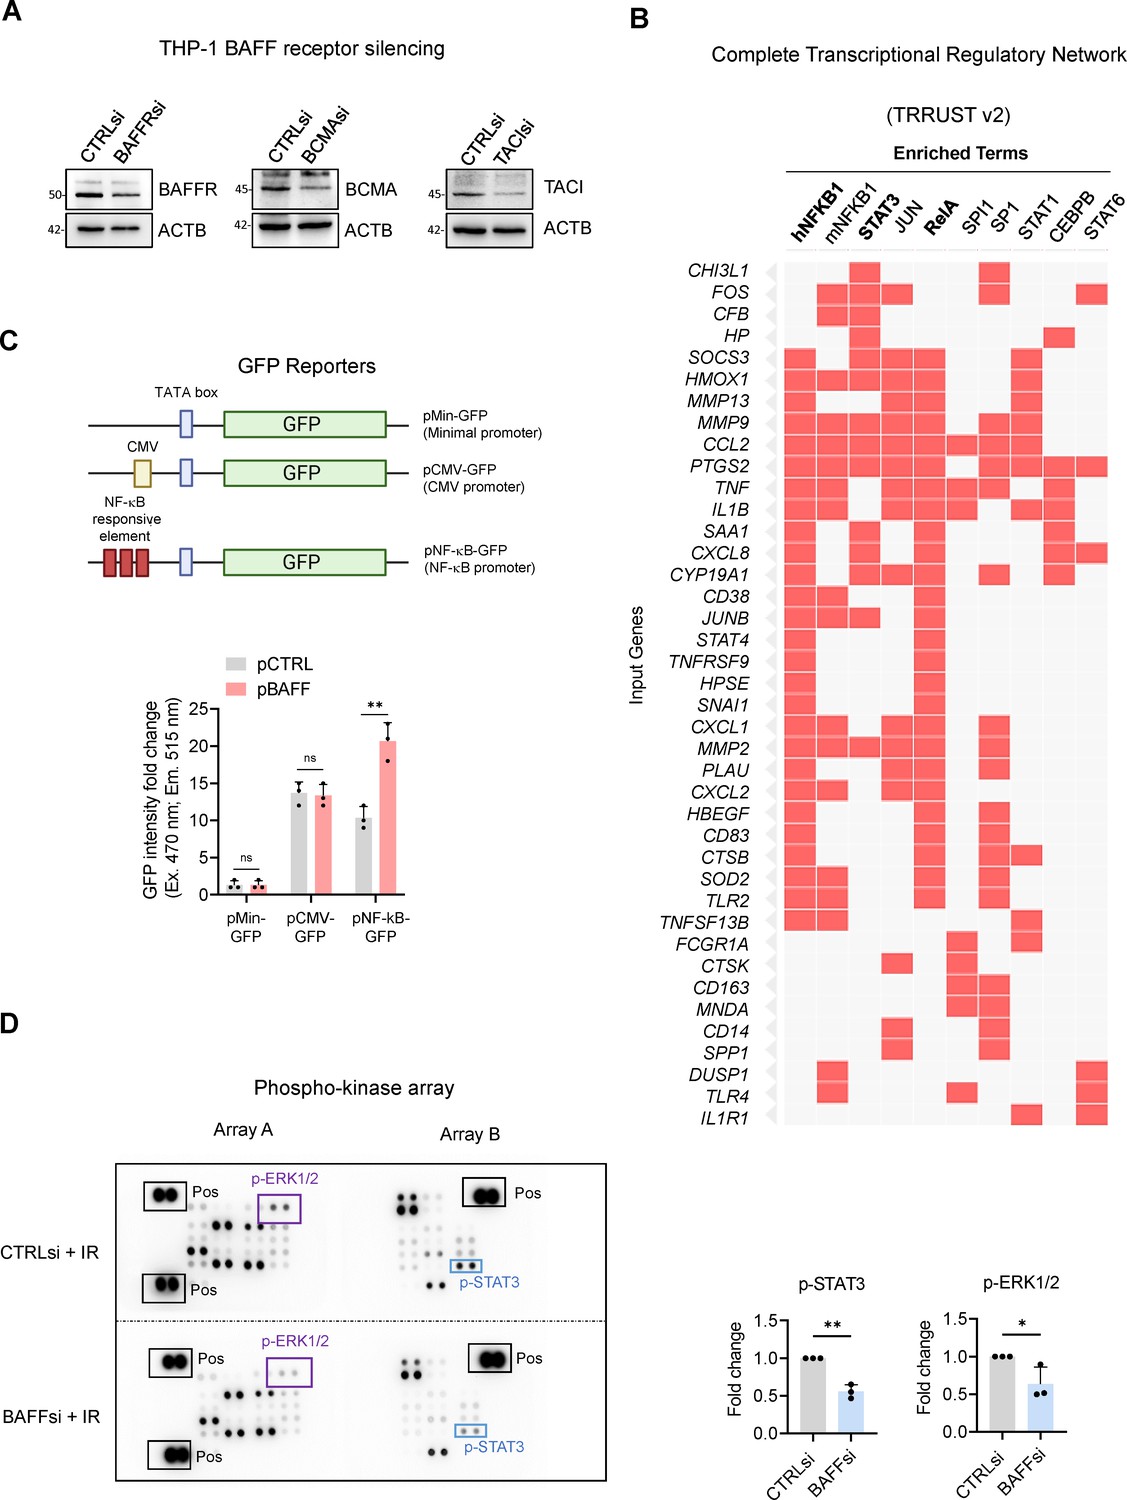
Extended Data from Figure 5.
(A) THP-1 cells were transfected with CTRLsi or siRNAs directed at BAFF receptors (BAFFRsi, BCMAsi, TACIsi); 18 hr later, cells were exposed to IR and analyzed 72 hr after that. The levels of BAFF receptors and the silencing efficiencies were assessed by western blot analysis. (B) Complete EnrichR analysis performed on the differentially expressed genes from Figure 3B. The analysis predicts the transcription factors potentially affected by BAFF silencing in THP-1 cells. Each column shows the individual genes under the control of a specific transcription factor. (C) NF-κB reporter array performed in THP-1 cells. Top, schematic of the three constructs used to perform the NF-κB reporter analysis (pNF-κB-GFP and controls pMin-GFP and pCMV-GFP) in THP-1 cells, each one of which was individually co-transfected with pCTRL or pBAFF. Bottom, 72 hr after transfection, fluorometric analysis was performed in THP-1 cells and GFP intensity was expressed as fold change relative to the levels detected in pMin-GFP; more details in Material and methods. (D) Phosphoarray analysis of whole-cell lysates (600 μg) prepared from THP-1 cells that had been transfected with CTRLsi or BAFFsi, 18 hr later subjected to IR, and analyzed 72 hr after that. Reference control spots (‘Pos’) are present on each array. Densitometry analysis of differentially phosphorylated and statistically significant proteins, measured from three independent replicates (see Figure 5—figure supplement 1—source data 1).
-
Figure 5—figure supplement 1—source data 1
Uncropped western blots and arrays.
- https://cdn.elifesciences.org/articles/84238/elife-84238-fig5-figsupp1-data1-v1.zip
Figure 6 with 1 supplement
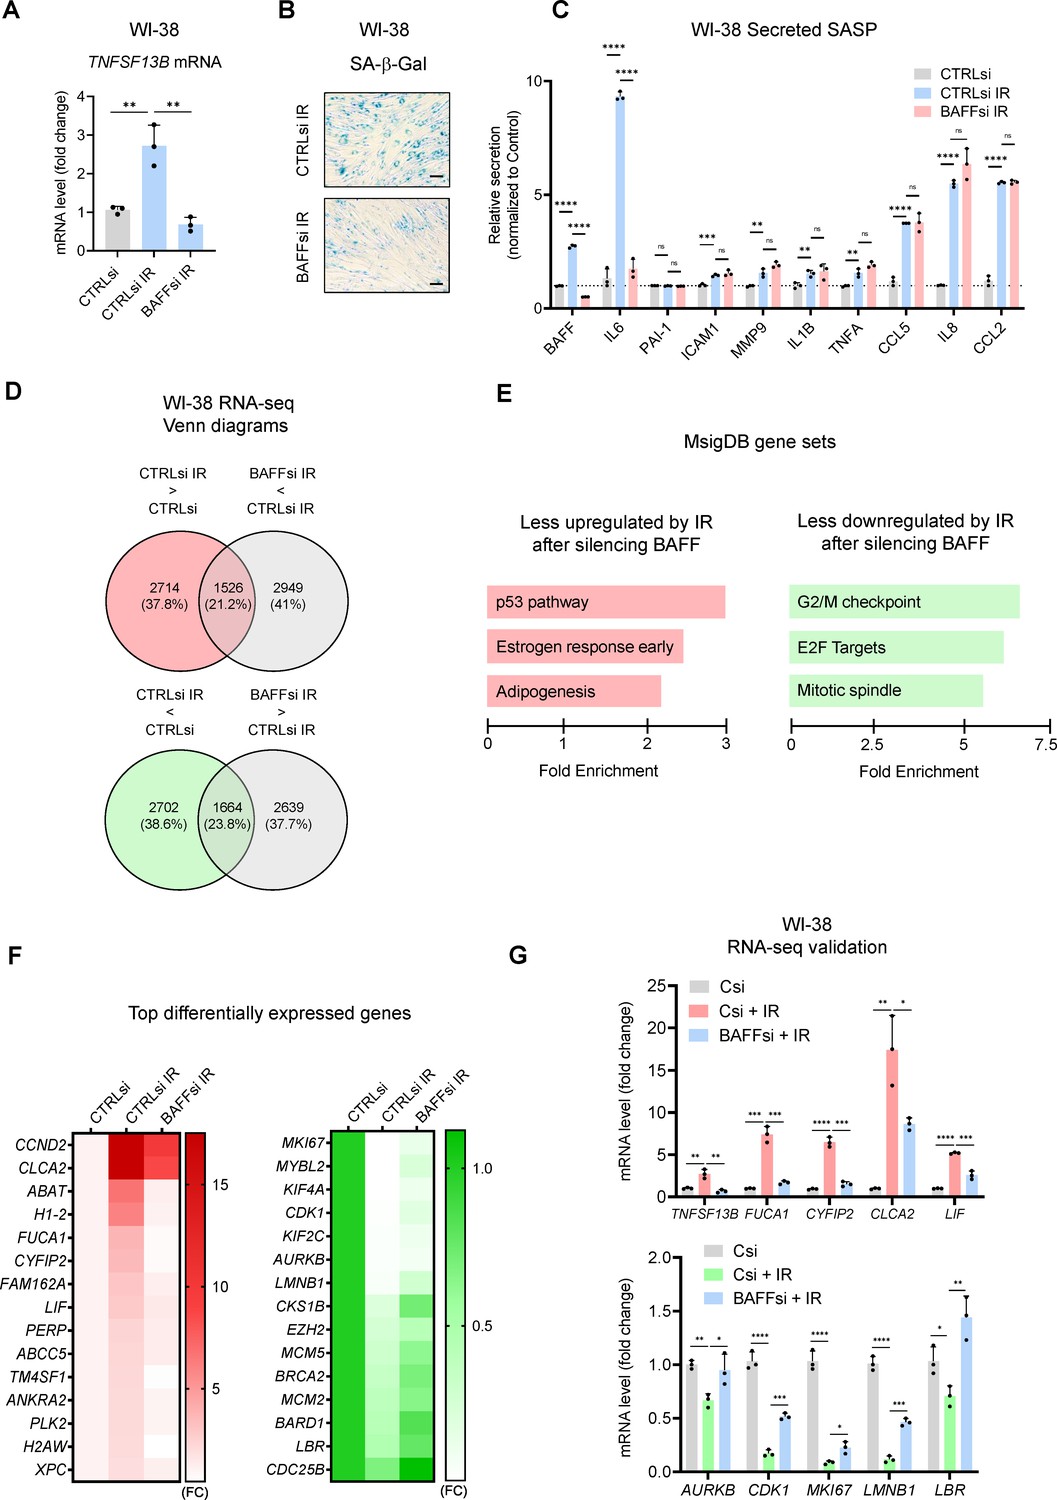
Transcriptomic analysis suggests a role for BAFF in p53 activation in senescent WI-38 fibroblasts.
(A) RT-qPCR analysis of TNFSF13B mRNA levels in WI-38 fibroblasts transfected with CTRLsi or BAFFsi, cultured for 18 hr, then left untreated or treated with a single dose of IR (10 Gy), and assayed 10 days later (Materials and methods). ACTB mRNA levels were measured and used for data normalization. (B) SA-β-Gal activity assay in WI-38 cells treated as in (A). Scale bar, 100 μm. (C) Levels of BAFF, IL6, and other SASP factors in the culture media of WI-38 cells treated as in (A), measured by multiplex ELISA. (D) WI-38 cells processed as described in (A) were subjected to RNA-seq analysis (GSE213993; Figure 6—source data 1). Top, mRNAs showing increased abundance after IR (red) and mRNAs showing reduced abundance after silencing BAFF (gray) are identified at the intersection (padj <0.05). Bottom, mRNAs showing reduced abundance after IR (green) and higher levels after silencing BAFF (gray) are identified at the intersection (padj <0.05). (E) MSigDB hallmark gene set enrichment performed on the differentially expressed mRNAs in WI-38 fibroblasts. Left, pathways less upregulated by IR after silencing BAFFsi. Right, pathways less reduced by IR after silencing BAFFsi. Bars are ordered according to the fold enrichment of individual pathways. (F) Heatmaps of the top differentially expressed mRNAs from the top gene sets in (E). Data are average of two values and are shown as fold change (FC) relative to the control (CTRLsi FC = 1). Left, top mRNAs selectively induced by IR and reduced after silencing BAFF. Right, top mRNAs selectively reduced by IR but remaining expressed after silencing BAFF. (G) Validation by RT-qPCR analysis of representative mRNAs identified by RNA-seq analysis in (D) and listed in the heatmaps in (F). ACTB mRNA levels were used for data normalization. Significance (*, p<0.05; **, p<0.01; ***, p<0.001; ****, p<0.0001) was assessed by Student’s t-test.
-
Figure 6—source data 1
RNA-seq analysis performed in WI-38 fibroblasts transfected with CTRLsi or BAFFsi and treated with IR.
- https://cdn.elifesciences.org/articles/84238/elife-84238-fig6-data1-v1.zip
Figure 6—figure supplement 1
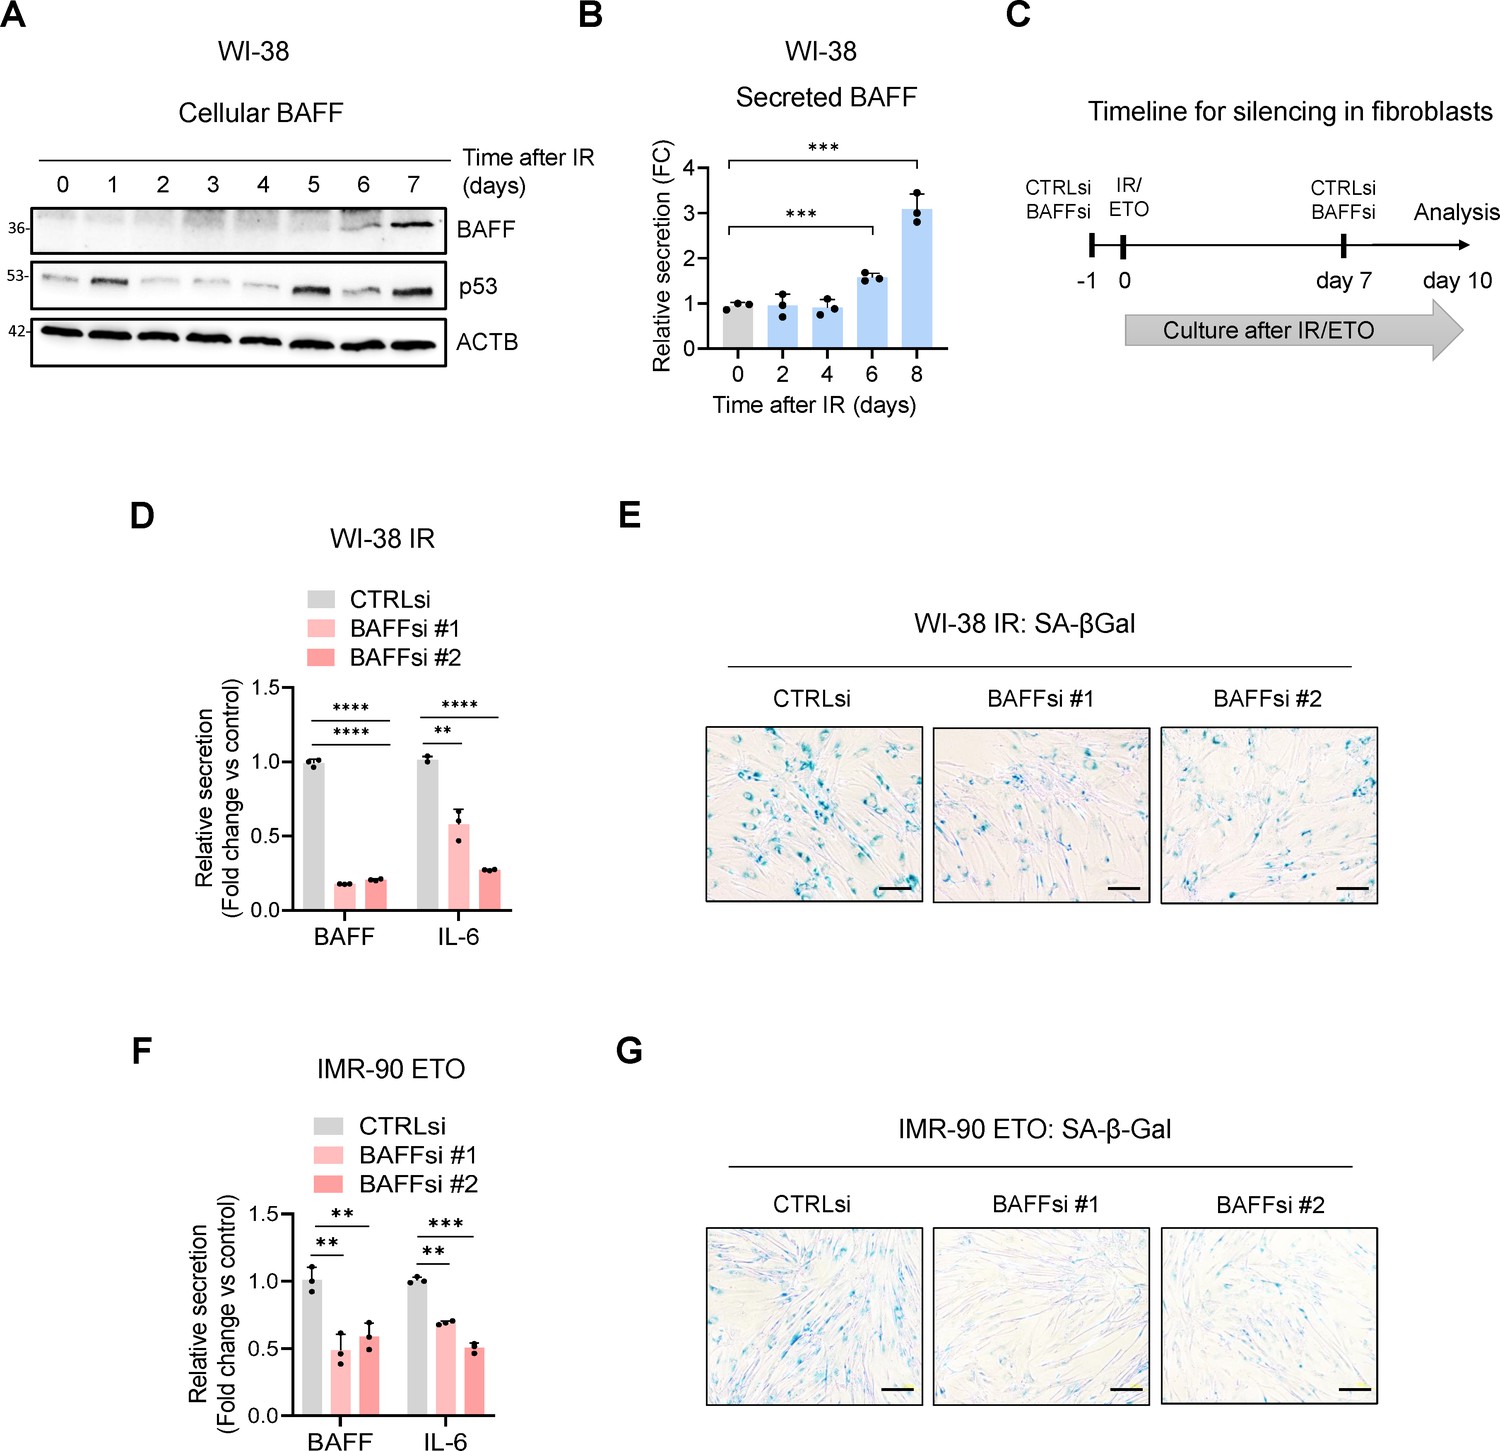
Extended data from Figure 6.
(A, B) WI-38 cells were treated with IR (10 Gy) and the levels of BAFF, total p53, and loading control ACTB were assessed by western blot analysis (A) and the levels of soluble secreted BAFF were assessed by ELISA (B) at the times indicated. (C) Schematic of the timeline of BAFF silencing and exposure to IR or ETO in primary fibroblasts (WI-38 and IMR-90 cells). (D, E) WI-38 fibroblasts were transfected with CTRLsi or with each of two individual BAFF siRNAs, and 18 hr later they were treated with 10 Gy (IR) and cultured for 10 days, whereupon ELISA (D) and SA-β-Gal activity assessment (E) were performed. (F, G) IMR-90 fibroblasts were transfected with CTRLsi or one of two individual BAFF siRNAs, and 18 hr later they were treated with 50 μM etoposide (ETO) for 72 hr and cultured for additional 7 days, for a total of 10 days, whereupon ELISA (F) and SA-β-Gal activity (G) were assayed. Scale bar, 100 μm. Significance (*, p<0.05; **, p<0.01; ***, p<0.001; ****, p<0.0001) was assessed with Student’s t-test.
-
Figure 6—figure supplement 1—source data 1
Uncropped western blots.
- https://cdn.elifesciences.org/articles/84238/elife-84238-fig6-figsupp1-data1-v1.zip
Figure 7 with 1 supplement
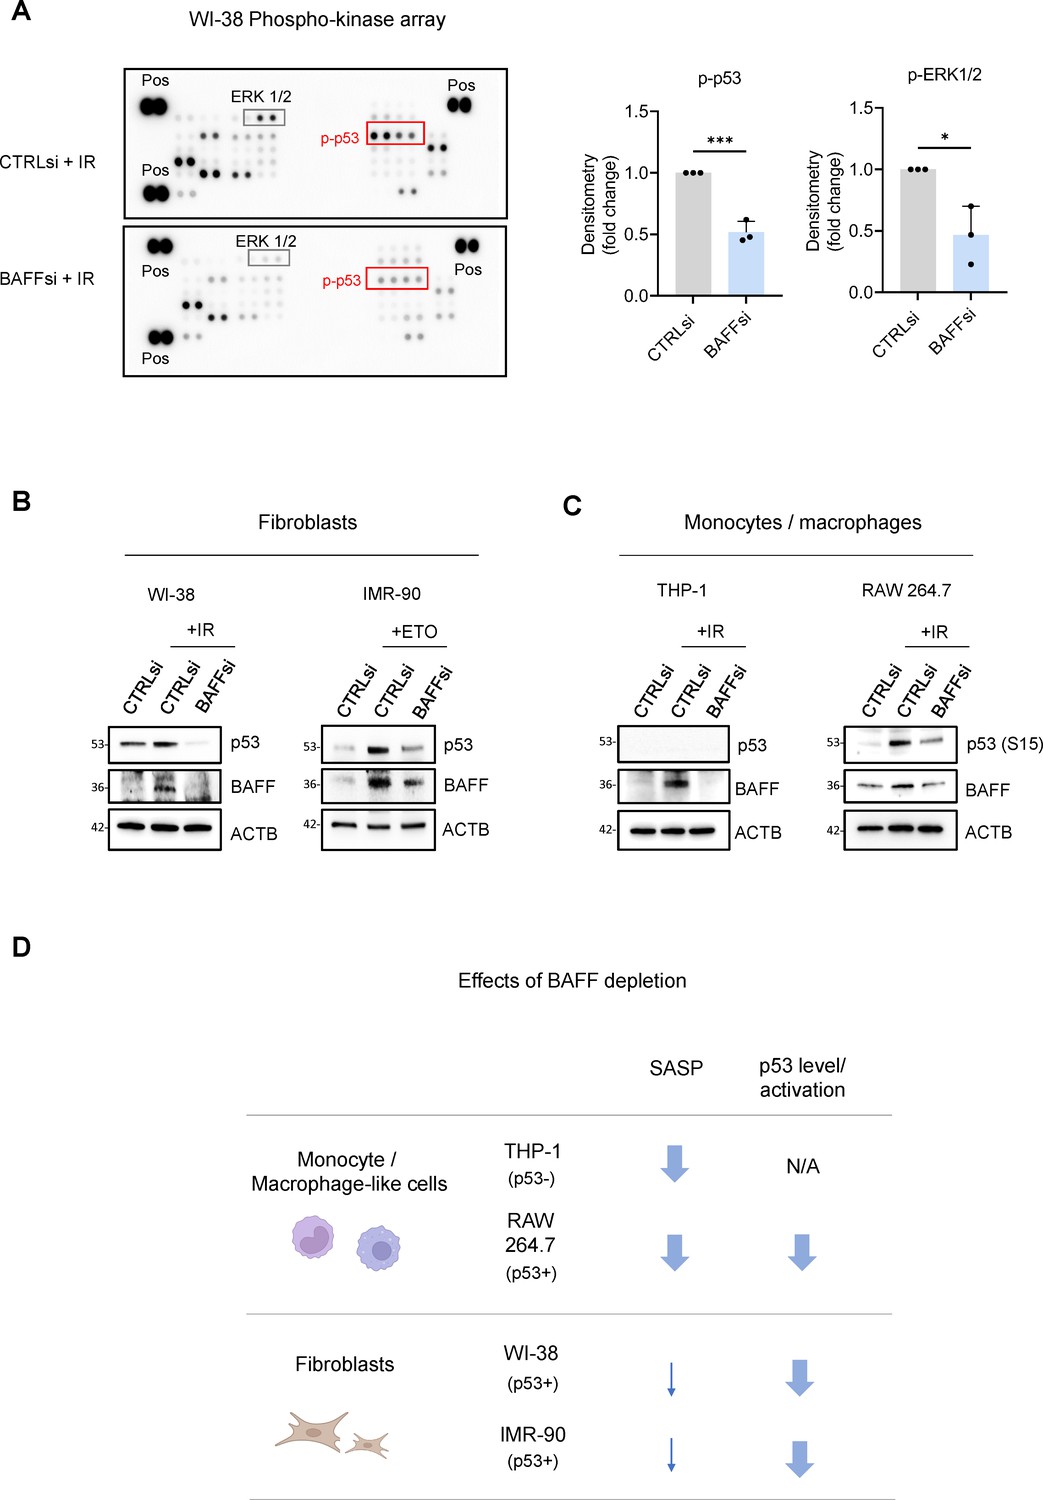
BAFF silencing reduces senescence traits and p53-dependent genes in fibroblasts.
(A) Left, phosphoarray analysis of whole-cell lysates prepared from WI-38 fibroblasts transfected with CTRLsi or BAFFsi, cultured for 18 hr, and then either left untreated or treated with a single dose of IR (10 Gy), and harvested 10 days later. The phosphoarray included positive control (‘Pos’) reference signals. Right: densitometry analysis of differentially phosphorylated and statistically significant proteins, averaged from three independent replicates (see Figure 7—source data 1). Significance in different panels (*, p<0.05; ***, p<0.001) was assessed by Student’s t-test. (B) Whole-cell lysates were prepared from WI-38 and IMR-90 fibroblasts transfected with CTRLsi or BAFFsi, treated with a single dose of IR (10 Gy, WI-38) or ETO (50 μM, IMR-90), and collected 10 days later. The levels of p53, BAFF, ACTB were assessed by western blot analysis. (C) Whole-cell lysates were prepared from THP-1 and RAW 264.7 cells transfected with CTRLsi or BAFFsi, treated with a single dose of IR (5 Gy) and collected 72 hr later. The levels of p53 (total or phosphorylated), BAFF, and ACTB were assessed by western blot analysis. (D) Schematic highlighting the different effects of BAFF depletion on the senescent phenotype of primary fibroblasts (WI-38, IMR-90) and monocyte/macrophage-like cells (THP-1, RAW 264.7). Arrows indicate a reduction in the observed phenotype. N/A: not applicable.
-
Figure 7—source data 1
Uncropped blots and arrays for Figure 7.
- https://cdn.elifesciences.org/articles/84238/elife-84238-fig7-data1-v1.zip
Figure 7—figure supplement 1
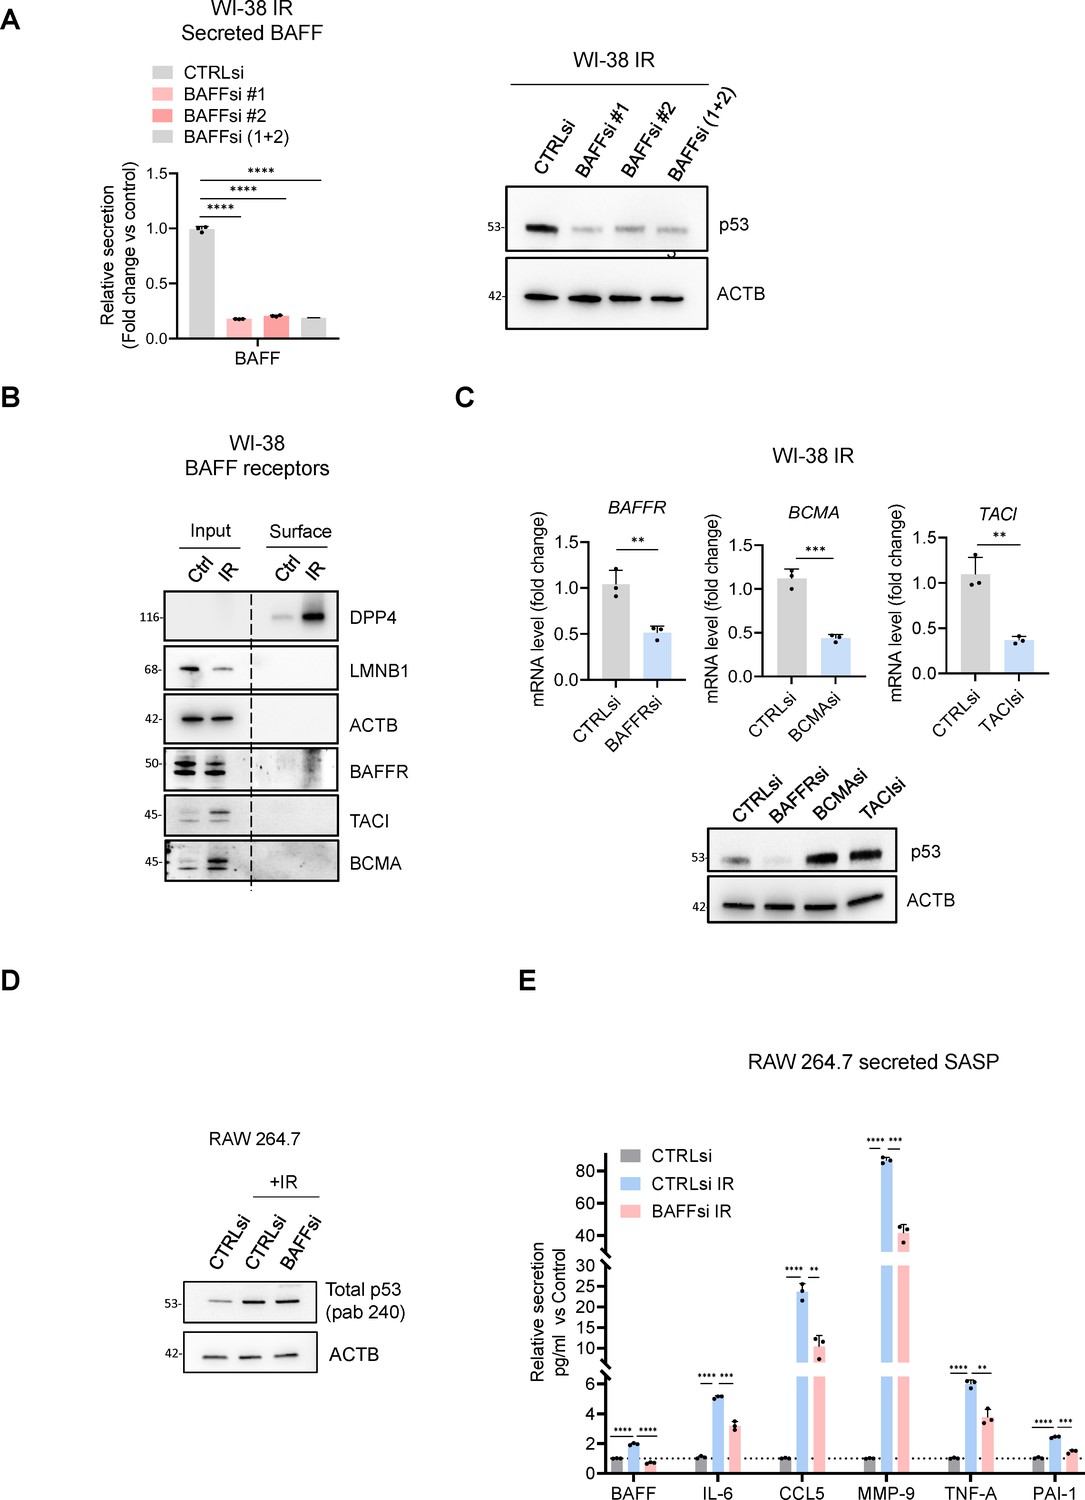
Extended data from Figure 7.
(A) WI-38 cells were transfected with CTRLsi or with BAFFsi (each of two individual siRNAs, and the two pooled siRNAs), exposed to IR (10 Gy), and cultured for 10 days, following the schematic in (Figure 6—figure supplement 1C). The level of BAFF was assessed by ELISA (left). The levels of total p53, and loading control ACTB were assessed by western blot analysis (right). (B) Pulldown of biotinylated surface proteins and western blot analysis showing the expression of the BAFF receptors in WI-38 cells untreated or treated with 10 Gy (IR) and collected 10 days later; DPP4 served as a positive control for senescence and a marker of surface proteins, while LMNB1 (nuclear marker) and ACTB (cytoplasmic marker) served as control for the quality of surface fractionation. (C) WI-38 cells were transfected with CTRLsi or siRNAs directed at BAFF receptors (BAFFRsi, BCMAsi, TACIsi), and then exposed to 10 Gy IR and cultured for 10 days. The level of silencing was assessed by RT-qPCR analysis (top) and the levels of total p53 and loading control ACTB were assessed by western blot (bottom). (D) RAW 264.7 cells were transfected with CTRLsi or BAFFsi; 18 hr later, cells were left untreated or treated with IR (5 Gy) and cultured for 72 hr, whereupon the levels of total p53 were assessed by western blot analysis; ACTB served as loading control. (E) RAW 264.7 cells were treated as in (D) and the culture media were used to quantify the levels of multiple secreted factors by multiplex ELISA.
-
Figure 7—figure supplement 1—source data 1
Uncropped western blots.
- https://cdn.elifesciences.org/articles/84238/elife-84238-fig7-figsupp1-data1-v1.zip
Figure 8
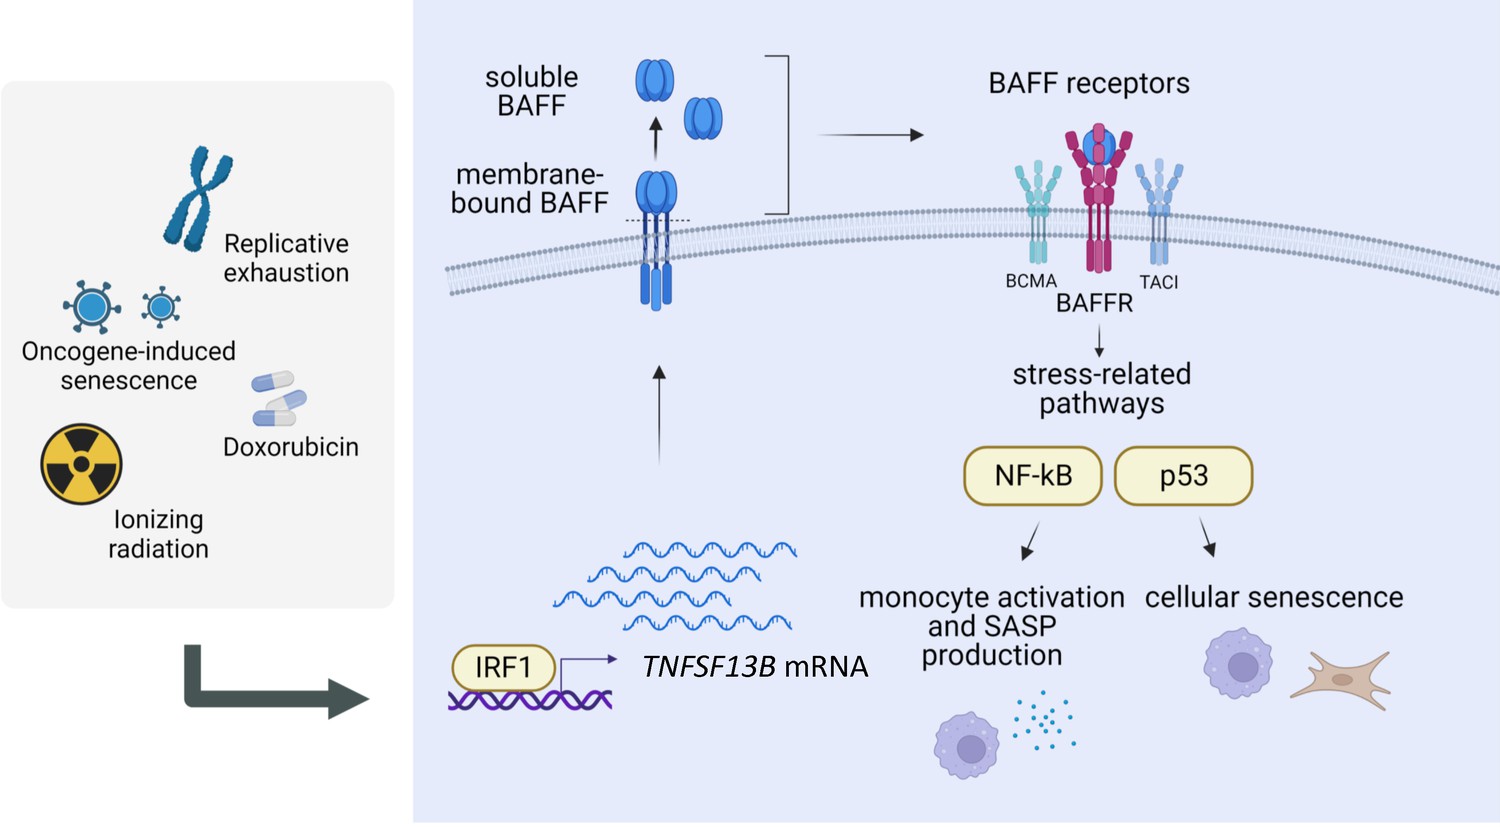
Regulation and role of BAFF in senescence.
Proposed model for the regulation and role of BAFF in senescence (created using BioRender). Following DNA damage, the TF interferon-regulated factor IRF1 induces the transcription of TNFSF13B mRNA. The protein BAFF is translated and inserted into the plasma membrane, where it can be further processed into a secreted form. Both forms of BAFF are increased in senescence, and both have been previously reported to be functional and capable of activating BAFF receptors (BAFFR, TACI, BCMA), which in turn stimulate stress-related pathways in a cell type-dependent manner, with a predominant activation of the NF-κB pathway in monocytic-like cells, and the p53 pathway in primary fibroblasts. Therefore, BAFF may have pleiotropic actions on senescence-associated phenotypes in different cell types. We propose that BAFF is a novel biomarker of senescence and a regulator of different senescence traits.
Author response image 1
Author response image 2
Author response image 3
Author response image 4
Tables
Appendix 1—key resources table
| Reagent type (species) or resource | Designation | Source or reference | Identifiers | Additional information |
|---|---|---|---|---|
| Gene (Homo sapiens) | TNFSF13B, (BAFF) | Ensembl | ENSG00000 102524 | TNF superfamily member 13b |
| Gene (Mus musculus) | Tnfsf13b, (Baff) | Ensembl | ENSMUSG0000 0031497 | TNF superfamily member 13b |
| Gene (Homo sapiens) | IRF1 | Ensembl | ENSG00000 125347 | Interferon regulatory factor 1 |
| Cell line (Homo sapiens) | THP-1 | ATCC | TIB-202 | Cell line Monocytes (AML) Sex: male |
| Cell line (Mus musculus) | RAW 264.7 | ATCC | TIB-71 | Cell line Macrophages/monocytes Karyotype: unspecified Sex: male |
| Cell line (Homo sapiens) | WI-38 | Coriell Institute | AG06814-J | primary fibroblasts Karyotype: normal, diploid Sex: female |
| Cell line (Homo sapiens) | IMR-90 | Coriell Institute | I90-79 | primary fibroblasts Karyotype: normal, diploid Sex: female |
| Antibody (mouse, monoclonal) | Actin | SCBT | sc-8432 | 1:10000 |
| Antibody (mouse, monoclonal) | GAPDH | SCBT | sc-47724 | 1:2000 |
| Antibody (mouse, monoclonal) | Tubulin | SCBT | sc-5286 | 1:2000 |
| Antibody (rabbit, monoclonal) | BAFF (human) | CST | 19944 | 1:500 |
| Antibody (rabbit, monoclonal) | BAFF (human) | Abcam | ab224710 | 1:500 |
| Antibody (rabbit, polyclonal) | BAFF (mouse) | Millipore Sigma | AB16530 | 1:500 |
| Antibody (rabbit, polyclonal) | IRF1 | ABClonal | A7692 | 1:500 |
| Antibody (rabbit, monoclonal) | IRF1 | CST | 8478 | Used for ChIP 1 μg / reaction |
| Antibody (rabbit, polyclonal) | IRF2 | ABClonal | A4843 | 1:500 |
| Antibody (rabbit, monoclonal) | p21 | CST | 2947 | 1:500 |
| Antibody (rabbit, monoclonal) | DPP4 | CST | 67138 | 1:1000 |
| Antibody (mouse, monoclonal) | p53-DO1 (human) | SCBT | sc-126 | 1:2000 |
| Antibody (mouse monoclonal) | p53-Pab240 (mouse) | Abcam | Ab26 | 1:1000 |
| Antibody (rabbit monoclonal) | p53-Ser15 (mouse) | CST | 12571 | 1:500 |
| Antibody | PARP1 | CST | 9425 | 1:2000 |
| Antibody (mouse monoclonal) | Cathepsin B | SCBT | sc-365558 | 1:1000 |
| Antibody (rabbit, monoclonal) | RAB1A | CST | 13075 | 1:1000 |
| Antibody (mouse monoclonal) | NCF1 | SCBT | sc-17845 | 1:1000 |
| Antibody (mouse monoclonal) | BAFFR | SCBT | sc-365410 | 1:500 |
| Antibody (rabbit, monoclonal) | TACI | CST | 96641 | 1:500 |
| Antibody (rabbit, monoclonal) | BCMA | CST | 88183 | 1:500 |
| Antibody (rabbit, monoclonal) | p65 | CST | 8242 | 1:1000 |
| Antibody (rabbit, monoclonal) | Ac-p65-K310 | CST | 12629 | 1:500 |
| Antibody (mouse, monoclonal) | Ikba | SCBT | sc-1643 | 1:500 |
| Antibody (rabbit, polyclonal) | p50 | CST | 3035 | 1:1000 |
| Antibody (rabbit, polyclonal) | p52 | CST | 4882 | 1:1000 |
| Recombinant DNA reagent (human) | TNFSF13B ORF Clone | GenScript | OHu22261 | BAFF overexpression plasmid |
| Sequence-based reagent | TNFSF13B f | IDT | PCR primers | CACAATTCAAAGGGGCAGTAA |
| Sequence-based reagent | TNFSF13B r | IDT | PCR primers | ACTGAAAAGGAGGGAGTGCAT |
| Sequence-based reagent | TNFSF13B pre-mrna f | IDT | PCR primers | CTGGAAGAGTGGGTTTCTAGC |
| Sequence-based reagent | TNFSF13B pre-mRNA r | IDT | PCR primers | GTTGGTGTTTCACTGTCTGCAATC |
| Sequence-based reagent | CDKN1A f | IDT | PCR primers | AGTCAGTTCCTTGTGGAGCC |
| Sequence-based reagent | CDKN1A r | IDT | PCR primers | CATGGGTTCTGACGGACAT |
| Sequence-based reagent | IRF1 f | IDT | PCR primers | CATGCCCTCCACCTCTGAAG |
| Sequence-based reagent | IRF1r | IDT | PCR primers | CCATCCACGTTTGTTGGCTG |
| Sequence-based reagent | IRF2 f | IDT | PCR primers | TCCTGAGTATGCGGTCCTGA |
| Sequence-based reagent | IRF2 r | IDT | PCR primers | AGATGGGACTGTCCTACAACT |
| Sequence-based reagent | IRF8 f | IDT | PCR primers | AGGTCTTCGACACCAGCCAGTT |
| Sequence-based reagent | IRF8 r | IDT | PCR primers | GCACGAGAATGAGTTTGGAGCG |
| Sequence-based reagent | BLIMP1 f | IDT | PCR primers | CAGTTCCTAAGAACGCCAACAGG |
| Sequence-based reagent | BLIMP1 r | IDT | PCR primers | GTGCTGGATTCACATAGCGCATC |
| Sequence-based reagent | MYC f | IDT | PCR primers | TTCTCTCCGTCCTCGGATTCTCTG |
| Sequence-based reagent | MYC r | IDT | PCR primers | TCTTCTTGTTCCTCCTCAGAGTCG |
| Sequence-based reagent | TNFSF13B promoter f | IDT | PCR primers | AGCAGACAGAGTTCCCTTGC |
| Sequence-based reagent | TNFSF13B promoter r | IDT | PCR primers | TGGAGTTTGGATTGGCACAG |
| Sequence-based reagent | GAPDH promoter f | IDT | PCR primers | GCCAATCTCAGTCCCTTCCC |
| Sequence-based reagent | GAPDH promoter r | IDT | PCR primers | TAGTAGCCGGGCCCTACTTT |
| Sequence-based reagent | MX1 promoter f | IDT | PCR primers | CACTGCCCCCTCGTCGTGGCACCGC |
| Sequence-based reagent | MX1 promoter r | IDT | PCR primers | TTTCTGCTCGCTGGTTTCCAGA |
| Sequence-based reagent | FUCA1 f | IDT | PCR primers | GACTTCGGACCGCAGTTCACTG |
| Sequence-based reagent | FUCA 1 r | IDT | PCR primers | CCAGTTCCAAGACACAGGACTC |
| Sequence-based reagent | S100A9 f | IDT | PCR primers | GCACCCAGACACCCTGAACCA |
| Sequence-based reagent | S100A9 r | IDT | PCR primers | TGTGTCCAGGTCCTCCATGATG |
| Sequence-based reagent | CD14 f | IDT | PCR primers | CTGGAACAGGTGCCTAAAGGAC |
| Sequence-based reagent | CD14 r | IDT | PCR primers | GTCCAGTGTCAGGTTATCCACC |
| Sequence-based reagent | PTGS2 f | IDT | PCR primers | CGGTGAAACTCTGGCTAGACAG |
| Sequence-based reagent | PTGS2 r | IDT | PCR primers | GCAAACCGTAGATGCTCAGGGA |
| Sequence-based reagent | CTSB f | IDT | PCR primers | GCTTCGATGCACGGGAACAATG |
| Sequence-based reagent | CTSB r | IDT | PCR primers | CATTGGTGTGGATGCAGATCCG |
| Sequence-based reagent | CXCL1 f | IDT | PCR primers | AGCTTGCCTCAATCCTGCATCC |
| Sequence-based reagent | CXCL1 r | IDT | PCR primers | TCCTTCAGGAACAGCCACCAGT |
| Sequence-based reagent | S100A8 f | IDT | PCR primers | ATGCCGTCTACAGGGATGACCT |
| Sequence-based reagent | S100A8 r | IDT | PCR primers | AGAATGAGGAACTCCTGGAAGTTA |
| Sequence-based reagent | DUSP1 f | IDT | PCR primers | CAACCACAAGGCAGACATCAGC |
| Sequence-based reagent | DUSP1 r | IDT | PCR primers | GTAAGCAAGGCAGATGGTGGCT |
| Sequence-based reagent | MMP9 f | IDT | PCR primers | GCCACTACTGTGCCTTTGAGTC |
| Sequence-based reagent | MMP9 r | IDT | PCR primers | CCCTCAGAGAATCGCCAGTACT |
| Sequence-based reagent | HMOX1 f | IDT | PCR primers | CCAGGCAGAGAATGCTGAGTTC |
| Sequence-based reagent | HMOX1 r | IDT | PCR primers | AAGACTGGGCTCTCCTTGTTGC |
| Sequence-based reagent | CCL2 f | IDT | PCR primers | AGAATCACCAGCAGCAAGTGTCC |
| Sequence-based reagent | CCL2 r | IDT | PCR primers | TCCTGAACCCACTTCTGCTTGG |
| Sequence-based reagent | IL6 f | IDT | PCR primers | AGTGAGGAACAAGCCAGAGC |
| Sequence-based reagent | IL6 r | IDT | PCR primers | GTCAGGGGTGGTTATTGCAT |
| Sequence-based reagent | IL8 f | IDT | PCR primers | TCCTGATTTCTGCAGCTCTGT |
| Sequence-based reagent | IL8 r | IDT | PCR primers | AAATTTGGGGTGGAAAGGTT |
| Sequence-based reagent | IL1B f | IDT | PCR primers | TCCAGGGACAGGATATGGAG |
| Sequence-based reagent | IL1B r | IDT | PCR primers | CCAAGGCCACAGGTATTTTG |
| Sequence-based reagent | SERPINE1 f | IDT | PCR primers | CTCATCAGCCACTGGAAAGGCA |
| Sequence-based reagent | SERPINE1 r | IDT | PCR primers | GACTCGTGAAGTCAGCCTGAAAC |
| Sequence-based reagent | ICAM1 f | IDT | PCR primers | AGCGGCTGACGTGTGCAGTAAT |
| Sequence-based reagent | ICAM1 r | IDT | PCR primers | TCTGAGACCTCTGGCTTCGTCA |
| Sequence-based reagent | CCL5 f | IDT | PCR primers | CCTGCTGCTTTGCCTACATTGC |
| Sequence-based reagent | CCL5 r | IDT | PCR primers | ACACACTTGGCGGTTCTTTCGG |
| Sequence-based reagent | TNFA f | IDT | PCR primers | AGAACTCACTGGGGCCTACA |
| Sequence-based reagent | TNFA r | IDT | PCR primers | AGGAAGGCCTAAGGTCCACT |
| Sequence-based reagent | BAFFR f | IDT | PCR primers | GTCTCCGGGAATCTCTGATGC |
| Sequence-based reagent | BAFFR r | IDT | PCR primers | GTTCAGTGGAGCCCAGCTCT |
| Sequence-based reagent | TACI f | IDT | PCR primers | CTGTGGACAGCACCCTAAGC |
| Sequence-based reagent | TACI r | IDT | PCR primers | CAACTTCTCCACTCCGCTGTC |
| Sequence-based reagent | BCMA f | IDT | PCR primers | GGGCAGTGCTCCCAAAATGA |
| Sequence-based reagent | BCMA r | IDT | PCR primers | AACGCTGACATGTTAGAGGAGG |
| Sequence-based reagent | CYFIP2 f | IDT | PCR primers | ATGCCCTGGATTCTAACGGACC |
| Sequence-based reagent | CYFIP2 r | IDT | PCR primers | CTTGGTCAGAGCATAGTAGGCG |
| Sequence-based reagent | CLCA2 f | IDT | PCR primers | CCAGACTGCCAAGGAATCCATTG |
| Sequence-based reagent | CLCA2 r | IDT | PCR primers | GCTTCTGTGATTGCACATTTTGTTC |
| Sequence-based reagent | LIF f | IDT | PCR primers | CCAACGTGACGGACTTCCC |
| Sequence-based reagent | LIF r | IDT | PCR primers | TACACGACTATGCGGTACAGC |
| Sequence-based reagent | AURKB f | IDT | PCR primers | GGAGTGCTTTGCTATGAGCTGC |
| Sequence-based reagent | AURKB r | IDT | PCR primers | GAGCAGTTTGGAGATGAGGTCC |
| Sequence-based reagent | CDK1 f | IDT | PCR primers | GGAAACCAGGAAGCCTAGCATC |
| Sequence-based reagent | CDK1 r | IDT | PCR primers | GGATGATTCAGTGCCATTTTGCC |
| Sequence-based reagent | KI-67 f | IDT | PCR primers | GAAAGAGTGGCAACCTGCCTTC |
| Sequence-based reagent | KI-67 r | IDT | PCR primers | GCACCAAGTTTTACTACATCTGCC |
| Sequence-based reagent | LMNB1 f | IDT | PCR primers | GAGAGCAACATGATGCCCAAGTG |
| Sequence-based reagent | LMNB1 r | IDT | PCR primers | GTTCTTCCCTGGCACTGTTGAC |
| Sequence-based reagent | LBR f | IDT | PCR primers | CTATGTGGTGGATGCTCTCTGG |
| Sequence-based reagent | LBR r | IDT | PCR primers | CCACACCAAGTCTCCAAAAGCC |
| Sequence-based reagent | ACTB f | IDT | PCR primers | GCACAGAGCCTCGCCTT |
| Sequence-based reagent | ACTB r | IDT | PCR primers | GTTGTCGACGACGAGCG |
| Sequence-based reagent | 18 S f | IDT | PCR primers | ACCCGTTGAACCCCATTCGTGA |
| Sequence-based reagent | 18 S r | IDT | PCR primers | GCCTCACTAAACCATCCAATCGG |
| Sequence-based reagent | GAPDH f | IDT | PCR primers | CTCTGCTCCTCCTGTTCGAC |
| Sequence-based reagent | GAPDH r | IDT | PCR primers | ACGACCAAATCCGTTGACTC |
| Sequence-based reagent | mTnfsf13b f | IDT | PCR primers | CTACCGAGGTTCAGCAACACCA |
| Sequence-based reagent | mTnfsf13b r | IDT | PCR primers | GAAAGCGCGTCTGTTCCTGTGG |
| Sequence-based reagent | mCdkn1a f | IDT | PCR primers | TTGCCAGCAGAATAAAAGGTG |
| Sequence-based reagent | mCdkn1a r | IDT | PCR primers | TTTGCTCCTGTGCGGAAC |
| Sequence-based reagent | m18S f | IDT | PCR primers | AGTCCCTGCCCTTTGTACACA |
| Sequence-based reagent | m18S r | IDT | PCR primers | CGATCCGAGGGCCTCACTA |
| Sequence-based reagent | mActb f | IDT | PCR primers | TTCTTTGCAGCTCCTTCGTT |
| Sequence-based reagent | mActb r | IDT | PCR primers | ATGGAGGGGAATACAGCCC |
| Sequence-based reagent | Control siRNA-A | SCBT | sc-37007 | |
| Sequence-based reagent | IRF1 siRNA | SCBT | sc-35706 | |
| Sequence-based reagent | Non targeting pool | Horizon Discovery | Cat. D-001206-14-20 | |
| Sequence-based reagent | IRF1 siRNA | Horizon Discovery | M-011704-01-0005 | |
| Sequence-based reagent | BAFF siRNA | Horizon Discovery | D-017586-01-0005 | |
| Sequence-based reagent | BAFF siRNA | Horizon Discovery | D-017586-03-0005 | |
| Sequence-based reagent | BAFF siRNA | Horizon Discovery | M-046829-00-0010 | |
| Sequence-based reagent | BAFF-R siRNA | Horizon Discovery | M-013424-00-0005 | |
| Sequence-based reagent | BCMA siRNA | Horizon Discovery | M-011217-02-0005 | |
| Sequence-based reagent | TACI siRNA | Horizon Discovery | M-008095-00-0005 | |
| Commercial assay or Kit | Senescence β-Galactosidase Staining Kit | Cell Signaling | #9860 | Senescent cells detection kit |
| Commercial assay or Kit | Luminex Discovery Assay | R&D System | LXSAHM | Custom-designed plates for multiplex ELISA |
| Commercial assay or Kit | Amaxa Nucleofector kit V | Lonza | VCA-1003 | Electroporation of overexpression plasmids into THP-1, program V-001 |
| Commercial assay or Kit | Magnify ChIP System | Thermofisher | 492024 | |
| Commercial assay or Kit | TransAM NFKB Family | Active Motif | 43296 | |
| Commercial assay or Kit | Human Phospho-Kinase Array Kit | R&D | ARY003C | |
| Commercial assay or Kit | Cytokine array kit | R&D | ARY005B | |
| Chemical compound, drug | Ruxolitinib | Invivogen | tlrl-rux | |
| Chemical compound, drug | MRT67307 | Invivogen | inh-mrt | |
| Chemical compound, durg | BX-795 | Invivogen | tlrl-bx7 | |
| Software, algorithm | GraphPad | Prism | (https://graphpad.com) | |
| Software, algorithm | ShinyGO | South Dakota State University | http://bioinformatics.sdstate.edu/go/ |
Additional files
-
MDAR checklist
- https://cdn.elifesciences.org/articles/84238/elife-84238-mdarchecklist1-v1.docx
-
Source code 1
Alignment, gene count and differential gene expression scripts.
- https://cdn.elifesciences.org/articles/84238/elife-84238-code1-v1.zip
Download links
A two-part list of links to download the article, or parts of the article, in various formats.
Downloads (link to download the article as PDF)
Open citations (links to open the citations from this article in various online reference manager services)
Cite this article (links to download the citations from this article in formats compatible with various reference manager tools)
Pleiotropic effects of BAFF on the senescence-associated secretome and growth arrest
eLife 12:e84238.
https://doi.org/10.7554/eLife.84238


