Quantitative analyses of T cell motion in tissue reveals factors driving T cell search in tissues
- Northern New Mexico College, United States
- Department of Molecular Genetics and Microbiology, University of New Mexico School of Medicine, United States
- Department of Microbiology and Immunology, University of Minnesota Medical School, United States
- Department of Computer Science, University of New Mexico, United States
- Autophagy, Inflammation, and Metabolism Center of Biomedical Research Excellence, University of New Mexico School of Medicine, United States
Figures
Figure 1 with 3 supplements

Speed distribution of T cells does not correlate with tissue type or activation status.
(A) Box-and-whisker plot of cell-based speed (µm/min) of T cells moving in lymph node (LN) (median 6.2), villi (median 6.5), lung (Flu infected) (median 5.2), and lung (LPS) (median 4.3). (B) Box-and-whisker plot of displacement speed (µm/min) of T cells in lymph (median 3.7), villi (median 3.3), lung (Flu infected) (median 1.1), and lung (LPS instilled) (median 1.6). (C) Distribution plot of probability to persist at the same speed.
Figure 1—figure supplement 1
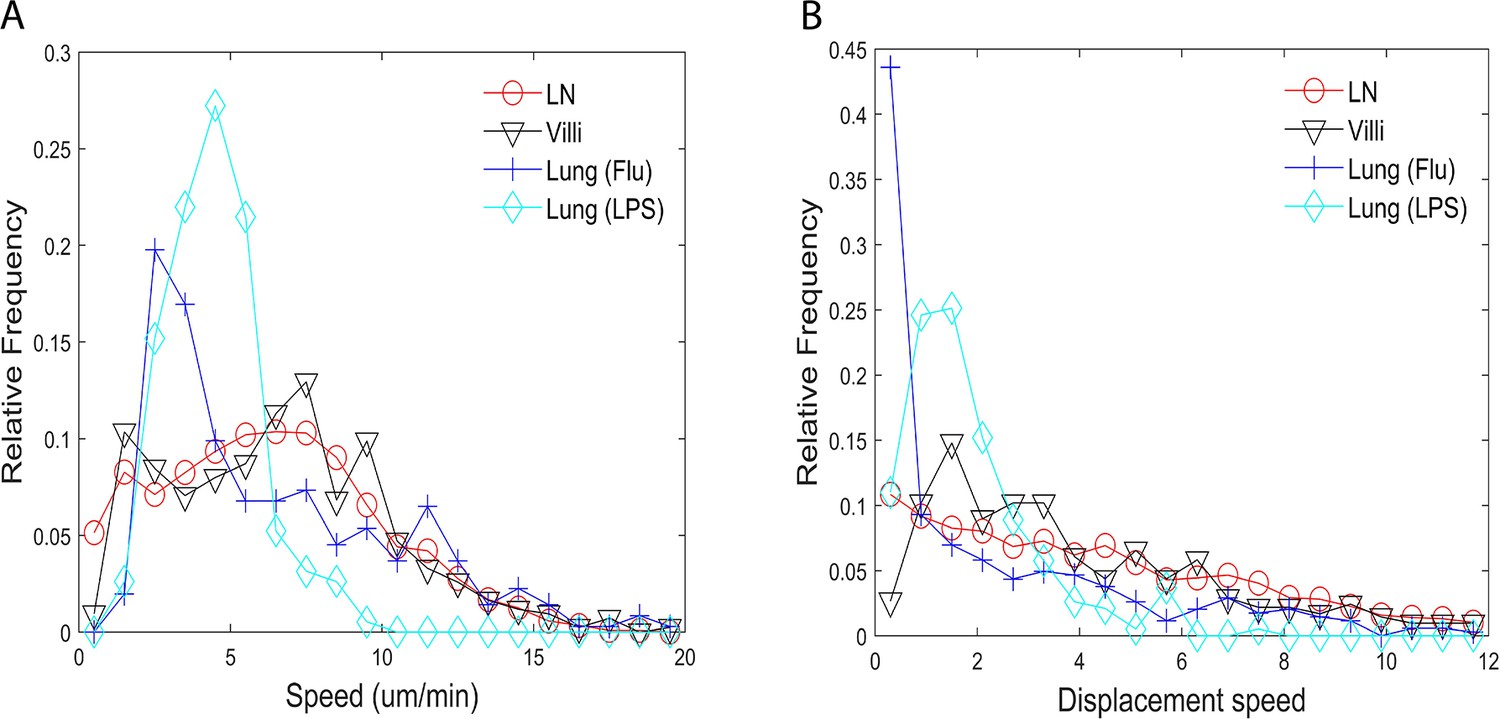
Speed distribution of cell-based (A) and displacement (B) speed distributions.
(A) Relative frequency distribution of cell-based speed in lymph, villi, lung (Flu activated), and lung (LPS activated). The distributions use the cell-based speed of each T cell. (B) Relative frequency distribution of T cell displacement speed in lymph, villi, lung (Flu activated), and lung (LPS activated).
Figure 1—figure supplement 2
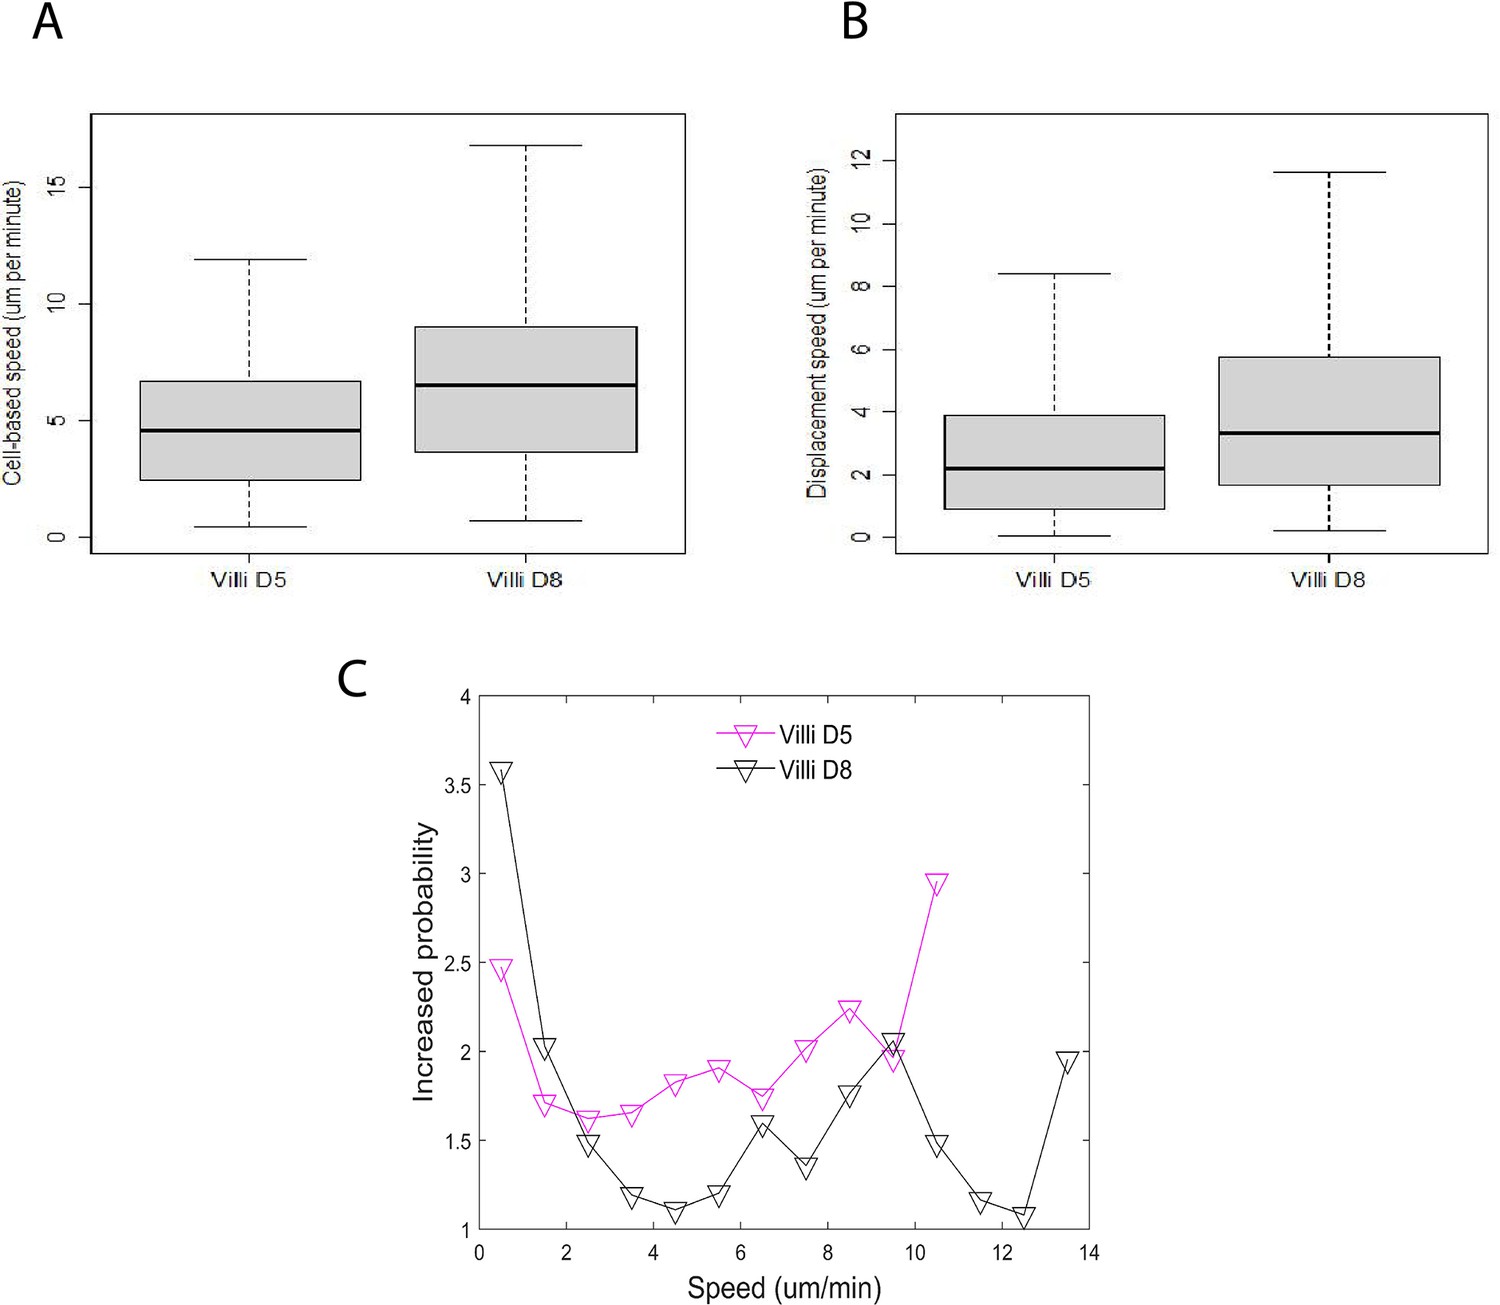
Box-and-whisker plot of cell-based speed and displacement speed for villi d5 and villi d8.
(A) Box-and-whisker plot of cell-based speed (µm/min) of T cells moving in villi d5 (median 4.6), villi d8 (median 6.5), p-value < 2.0 x 10⁻¹⁶.(B) Box-and-whisker plot of displacement speed (µm/min) of T cells in d5 villi (median 2.2), d8 villi (median 3.3), p-value . (C) Distribution plot of probability to persist at the same speed.
Figure 1—figure supplement 3
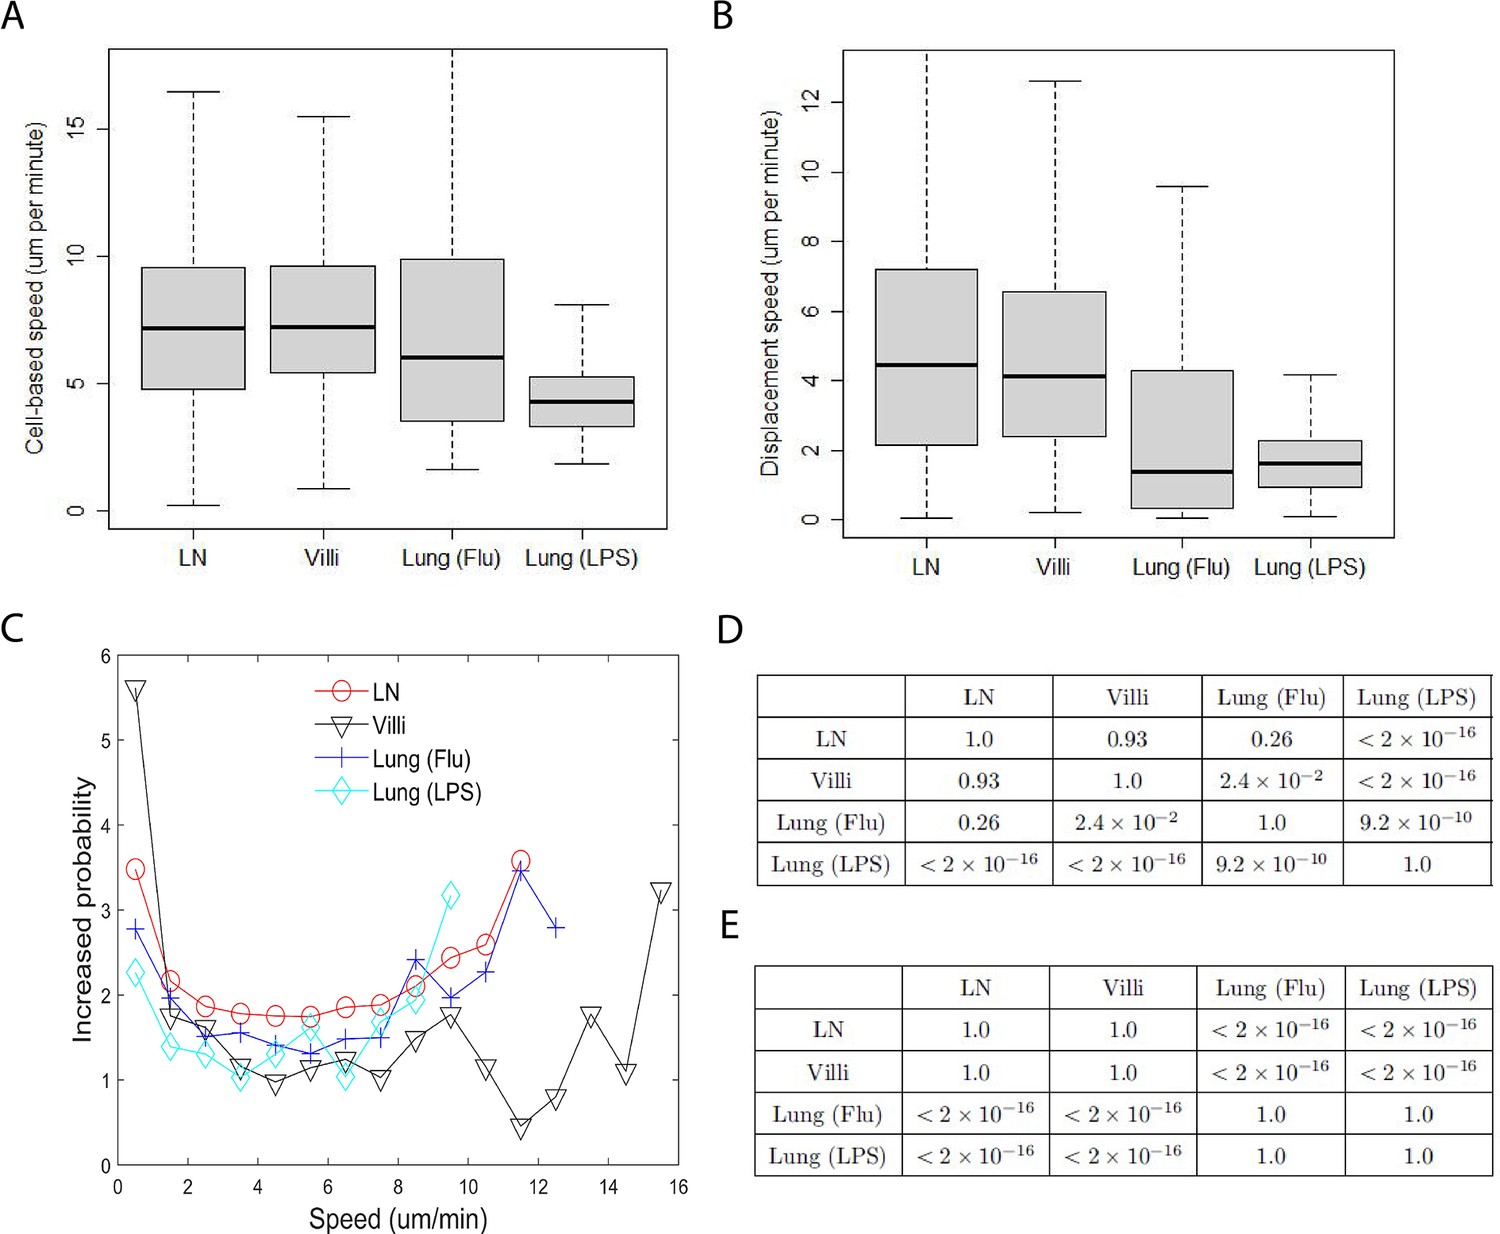
Reduced data set.
(A) Box-and-whisker plot of cell-based speed (µm/min) of T cells moving in lymph node (LN) (median 7.2), villi (median 7.2), lung (Flu infected) (median 6.0), and lung (LPS) (median 4.3). (B) Box-and-whisker plot of displacement speed (µm/min) of T cells in lymph (median 4.5), villi (median 4.1), lung (Flu infected) (median 1.4), and lung (LPS instilled) (median 1.6). (C) Distribution plot of probability to persist at the same speed. (D) Table of p-values of pairwise comparisons of cell-based speed as shown in Figure 1—figure supplement 3 using Wilcoxon rank sum test. (E) Table of p-values of pairwise comparisons of displacement speed shown in Figure 1—figure supplement 3 using Wilcoxon rank sum test.
-
Figure 1—figure supplement 3—source data 1
Editable version of table in Figure 1—figure supplement 3D.
- https://cdn.elifesciences.org/articles/84916/elife-84916-fig1-figsupp3-data1-v2.xlsx
-
Figure 1—figure supplement 3—source data 2
Editable version of table in Figure 1—figure supplement 3E.
- https://cdn.elifesciences.org/articles/84916/elife-84916-fig1-figsupp3-data2-v2.xlsx
Figure 2 with 2 supplements
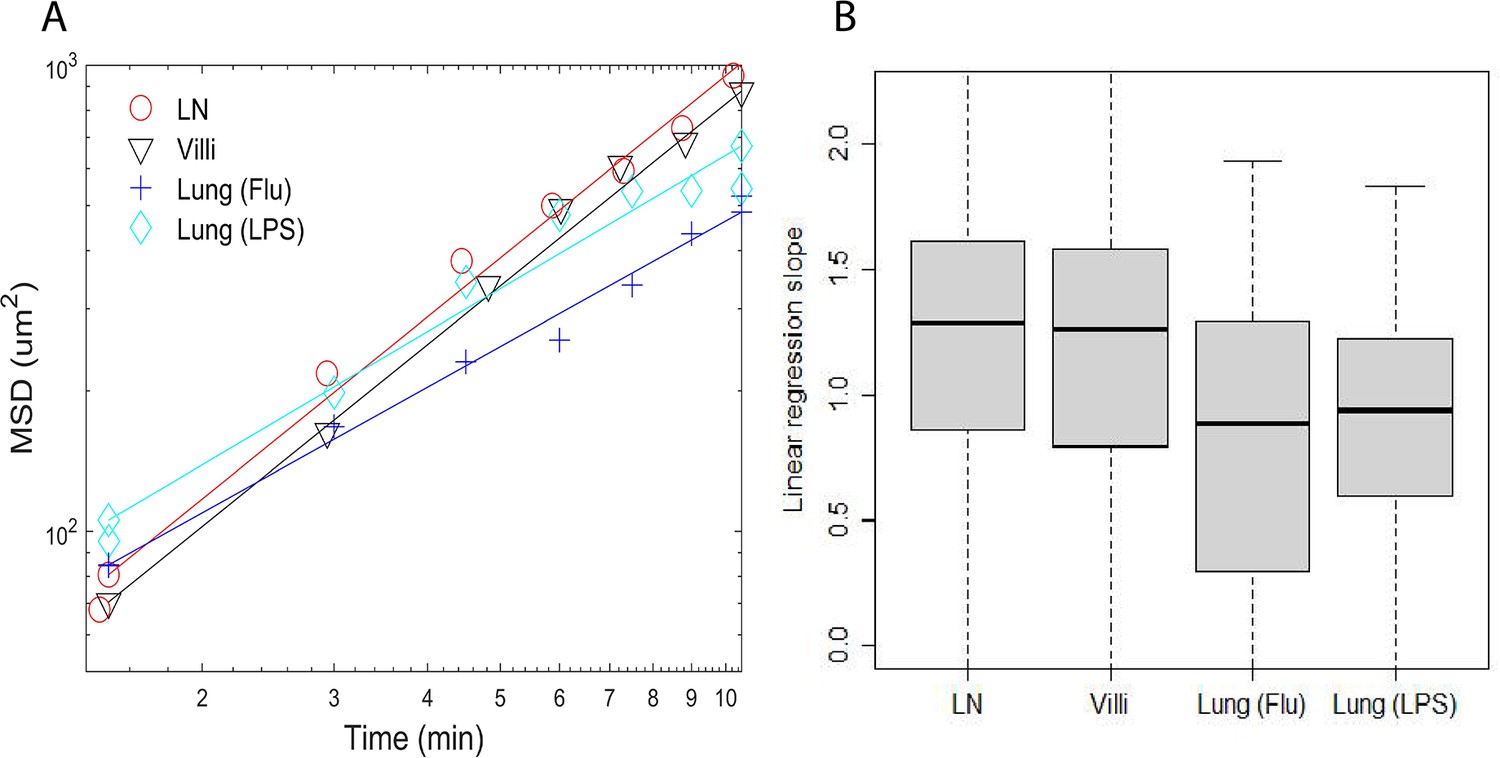
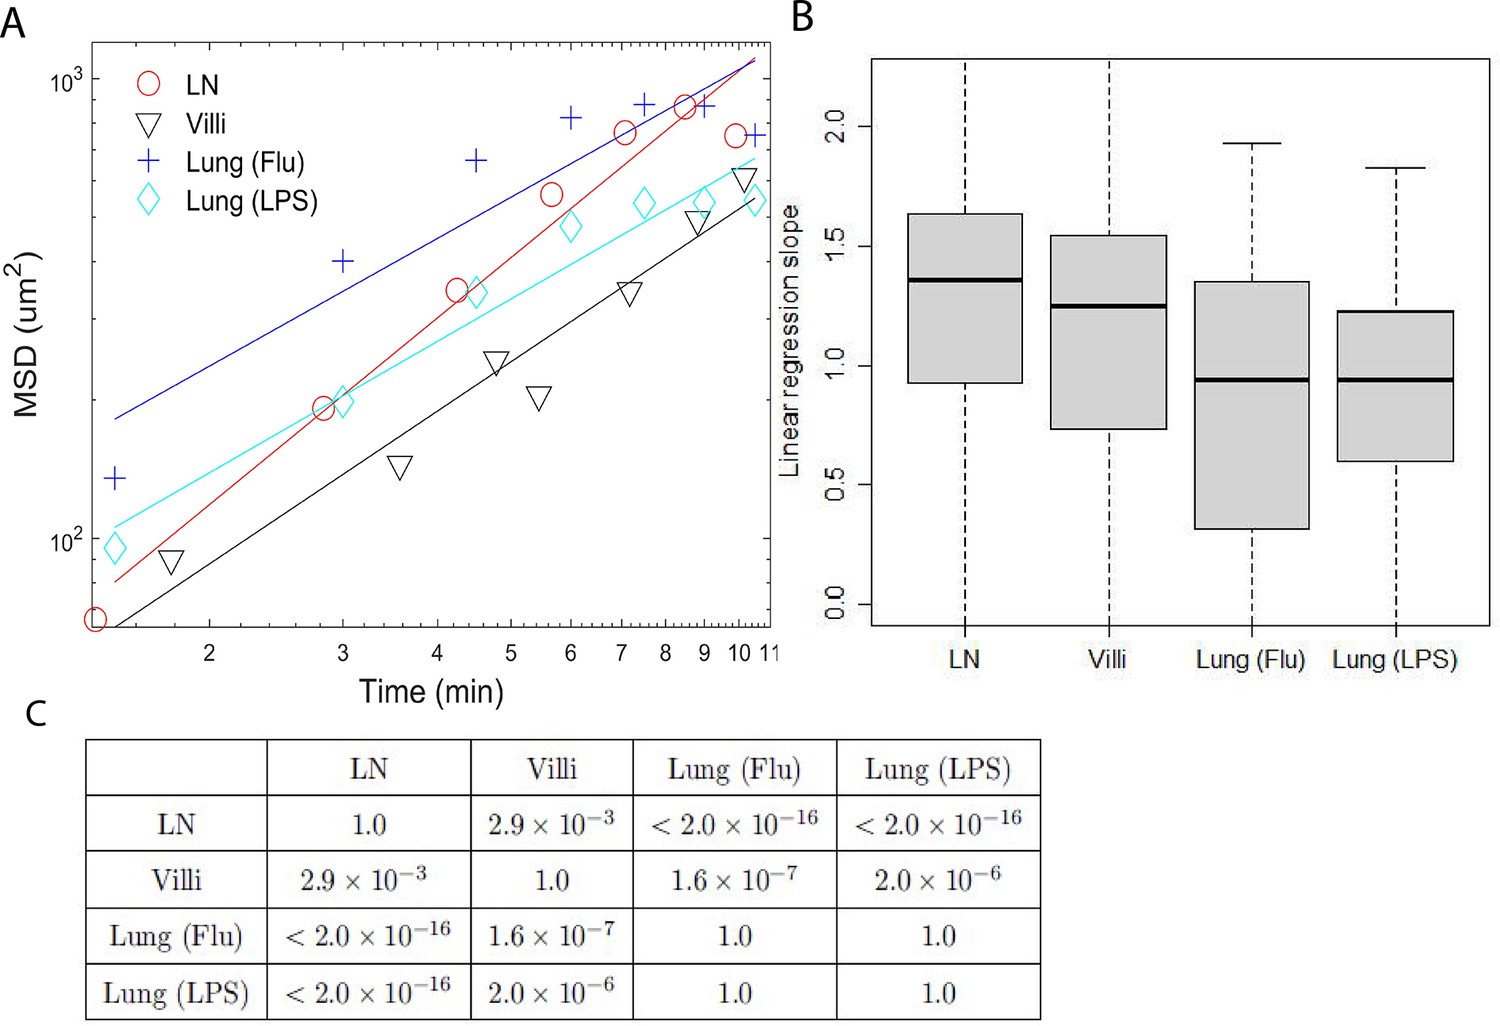
Plots of mean square displacement (MSD) versus time and linear regression lines of individual representative cells near median.
(A) Plots of mean square displacement (MSD) versus time and linear regression lines of individual representative cells near median from B. (B) Box-and-whisker plots of linear regression cell slopes of log transformed mean squared displacement versus time. The median values are LN (1.3), villi (1.3), lung (Flu) (0.88), and lung (LPS) (0.94).
Figure 2—figure supplement 1
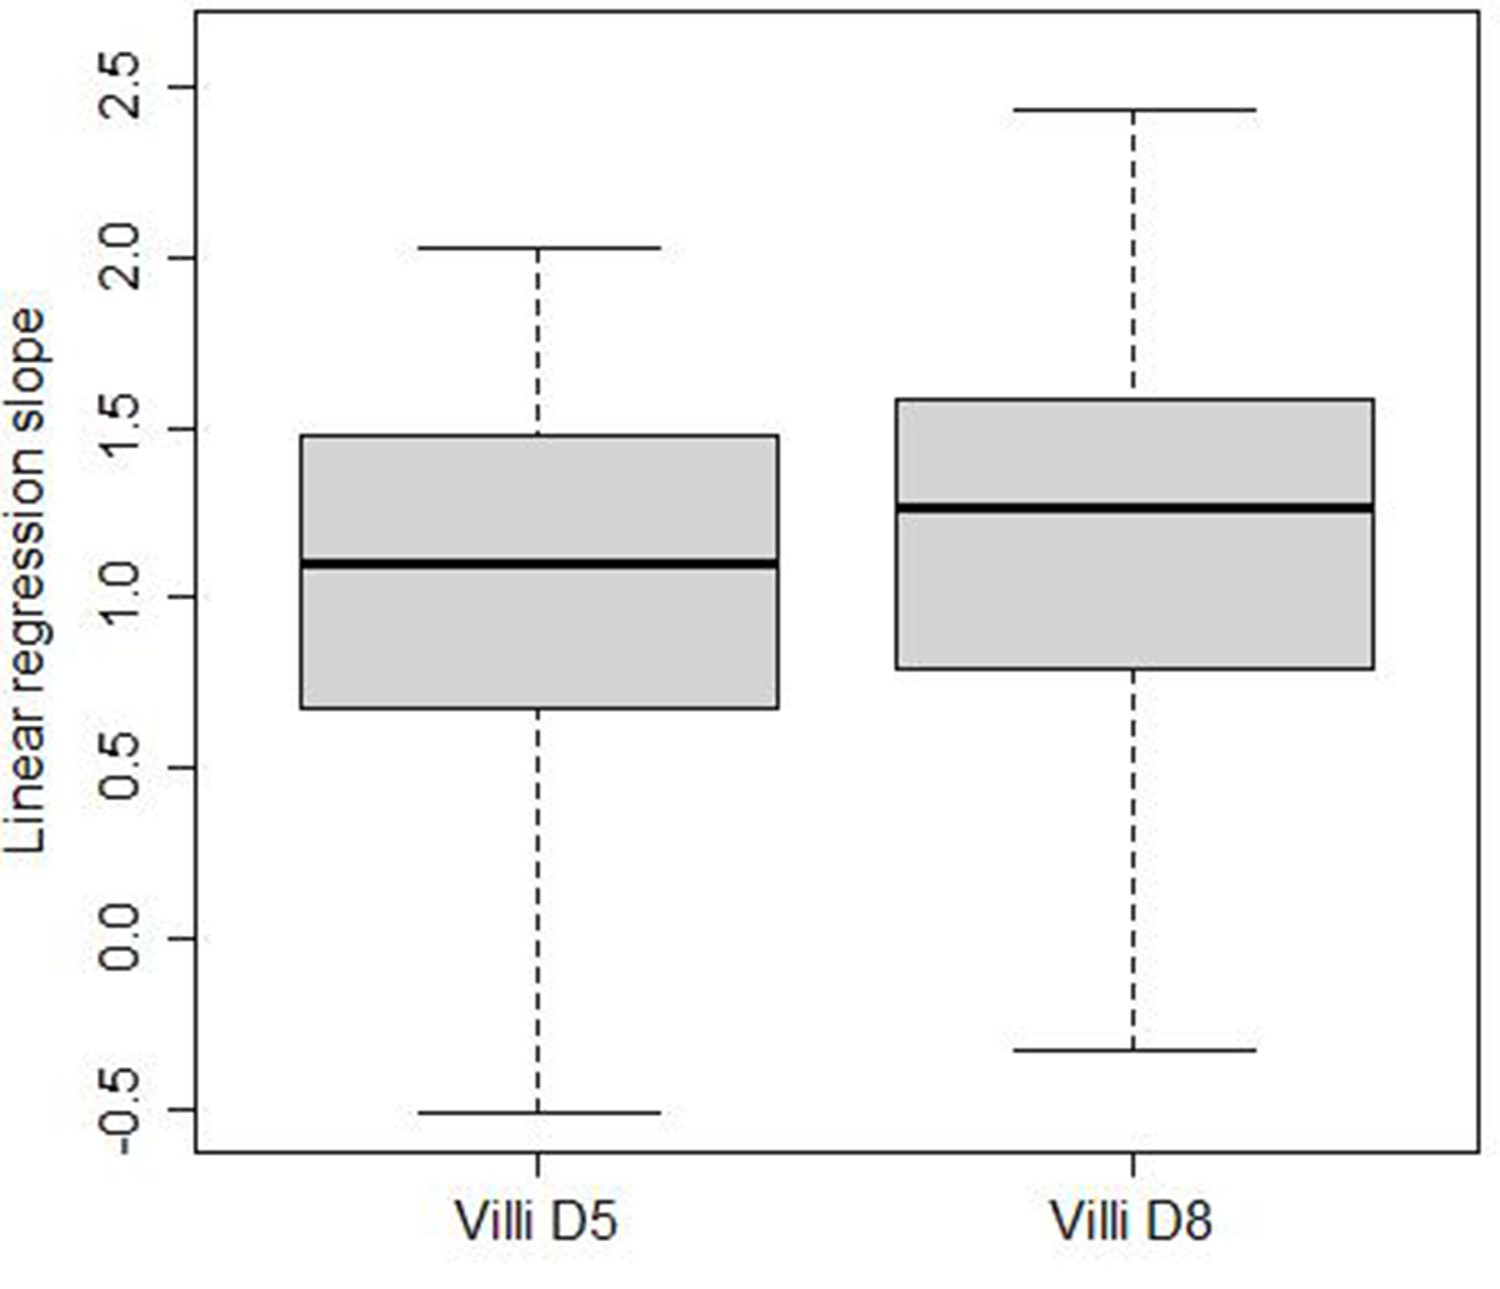
Mean squared displacement linear regression slope is computed for T cells in the villi at d5 and d8 post infection.
Box-and-whisker plots of linear regression cell slopes of log transformed mean squared displacement versus time. The median values are villi d5 (1.1), villi d8 (1.3), p-value .
Figure 2—figure supplement 2
Mean squared displacement (MSD) of reduced data set.
(A) Plots of MSD versus time and linear regression lines of individual representative cells near median from Figure 2—figure supplement 2. (B) Box-and-whisker plots of linear regression cell slopes of log transformed MSD versus time. The median values are LN (1.35), villi (1.2), lung (Flu) (0.93), and lung (LPS) (0.94). (C) Table showing mean square displacement p-values as pairwise comparisons from Figure 2—figure supplement 2 using Wilcoxon rank sum test.
-
Figure 2—figure supplement 2—source data 1
Editable version of table in Figure 2—figure supplement 2C.
- https://cdn.elifesciences.org/articles/84916/elife-84916-fig2-figsupp2-data1-v2.xlsx
Figure 3 with 2 supplements
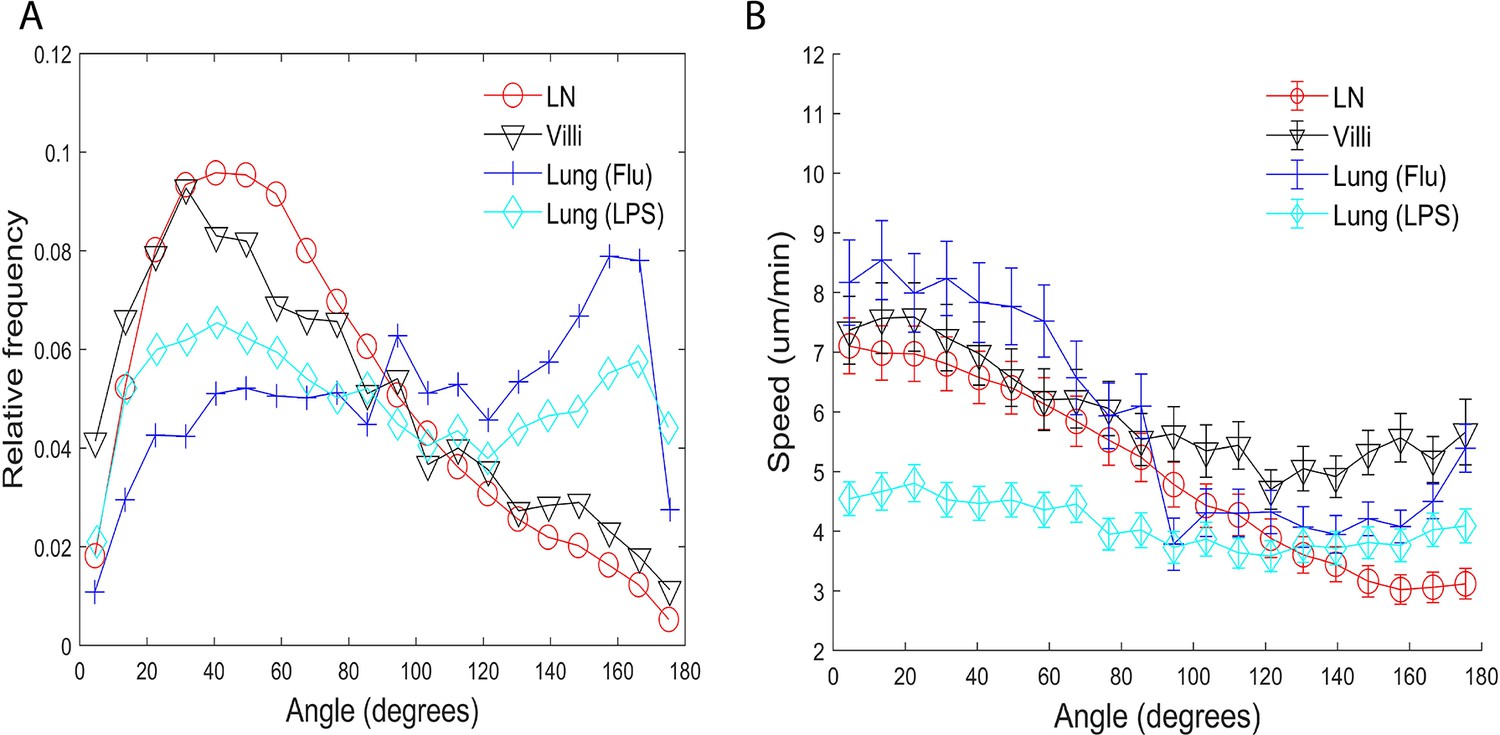
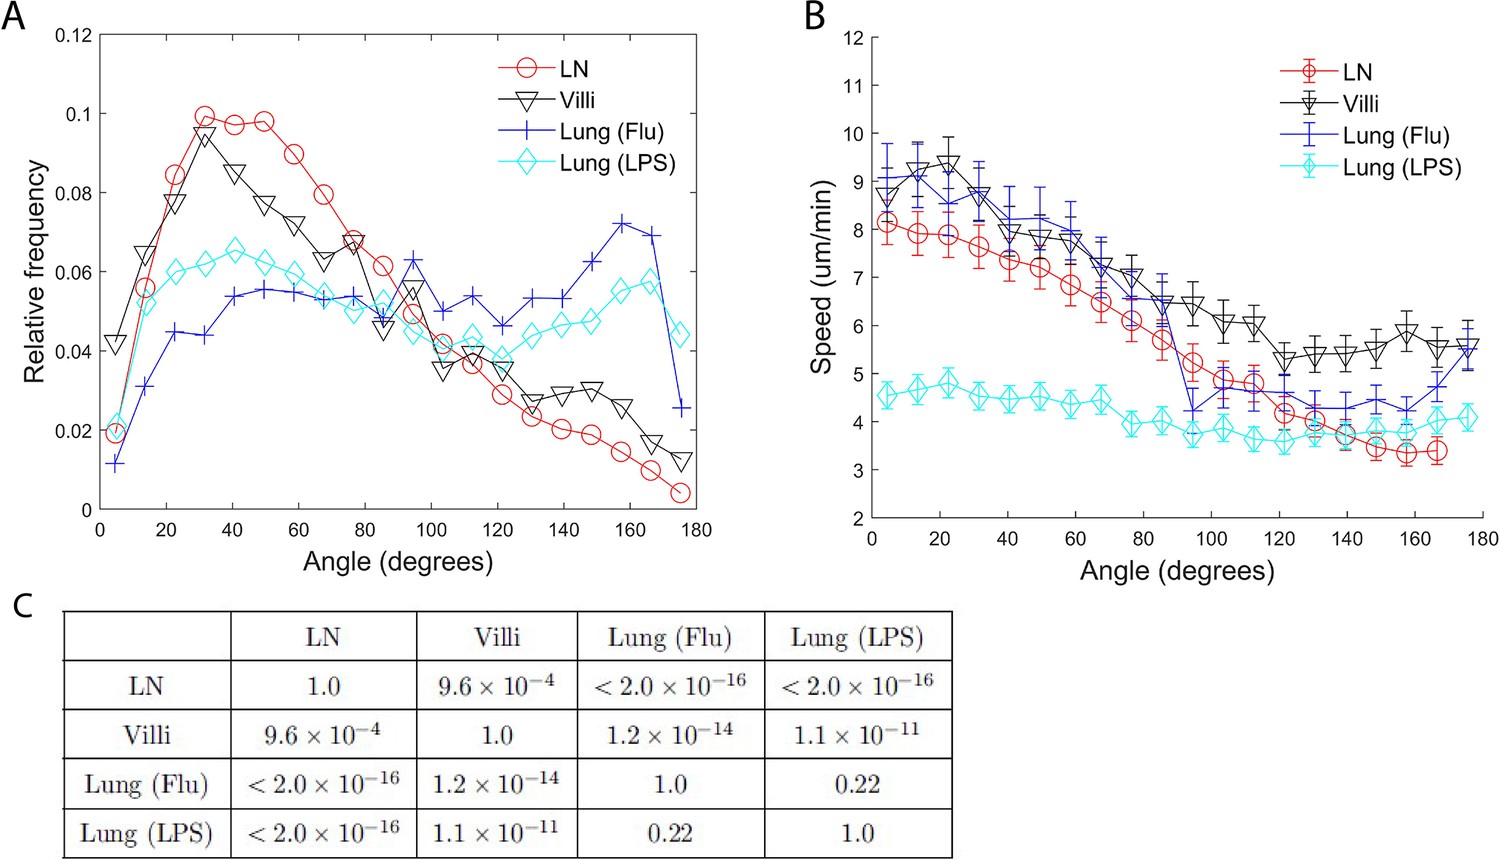
Turning angles and coupling of speed and turning angles of T cells in different tissues.
(A) Relative frequency distribution of turning angles in each tissue. T cells moving in the lung show a peak at approximately 160°. (B) Plot of speed (µm/min) versus angle (degrees). The speed tends to decrease as the turning angle increases in all tissues except for T cells in the LPS-inflamed lung. Error bars show plus and minus 1/8 of the standard deviation within each 9° angle bin.
Figure 3—figure supplement 1
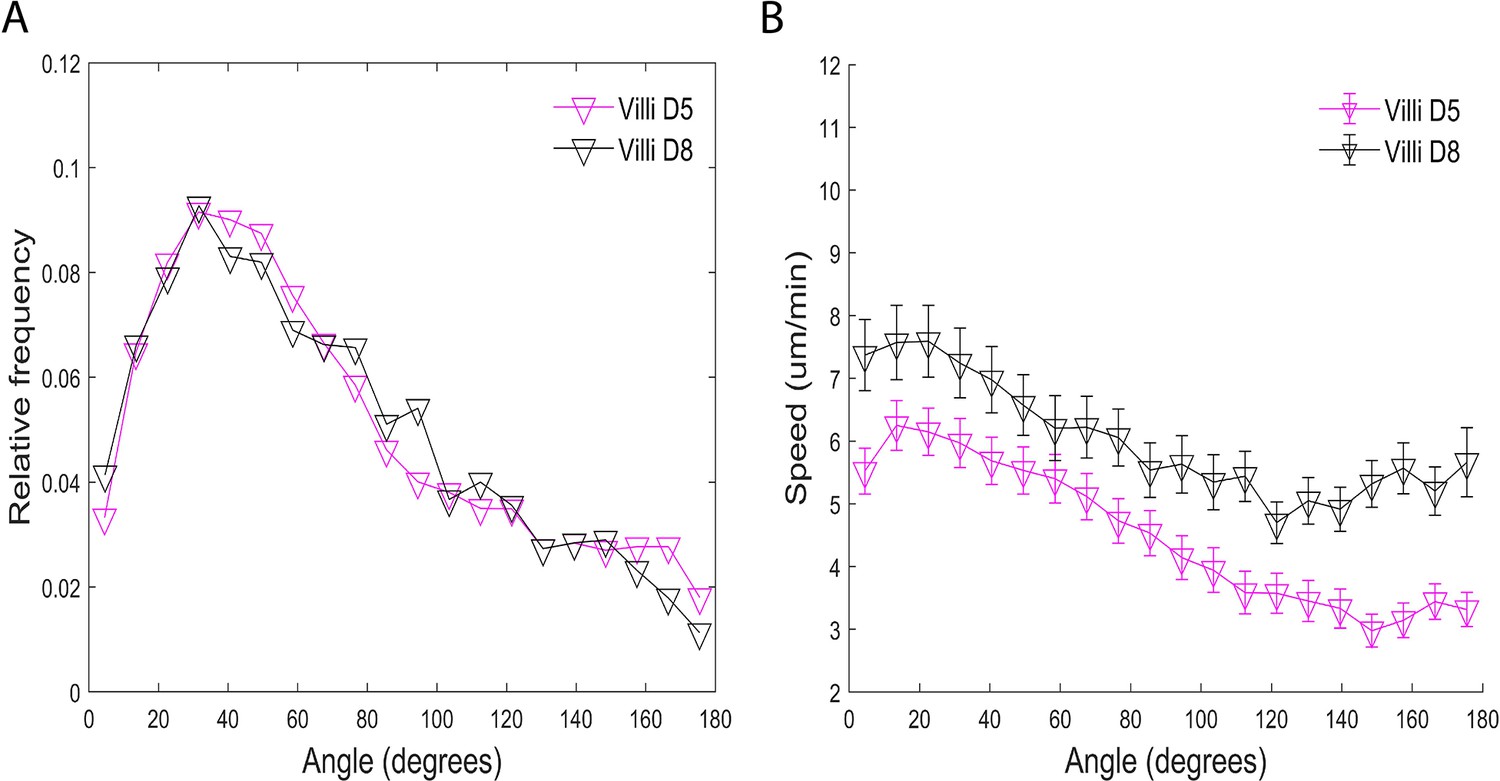
Turning angles and coupling of speed and turning angles of d5 versus d8 CD8 T cells in villi post infection.
(A) Relative frequency distribution of turning angles in each tissue. (B) Plot of speed (µm/min) versus angle (degrees). The speed tends to decrease as the turning angle increases. Error bars show plus and minus 1/8 of the standard deviation within each 9° angle bin.
Figure 3—figure supplement 2
Turning angles and coupling of speed and turning angles of T cells from the reduced data set.
(A) Relative frequency distribution of turning angles in each tissue. (B) Plot of speed (µm/min) versus angle (degrees). The speed tends to decrease as the turning angle increases in all tissues except for T cells in the LPS-inflamed lung. Error bars show plus and minus 1/8 of the standard deviation within each 9° angle bin. (C) Table of p-values of pairwise comparisons of proportion of turning angles <90° shown in Figure 3—figure supplement 2 using Wilcoxon rank sum test.
-
Figure 3—figure supplement 2—source data 1
Editable version of table in Figure 3—figure supplement 2C.
- https://cdn.elifesciences.org/articles/84916/elife-84916-fig3-figsupp2-data1-v2.xlsx
Figure 4 with 2 supplements
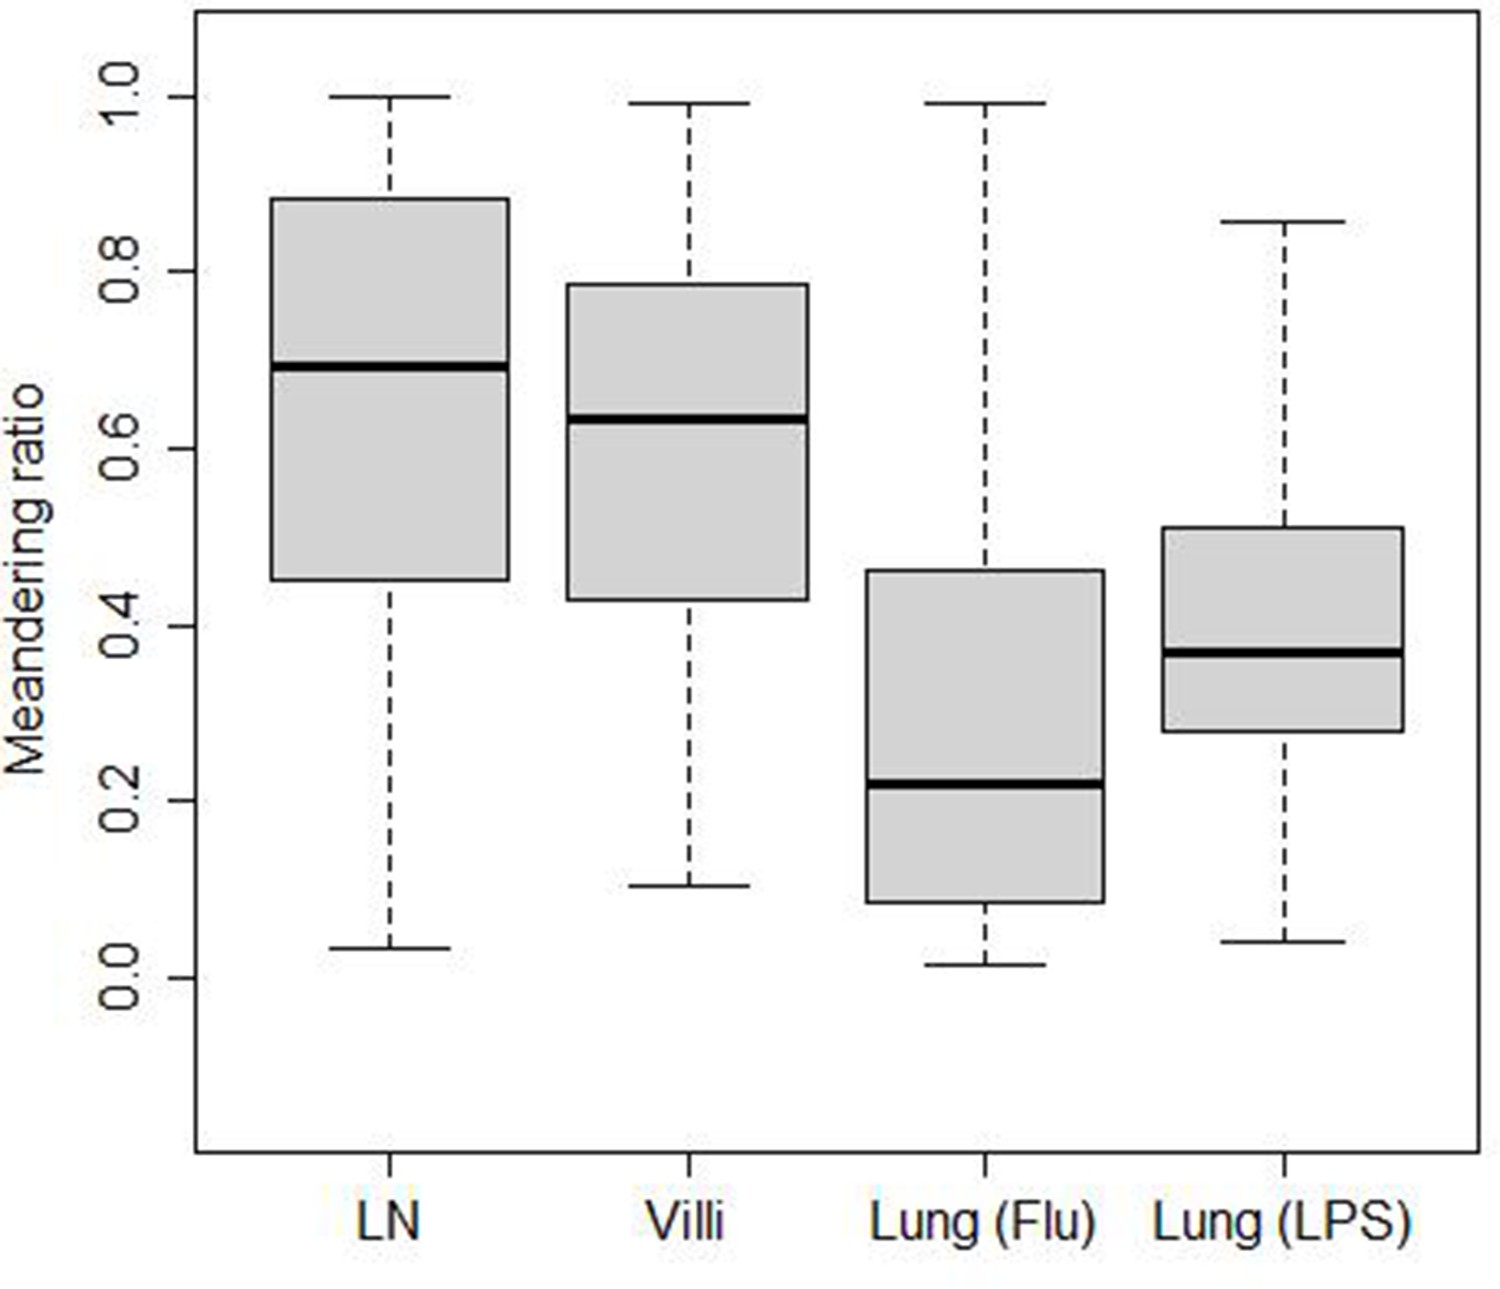
Meandering ratio within different tissues.
The median values are LN (0.70), villi (0.63), lung (Flu) (0.22), and lung (LPS) (0.37).
Figure 4—figure supplement 1

Meandering ratio of CD8 T cells within villi of d5 versus d8 post infection.
The median values are villi d5 (0.53), villi d8 (0.63), p-value .
Figure 4—figure supplement 2
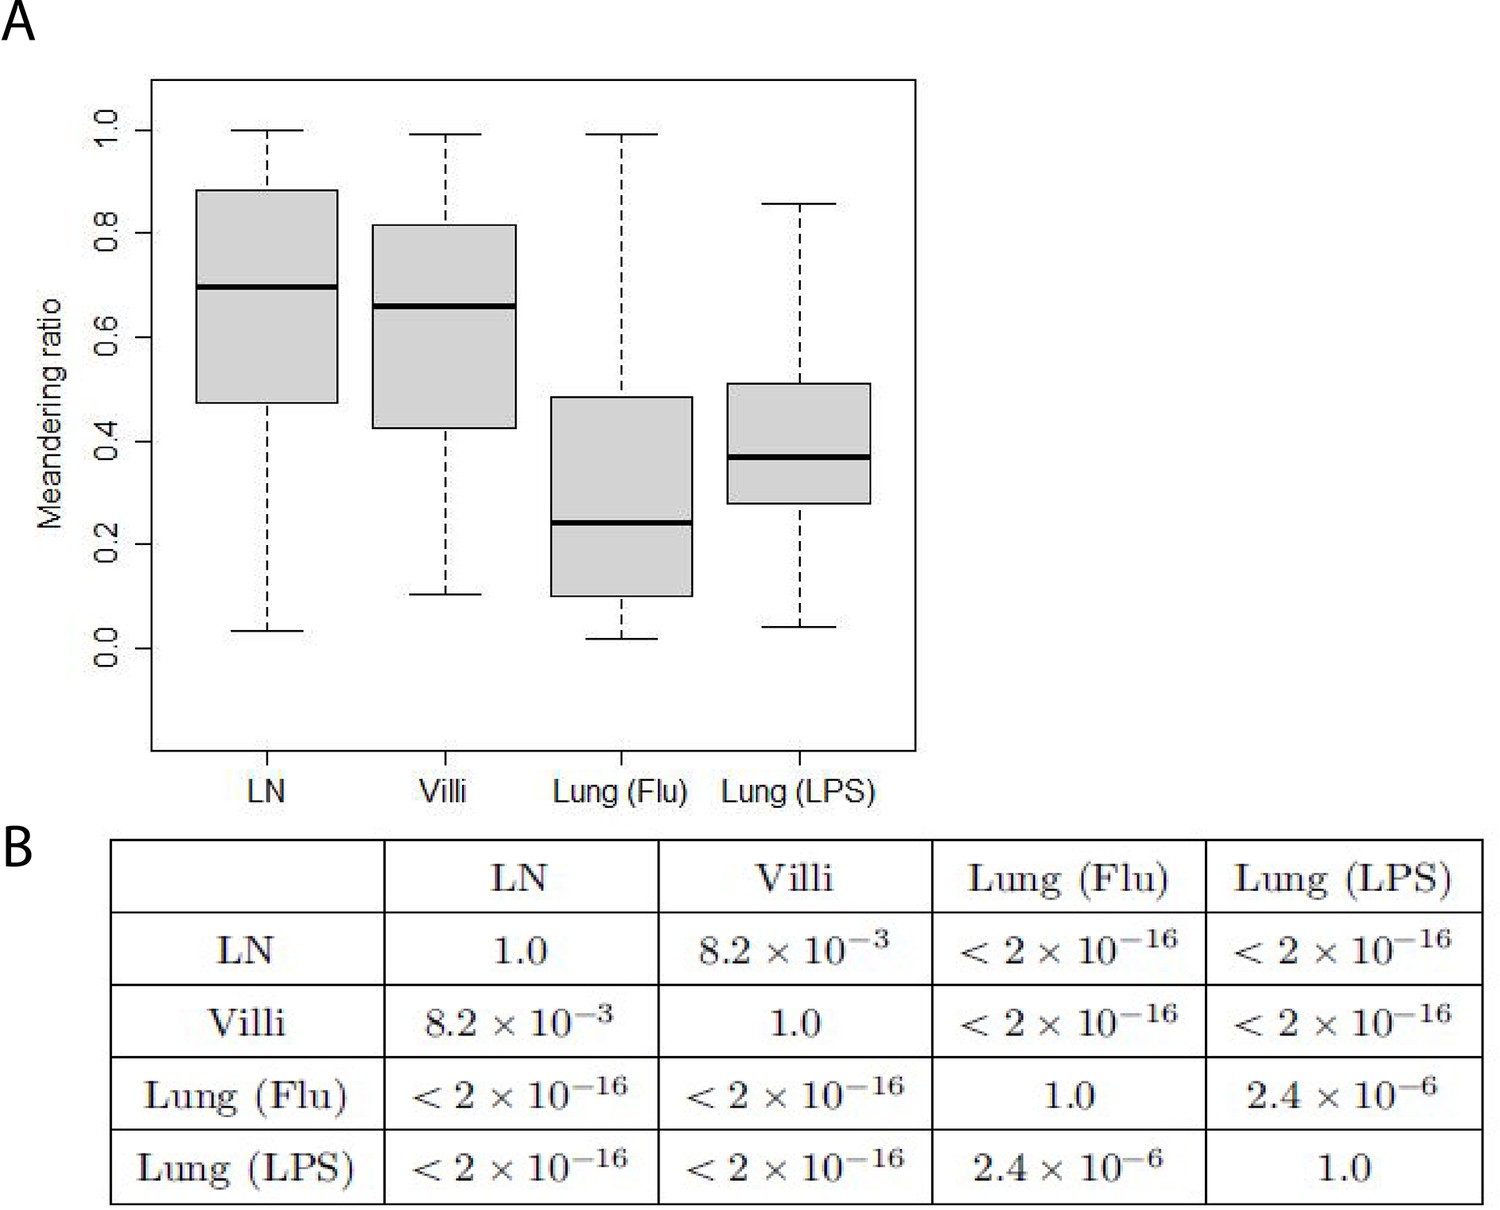
Meandering ratio from the reduced data set.
(A) Meandering ratio from the reduced data set. The median values are LN (0.70), villi (0.66), lung (Flu) (0.24), and lung (LPS) (0.37). (B) Table shows p-values of pairwise comparisons of meandering ratio as shown in Figure 4—figure supplement 2 using Wilcoxon rank sum test.
-
Figure 4—figure supplement 2—source data 1
Editable version of table in Figure 4—figure supplement 2B.
- https://cdn.elifesciences.org/articles/84916/elife-84916-fig4-figsupp2-data1-v2.xlsx
Figure 5 with 2 supplements
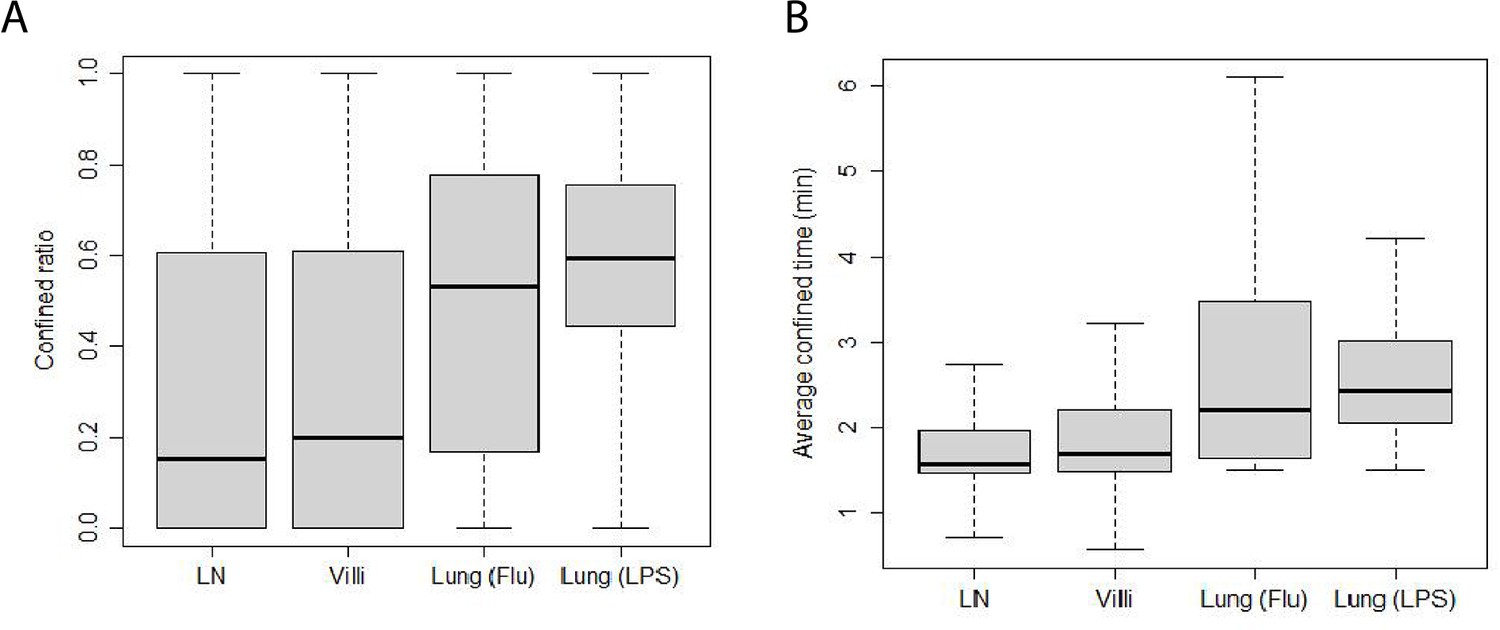
Confinement of T cells from different tissues.
(A) Box-and-whisker plot of confined ratios. Median values: LN 0.15, villi 0.2, lung (Flu) 0.53, and lung (LPS) 0.60. (B) Box-and-whisker plot of confined time. Median values (min): LN 1.6, villi 1.7, lung (Flu) 2.2, and lung (LPS) 2.4.
Figure 5—figure supplement 1
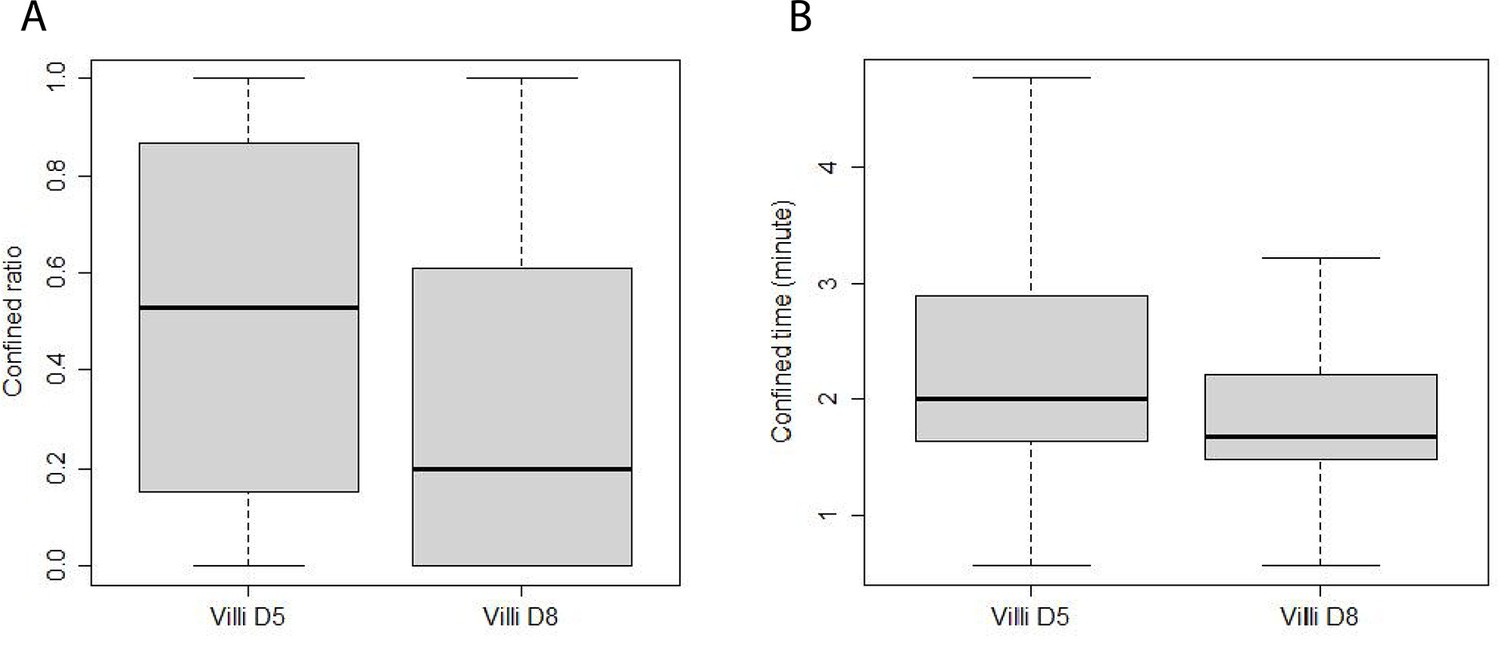
Confinement of T cells from villi d5 versus d8 post infection.
(A) Box-and-whisker plot of confined ratios. Median values: d5 villi (0.53), d8 villi (0.2), p-value . (B) Box-and-whisker plot of confined time. Median values (min): d5 villi (2.0), d8 villi (1.7), p-value .
Figure 5—figure supplement 2
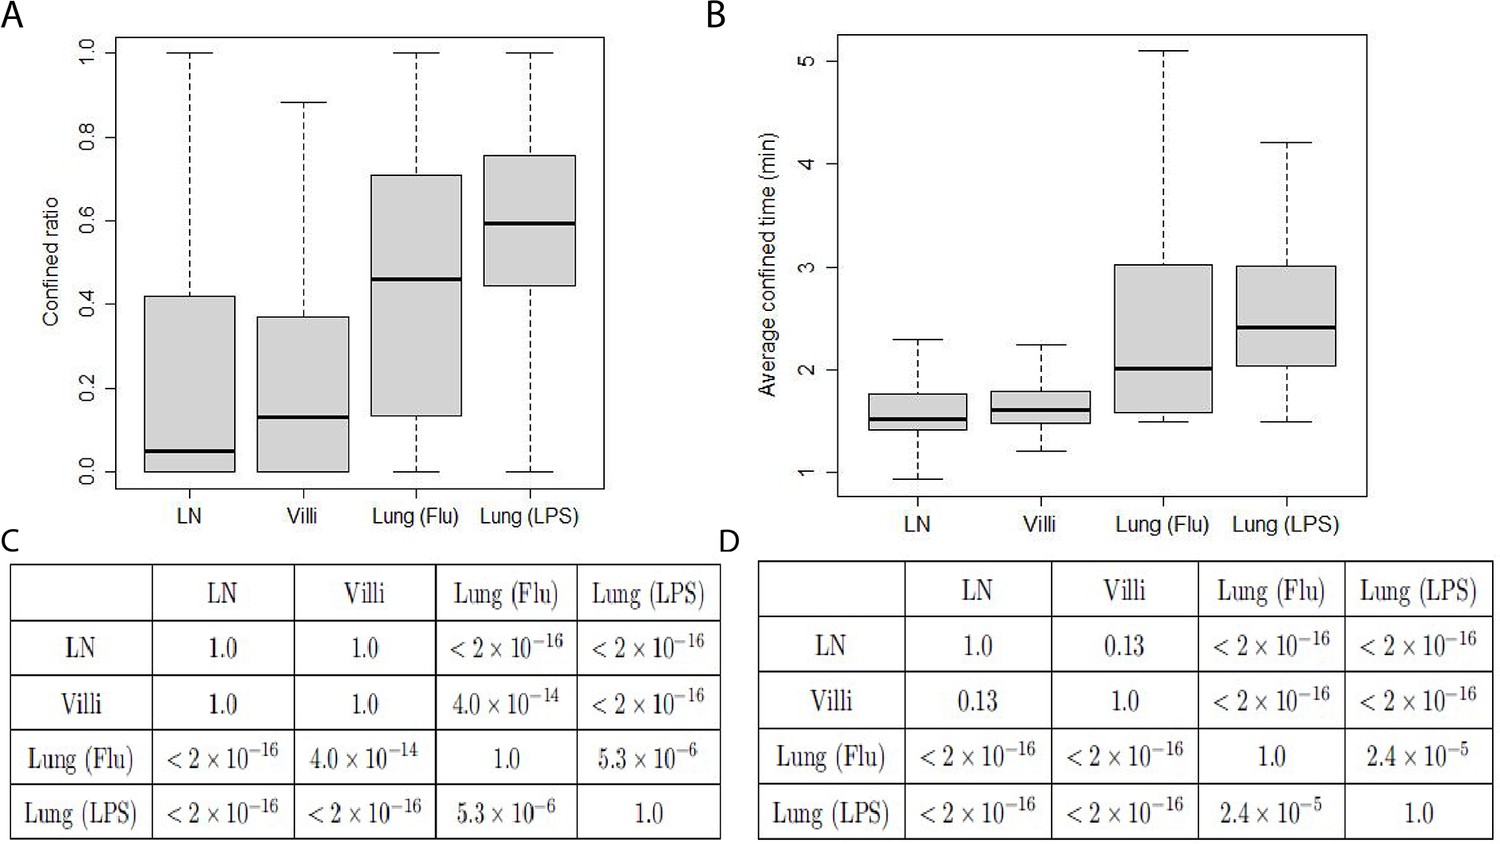
Confinement of T cells from the reduced data set.
(A) Box-and-whisker plot of confined ratios. Median values: LN 0.05, villi 0.13, lung (Flu) 0.46, and lung (LPS) 0.60. (B) Box-and-whisker plot of confined time. Median values (min): LN 1.5, villi 1.6, lung (Flu) 2.0, and lung (LPS) 2.4. (C) Table showing p-values of pairwise comparisons of confined ratios from Figure 5—figure supplement 2 using Wilcoxon rank sum test. (D) Table showing p-values of pairwise comparisons of confined time from Figure 5—figure supplement 2 using Wilcoxon rank sum test.
-
Figure 5—figure supplement 2—source data 1
Editable version of table in Figure 5—figure supplement 2D.
- https://cdn.elifesciences.org/articles/84916/elife-84916-fig5-figsupp2-data1-v2.xlsx
-
Figure 5—figure supplement 2—source data 2
Editable version of table in Figure 5—figure supplement 2C.
- https://cdn.elifesciences.org/articles/84916/elife-84916-fig5-figsupp2-data2-v2.xlsx
Figure 6 with 2 supplements

Volume patrolled by T cells in different tissues.
(A) Box-and-whisker plot of median volume per time (µm3/s) patrolled by T cells in LN (9.4), villi (9.4), lung (Flu) (5.3), and lung (LPS) (5.1). (B) Relative frequency distribution of volume per time (µm3/s) patrolled by T cells in each tissue.
Figure 6—figure supplement 1
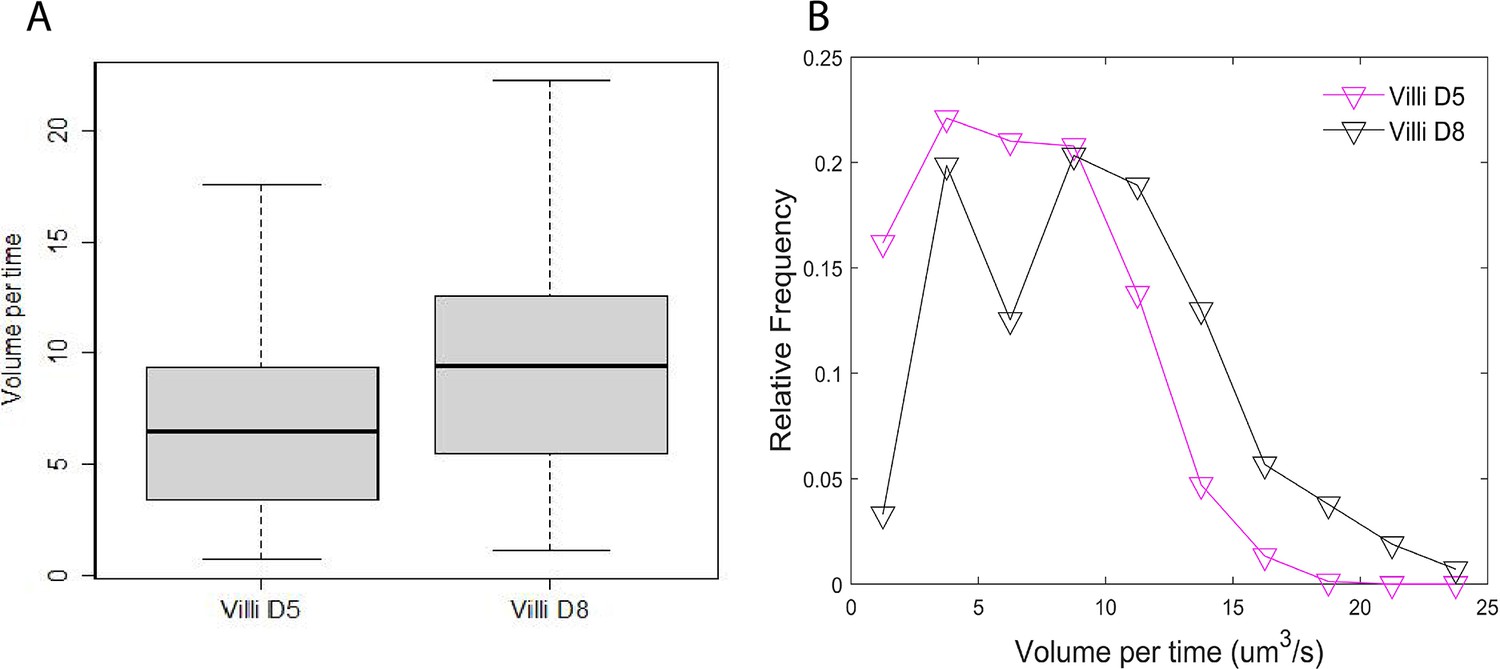
Volume patrolled by d5 versus d8 T cells in villi post infection.
(A) Box-and-whisker plot of median volume per time (µm3/s) patrolled by T cells in villi d5 (6.5), villi d8 (9.4), p-value . (B) Relative frequency distribution of volume per time (µm3/s) patrolled.
Figure 6—figure supplement 2
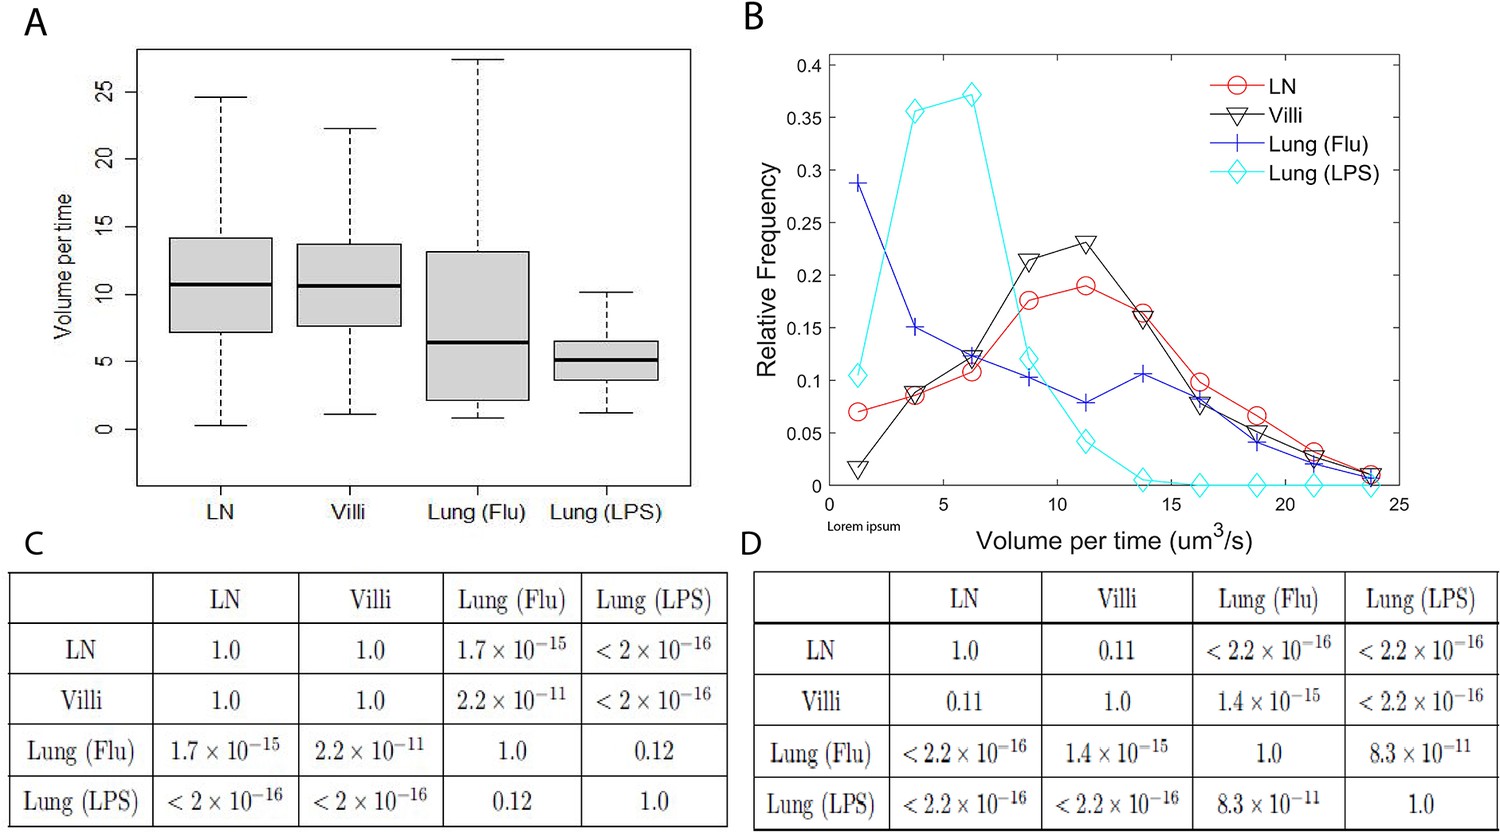
Volume patrolled by T cells in the reduced data set.
(A) Box-and-whisker plot of median volume per time (µm3/s) patrolled by T cells in LN (10.7), villi (10.6), lung (Flu) (6.4), and lung (LPS) (5.1). (B) Relative frequency distribution of volume per time (µm3/s) patrolled by T cells in each tissue. (C) Table of p-values of pairwise comparisons of volume per time from Figure 6—figure supplement 2 using Wilcoxon rank sum test. (D) Table of p-values of pairwise comparisons of volume per time distributions from Figure 6—figure supplement 2 using Kolmogorov–Smirnov test.
Figure 7

Illustration of turning and meandering ratio.
(A) Turning angle illustration. (B) Meandering ratio illustration.
Author response image 1
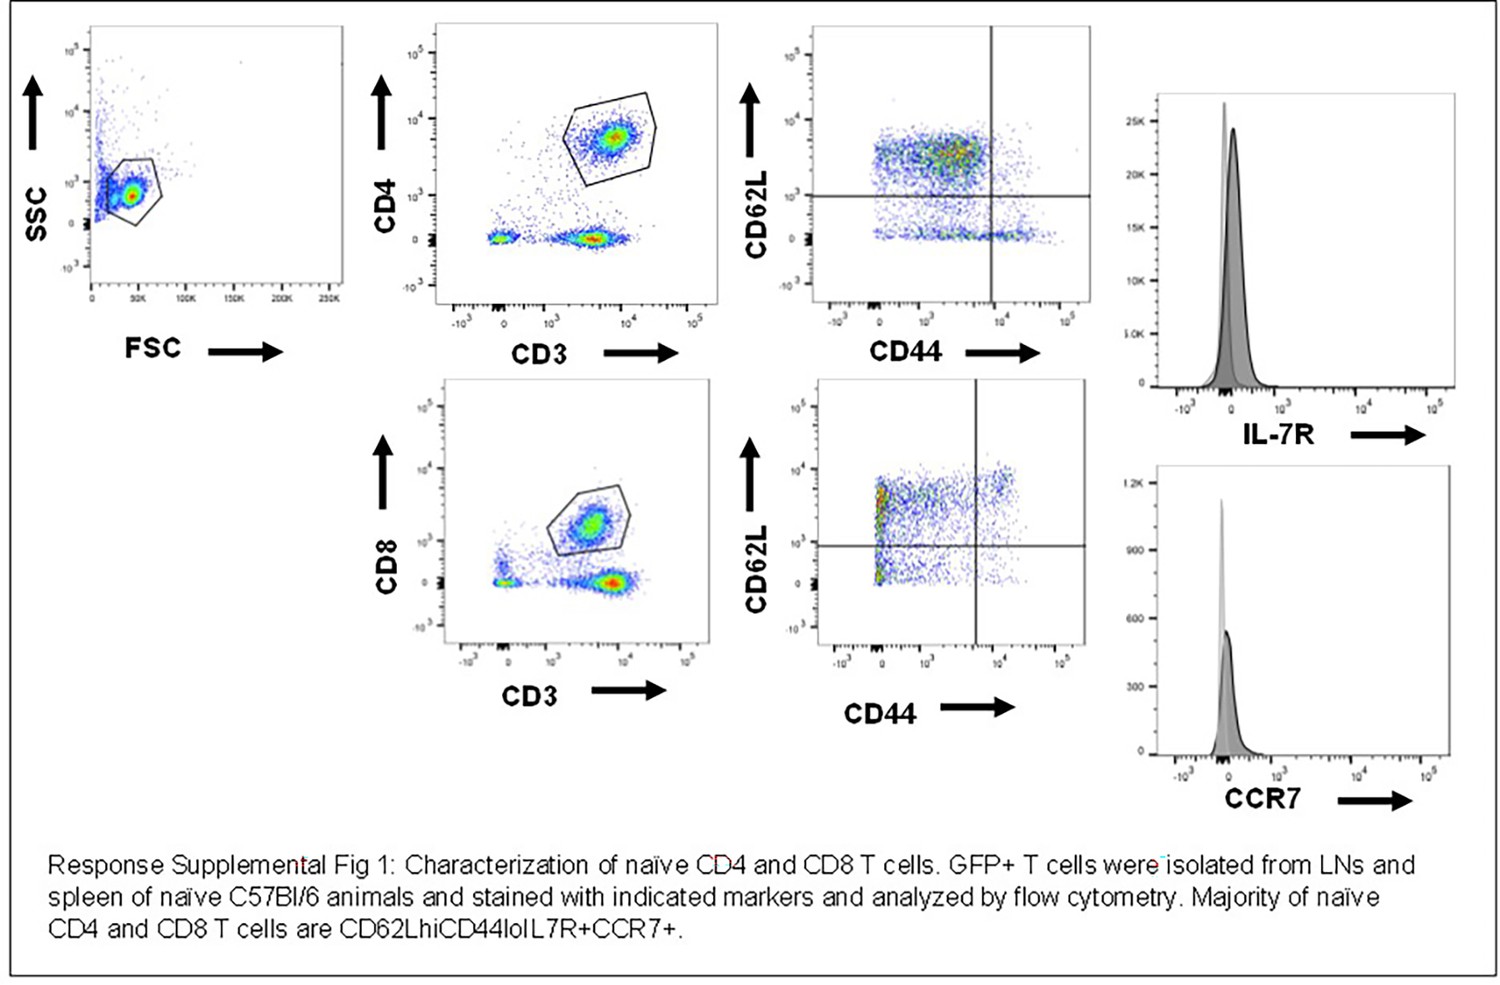
Characterization of naive CD4 and CD8 cells.
GFP+ T cells were isolated from LNs and spleen and naïve C57/BI/6 animals and stained with indicated markers and analyzed by flow cytometry. Majority of naïve CD4 and CD8 T cells are CD62LhiCD44lolL7R+CCR7+.
Author response image 2

Characterization of activated CD8 T cells in vitro activated by anti-CD3 and anti-CD28, then adoptively transferred into LPS inflamed lung.
CD8 T cells from Ub-GFP animals were isolated by Miltenyi selection, then adoptively transferred into mice that had received LPD intranasally the prior. At D7, lungs were removed and single cells suspension prepared, and CD8+GFP+ cells were analyzed for CD44 and CD62L. Adoptively transferred CD8 T cells were predominantly CD44hiCD62Llo.
Author response image 3

Characterization of activated CD8 T cells activated in lung of influenza infected animals at d8 post infection.
C57Bl/6 animals were infected with 1x103 HKx31 and at d8 post infection, lungs were removed and single cell suspension prepared from lung tissue and analyzed by flow cytometry. CD8 T cells were CD44hi and some fraction CXCR4+ but very few CXCR3+.
Author response image 4
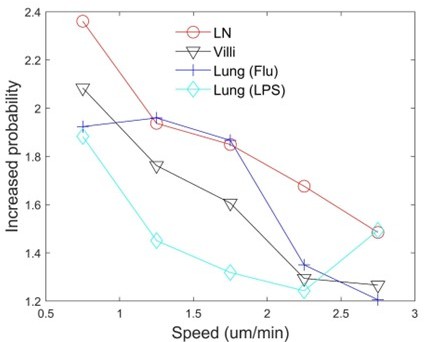
Persistance plot at low speeds.
Videos
Video 1
GFP+ naive T cells moving in lymph nodes (LNs).
Naive T cells were isolated from LNs and spleen of Ubiquitin-GFP animals and adoptively transferred into naive C57Bl/6 recipients, then imaged using two-photon microscopy as described in Fricke et al., 2016, PLoS Computational Biology. GFP+ naive T cells were imaged as described, tracked, and analyzed. The video contains a representative image from multiple fields of LNs imaged. The data are reproduced under the Creative Commons CC-BY 4.0 license.
Video 2
Migration of CD8 T cells in small intestinal villi at day 8 after lymphocytic choriomeningitis virus (LCMV) infection.
Naive P14-GFP CD8 T cells were transferred to B6 mice that were infected with LCMV 1 day later. At days 5 and 8 after infection, the jejunum was imaged via TPLSM. The representative time-lapse videos show P14-GFP CD8 T cells (cyan) at the indicated time points. Hoechst stain (blue) was injected prior to imaging. Reproduced from Thompson et al. Cell Reports 2019 Video S1 under CC BY-NC-ND 4.0 license. Only D8 T cells are shown and D5 movie removed from original file.
Video 3
Migration of CD8+ effector T cells in explanted lungs from LPS-inflamed animals.
Left panel: Maximum projection of movie‐sequence capturing adoptively transferred T cells (green) within an explanted lung. Trajectories (white lines) show the position of analyzed cells over time. Hours:minutes:seconds are shown in the left bottom corner. Right panel: 3D depiction of cell positions (green circles) and trajectories (blue lines) over time. To improve depth perception, the image volume is rotating during replay. Reproduced from Supplementary Movie 1 in Mrass et al., 2017, Nature Communications, Supplementary Movie 1 under Creative Commons CC-BY 4.0 license.
Video 4
Migration of CD8+ effector T cells in lungs at d8 after HKx31 influenza infection.
Naive CD8 T cells from Ubiquitin-GFP animals were isolated and adoptively transferred into naive C57Bl/6 mice, then infected with HKx31. At d8 post infection, lungs were removed and imaged with a heated and oxygenated chamber.
Tables
Table 1
Two-photon microscopy T cell data.
| Lymph node (LN) | Small intestine (villi) | Lung (Flu) | Lung (LPS) | |
|---|---|---|---|---|
| Number of T cells | 4400 | 425 | 355 | 191 |
| Type of T cell | Naive | Activated | Activated | Activated |
| Mode of activation | Not activated | In vivo | In vitro | In vivo |
| T cell specificity | Polyclonal | TCR transgenic | Polyclonal and TCR transgenic | Polyclonal |
| Imaging modality | Tissue explant | In situ | Tissue explant | In situ and tissue explant |
| Source | Fricke et al., 2016; Tasnim et al., 2018 | Thompson et al., 2019 | Mrass and Cannon | Mrass et al., 2017 |
Table 2
Comparison of inter-tissue versus intra-tissue variability in cell motility.
We performed an analysis of variance (ANOVA) study which computes a ratio of differences in means between groups and within groups. The ANOVA test uses a F-distribution which computes a ratio of between- and within-group variance. We previously showed that in the lymph node (LN), motility of T cells captured in different fields and on different days from different LNs of different mice did not contribute significantly to variation within T cell movement of the data set (Letendre et al., 2015). To test intra-tissue variability, the groups consisted of frames composed of two-photon tracks within the same tissue of a single mouse. To test inter-tissue variability, the sets consisted of the aggregated frames of two-photon tracks of all mice imaged in the same tissue. To assess intra-tissue variability compared with inter-tissue variability, we performed an ANOVA analysis of cell-based speed. ANOVA analysis shows that while there exist significant differences in T cell motility between the different tissues (Column 3, Row 2), ANOVA analysis also shows that there exist even more significant differences within frames of each individual tissue, particularly of T cells in the LN (Column 3, Rows 3–6). We found the same trend when performing the ANOVA test with the displacement speed and volume per time. To decrease the variability within a tissue type, we selected a reduced set of frames from each tissue based on statistical variability. Twenty-one frames of the most variable frames were removed from the 40 LN frames which increased the ANOVA p-value from to when the ANOVA test was re-run with the remaining nineteen frames using the cell-based speed (Row 3, Column 5). Two variable frames were removed from the ten villi frames which increased the ANOVA p-value from to (Row 4, Column 5). One frame was removed from the five lung (Flu) frames which increased the ANOVA p-value from to 0.38 (Row 5, Column 5). No frames were removed from the lung (LPS) data set as none were statistically variable from the other frames. The remaining number of T cells for each tissue is shown in Column 4. The dramatic increase in p-value demonstrates that the removed frames were outliers compared with the data from the same tissue. The data set with outlier frames removed is called the ‘reduced data set’. As the variability within each tissue is reduced, the inter-tissue p-value decreased from to in Row 2 when the reduced set of files is analyzed. The new inter-tissue p-value is significantly smaller than the p-values measuring the intra-tissue variability in Column 5, Rows 3–6 .
| Complete data set | Reduced data set | ||||
|---|---|---|---|---|---|
| Col 1 | Col 2 | Col 3 | Col 4 | Col 5 | |
| Row 1 | Groups | Number of cells and frames | ANOVA p-value | Number of cells and frames | ANOVA p-value |
| Row 2 Inter-tissue variability | Aggregated frames from LN, villi, lung (Flu), lung (LPS) | 5371 | 2443 | ||
| Row 3 Intra-tissue | LN frames | 4400 cells 40 frames | 1659 cells 19 frames | ||
| Row 4 Intra-tissue | Villi frames | 425 cells 10 frames | 296 cells 8 frames | ||
| Row 5 Intra-tissue | Lung (Flu) frames | 355 cells 5 frames | 297 cells 4 frames | 0.38 | |
| Row 6 Intra-tissue | Lung (LPS) frames | 191 cells 3 frames | 191 cells 3 frames | ||
Table 3
Table of p-values of pairwise comparisons of cell-based speed as shown in Figure 1A using Wilcoxon rank sum test.
| LN | Villi | Lung (Flu) | Lung (LPS) | |
|---|---|---|---|---|
| LN | 1.0 | 0.51 | 1.0 | |
| Villi | 0.51 | 1.0 | 1.0 | |
| Lung (Flu) | 1.0 | 1.0 | 1.0 | |
| Lung (LPS) | 1.0 |
Table 4
Table of p-values of pairwise comparisons of displacement speed shown in Figure 1B using Wilcoxon rank sum test.
| LN | Villi | Lung (Flu) | Lung (LPS) | |
|---|---|---|---|---|
| LN | 1.0 | 1.0 | ||
| Villi | 1.0 | 1.0 | ||
| Lung (Flu) | 1.0 | 0.13 | ||
| Lung (LPS) | 0.13 | 1.0 |
Table 5
Table showing mean square displacement p-values as pairwise comparisons from Figure 2B using Wilcoxon rank sum test.
| LN | Villi | Lung (Flu) | Lung (LPS) | |
|---|---|---|---|---|
| LN | 1.0 | 0.88 | ||
| Villi | 0.88 | 1.0 | ||
| Lung (Flu) | 1.0 | |||
| Lung (LPS) | 1.0 |
Table 6
Table of p-values of pairwise comparisons of proportion of turning angles <90° shown in Figure 3A using Wilcoxon rank sum test.
| LN | Villi | Lung (Flu) | Lung (LPS) | |
|---|---|---|---|---|
| LN | 1.0 | 1.0 | ||
| Villi | 1.0 | 1.0 | ||
| Lung (Flu) | 1.0 | |||
| Lung (LPS) | 1.0 |
Table 7
Table shows p-values of pairwise comparisons of meandering ratio as shown in Figure 4 using Wilcoxon rank sum test.
| LN | Villi | Lung (Flu) | Lung (LPS) | |
|---|---|---|---|---|
| LN | 1.0 | |||
| Villi | 1.0 | |||
| Lung (Flu) | 1.0 | |||
| Lung (LPS) | 1.0 |
Table 8
Table showing p-values of pairwise comparisons of confined ratios from Figure 5A using Wilcoxon rank sum test.
| LN | Villi | Lung (Flu) | Lung (LPS) | |
|---|---|---|---|---|
| LN | 1.0 | 1.0 | ||
| Villi | 1.0 | 1.0 | ||
| Lung (Flu) | 1.0 | |||
| Lung (LPS) | 1.0 |
Table 9
Table showing p-values of pairwise comparisons of confined time from Figure 5B using Wilcoxon rank sum test.
| LN | Villi | Lung (Flu) | Lung (LPS) | |
|---|---|---|---|---|
| LN | 1.0 | |||
| Villi | 1.0 | |||
| Lung (Flu) | 1.0 | |||
| Lung (LPS) | 1.0 |
Table 10
Table of p-values of pairwise comparisons of volume per time from Figure 6A using Wilcoxon rank sum test.
| LN | Villi | Lung (Flu) | Lung (LPS) | |
|---|---|---|---|---|
| LN | 1.0 | 1.0 | ||
| Villi | 1.0 | 1.0 | ||
| Lung (Flu) | 1.0 | 1.0 | ||
| Lung (LPS) | 1.0 | 1.0 |
Table 11
Table of p-values of pairwise comparisons of volume per time distributions from Figure 6B using Kolmogorov–Smirnov test.
| LN | Villi | Lung (Flu) | Lung (LPS) | |
|---|---|---|---|---|
| LN | 1.0 | 0.07 | ||
| Villi | 0.07 | 1.0 | ||
| Lung (Flu) | 1.0 | |||
| Lung (LPS) | 1.0 |
Additional files
-
MDAR checklist
- https://cdn.elifesciences.org/articles/84916/elife-84916-mdarchecklist1-v2.docx
-
Supplementary file 1
Supplementary T cell files.
- https://cdn.elifesciences.org/articles/84916/elife-84916-supp1-v2.zip
Download links
A two-part list of links to download the article, or parts of the article, in various formats.
Downloads (link to download the article as PDF)
Open citations (links to open the citations from this article in various online reference manager services)
Cite this article (links to download the citations from this article in formats compatible with various reference manager tools)
Quantitative analyses of T cell motion in tissue reveals factors driving T cell search in tissues
eLife 12:e84916.
https://doi.org/10.7554/eLife.84916


