Molecular basis of ligand-dependent Nurr1-RXRα activation
- Skaggs Graduate School of Chemical and Biological Sciences at Scripps Research, United States
- Department of Integrative Structural and Computational Biology, Scripps Research and UF Scripps Biomedical Research, United States
- Department of Molecular Medicine, Scripps Research and UF Scripps Biomedical Research, United States
Figures
Figure 1

Contribution of retinoid X receptor alpha (RXRα) domains on repressing Nurr1 transcription.
(a) General scheme of the cellular transcriptional reporter assay. (b) 3xNBRE-luciferase assay performed in SK-N-BE(2)-C cells; see Figure 1—source data 1 for data plotted. Data are normalized to empty vector control (n=9 replicates), shown as a box and whiskers plot with boundaries of the box representing the 25th percentile and the 75th percentile, and representative of two or more independent experiments. Statistical testing was performed and p-values were calculated using the Brown-Forsythe and Welch multiple comparisons test of the FL Nurr1 + RXRα constructs conditions relative to FL Nurr1 control condition.
-
Figure 1—source data 1
Nurr1+ retinoid X receptor alpha (RXRα) truncated construct luciferase reporter data.
- https://cdn.elifesciences.org/articles/85039/elife-85039-fig1-data1-v3.zip
Figure 2
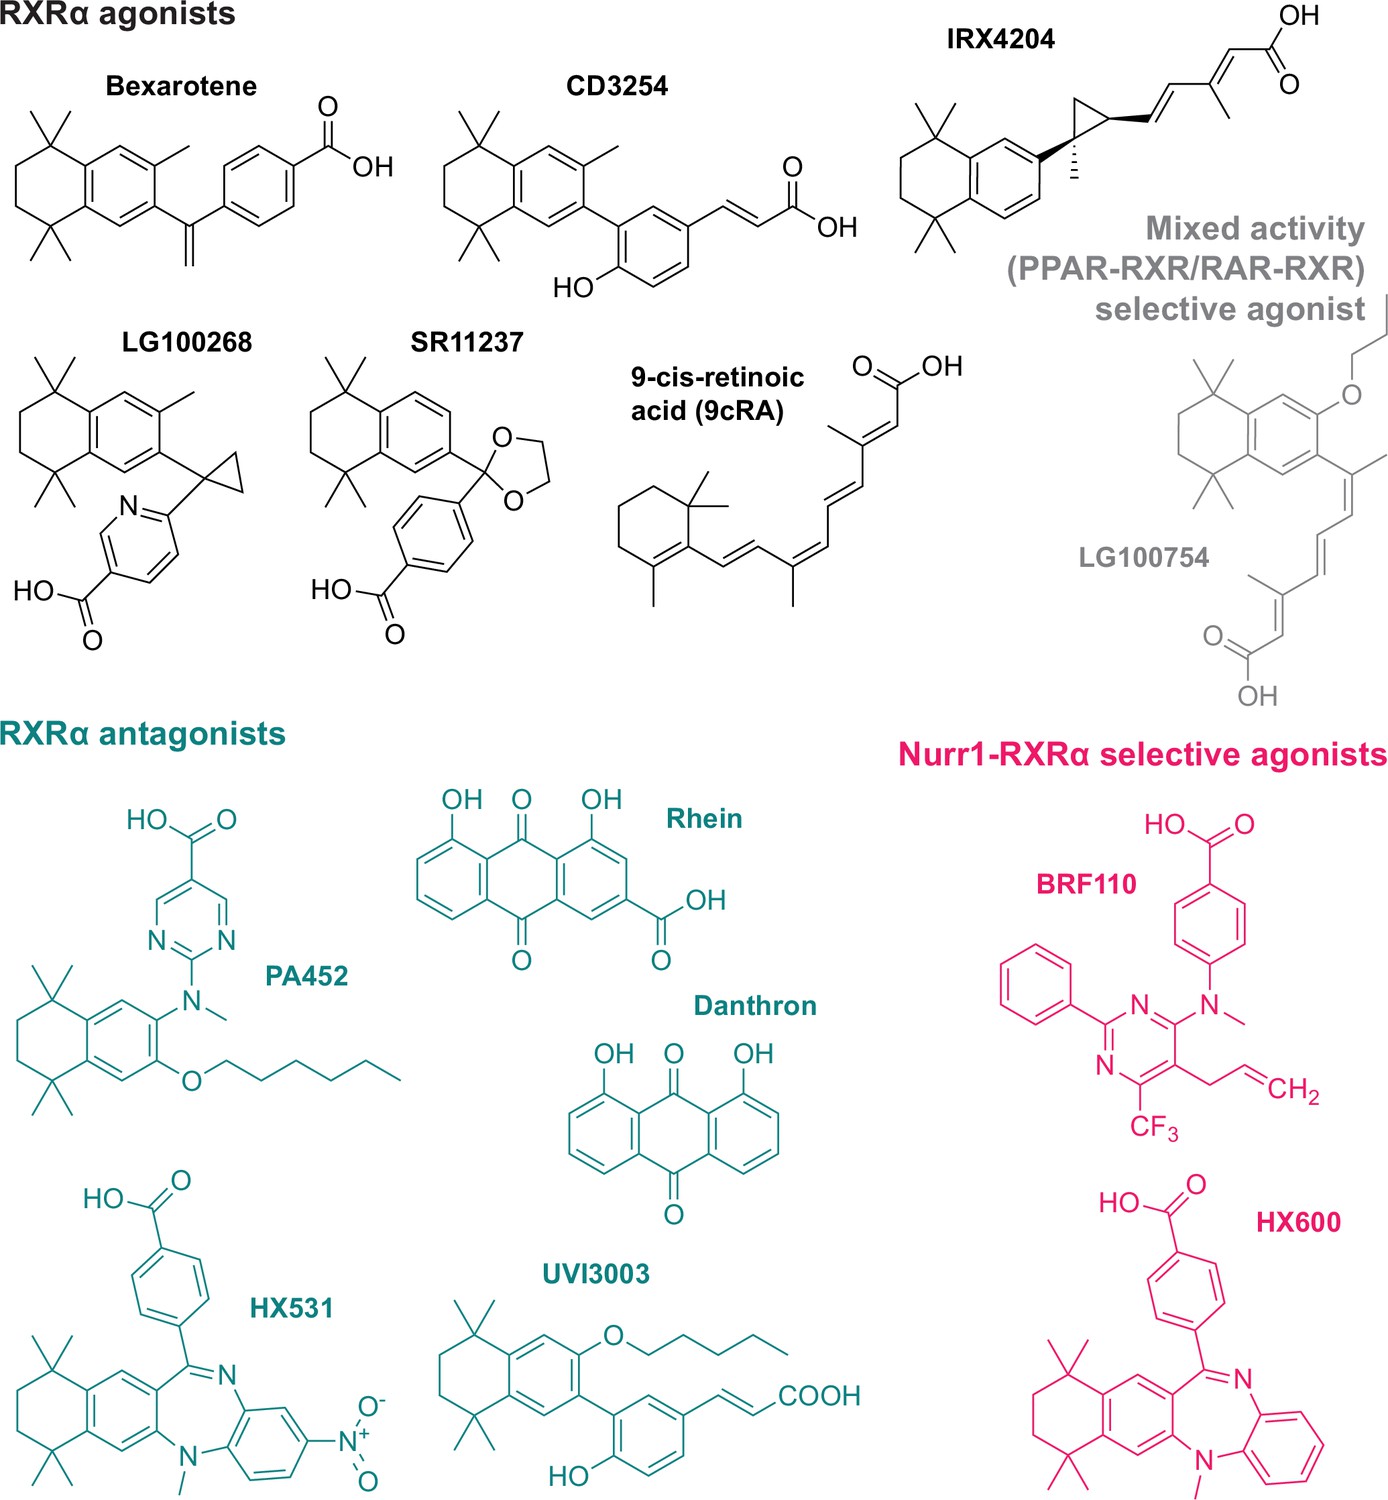
Retinoid X receptor alpha (RXRα) ligands used in this study.
Grouped by pharmacological phenotype, the set includes ligands that classically activate (agonists) or block (antagonists) activation of RXRα homodimers; a mixed activity modulator (LG100754) that antagonizes RXRα homodimers and activates PPARγ-RXRα and RAR-RXRα heterodimers; and two selective activators of Nurr1-RXRα heterodimers (BRF110 and HX600).
Figure 3

Effect of retinoid X receptor alpha (RXRα)-binding ligands on Nurr1-RXRα transcription.
(a) General scheme of the Nurr1-RXRα/3xNBRE-luciferase cellular transcriptional reporter assay. (b) Nurr1-RXRα/3xBNRE-luciferase transcriptional reporter assay performed in SK-N-BE(2)-C cells treated with RXRα ligand (1 µM) or DMSO (dotted line); see Figure 3—source data 1 for data plotted. Data are normalized to DMSO (n=9 replicates), represent the mean ± s.d., and representative of two or more independent experiments. Statistical testing was performed and p-values were calculated using the Brown-Forsythe and Welch multiple comparisons test relative to DMSO control treated condition.
-
Figure 3—source data 1
Retinoid X receptor alpha (RXRα) ligand treated Nurr1-RXRα/3xNBRE3-luciferase reporter data.
- https://cdn.elifesciences.org/articles/85039/elife-85039-fig3-data1-v3.zip
Figure 4
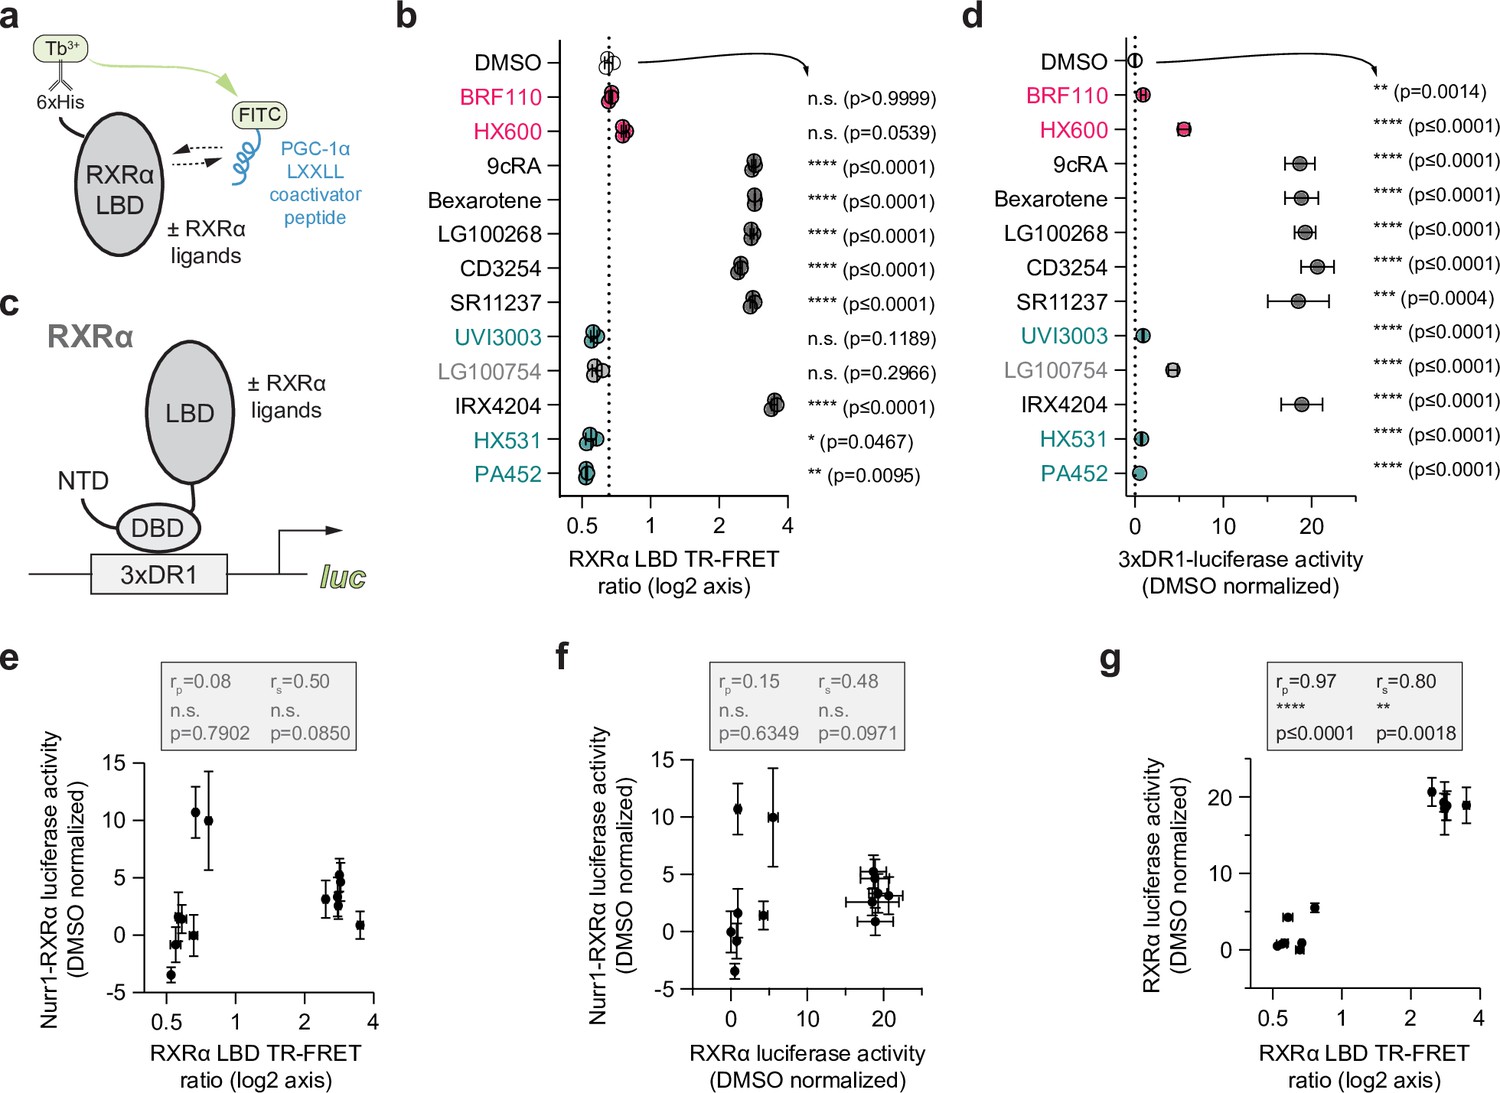
Compound profiling for pharmacological retinoid X receptor alpha (RXRα) agonism and correlation to Nurr1-RXRα agonism.
(a) General scheme of the RXRα ligand-binding domain (LBD) time-resolved fluorescence resonance energy transfer (TR-FRET) coactivator peptide interaction assay. (b) TR-FRET ratio measured in the presence of DMSO (dotted line) or compound (2–4 µM); see Figure 4—source data 1 for data plotted. Data are normalized to DMSO control (n=3 biological replicates), represent the mean ± s.d., representative of two or more independent experiments. Statistical testing was performed and p-values were calculated using ordinary one-way ANOVA tests for multiple comparisons with Dunnett corrections relative to DMSO control treated condition. (c) General scheme of the RXRα/3xDR1-luciferase cellular transcriptional reporter assay. (d) RXRα/3xDR1-luciferase transcriptional reporter assay performed in HEK293T cells treated with compound (1 µM) or DMSO control (dotted line); see Figure 4—source data 2 for data plotted. Data normalized to DMSO (n=6 replicates), represent the mean ± s.d., and representative of two or more independent experiments. Statistical testing was performed and p-values were calculated using the Brown-Forsythe and Welch multiple comparisons test relative to DMSO control treated condition. (e) Correlation plot of RXRα LBD TR-FRET data vs. Nurr1-RXRα cellular transcription data. (f) Correlation plot of RXRα transcriptional reporter data vs. Nurr1-RXRα cellular transcription data. (g) Correlation plot of RXRα transcriptional reporter data vs. RXRα LBD TR-FRET data. Pearson (rp) and Spearman (rs) correlation coefficients and statistical significance testing are reported above the correlation plots.
-
Figure 4—source data 1
Retinoid X receptor alpha (RXRα) ligand treated RXRα ligand-binding domain (LBD) time-resolved fluorescence resonance energy transfer (TR-FRET) coactivator interaction data.
- https://cdn.elifesciences.org/articles/85039/elife-85039-fig4-data1-v3.zip
-
Figure 4—source data 2
Retinoid X receptor alpha (RXRα) ligand treated RXRα/3xDR1-luciferase reporter data.
- https://cdn.elifesciences.org/articles/85039/elife-85039-fig4-data2-v3.zip
Figure 5

Compound profiling for effects on Nurr1-retinoid X receptor alpha (RXRα) ligand-binding domain (LBD) heterodimer affinity and correlation to Nurr1-RXRα agonism.
(a) General scheme of the Nurr1-RXRα LBD isothermal titration calorimetry (ITC) experiment. (b) Nurr1-RXRα LBD heterodimer affinities (log M) in the presence of DMSO (dotted line) or compound determined from the fit of the ITC data (n=2 replicates, except n=1 for IRX4204 and PA452) and represent the mean ± s.d.; see Table 1 and Figure 5—source data 1 for data plotted. Statistical testing was performed and p-values were calculated using ordinary one-way ANOVA relative to DMSO control treated condition. (c) Correlation plot of ITC determined Nurr1-RXRα LBD heterodimer KD log M values vs. Nurr1-RXRα cellular transcription data. (d) Correlation plot of ITC determined Nurr1-RXRα LBD heterodimer KD log M values vs. fitted binding enthalpy (ΔH, which is the ΔHAB component of the homodimer competition model; see Materials and methods section for details). (e) Correlation plot of ITC determined Nurr1-RXRα LBD heterodimer KD log M values vs. calculated binding entropy (TΔS). Pearson (rp) and Spearman (rs) correlation coefficients and statistical significance testing are reported above the correlation plot.
-
Figure 5—source data 1
Raw isothermal titration calorimetry (ITC) thermograms and fitted data.
- https://cdn.elifesciences.org/articles/85039/elife-85039-fig5-data1-v3.zip
Figure 6 with 3 supplements
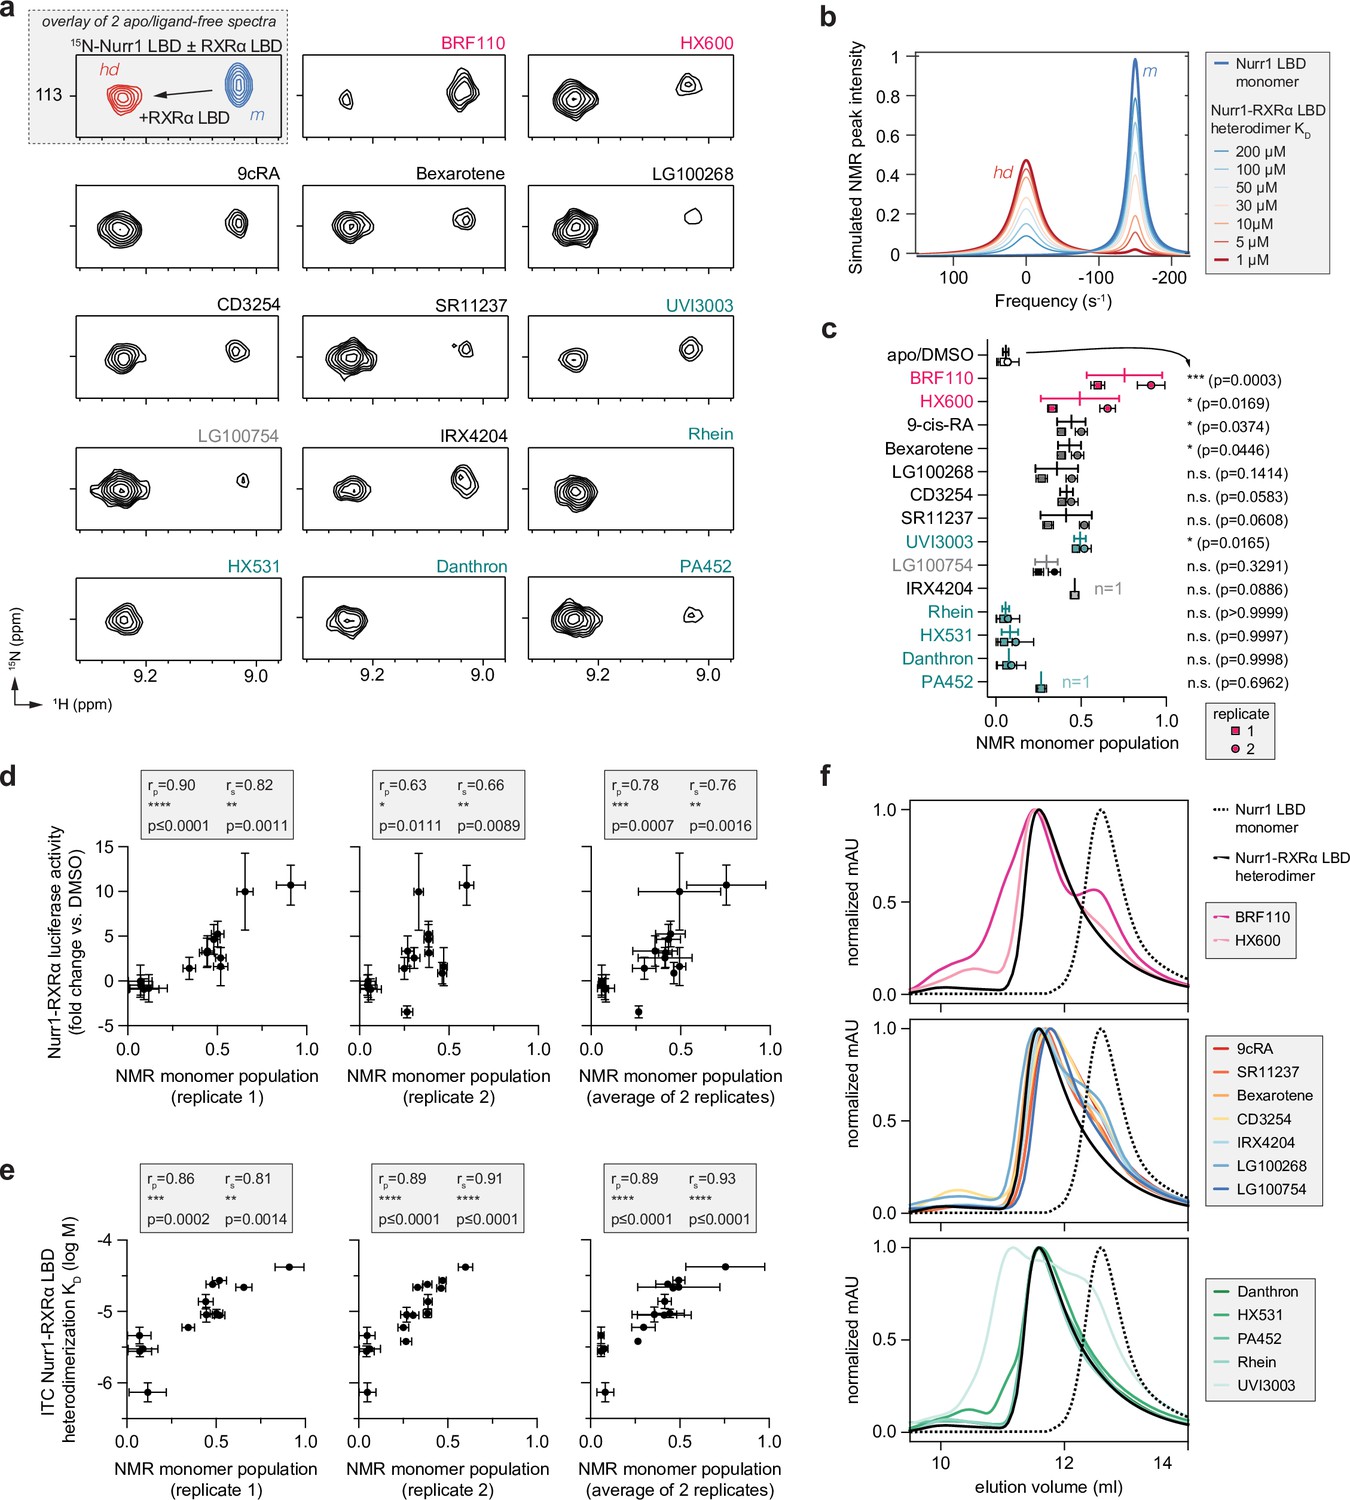
Compound profiling for effects on Nurr1-retinoid X receptor alpha (RXRα) ligand-binding domain (LBD) conformational properties in solution and correlation to Nurr1-RXRα agonism.
(a) 2D [1H,15N]-TROSY HSQC data of 15N-labeled Nurr1 LBD heterodimerized with unlabeled RXRα LBD in the presence of RXRα ligands focused on the NMR peak of Thr411. The upper inset shows an overlay of 15N-labeled Nurr1 LBD monomer (200 µM) vs. 15N-labeled Nurr1 LBD-unlabeled RXRα LBD heterodimer (1:2 molar ratio) to demonstrate the shift of the Thr411 peak between monomer (m) and heterodimer (hd) forms; see Figure 6—figure supplement 1 for full spectral overlays. (b) Simulated 1H NMR lineshape analysis of Nurr1 LBD residue Thr411 showing the influence of ligand-induced weakening of Nurr1-RXRα LBD heterodimerization affinity; see Figure 6—source code 1 for calculation input files. (c) NMR estimated Nurr1 LBD monomer populations from the 2D NMR data (n=2 replicates, except n=1 for IRX4204 and PA452) and lines above the replicate values represent the mean ± s.d.; see Figure 6—source data 1 for data plotted. Statistical testing was performed and p-values were calculated using ordinary one-way ANOVA relative to apo/DMSO control treated condition. (d) Correlation plot of Nurr1-RXRα cellular transcription data vs. NMR estimated Nurr1 LBD monomer populations. (e) Correlation plot of ITC determined Nurr1-RXRα LBD heterodimer KD log M values vs. NMR estimated Nurr1 LBD monomer populations. Pearson (rp) and Spearman (rs) correlation coefficients and statistical significance testing are reported above the correlation plots. (f) Analytical size exclusion chromatography (SEC) analysis of Nurr1-RXRα in the presence of RXRα ligands (solid colored lines) relative to Nurr1 LBD monomer (dotted black line) and Nurr1-RXRα LBD heterodimer (solid black line); see Figure 6—figure supplement 2 for all SEC data organized by ligand.
-
Figure 6—source code 1
Input files for NMR LineShapeKin simulated NMR data analysis in MATLAB (two input files and one readme file).
- https://cdn.elifesciences.org/articles/85039/elife-85039-fig6-code1-v3.zip
-
Figure 6—source data 1
Retinoid X receptor alpha (RXRα) ligand treated Nurr1-RXRα ligand-binding domain (LBD) NMR-observed monomer species.
- https://cdn.elifesciences.org/articles/85039/elife-85039-fig6-data1-v3.zip
Figure 6—figure supplement 1
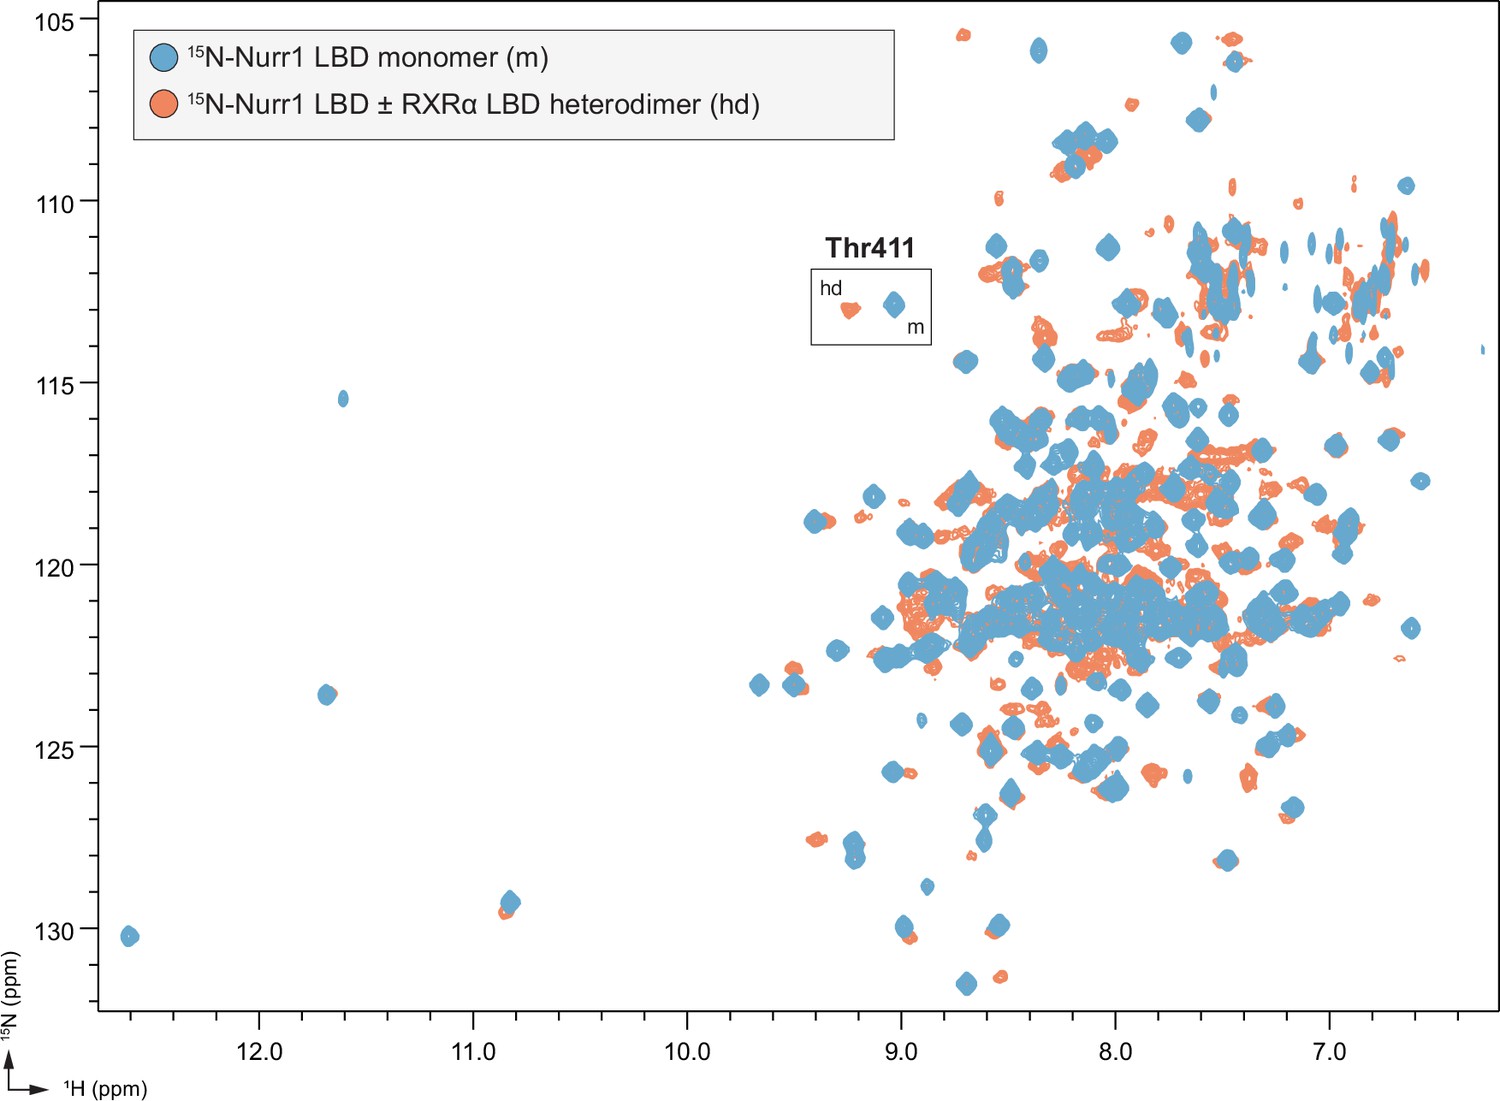
Full overlay of 2D [1H,15N]-TROSY-HSQC data of 15N-labeled Nurr1 ligand-binding domain (LBD) (200 μM) in monomeric (m) and heterodimer (hd) forms with retinoid X receptor alpha (RXRα) LBD (400 μM).
Figure 6—figure supplement 2

Analytical size exclusion chromatography (SEC) profiles of Nurr1 ligand-binding domain (LBD) (monomer), retinoid X receptor alpha (RXRα) LBD (homodimer and homotetramer), and Nurr1-RXRα LBD (heterodimer) with RXRα ligands present in the RXRα LBD-containing conditions (homodimer or Nurr1-RXRα heterodimer).
Figure 6—figure supplement 3
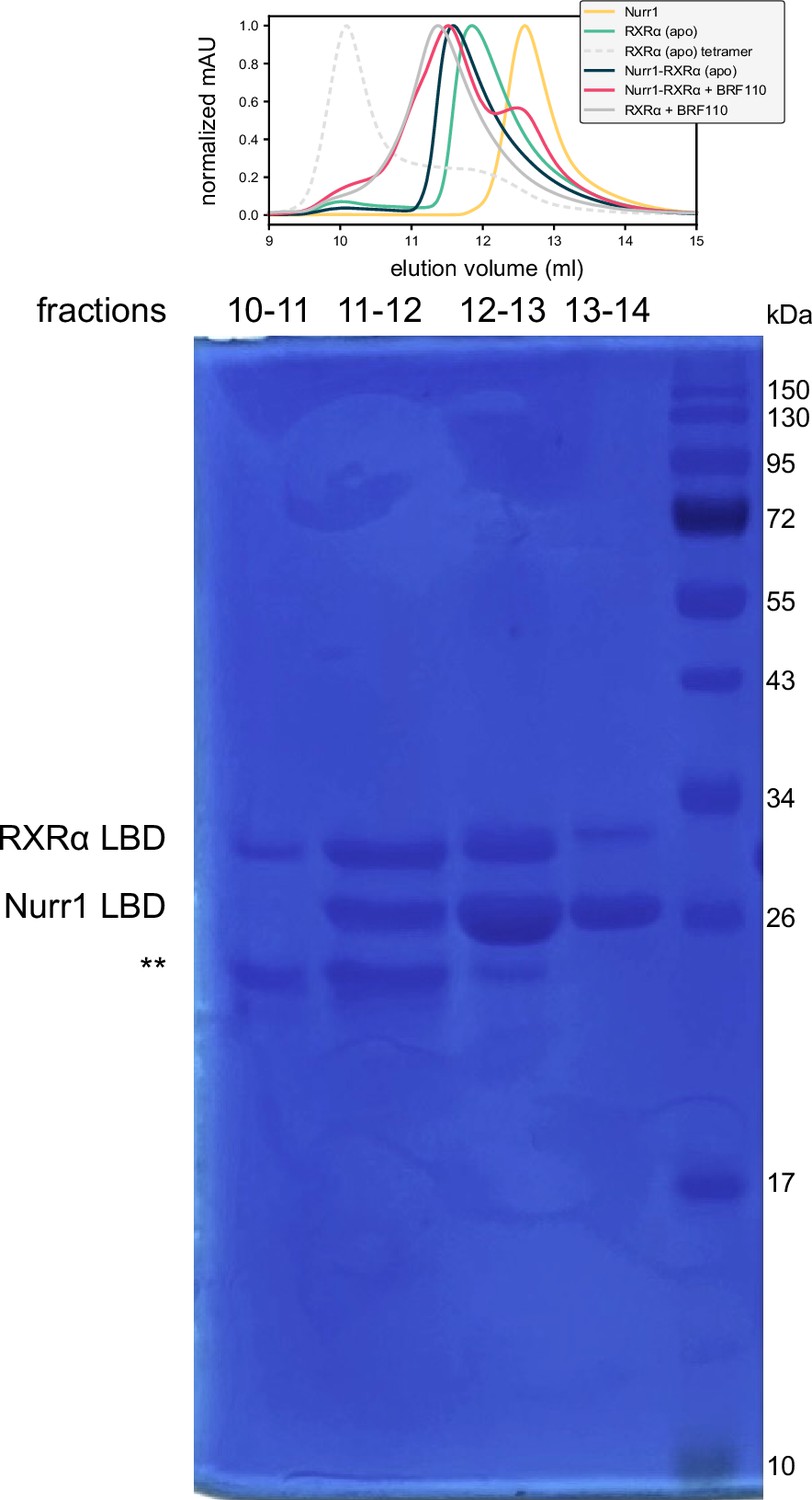
SDS-PAGE analysis of fractions collected from size exclusion chromatography (SEC) analysis of Nurr1-retinoid X receptor alpha (RXRα) ligand-binding domain (LBD) heterodimer in the presence of BRF110.
Fractions corresponding to the indicated regions of the SEC chromatography are annotated, as well as the locations of the Nurr1 LBD and RXRα LBD. The bands annotated with ** correspond to a degraded RXRα LBD population that formed when these SEC samples were stored at 4°C for an extended period of time prior to SDS-PAGE analysis. See Figure 6—figure supplement 3—source data 1for raw unedited gel with and without annotation.
-
Figure 6—figure supplement 3—source data 1
Full raw unedited gel, without and with annotation (two JPG files).
- https://cdn.elifesciences.org/articles/85039/elife-85039-fig6-figsupp3-data1-v3.zip
Figure 7
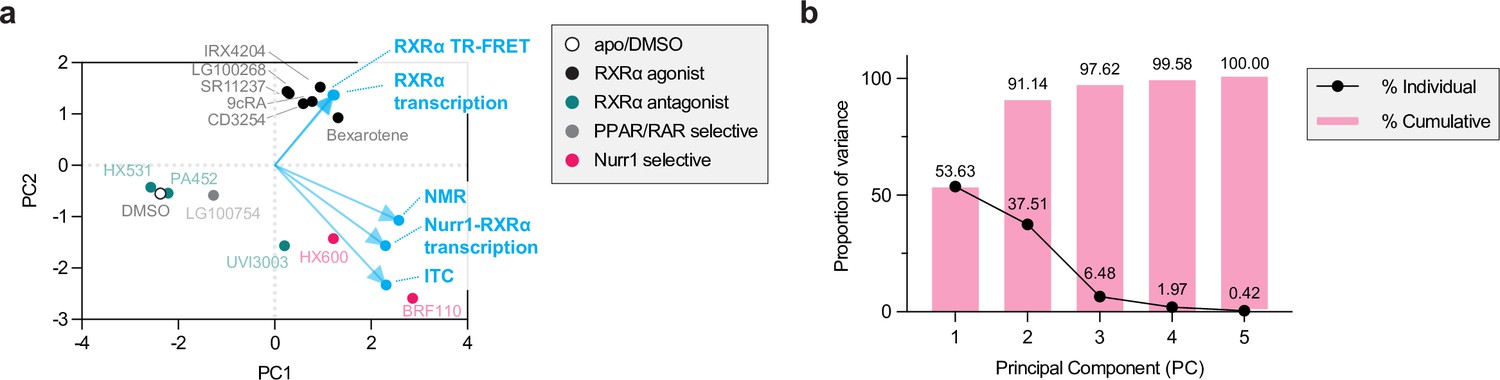
Principal component analysis (PCA) of experimental data reveals Nurr1-retinoid X receptor alpha (RXRα) agonism and classical RXRα agonism are uncorrelated.
(a) 2D biplot containing the loadings and PC scores of the first two PCs. PC scores of the ligands are colored according to pharmacological activity (see legend) whereas the loadings (experimental variables) are colored light blue. (b) A proportion of variance plot revealing the amount of variance described by each PC individually and cumulatively.
Figure 8

Data-informed model for activation of Nurr1-retinoid X receptor alpha (RXRα) transcription by RXRα ligands.
Tables
Table 1
Fitted and calculated isothermal titration calorimetry (ITC) Nurr1-RXRα binding affinity and thermodynamic parameters.
| Ligand | log KD (M) | ΔH (kcal/mol) | TΔS (kcal/mol) | ||||||||||||||
|---|---|---|---|---|---|---|---|---|---|---|---|---|---|---|---|---|---|
| Average | s.d. | n | Replicates | Average | s.d. | n | Replicates | Average | s.d. | n | Replicates | ||||||
| DMSO | –5.335 | 0.118 | 2 | –5.418 | –5.252 | 2.900 | 0.240 | 2 | 3.070 | 2.730 | 10.179 | 0.401 | 2 | 10.462 | 9.895 | ||
| BRF110 | –4.376 | 0.020 | 2 | –4.390 | –4.362 | 5.365 | 0.361 | 2 | 5.110 | 5.620 | 11.335 | 0.334 | 2 | 11.099 | 11.571 | ||
| HX600 | –4.662 | 0.028 | 2 | –4.681 | –4.642 | 7.695 | 4.320 | 2 | 4.640 | 10.750 | 14.054 | 4.283 | 2 | 11.026 | 17.083 | ||
| 9cRA | –5.026 | 0.060 | 2 | –4.984 | –5.068 | 5.110 | 0.962 | 2 | 5.790 | 4.430 | 13.539 | 3.105 | 2 | 12.589 | 11.344 | ||
| Bexarotene | –4.619 | 0.044 | 2 | –4.588 | –4.650 | 5.555 | 1.336 | 2 | 4.610 | 6.500 | 11.857 | 1.396 | 2 | 10.870 | 12.844 | ||
| LG100268 | –5.044 | 0.106 | 2 | –5.119 | –4.969 | 5.135 | 0.148 | 2 | 5.240 | 5.030 | 12.017 | 0.294 | 2 | 12.224 | 11.809 | ||
| CD3254 | –4.860 | 0.099 | 2 | –4.930 | –4.790 | 4.865 | 0.389 | 2 | 5.140 | 4.590 | 11.495 | 0.524 | 2 | 11.866 | 11.125 | ||
| SR11237 | –5.053 | 0.047 | 2 | –5.087 | –5.020 | 4.940 | 0.962 | 2 | 5.620 | 4.260 | 11.834 | 1.026 | 2 | 12.560 | 11.109 | ||
| UVI3003 | –4.565 | 0.021 | 2 | –4.580 | –4.550 | 6.125 | 2.638 | 2 | 7.990 | 4.260 | 12.353 | 2.666 | 2 | 14.238 | 10.467 | ||
| LG100754 | –5.222 | 0.026 | 2 | –5.204 | –5.240 | 4.270 | 0.226 | 2 | 4.110 | 4.430 | 11.394 | 0.261 | 2 | 11.209 | 11.579 | ||
| IRX4204 | –4.673 | 0.000 | 1 | –4.673 | 8.460 | 0.000 | 1 | 8.460 | 14.835 | 0.000 | 1 | 14.835 | |||||
| Rhein | –5.554 | 0.077 | 2 | –5.499 | –5.609 | 2.780 | 0.396 | 2 | 3.060 | 2.500 | 10.357 | 0.290 | 2 | 10.563 | 10.152 | ||
| HX531 | –6.132 | 0.133 | 2 | –6.226 | –6.038 | 2.205 | 0.021 | 2 | 2.190 | 2.220 | 10.571 | 0.160 | 2 | 10.684 | 10.457 | ||
| Danthron | –5.524 | 0.043 | 2 | –5.494 | –5.554 | 2.920 | 0.170 | 2 | 3.040 | 2.800 | 10.456 | 0.111 | 2 | 10.535 | 10.378 | ||
| PA452 | –5.417 | 0.000 | 1 | –5.417 | 4.120 | 0.000 | 1 | 4.120 | 11.510 | 0.000 | 1 | 11.510 | |||||
Appendix 1—key resources table
| Reagent type (species) or resource | Designation | Source or reference | Identifiers | Additional information |
|---|---|---|---|---|
| Strain, strain background (Escherichia coli) | BL21(DE3) | Sigma-Aldrich | CMC0014 | Electrocompetent cells |
| Cell line (Homo sapiens) | Human embryonic kidney epithelial | ATCC | CRL-11268 | |
| Cell line (Homo sapiens) | SK-N-BE(2) neuroblastoma | ATCC | CRL-2271 | |
| Chemical compound, drug | BRF110 | Sigma-Aldrich | CAS 2095489-35-1 | |
| Chemical compound, drug | HX600 | Axon Medchem | CAS 172705- 89-4 | |
| Chemical compound, drug | 9-cis-Retinoic acid | Cayman Chemicals | CAS 5300-03-8 | |
| Chemical compound, drug | Bexarotene | Cayman Chemicals | CAS 153559- 49-0 | |
| Chemical compound, drug | LG100268 | Cayman Chemicals | CAS 153559-76-3 | |
| Chemical compound, drug | CD3254 | Cayman Chemicals | CAS 196961-43-0 | |
| Chemical compound, drug | SR11237 | Tocris Bioscience | CAS 146670-40-8 | |
| Chemical compound, drug | UVI3003 | Cayman Chemicals | CAS 847239-17-2 | |
| Chemical compound, drug | LG100754 | Cayman Chemicals | CAS 180713-37-5 | |
| Chemical compound, drug | IRX4204 | MedChemExpress | CAS 220619-73-8 | |
| Chemical compound, drug | Rhein | Sigma-Aldrich | CAS 478-43- 3 | |
| Chemical compound, drug | HX531 | Cayman Chemicals | CAS 188844-34-0 | |
| Chemical compound, drug | Danthron | Sigma-Aldrich | CAS 117-10-2 | |
| Chemical compound, drug | PA452 | Tocris Bioscience | CAS 457657-34-0 | |
| Peptide, recombinant protein | FITC-PGC1α | LifeTein | Amino acid sequence: EAEEPSLLKKLLLAPANTQ, with an N-terminal FITC label and an amidated C-terminus. | |
| Recombinant DNA reagent | Nurr1-ligand binding domain (LBD) (plasmid) | de Vera et al., 2016 | Bacteria expression plasmid | |
| Recombinant DNA reagent | RXRα-ligand binding domain (LBD) (plasmid) | Kojetin et al., 2015 | Bacteria expression plasmid | |
| Recombinant DNA reagent | pET45b(+) | Novagen | 71327-3 | |
| Transfected construct (Photinus pyralis) | 3xNBRE-luciferase plasmid | de Vera et al., 2016 | Sanger sequenced | |
| Transfected construct (Photinus pyralis) | 3xDR1-luciferase plasmid | Hughes et al., 2014 | Mammalian expression plasmid, Sanger sequenced | The 3xPPRE-luciferase reporter plasmid in the referenced paper was used in our study. |
| Transfected construct (human) | Full-length human Nurr1 | de Vera et al., 2016 | Mammalian expression plasmid, Sanger sequenced | |
| Transfected construct (human) | Full-length human RXRα in pCMV-Sport6 vector | Zhang et al., 2011c | Mammalian expression plasmid, Sanger sequenced | We obtained this plasmid from Griffin lab at UF Scripps Institute (see referenced paper). |
| Recombinant DNA reagent | pcDNA3.1 empty vector | Thermo Fisher Scientific | V790-20 | |
| Sequence-based reagent | RXRα-ΔLBD-F | This paper | PCR primer ordered from Sigma | CAGCAGCGCCTAAGAGGACATG |
| Sequence-based reagent | RXRα-ΔLBD-R | This paper | PCR primer ordered from Sigma | CATGTCCTCTTAGGCGCTGCTG |
| Sequence-based reagent | ΔNTD-RXRα-F | This paper | PCR primer ordered from Sigma | CCACCCCTCGAGAAACATGG |
| Sequence-based reagent | ΔNTD-RXRα-R | This paper | PCR primer ordered from Sigma | CCATGTTTCTCGAGGGGTGG |
| Gene (human) | Nurr1 (NR4A2) | Uniprot | Full length: residues 1–598; LBD: residues 353–598 | |
| Gene (human) | RXRα (NR2B1) | Uniprot | Full length: residues 1–462; LBD: 223–462 | |
| Sequence-based reagent | Restriction enzymes, ligase for cloning | NEB | XhoI, HindIII, T4 ligase | |
| Commercial assay or kit | Gibson assembly | NBE | E2611L | |
| Commercial assay or kit | Britelite plus Reporter Gene Assay System | Perkin Elmer | 6066769 | |
| Sequence-based reagent | RXRα-LBD | This paper | gBlock for Gibson assembly | CCAGCACAGTGGCGGCCGCATGAAGCGGGAAGCCGTGCAGGAGGAGCGGCAGCGTGGCAAGGACCGGAACGAGAATGAGGTGGAGTCGACCAGCAGCGCCAACGAGGACATGCCGGTGGAGAGGATCCTGGAGGCTGAGCTGGCCGTGGAGCCCAAGACCGAGACCTACGTGGAGGCAAACATGGGGCTGAACCCCAGCTCGCCGAACGACCCTGTCACCAACATTTGCCAAGCAGCCGACAAACAGCTTTTCACCCTGGTGGAGTGGGCCAAGCGGATCCCACACTTCTCAGAGCTGCCCCTGGACGACCAGGTCATCCTGCTGCGGGCAGGCTGGAATGAGCTGCTCATCGCCTCCTTCTCCCACCGCTCCATCGCCGTGAAGGACGGGATCCTCCTGGCCACCGGGCTGCACGTCCACCGGAACAGCGCCCACAGCGCAGGGGTGGGCGCCATCTTTGACAGGGTGCTGACGGAGCTTGTGTCCAAGATGCGGGACATGCAGATGGACAAGACGGAGCTGGGCTGCCTGCGCGCCATCGTCCTCTTTAACCCTGACTCCAAGGGGCTCTCGAACCCGGCCGAGGTGGAGGCGCTGAGGGAGAAGGTCTATGCGTCCTTGGAGGCCTACTGCAAGCACAAGTACCCAGAGCAGCCGGGAAGGTTCGCTAAGCTCTTGCTCCGCCTGCCGGCTCTGCGCTCCATCGGGCTCAAATGCCTGGAACATCTCTTCTTCTTCAAGCTCATCGGGGACACACCCATTGACACCTTCCTTATGGAGATGCTGGAGGCGCCGCACCAAATGACTTGATCGAGTCTAGAGGGCCCG |
| Commercial assay or kit | LanthaScreen Elite Tb-anti-His antibody | Thermo Fisher | #PV5895 | |
| Software, algorithm | NITPIC software | Keller et al., 2012 | Baseline calculation, curve integration | |
| Software, algorithm | SEDPHAT | Brautigam et al., 2016 | Estimation of binding affinity and thermodynamic parameter measurements | |
| Software, algorithm | GUSSI | Brautigam, 2015 | Plot ITC figures | |
| Other | NMR chemical shift assignment of Nurr1 LBD | Michiels et al., 2010; de Vera et al., 2019; Munoz-Tello et al., 2020 | BMRB16541 | Published NMR peak assignment from Biological Magnetic Resonance Data Bank |
| Software, algorithm | NMRFx | Norris et al., 2016 | NMR data process and analysis | |
| Software, algorithm | NMR LineShapeKin version 4 | Kovrigin, 2012 | NMR lineshape analysis | |
| Software, algorithm | MATLAB R2022a via NMRbox | Maciejewski et al., 2017 | NMR lineshape analysis | |
| Software, algorithm | Pearson and Spearman correlation analysis | GraphPad Prism | Correlation analysis | |
| Software, algorithm | Principal component analysis (PCA); | GraphPad Prism | Correlation analysis | |
| Software, algorithm | ANOVA multiple comparison test | GraphPad Prism | Statistical testing |
Additional files
-
Supplementary file 1
gBlock sequence used to clone the retinoid X receptor alpha (RXRα) ligand-binding domain (LBD) only construct.
- https://cdn.elifesciences.org/articles/85039/elife-85039-supp1-v3.docx
-
MDAR checklist
- https://cdn.elifesciences.org/articles/85039/elife-85039-mdarchecklist1-v3.pdf
Download links
A two-part list of links to download the article, or parts of the article, in various formats.
Downloads (link to download the article as PDF)
Open citations (links to open the citations from this article in various online reference manager services)
Cite this article (links to download the citations from this article in formats compatible with various reference manager tools)
Molecular basis of ligand-dependent Nurr1-RXRα activation
eLife 12:e85039.
https://doi.org/10.7554/eLife.85039


