Risk factors affecting polygenic score performance across diverse cohorts
- Department of Genetics, Perelman School of Medicine, University of Pennsylvania, United States
- Division of Nephrology, Department of Medicine, Columbia University, United States
- Department of Preventive Medicine, Northwestern University Feinberg School of Medicine, United States
- Department of Cardiovascular Medicine, Mayo Clinic, United States
- Department of Biomedical Informatics, Vanderbilt University Medical Center, United States
- Department of Pediatrics, University of Alabama at Birmingham, United States
- Departments of Pediatrics and Medicine, Columbia University Irving Medical Center, Columbia University, United States
- Department of Neurology, School of Medicine, University of Alabama at Birmingham, United States
- The Center for Autoimmune Genomics and Etiology, Division of Human Genetics, Cincinnati Children's Hospital Medical Center, United States
- Division of Clinical Pharmacology, Department of Medicine, Vanderbilt University Medical Center, United States
- Center for Genetic Medicine, Northwestern University Feinberg School of Medicine, United States
- Department of Biomedical Informatics, Vagelos College of Physicians & Surgeons, Columbia University, United States
- Division of Rheumatology, Inflammation, and Immunity, Department of Medicine, Brigham and Women's Hospital and Harvard Medical School, United States
- Departments of Medicine (Medical Genetics) and Genome Sciences, University of Washington Medical Center, United States
Figures
Figure 1
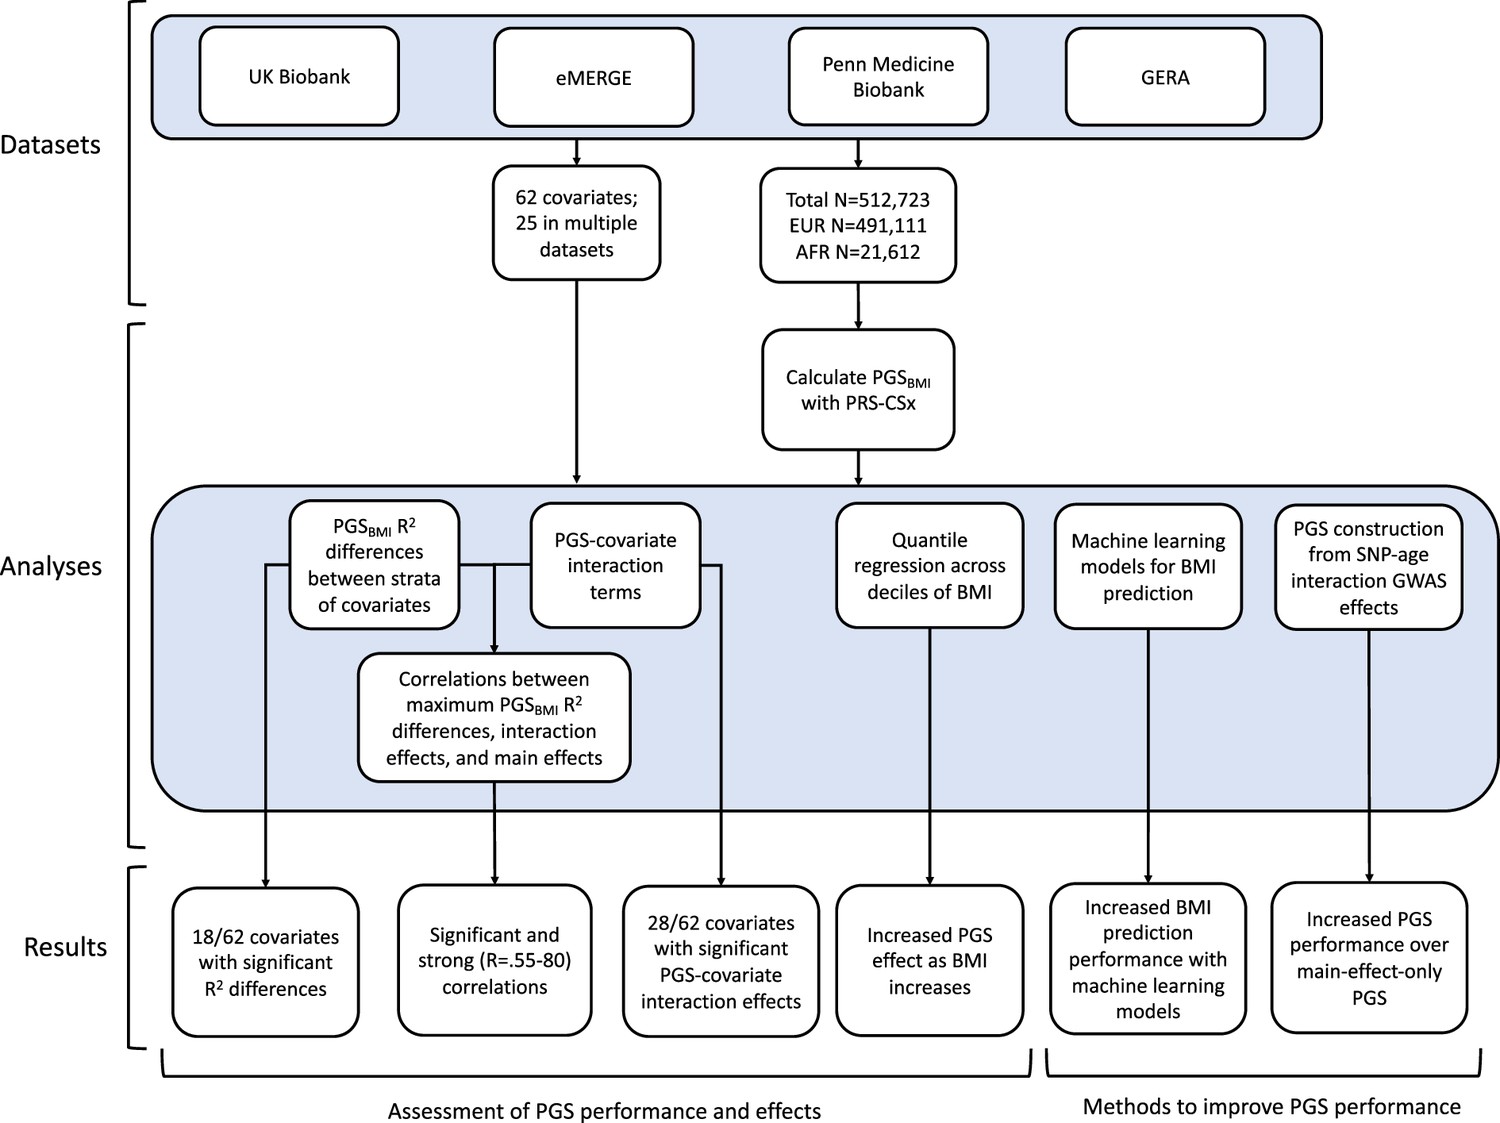
A flowchart of the project.
Figure 2
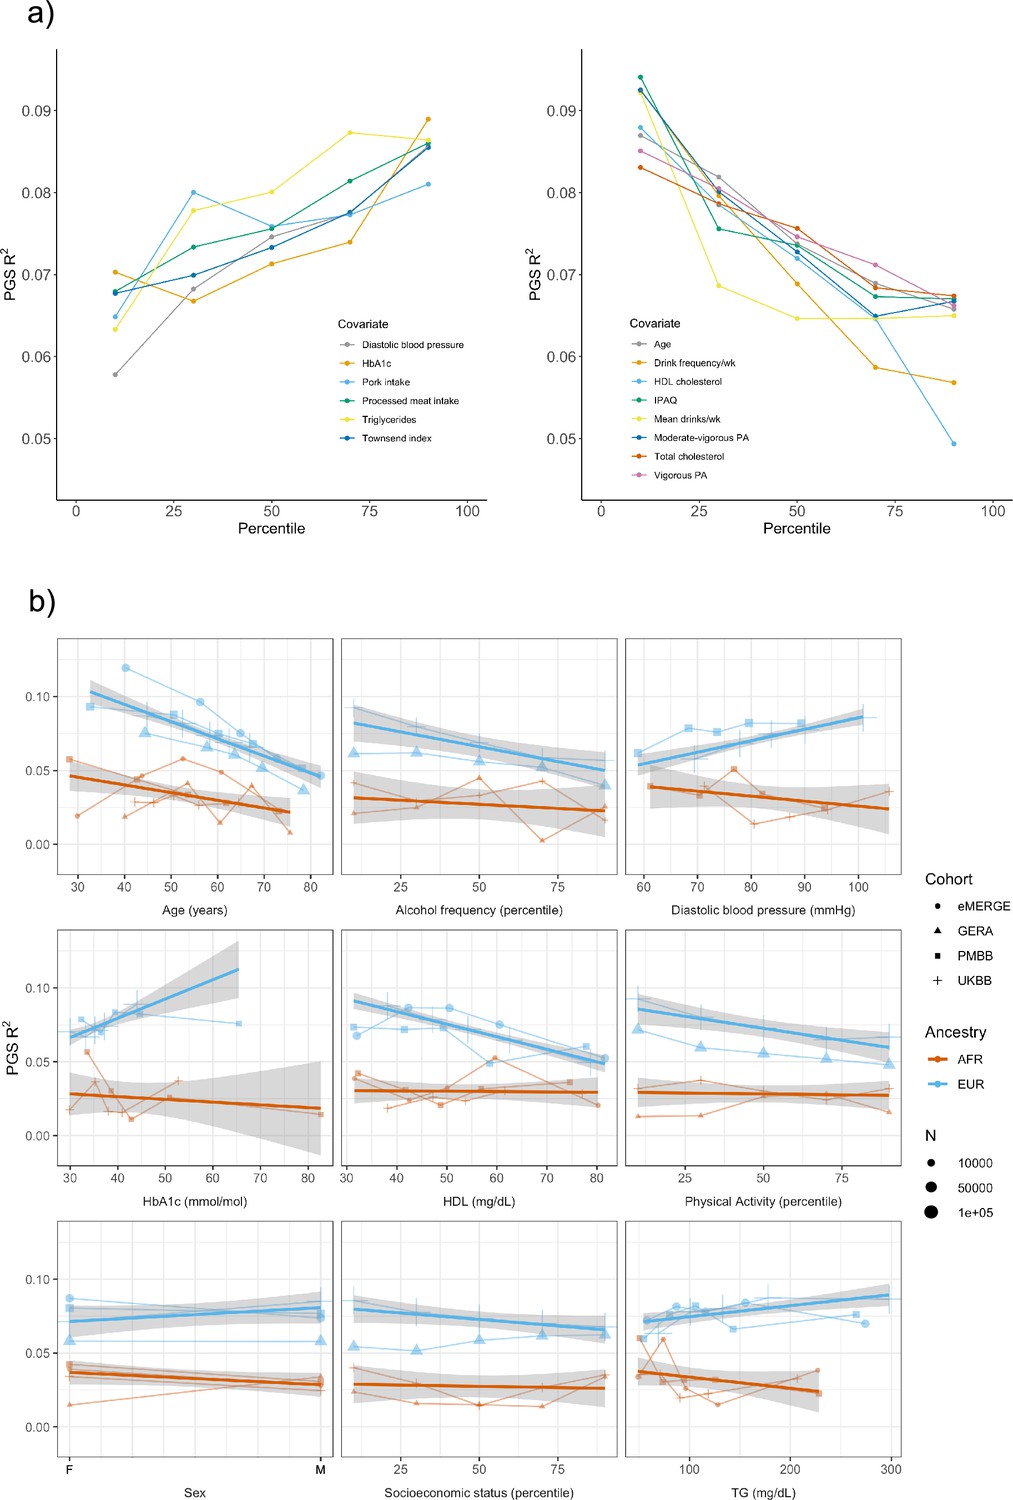
Polygenic score (PGS) R2 stratified by quintiles for quantitative variables and by binary variables.
(a) Continuous covariates with significant (p<8.1 × 10⁻⁴) R2 differences across quintiles in UK Biobank (UKBB) European ancestry (EUR). Pork and processed meat consumption per week were excluded from this plot in favor of pork and processed meat intake. (b) Covariates with significant differences that were available in multiple cohorts. When traits had the same or directly comparable units between cohorts we show the actual trait values (and show percentiles for physical activity, alcohol intake frequency, and socioeconomic status, which had slightly differing phenotype definitions across cohorts) plotted on x-axis. Townsend index and income were used as variables for socioeconomic status in UKBB and Genetic Epidemiology Research on Adult Health and Aging (GERA), respectively. Note that the sign for Townsend index was reversed, since increasing Townsend index is lower socioeconomic status, while increasing income is higher socioeconomic status. PA, physical activity (PA); IPAQ, International Physical Activity Questionnaire.
Figure 3 with 1 supplement
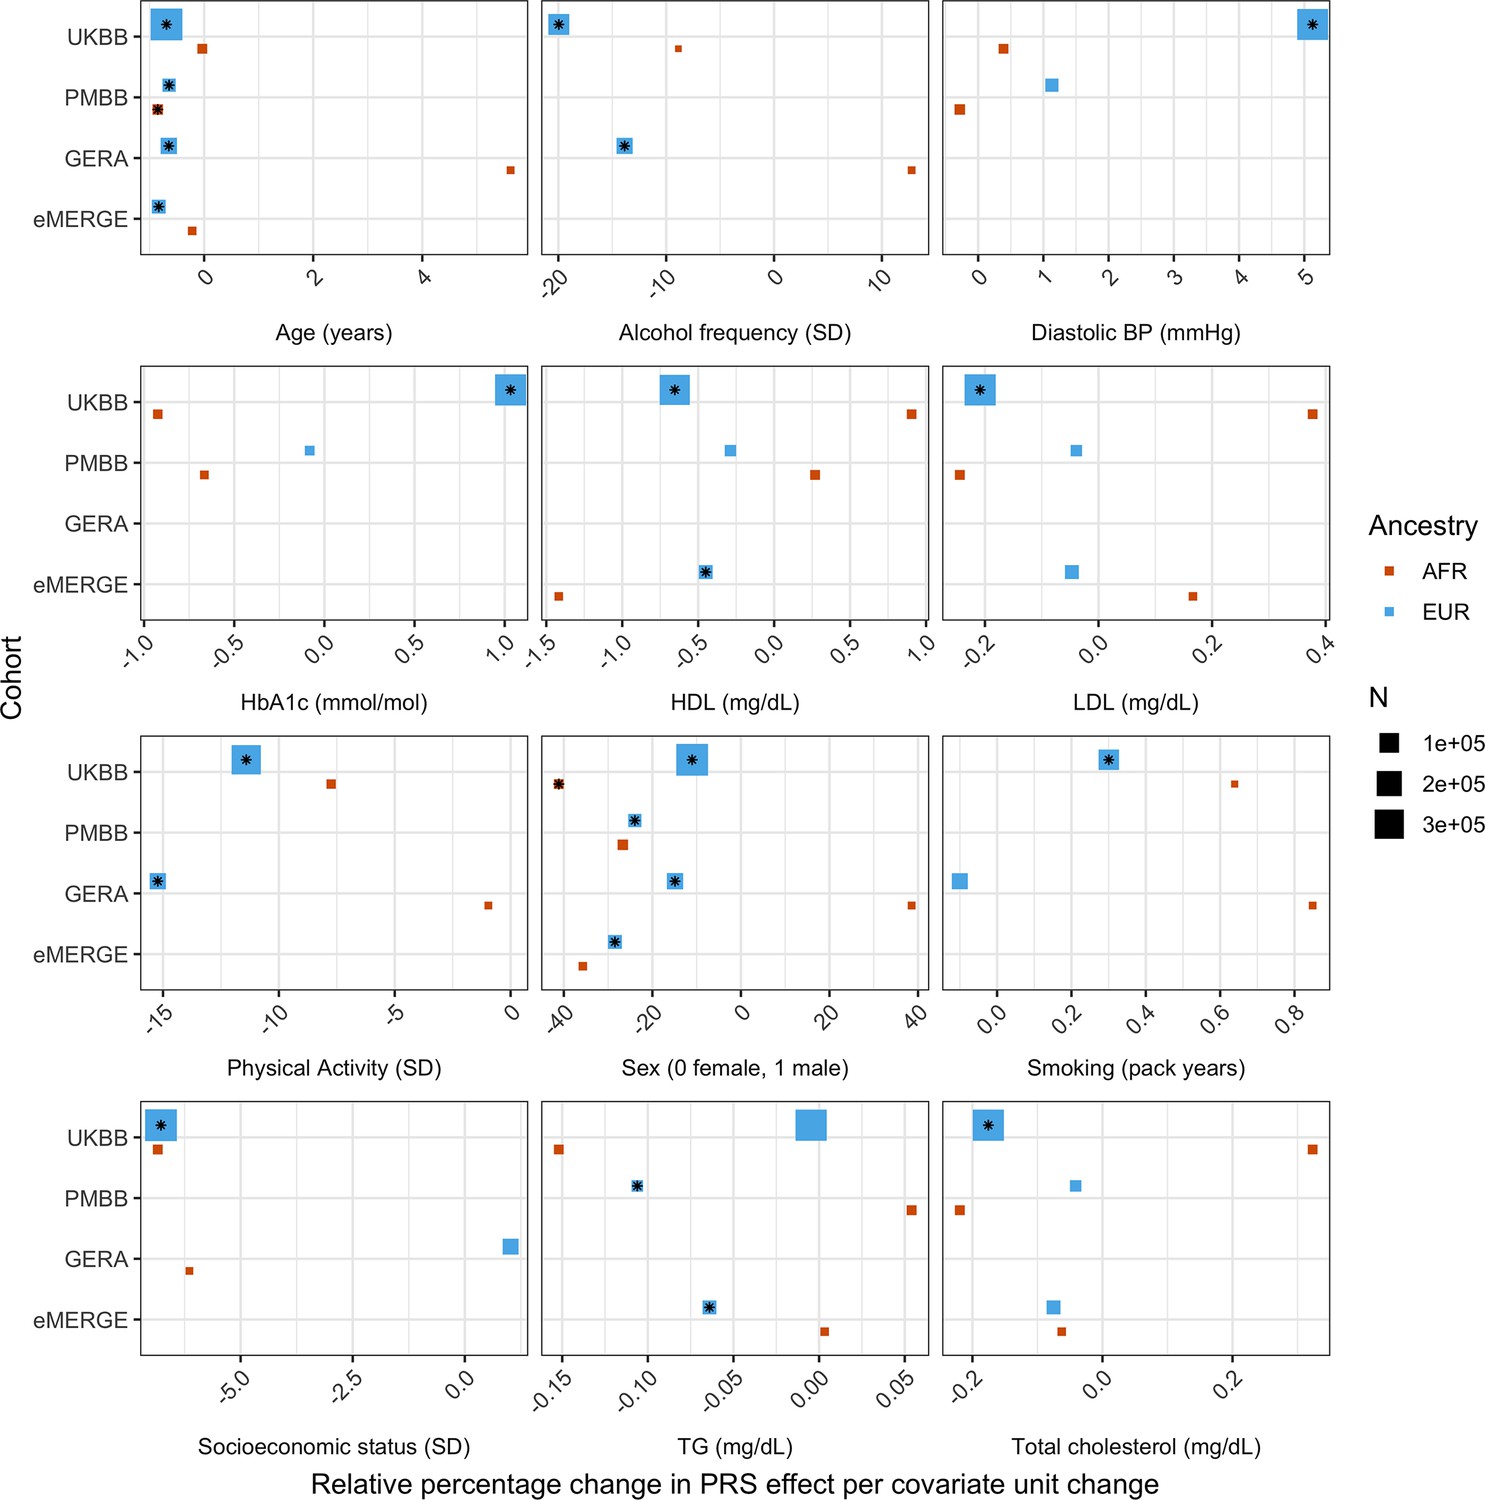
Relative percentage changes in polygenic score (PGS) effect per unit change in covariate, for covariates that significantly changed PGS effect (i.e., significant interaction beta at Bonferroni p<8.1 × 10⁻⁴ – denoted by asterisks) and were present in multiple cohorts and ancestries.
Same covariate groupings and transformations were performed as in Figure 1. Similarly, actual values were used when variables had comparable units across cohorts, and standard deviations (SD) used otherwise.
Figure 3—figure supplement 1

Polygenic score (PGS)–covariate interaction term -log10(p-values) in UK Biobank (UKBB) European ancestry (EUR), with and without including the covariate PGS in the model – the mean -log10(p) is reduced from 18.0899 to 14.97072 with their inclusions.
Note age and sex PGS were not calculated, and their interaction p-values are excluded from this figure.
Figure 4
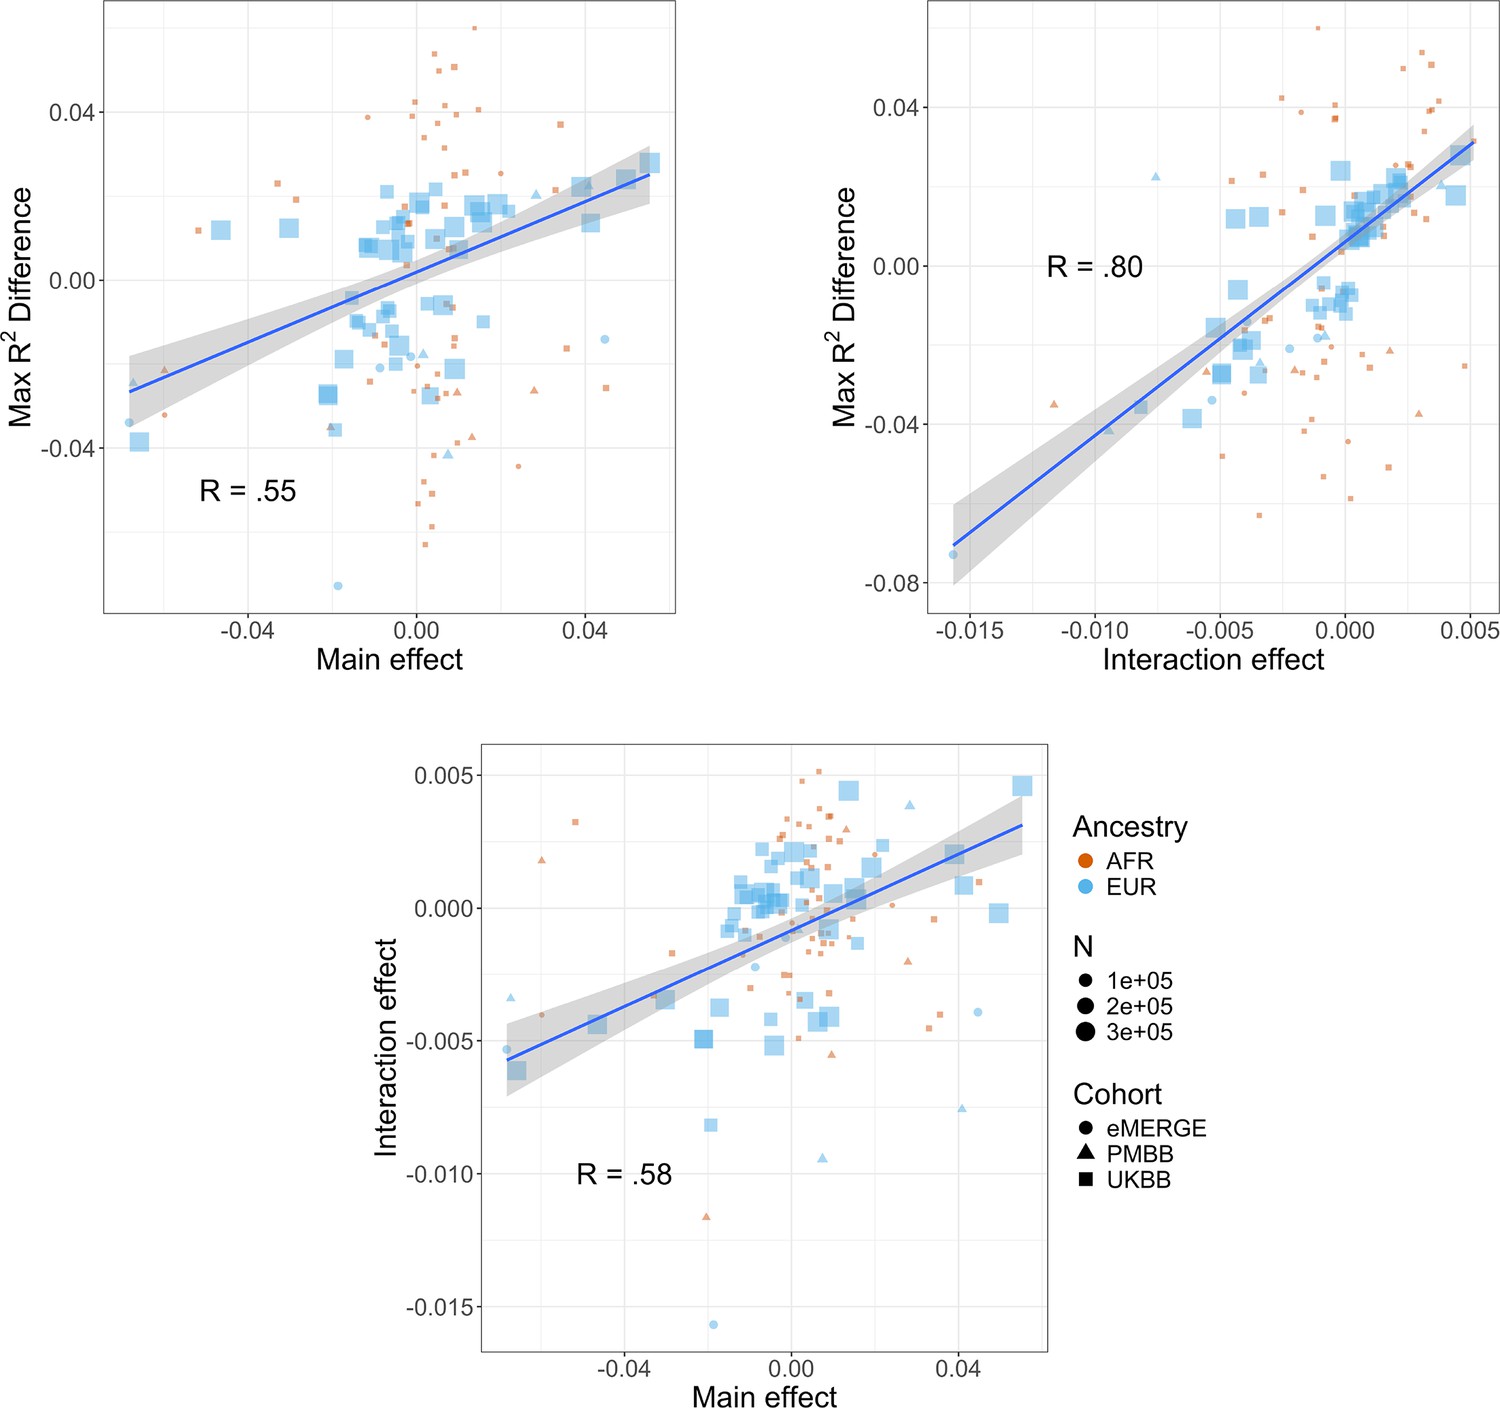
Relationships (Pearson correlations weighted by sample size) between maximum R2 differences across strata, main effects of covariate on log(BMI), and polygenic score (PGS)–covariate interaction effects on log(BMI).
Main effect units are in standard deviations, interaction effect units are in PGS standard deviations multiplied by covariate standard deviations. Only continuous variables are plotted and modeled. Genetic Epidemiology Research on Adult Health and Aging (GERA) was excluded due to slightly different phenotype definitions. BMI, body mass index.
Figure 5 with 2 supplements
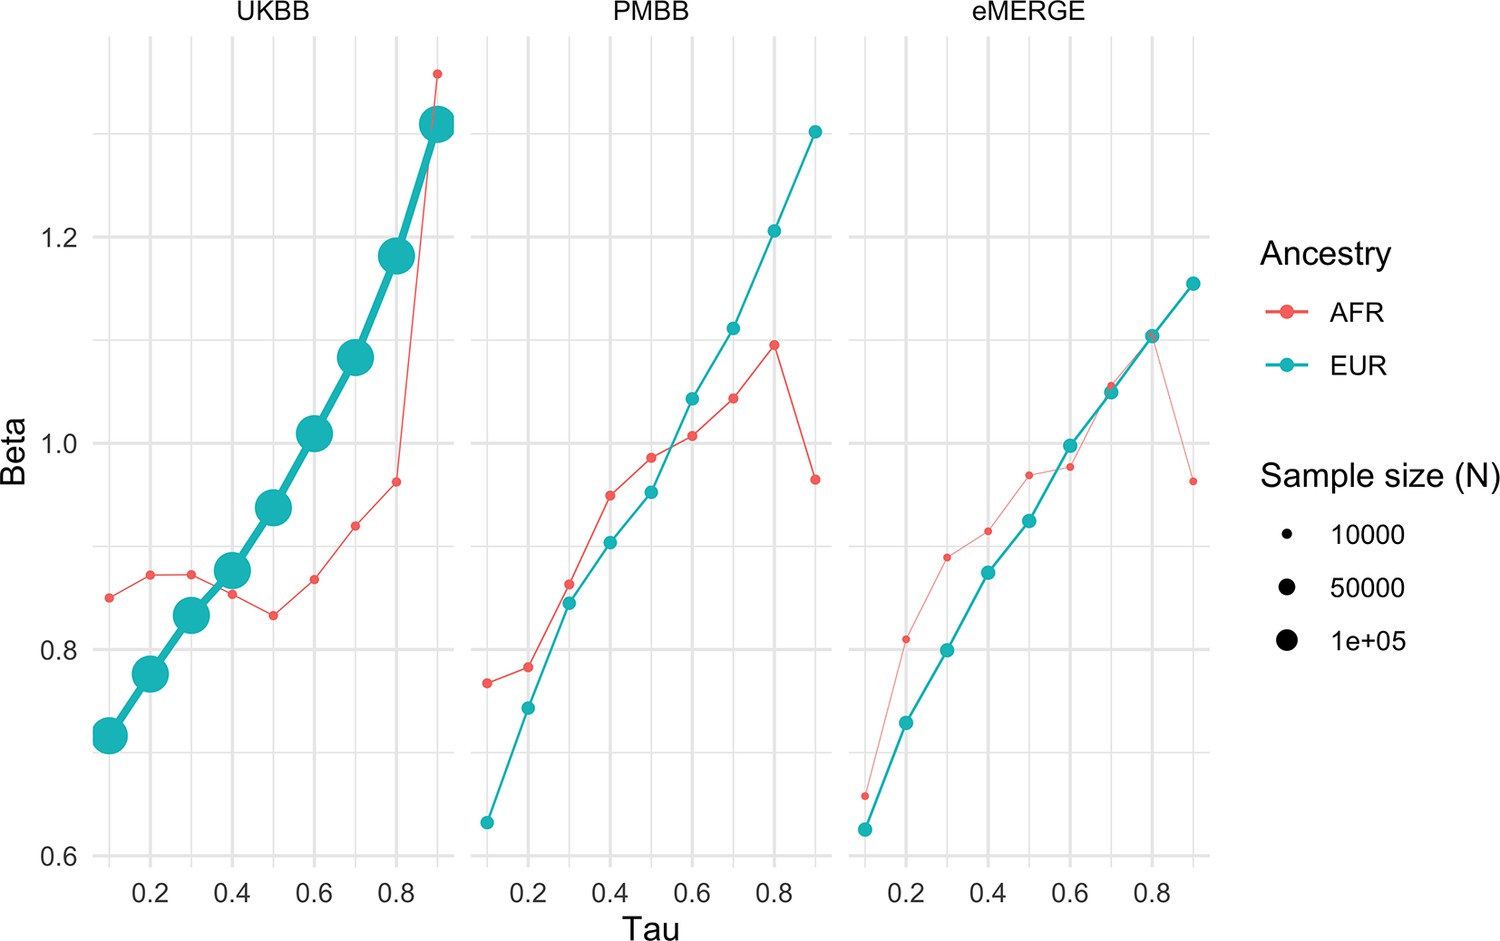
Quantile regression effects of PGSBMI (in units of log(BMI)) on log(BMI) at each decile of BMI in each cohort and ancestry.
Tau is an input parameter for quantile regression corresponding to the percentile of the BMI distribution being modeled, with lower tau values representing the lower deciles (e.g., tau = 0.1 for the 10th percentile) and higher tau values representing the upper deciles (e.g., tau = 0.9 for the 90th percentile). The effect of PGSBMI increases as BMI itself increases, suggesting that no individual covariate–PGS interaction is responsible for the nonlinear effect of PGSBMI. PGS, polygenic score; BMI, body mass index.
Figure 5—figure supplement 1

Three sets of simulated data with varying regression line slopes, showing how model R2 changes when regression line slope changes, all else being equal.
Residuals were sampled from a normal distribution (mean = 0, sigma = sqrt(π/2)) to give mean squared error = 1. 5,000 x-values were sampled for each line, uniformly distributed from 0 to 10. Despite having the same mean squared error, model R2 increases as beta increases.
Figure 5—figure supplement 2

Univariable association of PGSBMI and log(BMI) in European UKBB, separately for the bottom and top quintiles of age.
R2 is higher in younger individuals, which is partially a consequence of the larger effect (as shown in Figure 5—figure supplement 1), despite the mean squared error actually being higher.
Figure 6
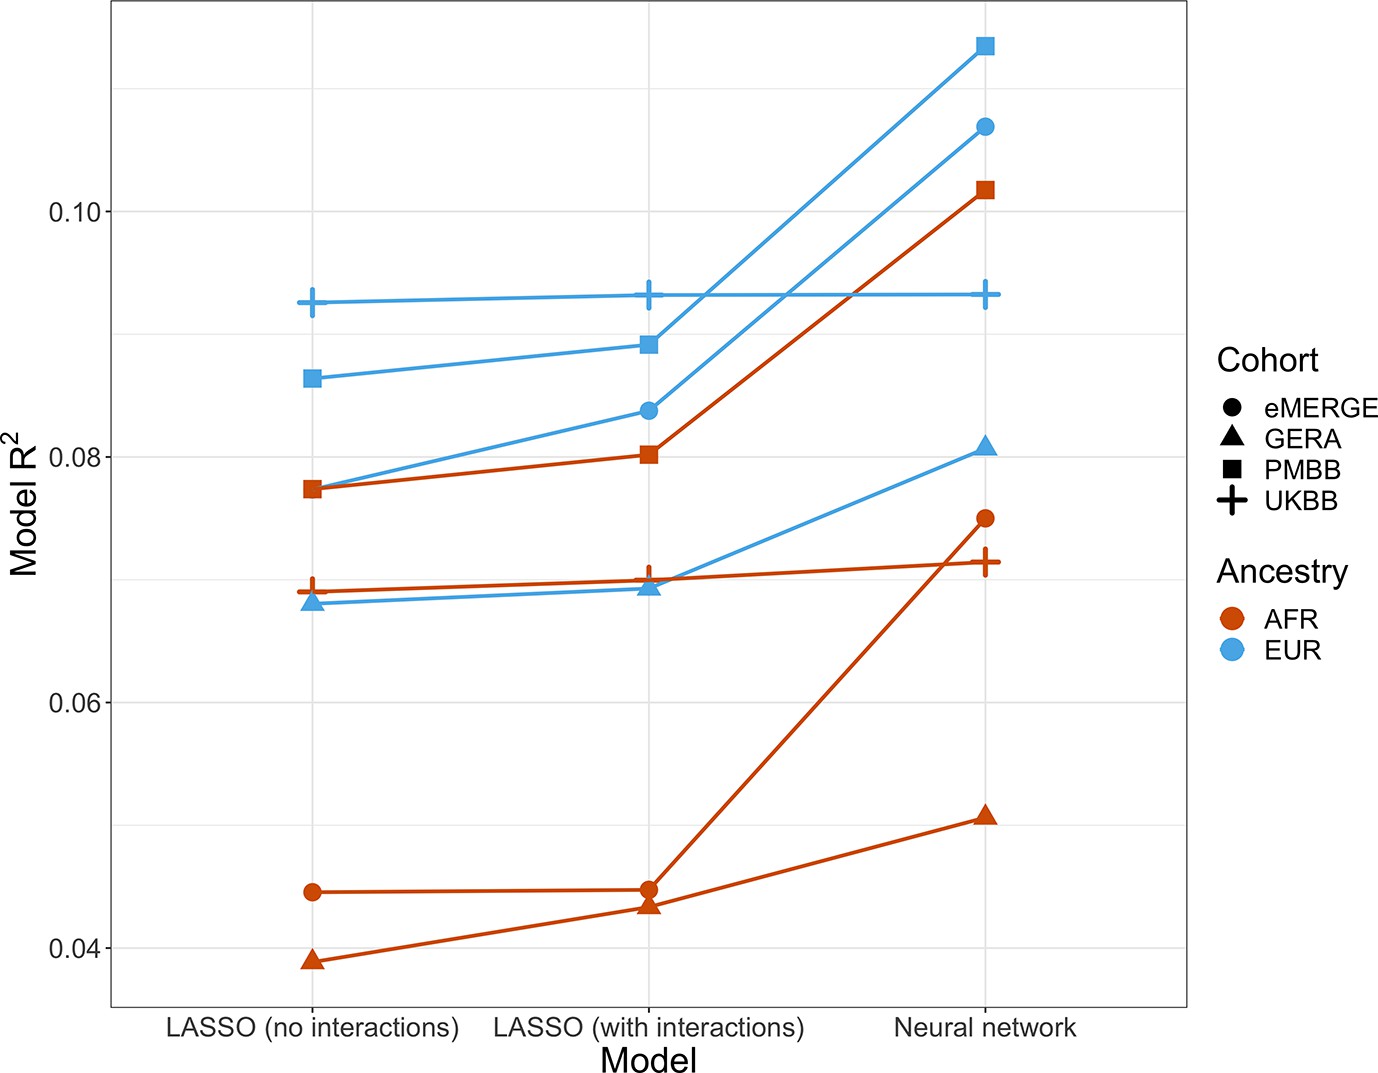
Model R2 from different machine learning models across cohorts and ancestries using age and gender as covariates (along with PGSBMI and PCs 1–5).
Across all cohorts and ancestries, LASSO with PGS–age and PGS–gender interaction terms had better average tenfold cross-validation R2 than LASSO without interaction terms, while neural networks outperformed LASSO models. PGS, polygenic score; BMI, body mass index.
Figure 7

Polygenic score (PGS) R2 based on three sets of genome-wide association studies (GWAS) setups.
‘Main effects’ were from a typical main effect GWAS, ‘GxAge’ effects were from a GWAS with an SNP–age interaction term, and ‘Age stratified’ GWAS had main effects only but were conducted in four age quartiles. PGS R2 was evaluated using two models: one with main effects only and one with an additional PGS * Age interaction term.
Tables
Table 1
Model descriptive statistics on 28 of 62 covariates, which have significant (p<0.05/62) polygenic score (PGS)–covariate interaction terms, in UK Biobank (UKBB) European ancestry (EUR).
The third column is the percentage change in PGS effect per unit change (standard deviations for continuous variables, binary variables encoded as 0 or 1) in covariate. The fifth column is the increase in model R2 with a PGS–covariate interaction term versus a main effects only model.
| Variable type | Covariate | % change in βPGS per covariate unit change | Interaction p | R2 increase with interaction term | N | |
|---|---|---|---|---|---|---|
| Continuous | HDL cholesterol | –15.29 | 1.71 × 10–96 | 0.0012 | 328,719 | |
| Total cholesterol | –12.70 | 1.64 × 10–71 | 0.00082 | 359,221 | ||
| IPAQ | –12.50 | 3.11 × 10–66 | 0.001 | 304,951 | ||
| Moderate-vigorous PA | –11.41 | 8.92 × 10–65 | 0.001 | 304,951 | ||
| Diastolic BP | 10.84 | 6.06 × 10–60 | 0.0007 | 352,804 | ||
| Townsend Index | 6.78 | 2.86 × 10–58 | 0.00089 | 376,283 | ||
| Age | –9.02 | 3.60 × 10–57 | 0.00061 | 376,729 | ||
| FVC | –9.66 | 4.69 × 10–56 | 0.0008 | 343,467 | ||
| Drink frequency/week | –19.96 | 2.62 × 10–55 | 0.0024 | 122,281 | ||
| LDL cholesterol | –9.86 | 2.63 × 10–51 | 0.00058 | 358,556 | ||
| N days vigorous PA/week | –9.37 | 2.42 × 10⁻³⁵ | 0.0007 | 299,963 | ||
| FEV1 | –7.38 | 7.15 × 10⁻³⁵ | 0.0005 | 343,544 | ||
| Mean alcohol consumption | –7.38 | 7.65 × 10⁻²² | 0.00113 | 126,756 | ||
| HbA1c | 4.63 | 5.37 × 10⁻¹⁴ | 0.0002 | 358,798 | ||
| Mean drinks/week | –7.66 | 1.01 × 10⁻¹³ | 0.0008 | 112,204 | ||
| Water intake | 4.60 | 2.97 × 10⁻¹³ | 0.00014 | 347,472 | ||
| Processed meat intake | 3.70 | 2.38 × 10⁻⁷ | 0.0002 | 376,205 | ||
| Starch mean | 5.51 | 3.15 × 10⁻⁷ | 0.00018 | 128,346 | ||
| Smoking pack years | 4.78 | 3.68 × 10⁻⁷ | 0.0002 | 114,135 | ||
| Protein mean | 4.82 | 6.52 × 10⁻⁷ | 0.00018 | 128,181 | ||
| Saturated fat mean | 4.92 | 1.23 × 10⁻⁶ | 0.00017 | 127,899 | ||
| Fat mean | 4.40 | 1.64 × 10⁻⁵ | 0.00013 | 128,092 | ||
| Saturated fat grams/week | 2.46 | 1.79 × 10⁻⁵ | 4.00 × 10⁻⁵ | 364,629 | ||
| Retinol mean | 3.77 | 3.54 × 10⁻⁴ | 9.00 × 10⁻⁵ | 126,029 | ||
| Binary | IPAQ | –12.68 | 5.30 × 10–62 | 0.0009 | 304,951 | |
| Vigorous PA/week | –20.55 | 9.07 × 10–54 | 0.0009 | 304,951 | ||
| Sex | –11.02 | 1.41 × 10⁻²⁴ | 0.00025 | 376,729 | ||
| Diabetes | 27.19 | 1.83 × 10⁻⁷ | 0.0004 | 375,903 | ||
-
BP = blood pressure, PA = physical activity, FVC = forced vital capacity, FEV1 = forced expiratory volume in 1 s, HDL = high-density lipoprotein, LDL = high-density lipoprotein, IPAQ = International Physical Activity Questionnaire.
Additional files
-
MDAR checklist
- https://cdn.elifesciences.org/articles/88149/elife-88149-mdarchecklist1-v1.docx
-
Supplementary file 1
Description.
(a) Cohort descriptives. (b) All exposures and any transformations or filters. (c) R2 differences across quintiles and binary variables. (d) Model descriptives on PRS–covariate interaction models. (e) Model descriptives on main effects. GERA correlations between main effects, interaction effects, and R2 differences. Pearson R weighted by sample size are in bottom left, p-values in top right. (f) Pearson R weighted by sample size are in bottom left, p-values in top right. (g) Machine learning model descriptives. (h) Pruning and thresholding R2 values and parameters for GxAge PGS. (i) Parameters used for PRS-CSx (default).
- https://cdn.elifesciences.org/articles/88149/elife-88149-supp1-v1.xlsx
Download links
A two-part list of links to download the article, or parts of the article, in various formats.
Downloads (link to download the article as PDF)
Open citations (links to open the citations from this article in various online reference manager services)
Cite this article (links to download the citations from this article in formats compatible with various reference manager tools)
Risk factors affecting polygenic score performance across diverse cohorts
eLife 12:RP88149.
https://doi.org/10.7554/eLife.88149.3


