ICAM-1 nanoclusters regulate hepatic epithelial cell polarity by leukocyte adhesion-independent control of apical actomyosin
- Centro de Biologia Molecular Severo Ochoa, CSIC-UAM, Spain
- William Harvey Research Institute, Faculty of Medicine and Dentistry, Queen Mary University of London, United Kingdom
- Centro Nacional de Biotecnologia (CSIC), Spain
- Facultat de Ciències, Tecnologia i Enginyeries, Universitat de Vic – Universitat Central de Catalunya (UVic-UCC), Spain
- Servicio de Anatomía Patológica, Hospital Universitario de Salamanca, Spain
- Molecular Biology Unit, Hospital Universitario de la Princesa, Spain
- Instituto de Investigación Sanitaria Hospital Universitario de La Princesa (IIS-Princesa), Spain
- Centro de Investigación Biomédica en Red de Enfermedades Hepáticas y Digestivas (CIBERehd), Spain
- Department of Cellular Biology, Universidad Complutense de Madrid, Spain
- Max Planck Institute of Molecular Cell Biology and Genetics, Germany
Figures
Figure 1 with 1 supplement
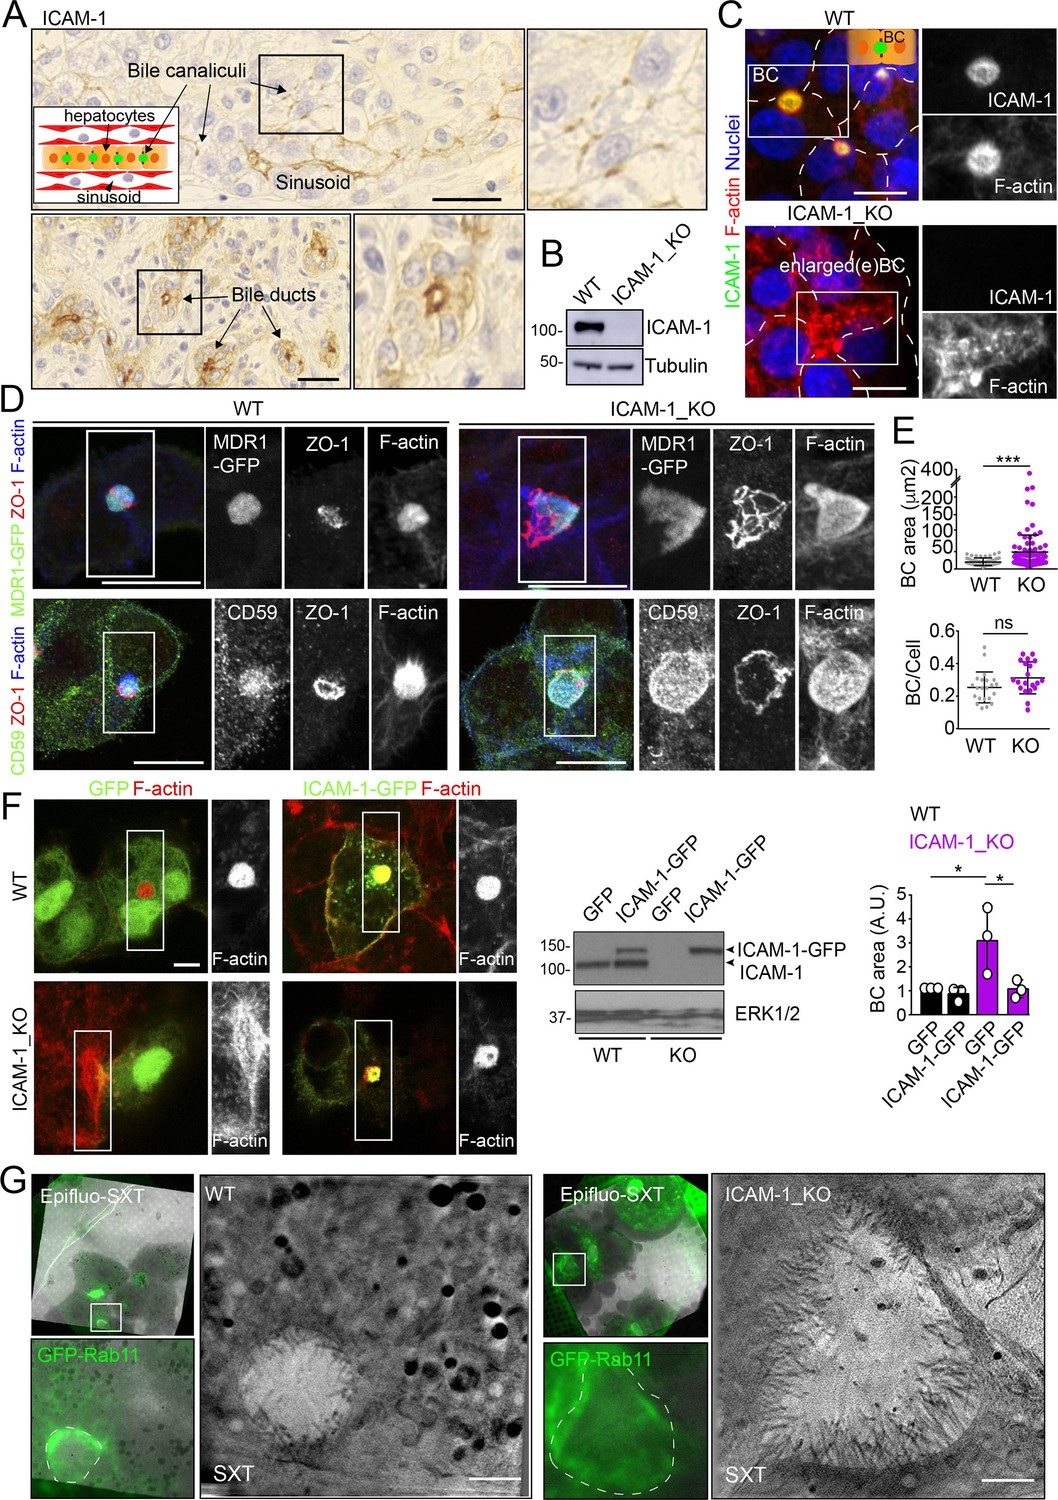
Intercellular adhesion molecule-1 (ICAM-1) regulates the size of apical bile canaliculi (BCs) in polarized HepG2 cells.
(A) ICAM-1 concentrates in bile canaliculi (top images) and bile ducts (bottom images) from polarized hepatocytes and cholangiocytes, respectively (arrows), and in sinusoids in human livers from healthy donors. Right images show a twofold enlargement of the boxed areas in the left images. Inset cartoon represents the basic organization of polarized hepatocytes at the hepatic lobule. Their apical membranes form bile canaliculi and their basolateral membranes face the sinusoids. Scale bars, 10 μm (B) CRISPR-CAS9-mediated editing of the ICAM1 gene (ICAM-1_KO) in HepG2 cells. Several clones were selected and pooled to prevent clonal variations. WT, parental wild-type cells. (C, D) Polarized human epithelial HepG2 cells form BCs. Control WT and ICAM-1_KO HepG2 cells were cultured on coverslips for 72 hr, fixed and stained for F-actin and ICAM-1, which concentrate in apical BCs (C), for ZO-1 and F-actin in cells expressing MDR1-GFP (D, top images) and for CD59, ZO1 and F-actin (D, bottom images). Scale bars, 20 μm. (E) Plots represent the mean ± SD. BC area increased from 18.9 ± 1.1 μm2 in WT cells to 51.2 ± 7.2 μm2 in ICAM-1_KO cells. ***p<0.001; ns, not statistically significant. BC area and frequency were quantified in at least 70 cells per experiment. Nuclei were stained with DAPI. (F) WT and ICAM-1_KO cells were transfected with GFP or ICAM-1-GFP expression plasmids, grown for 48 hr, and processed for immunofluorescence and confocal microscopy analysis (left images) or lysed for western blot analysis (central images). Single channels from the boxed areas are enlarged on the right of the corresponding image. The right panel shows the quantification of BC areas and represents the mean ± SD. * p<0.05. n = 3. Scale bar, 10 μm. (G) Cryo-SXT of WT and ICAM-1_KO cells stably expressing GFP-Rab11 to localize BCs. Cells were cultured on holey carbon grids for TEM for 48–72 hr. BCs were identified in live cells with an epifluorescence microscope (dotted lines) and immediately vitrified and cryopreserved for cryo-soft X-ray tomography (cryo-SXT). SXT images show a slice of the reconstructed tomogram from the boxed areas in the correlative Epifluo-SXT images. GFP-Rab11 panels display the epifluorescence images of the same area. Scale bars, 2 μm.
-
Figure 1—source data 1
Original file for the western blot analysis in Figure 1B.
- https://cdn.elifesciences.org/articles/89261/elife-89261-fig1-data1-v1.zip
-
Figure 1—source data 2
PDF containing Figure 1B and original scans of the relevant western blot analysis (anti-ICAM-1 and anti-tubulin), with the highlighted bands squared.
- https://cdn.elifesciences.org/articles/89261/elife-89261-fig1-data2-v1.zip
-
Figure 1—source data 3
Original file for the western blot analysis in Figure 1F.
- https://cdn.elifesciences.org/articles/89261/elife-89261-fig1-data3-v1.zip
-
Figure 1—source data 4
PDF containing Figure 1F and original scans of the relevant western blot analysis (anti-ICAM-1 and anti-ERK), with the highlighted bands squared.
- https://cdn.elifesciences.org/articles/89261/elife-89261-fig1-data4-v1.zip
Figure 1—figure supplement 1
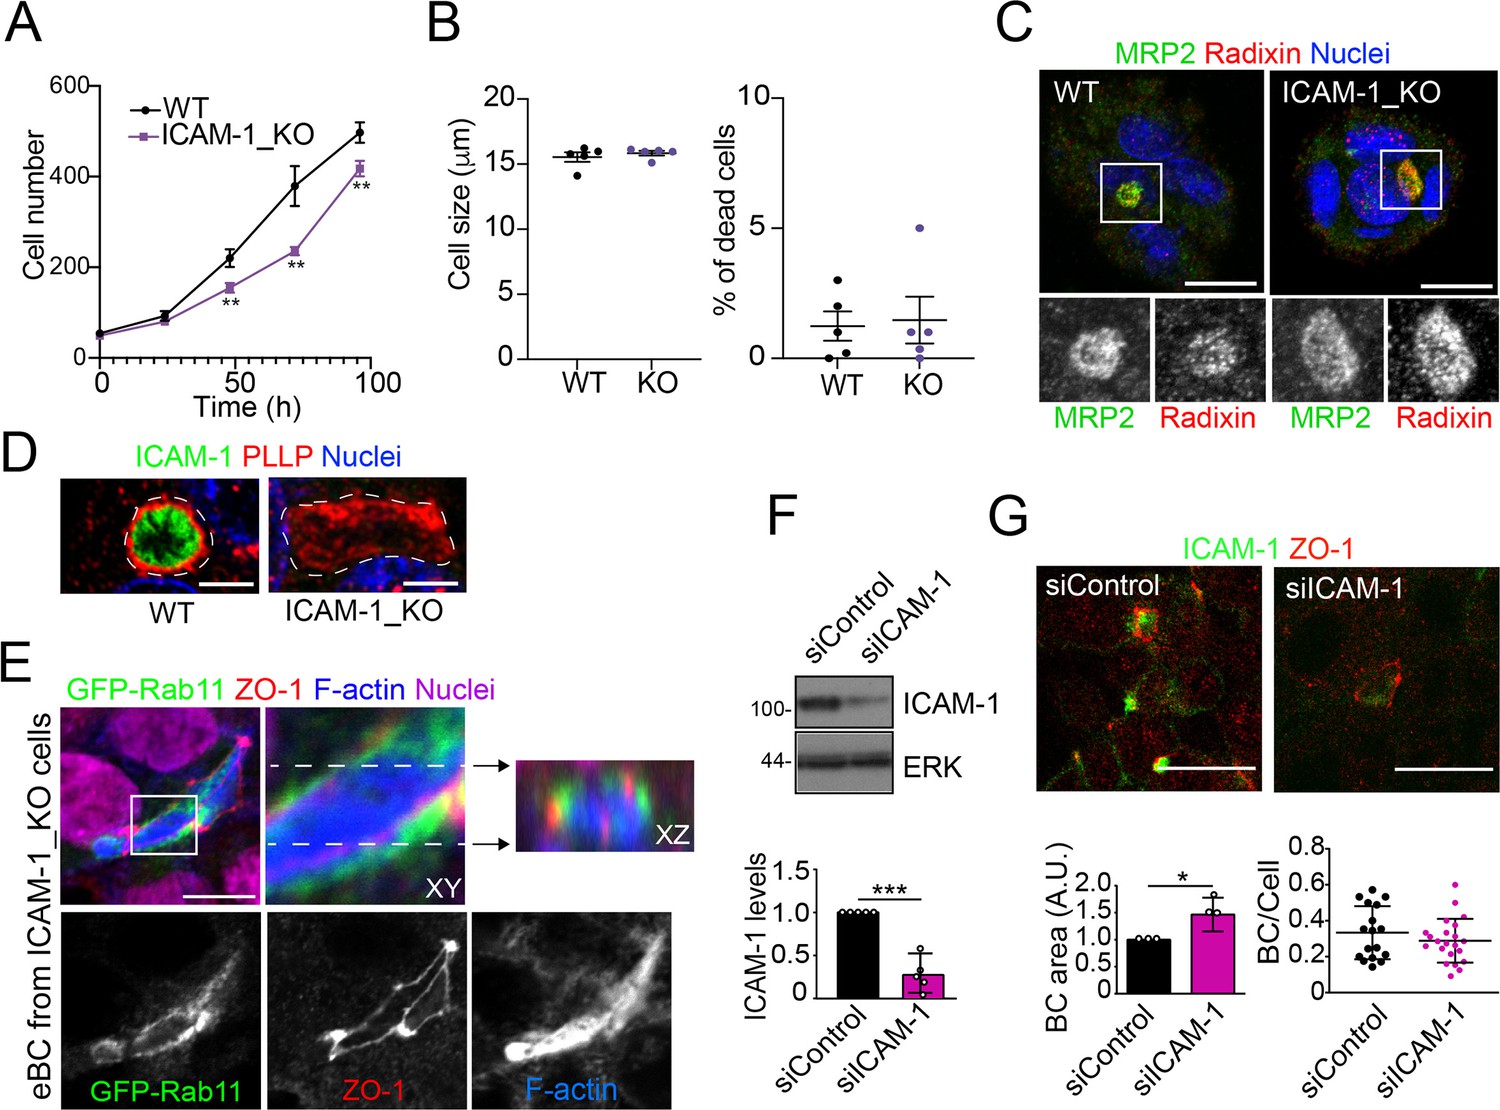
Effect of ICAM-1 depletion on cell apicobasal polarity, proliferation, size and survival.
(A) Cells were seeded at very low density and counted for 96 hr. Bars represent the SD of the mean. n = 3. ** p<0.01. (B) In each cell passage, cell density, size (left graph), and percentage of dead cells (right graph) were analyzed in a cell counter Countess 3 (Invitrogen). Bars represent the SD of the mean. n = 5. (C) Control WT and ICAM-1_KO HepG2 cells were cultured on coverslips for 72 hr, fixed with methanol at –20°C for 5 min, and stained for MRP2 and radixin. Bottom images are single-channel images of the squared areas. Scale bars, 10 μm. (D) Control WT and ICAM-1_KO HepG2 cells were cultured on coverslips for 72 hr, fixed with formalin 10% at room temperature for 20 min, and stained for plasmolipin/PLLP and F-actin. Scale bars, 5 μm. (E) Image of ICAM-1_KO HepG2 cells stably expressing GFP-Rab11 and stained for the indicated proteins (top-left panel), in which the boxed area has been threefold enlarged and its XY and XZ projections displayed in the top-center and top-right panels, respectively. Bottom panels show the top-left image splitted into its three channels. Scale bar, 10 μm. (F, G) HepG2 cells were transfected with siRNA control (siControl) or with siRNA targeting ICAM-1 (siICAM-1). Cells were lysed and analyzed by western blot with the indicated antibodies (F) or fixed, immunostained with the indicated antibodies and analyzed by confocal microscopy (G) Scale bar, 20 μm. (F) Quantification of ICAM-1 expression levels. A.U., arbitrary units. n = 5. (G) Quantification of BC area (left graph) and frequency (BC/cell, right graph). n = 3. * p<0.05; *** p<0.001.
-
Figure 1—figure supplement 1—source data 1
Original file for the western blot analysis in Figure 1—figure supplement 1F (anti-ICAM-1 and anti-ERK).
- https://cdn.elifesciences.org/articles/89261/elife-89261-fig1-figsupp1-data1-v1.zip
-
Figure 1—figure supplement 1—source data 2
PDF containing Figure 1—figure supplement 1F and original scans of the relevant western blot analysis (anti-ICAM-1 and anti-ERK), with the highlighted bands squared.
- https://cdn.elifesciences.org/articles/89261/elife-89261-fig1-figsupp1-data2-v1.zip
Figure 2 with 1 supplement
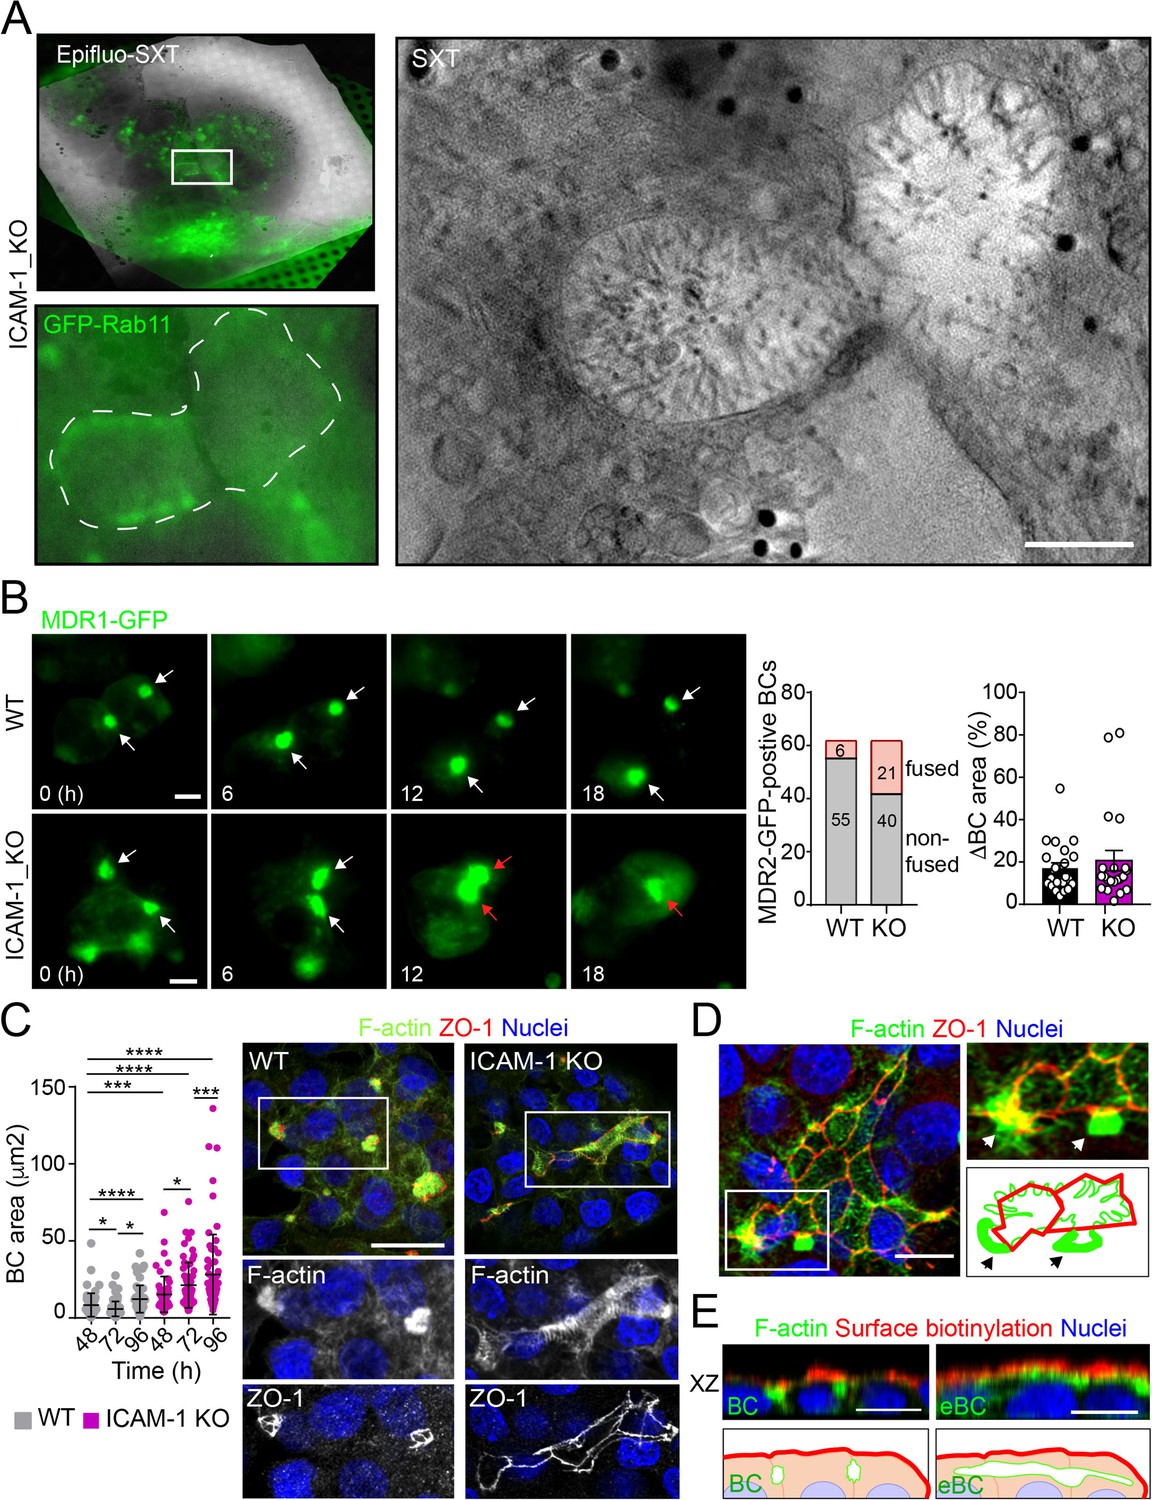
Intercellular adhesion molecule-1 (ICAM-1) regulates bile canaliculi (BC) dynamics in polarized HepG2 cells.
(A) Correlative cryo-soft X-ray tomography (cryo-SXT) of ICAM-1_KO cells stably expressing GFP-Rab11 showing two fusing BCs. The SXT image shows a slice of the reconstructed tomogram from the boxed area in the correlative Epifluo-SXT image (top left). The GFP-Rab11 panel displays the epifluorescence image of the same area. Scale bar, 2 μm. (B) HepG2 cell stably expressing MDR1-GFP were subjected to time-lapse fluorescence microscopy analysis. White arrows point at MDR1-GFP-positive BCs. Red arrows point at two fusing MDR-1-GFP-positive BCs. Central panel shows the quantification of BCs in which fusing events were observed during the time-lapse microscopy assays. Right panel quantifies variations in BC area between consecutive frames, expressed as positive values. Scale bars, 10 μm (C) WT and ICAM-1_KO hepatic cells were cultured for at least 96 hr, fixed and stained for the indicated proteins. Scale bar, 20 μm. The left scatterplot shows the quantification of BC area of cells cultured for the indicated periods and represents the mean ± SD. *p<0.05, ***p<0.001, ****p<0.0001. 50 BCs per experiment, n = 3. (D) Distribution of F-actin and ZO-1 in ICAM-1_KO cells cultured for 96 hr suggests coalescence of small BCs into enlarged (e)BC. Enlarged areas show F-actin-enriched BCs (arrows) in contact with massive eBCs. Bottom-right images show a graphical representation of the top-right images. Scale bar, 10 μm. (E) ICAM-1_KO cells were grown for 96 hr and incubated with sulfo-NHS-biotin for 30 min at 4°C, washed, fixed, and permeabilized. Biotinylated surface proteins were detected with TRITC-conjugated streptavidin. XZ stack projections are shown to visualize the relative localization of surface proteins, accessible to sulfo-NHS-biotin from the extracellular milieu, and F-actin-rich BCs (left images) and eBC (right images), which are sealed and not accessible from the extracellular milieu. Nuclei were stained with DAPI. Bottom images show a graphical representation of the top images. Scale bars, 10 μm.
Figure 2—figure supplement 1
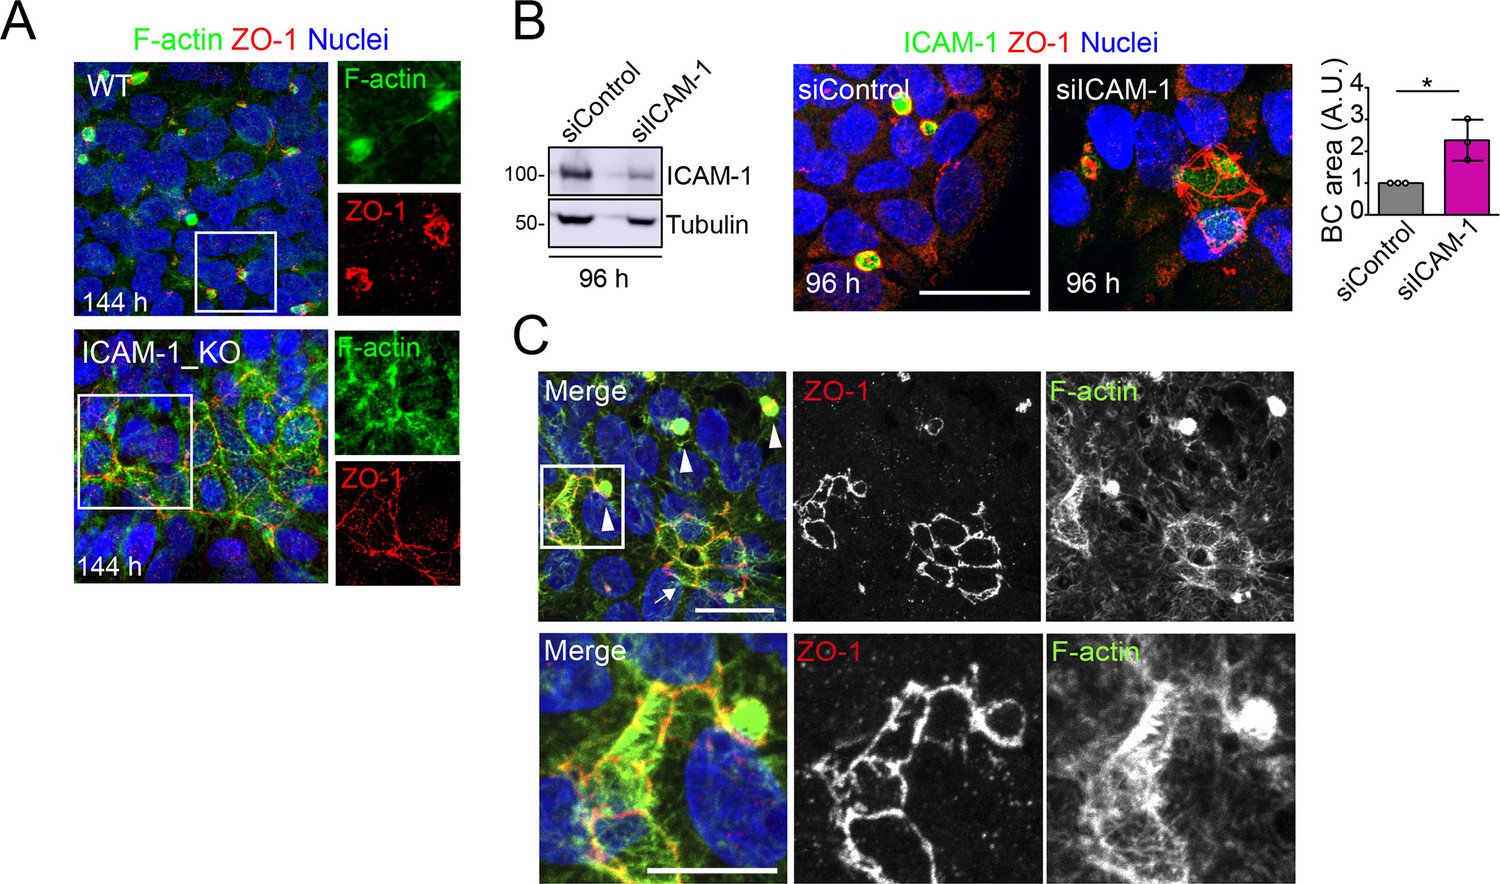
Long-term ICAM-1 depletion induces massively enlarged BCs.
(A) WT and ICAM-1_KO HepG2 cells were cultured for 6 d, fixed and stained for ZO-1 and F-actin. Right images show enlargements of the boxed areas in the left images. Scale bar, 20 μm. (B) HepG2 cells were transfected with siRNA control or with siRNA targeting ICAM-1 and cultured for 96 hr. Cells were lysed and subjected to western blot analysis with the indicated antibodies (left panels) or fixed and analyzed by immunofluorescence and confocal microscopy (central images). Tubulin is shown as a loading control. The right graph shows the quantification of bile canaliculi (BC) area. Scale bar, 20 μm. Bars represent the mean ± SD. n = 3. *p<0.05. A.U., arbitrary units. Nuclei were stained with DAPI. (C) Distribution of F-actin and ZO-1 in ICAM-1_KO cells cultured for 96 hr suggests coalescence of small BCs into enlarged BC (eBC). Top images: arrowheads point to BCs and the arrow to an eBC. Bottom images corresponded to twofold enlargement of the top squared area and show an F-actin-enriched spherical BC in contact with a massive eBC. Scale bars. Top, 20 μm; bottom, 10 μm. . Nuclei were stained with DAPI.
-
Figure 2—figure supplement 1—source data 1
Original file for the western blot analysis in Figure 2—figure supplement 1B (anti-ICAM-1 and anti-tubulin).
- https://cdn.elifesciences.org/articles/89261/elife-89261-fig2-figsupp1-data1-v1.zip
-
Figure 2—figure supplement 1—source data 2
PDF containing Figure 2—figure supplement 1B and original scans of the relevant western blot analysis (anti-ICAM-1 and anti-tubulin), with the highlighted bands squared.
- https://cdn.elifesciences.org/articles/89261/elife-89261-fig2-figsupp1-data2-v1.zip
Figure 3
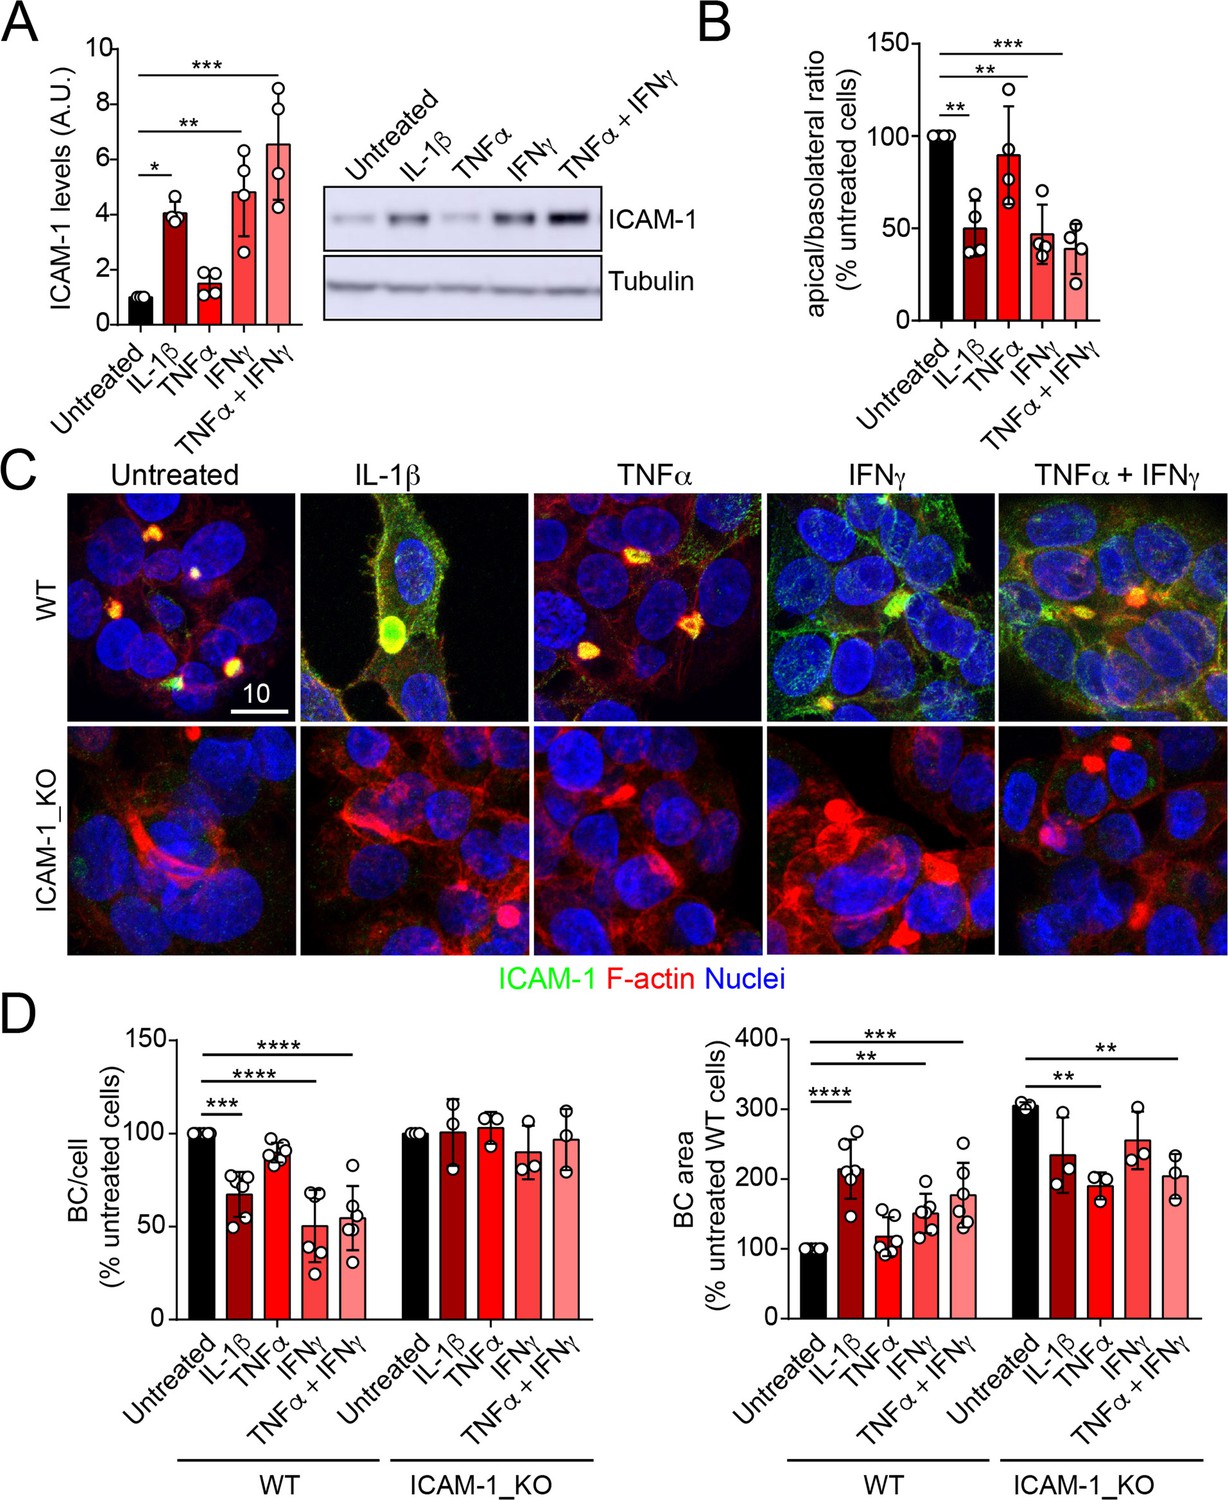
Upregulation of intercellular adhesion molecule-1 (ICAM-1) expression in response to inflammatory cytokines reduces bile canaliculi (BC) frequency.
(A–D) Polarized hepatic epithelial cells were stimulated or not for 48 hr with 50 ng/ml TNF-α, 15 ng/ml IL-1β, and IFN-γ 1000 U/ml as indicated. (A) Cells were lysed and ICAM-1 expression levels detected by western blot. Tubulin was blotted as a loading control. (B–D) Cells were fixed and stained for ICAM-1, F-actin, and nuclei. (B) Basolateral-to-apical ratio of ICAM-1 staining intensities. (C) Representative confocal images of the effect of cytokine treatment. Scale bar, 10 μm. (D) Quantification of BCs (left) and BC area (right). Bars represent the mean ± SD. n > 3. *p<0.05, **p<0.01, ***p<0.001, ****p<0.0001.
-
Figure 3—source data 1
Original file for the western blot analysis in Figure 3A.
- https://cdn.elifesciences.org/articles/89261/elife-89261-fig3-data1-v1.zip
-
Figure 3—source data 2
PDF containing Figure 3A and original scans of the relevant western blot analysis (anti-ICAM-1 and anti-tubulin), with the highlighted bands squared.
- https://cdn.elifesciences.org/articles/89261/elife-89261-fig3-data2-v1.zip
Figure 4 with 1 supplement
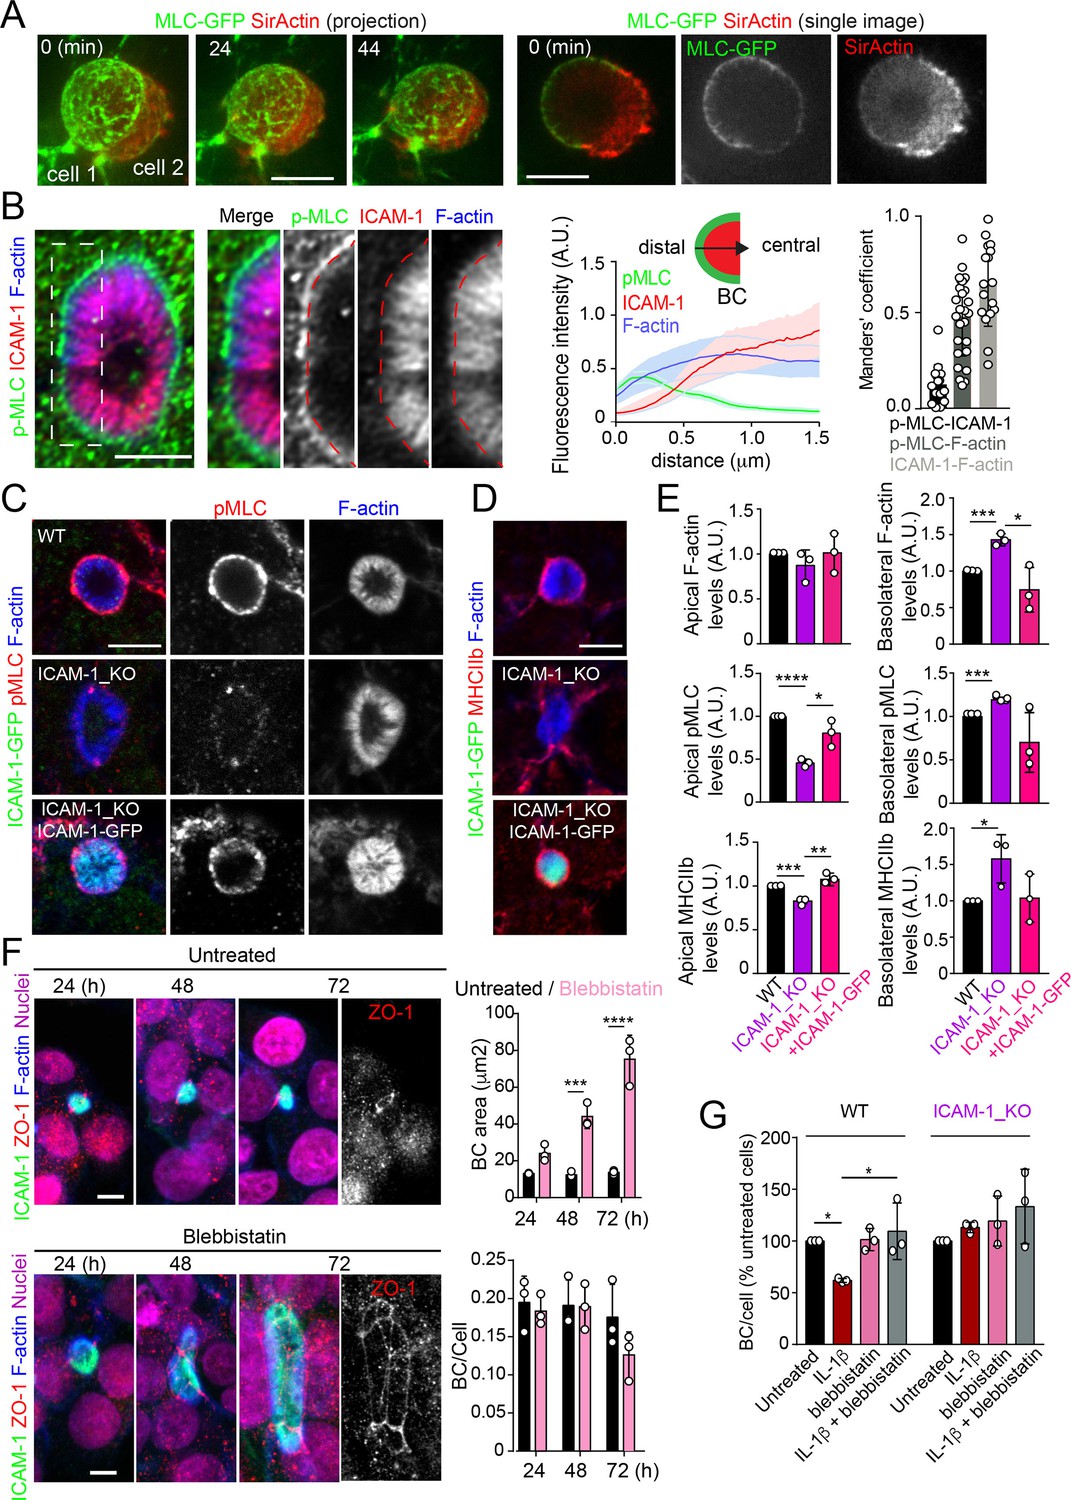
Intercellular adhesion molecule-1 (ICAM-1) controls canalicular membrane expansion by regulating a distal canalicular actomyosin network.
(A, B) Bile canaliculi (BC) contain a ring of actomyosin. (A) Polarized HepG2 cells expressing GFP-MLC were incubated with SirActin for 2 hr and subjected to time-lapse confocal microscopy. Left images show the image projection of the indicated frames. Right images show a single image of the stack corresponding to t = 0 of the same time-lapse video. (B) Polarized hepatic epithelial cells were cultured on coverslips for 72 hr, fixed and stained for F-actin, ICAM-1, and phosphorylated myosin light chain (pMLC) (left images). Central panel: relative distribution of the staining intensity for the indicated proteins, starting from the distal parts of BCs, which contain actomyosin, toward the centers of the BCs, which contain the microvillar tips. Note that p-MLC staining is mostly distal, F-actin distributed all along the profile, and ICAM-1 is mostly found in microvilli. Right panel: Manders’ analysis for the indicated pairs of staining. Scale bar, 3 μm. (C, D) Control WT, ICAM-1_KO, and ICAM-1_KO cells expressing ICAM-1-GFP were cultured on coverslips for 72 hr, fixed and stained for pMLC and F-actin (C) and for F-actin and non-muscle myosin heavy chain-IIb (MHCIIb) (D). Scale bar, 5 μm. (E) Quantification of relative apical and basolateral levels of F-actin, pMLC, and MHCIIb detected in (C) and (D). n = 3. At least 20 BCs (apical) or 20 cells (basolateral) were quantified in each experiment. (F) WT cells were exposed or not to 10 μM of the myosin inhibitor blebbistatin for the indicated times. Scale bar, 10 μm. Plots show the quantification of the effect of blebbistatin on BC size (top) and BC frequency (bottom). n = 3. At least 20 BCs were quantified in each experiment. (G) WT and ICAM-1_KO cells were cultured, stimulated with IL-1β, fixed and stained as in Figure 3. When indicated, cells were incubated with 10 μM blebbistatin for the last 40 hr. BC frequency was quantified. Quantifications represent the mean ± SD. n > 3. *p<0.05, **p<0.01, ***p<0.001, ****p<0.0001. Except otherwise indicated, scale bars correspond to 5 μm.
Figure 4—figure supplement 1
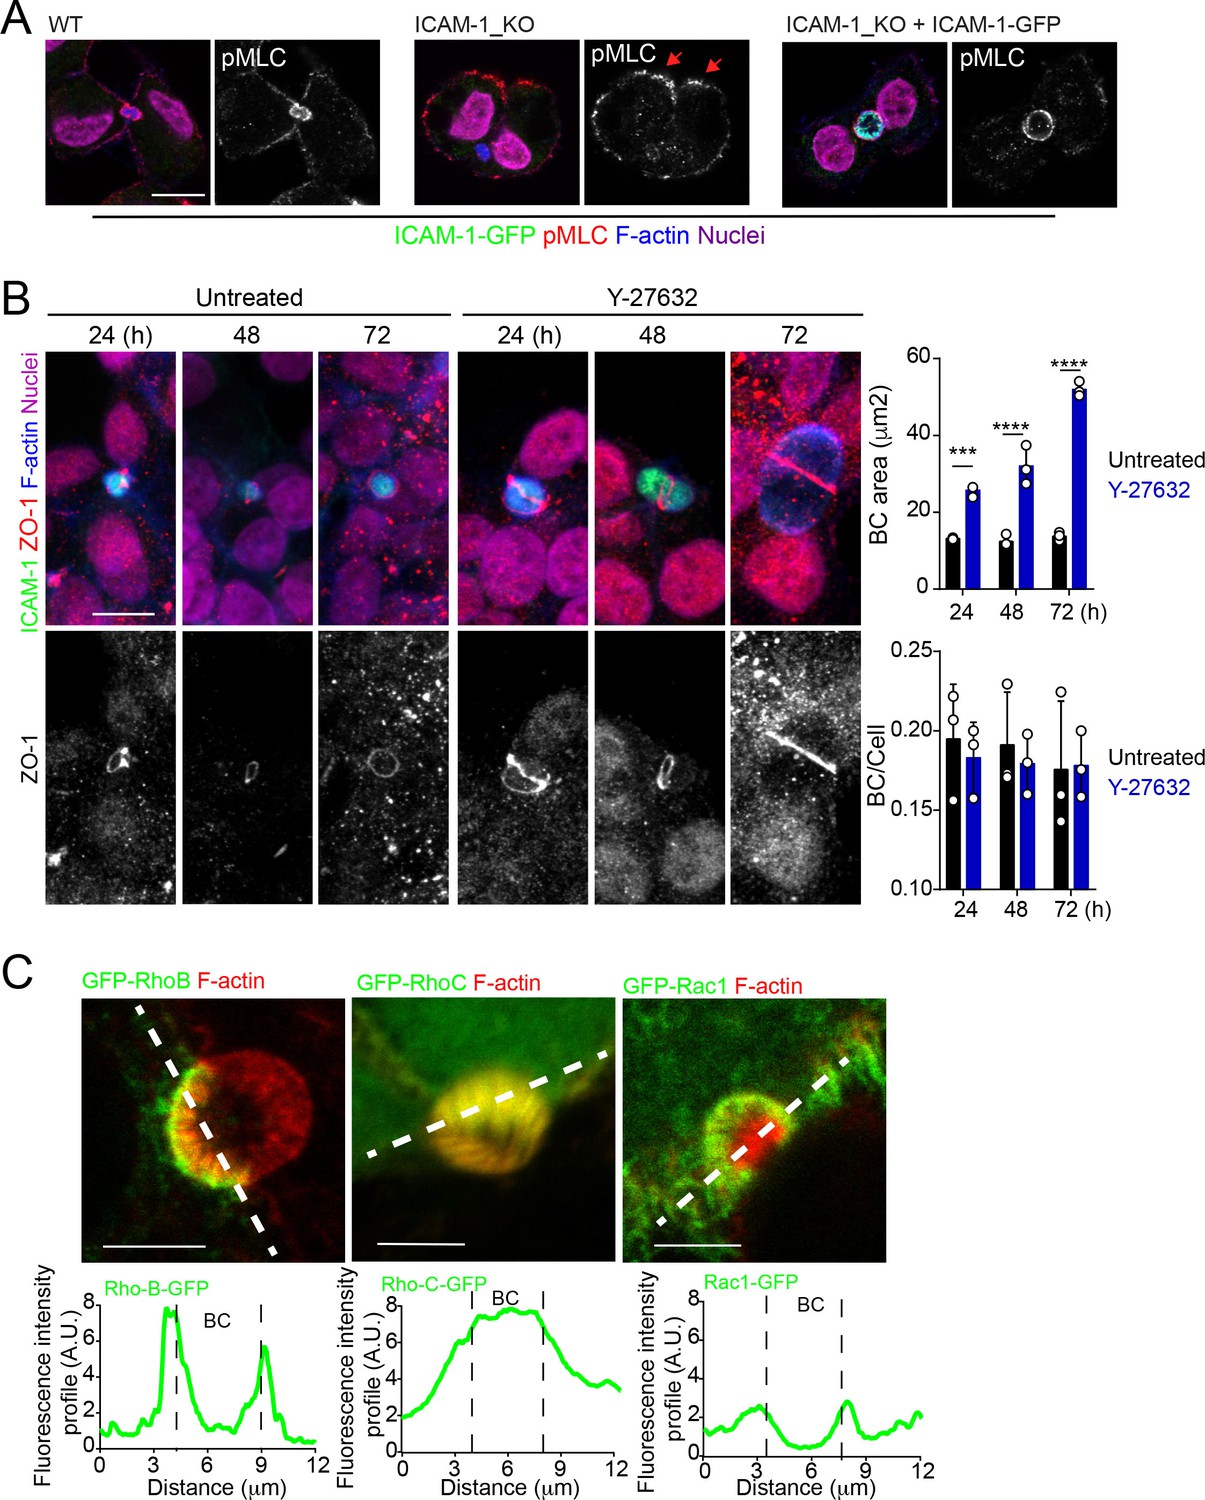
ROCK inhibition phenocopies the effect of ICAM-1 depletion and myosin-II inhibition on BC size.
Canalicular localization of RhoB and RhoC GTPases .(A) Representative images of cells quantified in Figure 4D. (B) HepG2 cells were exposed or not to 5 μM of the ROCK inhibitor Y27632 for the indicated times. Scale bars, 10 μm. Graphs show the quantification of the effect of Y27632 on bile canaliculi (BC) area (top) and BC frequency (BC/cell, bottom). At least 20 BCs were quantified in each of the three experiment. (C) Cells were transfected and the expression of the indicated GFP-Rho proteins analyzed 24 hr post-transfection. The GFP intensity profiles along the dotted lines are shown in the bottom graphs. ***p<0.001, ****p<0.0001. Scale bars, 5 μm.
Figure 5 with 1 supplement
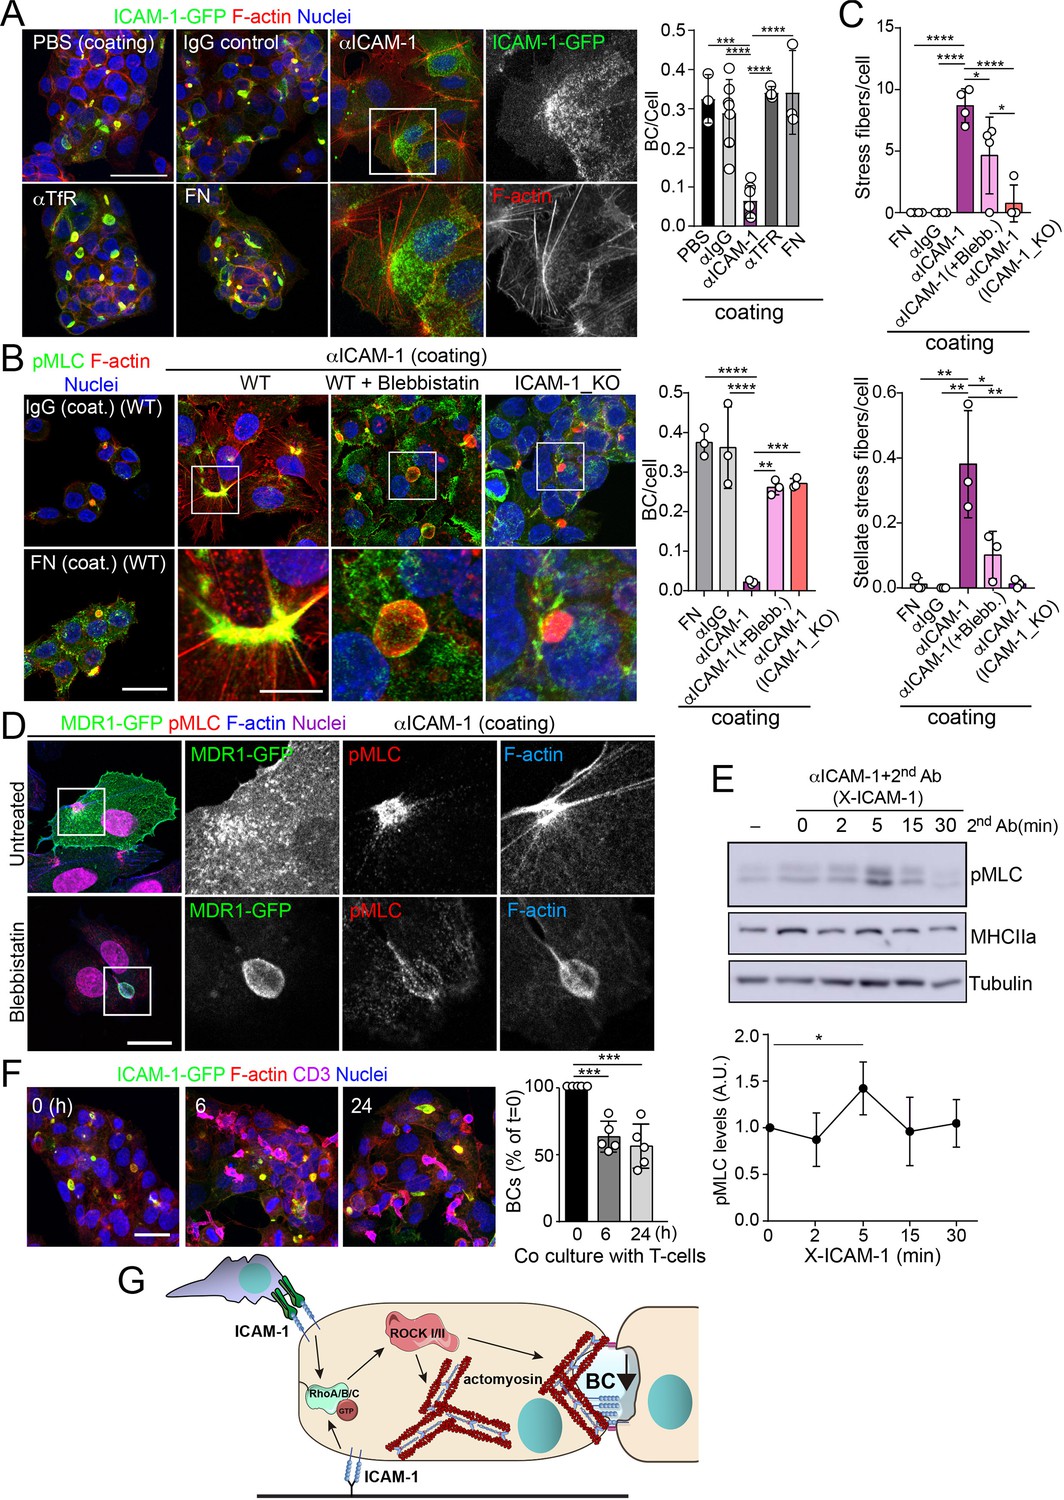
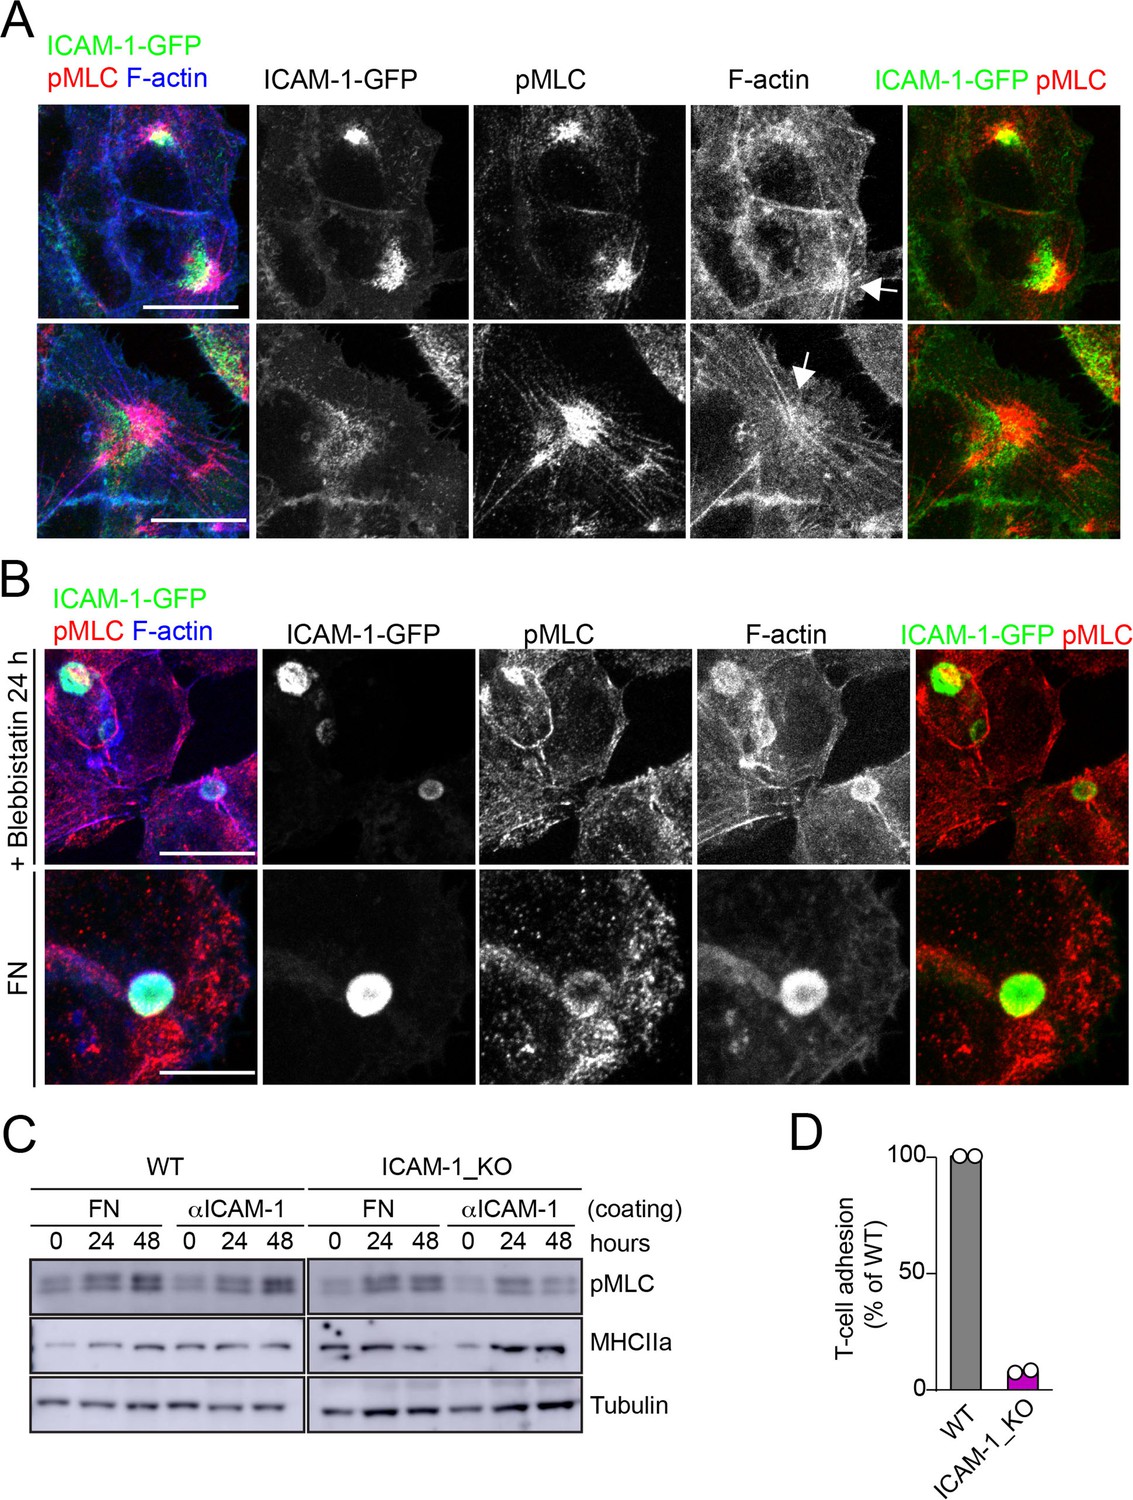
Intercellular adhesion molecule-1 (ICAM-1) signals to actomyosin, thereby reducing apicobasal polarity.
(A) Surface ICAM-1 engagement reduces bile canaliculi (BC) morphogenesis. ICAM-1-GFP HepG2 cells were cultured for 24 hr on coverslips precoated with the indicated antibodies (α), IgG control or fibronectin (FN). Cells were fixed and stained for F-actin to quantify the amount of BCs per cell (right). Nuclei were stained with DAPI. Bars represent the mean ± SD. n = 3. Scale bar, 50 μm. TfR, transferrin receptor. (B) Impairment of BC morphogenesis depends on myosin-II. ICAM-1-GFP cells were cultured for 24 hr as in (A) on coverslips precoated with the indicated proteins. Cells were seeded for 4 hr and incubated with blebbistatin when indicated (blebb.). As a control, ICAM-1_KO cells were plated in parallel on ICAM-1. Cells were fixed, stained for F-actin and pMLC, and the amount of BCs per cell was quantified (right graph). Nuclei were stained with DAPI. Bottom images are enlargements of the boxed areas in the top images showing cells plated on αICAM-1 coverslips. Bars represent the mean ± SD. n = 3. Scale bar, 20 μm; enlarged boxed area 10 μm. Note that blebbistatin inhibits myosin but does not reduce pMLC levels, as previously described. Scale bar, 10 μm. (C) Quantification of the stress fibers (top) and stellate stress fibers (bottom) in cells plated on the coverslips precoated with the indicated proteins as in (B). n = 4. (D) Stellate stress fibers concentrate F-actin and pMLC but not the canalicular marker MDR1. Hepatic epithelial cells expressing MDR1-GFP were plated on coverslips precoated with FN or anti-ICAM-1 antibody (αICAM-1). Scale bar, 15 μm. (E) Effect of ICAM-1 clustering (X-ICAM-1) on MLC phosphorylation. Cells were cultured for 24 hr on plastic dishes and then were sequentially incubated with anti-ICAM-1 antibody (first Ab) for 30 min and a specific secondary antibody (second) for the indicated times. Cells were lysed and proteins were detected by western blot. Bottom plot shows the quantification of pMLC levels upon receptor clustering. (F) Hepatic epithelial cells stably expressing ICAM-1-GFP were cultured for 72 hr and then incubated with T-lymphocytes (one T cell: two hepatic cells) for the indicated periods. The plot shows the percentage of BCs quantified prior to exposure to T-lymphocytes (0 hr). Bars represent the mean ± SD. n = 5. *p<0.05, **p<0.01, ***p<0.001, ****p<0.0001. Scale bar, 20 μm. (G) Current model for the effect of ICAM-1 signaling on hepatic epithelial cells. ICAM-1 engagement signals through the Rho-ROCK axe and increases the formation of actomyosin fibers that prevent the formation of actomyosin-regulated BC structures. In polarized hepatic cells, leukocyte-mediated engagement of ICAM-1 activates pericanalicular actomyosin, which induces contraction at BCs, thereby reducing their frequency.
-
Figure 5—source data 1
Original file for the western blot analysis in Figure 5E (anti-pMLC).
- https://cdn.elifesciences.org/articles/89261/elife-89261-fig5-data1-v1.zip
-
Figure 5—source data 2
Original file for the western blot analysis in Figure 5E (anti-MLC).
- https://cdn.elifesciences.org/articles/89261/elife-89261-fig5-data2-v1.zip
-
Figure 5—source data 3
Original file for the western blot analysis in Figure 5E (anti-tubulin).
- https://cdn.elifesciences.org/articles/89261/elife-89261-fig5-data3-v1.zip
-
Figure 5—source data 4
PDF containing Figure 5E and original scans of the relevant western blot analysis (anti-pMLC, anti-MLC, and anti-tubulin), with the highlighted bands squared.
- https://cdn.elifesciences.org/articles/89261/elife-89261-fig5-data4-v1.zip
Figure 5—figure supplement 1
Localization of ICAM-1 in membrane regions close to stellate stress fibers.
Effect of cell adhesion to FN on apicobasal polarity and myosin-II activation.(A) Surface intercellular adhesion molecule-1 (ICAM-1) engagement generates stellate stress fibers that concentrate pMLC and ICAM-1, although in different cellular domains. ICAM-1-GFP HepG2 cells were cultured for 24 hr on coverslips precoated with anti-ICAM-1. Cells were fixed and stained for the indicated proteins. Two representative images of stellate stress fibers (arrows) and their corresponding splitted channels are shown. (B) Cells on coverslips coated with anti-ICAM-1 were incubated with 10 μm blebbistatin before fixation (top). In parallel, cells were plated on FN-coated coverslips for 24 hr (bottom). Cells were fixed and stained as in (A) Scale bars, 10 μm. (C) WT and ICAM_KO cells were seeded on plates precoated with FN or anti (α)-ICAM-1 antibody for the indicated times, lysed and subjected to western blot to detect the indicated proteins. (D) CD3-positive T cells were quantified in experiments performed as in Figure 5F. WT and ICAM-1_KO cells were cultured for 72 hr and incubated with T-lymphocytes for 6 hr. The graph shows the percentage of T-cell adhesion with respect to WT cells in two different experiments.
-
Figure 5—figure supplement 1—source data 1
Original file for the western blot analysis in Figure 5—figure supplement 1C (anti-pMLC).
- https://cdn.elifesciences.org/articles/89261/elife-89261-fig5-figsupp1-data1-v1.zip
-
Figure 5—figure supplement 1—source data 2
Original file for the western blot analysis in Figure 5—figure supplement 1C (anti-MHCIIa and anti-tubulin).
Exposure corresponding to ICAM-1_KO cells.
- https://cdn.elifesciences.org/articles/89261/elife-89261-fig5-figsupp1-data2-v1.zip
-
Figure 5—figure supplement 1—source data 3
Original file for the western blot analysis in Figure 5—figure supplement 1C (anti-MHCIIa and anti-tubulin).
Exposure corresponding to WT cells.
- https://cdn.elifesciences.org/articles/89261/elife-89261-fig5-figsupp1-data3-v1.zip
-
Figure 5—figure supplement 1—source data 4
PDF containing Figure 5—figure supplement 1C and original scans of the relevant western blot analysis (anti-pMLC, anti-pMHCIIa, and anti-tubulin), with the highlighted bands squared.
- https://cdn.elifesciences.org/articles/89261/elife-89261-fig5-figsupp1-data4-v1.zip
Figure 6 with 1 supplement
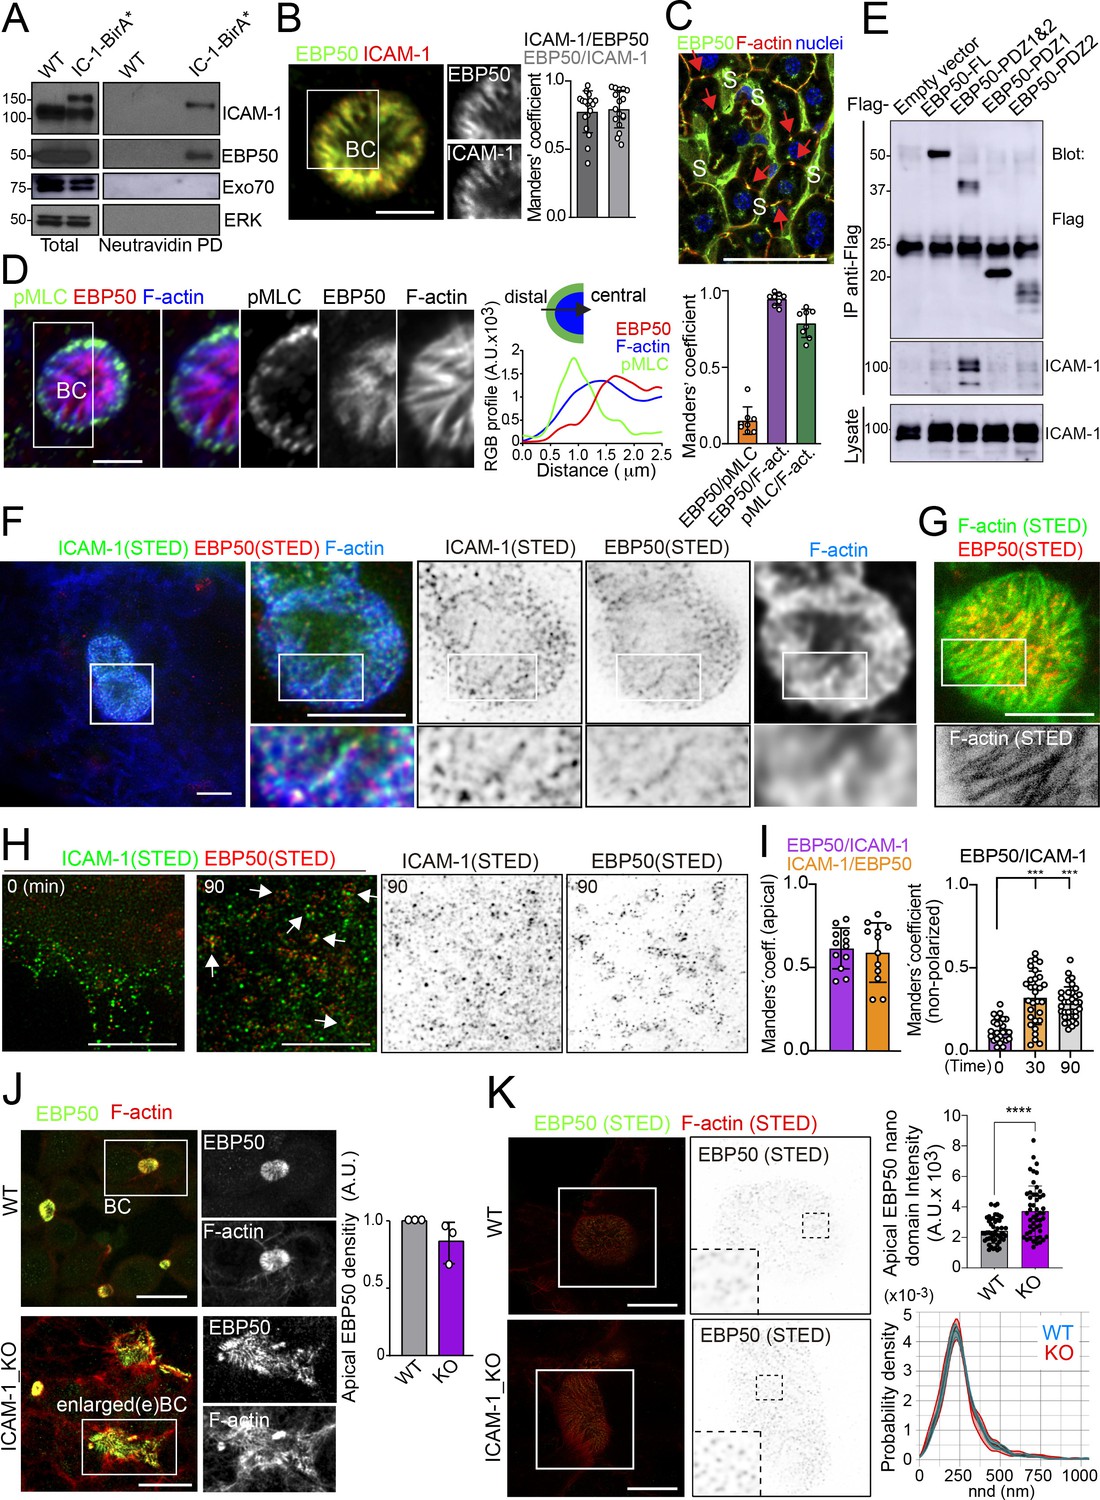
Proximal interaction of intercellular adhesion molecule-1 (ICAM-1) with EBP50/NHERF1/SLC9A3R1 into nano-scale microvillar domains.
(A) The ICAM-1 BioID interactome reveals the proximal interaction of ICAM-1 with EBP50. Parental polarized HepG2 cells (WT) and HepG2 cells stably expressing ICAM-1-BirA* were incubated with 50 μM biotin for 16 hr, lysed and subjected to a pull-down (PD) assay with neutravidin-agarose. Western blots show ICAM-1 and EBP50 biotinylation. Exo70 and ERK are shown as negative controls. ICAM-1 and ICAM-1-BirA* were detected with anti-ICAM-1 antibody. (B) Polarized hepatic epithelial cells were fixed and stained for ICAM-1 and EBP50. BC, bile canaliculi. Manders’ analyses for the indicated pairs of staining show the remarkable co-localization between ICAM-1 and EBP50. Scale bar, 5 μm. (C) EBP50 is localized in murine hepatic sinusoids (S) and in the liver bile canaliculi (red arrows). Scale bar, 50 μm. (D) Triple staining of EBP50, F-actin, and pMLC in BCs. Central panel: relative distribution of the staining intensity for the indicated proteins, starting from the distal parts of BCs, which are enriched in actomyosin, toward the centers of the BCs, which contain the microvillar tips. Right panel: Manders’ analyses for the indicated pairs of staining show the remarkable co-localization of EBP50 with F-actin, but not with pMLC. Scale bar, 3 μm. (E) Hepatic epithelial cells were transfected with the indicated expression vectors coding for FLAG-tagged full-length EBP50 or its N-termina PDZ domains. 24 hr post-transfection, cells were lysed, subjected to immunoprecipitation with anti-FLAG antibodies, and the immunoprecipitates and the lysates were analyzed by western blot for the indicated proteins. (F, G) Polarized hepatic epithelial cells were stained for the indicated proteins and analyzed by super-resolution stimulated emission depletion (STED) super-resolution microscopy. Only two different fluorophores could be subjected to simultaneous STED. (F) STED analysis of ICAM-1 and EBP50. Central and right images are a 2.5-fold enlargement of the boxed area in the left image, which corresponds to BCs. Bottom images are a twofold enlargement of the boxed area in top central and right images, which corresponds to a canalicular microvilli-rich area. (G) STED analysis of F-actin and EBP50 in a BC. Bottom images are a twofold enlargement of the boxed area in the top image, which corresponds to a canalicular microvilli-rich area. Scale bars, 5 μm. (H) STED analyses of non-polarized epithelial cells exposed to anti-ICAM-1 for 30 min in the cold and then incubated at 37°C for the indicated times. ICAM-1 and EBP50 did not overlap at t = 0 in these non-canalicular regions. However, 90 min at 37°C with anti-ICAM-1 antibody induced a redistribution of EBP50 into ring-shaped macroclusters that overlapped with ICAM-1 aggregates. Scale bars, 5 μm. (I) Manders’ analyses for the indicated pairs of staining from (F) (apical) and (H) (non-polarized). (J) Polarized WT and ICAM-1_KO cells were fixed, stained, and the intensity of EBP50 at the apical BCs was quantified by confocal microscopy (right). Scale bars, 20 μm (K) Polarized WT and ICAM-1_KO cells were fixed, stained, and analyzed by STED confocal microscopy. Intensity and nearest-neighbor distance (nnd) of detected spots at BCs and enlarged BCs (eBCs) were calculated. Scale bars, 2 μm. ***p<0.001, ****p<0.0001.
-
Figure 6—source data 1
Original file for the western blot analysis in Figure 6A (anti-EBP50).
- https://cdn.elifesciences.org/articles/89261/elife-89261-fig6-data1-v1.zip
-
Figure 6—source data 2
Original file for the western blot analysis in Figure 6A (anti-EXO70).
- https://cdn.elifesciences.org/articles/89261/elife-89261-fig6-data2-v1.zip
-
Figure 6—source data 3
Original file for the western blot analysis in Figure 6A (anti-ICAM-1).
- https://cdn.elifesciences.org/articles/89261/elife-89261-fig6-data3-v1.zip
-
Figure 6—source data 4
Original file for the western blot analysis in Figure 6A (anti-ERK).
- https://cdn.elifesciences.org/articles/89261/elife-89261-fig6-data4-v1.zip
-
Figure 6—source data 5
PDF containing Figure 6A and original scans of the relevant western blot analysis (anti-ICAM-1, anti-EBP50, anti-EXO70, and anti-ERK), with the highlighted bands squared.
- https://cdn.elifesciences.org/articles/89261/elife-89261-fig6-data5-v1.zip
-
Figure 6—source data 6
Original file for the western blot analysis in Figure 6E (anti-ICAM-1 and anti-flag).
- https://cdn.elifesciences.org/articles/89261/elife-89261-fig6-data6-v1.zip
-
Figure 6—source data 7
PDF containing Figure 6E and original scans of the relevant western blot analysis (anti-ICAM-1 and anti-flag), with the highlighted bands squared.
- https://cdn.elifesciences.org/articles/89261/elife-89261-fig6-data7-v1.zip
Figure 6—figure supplement 1
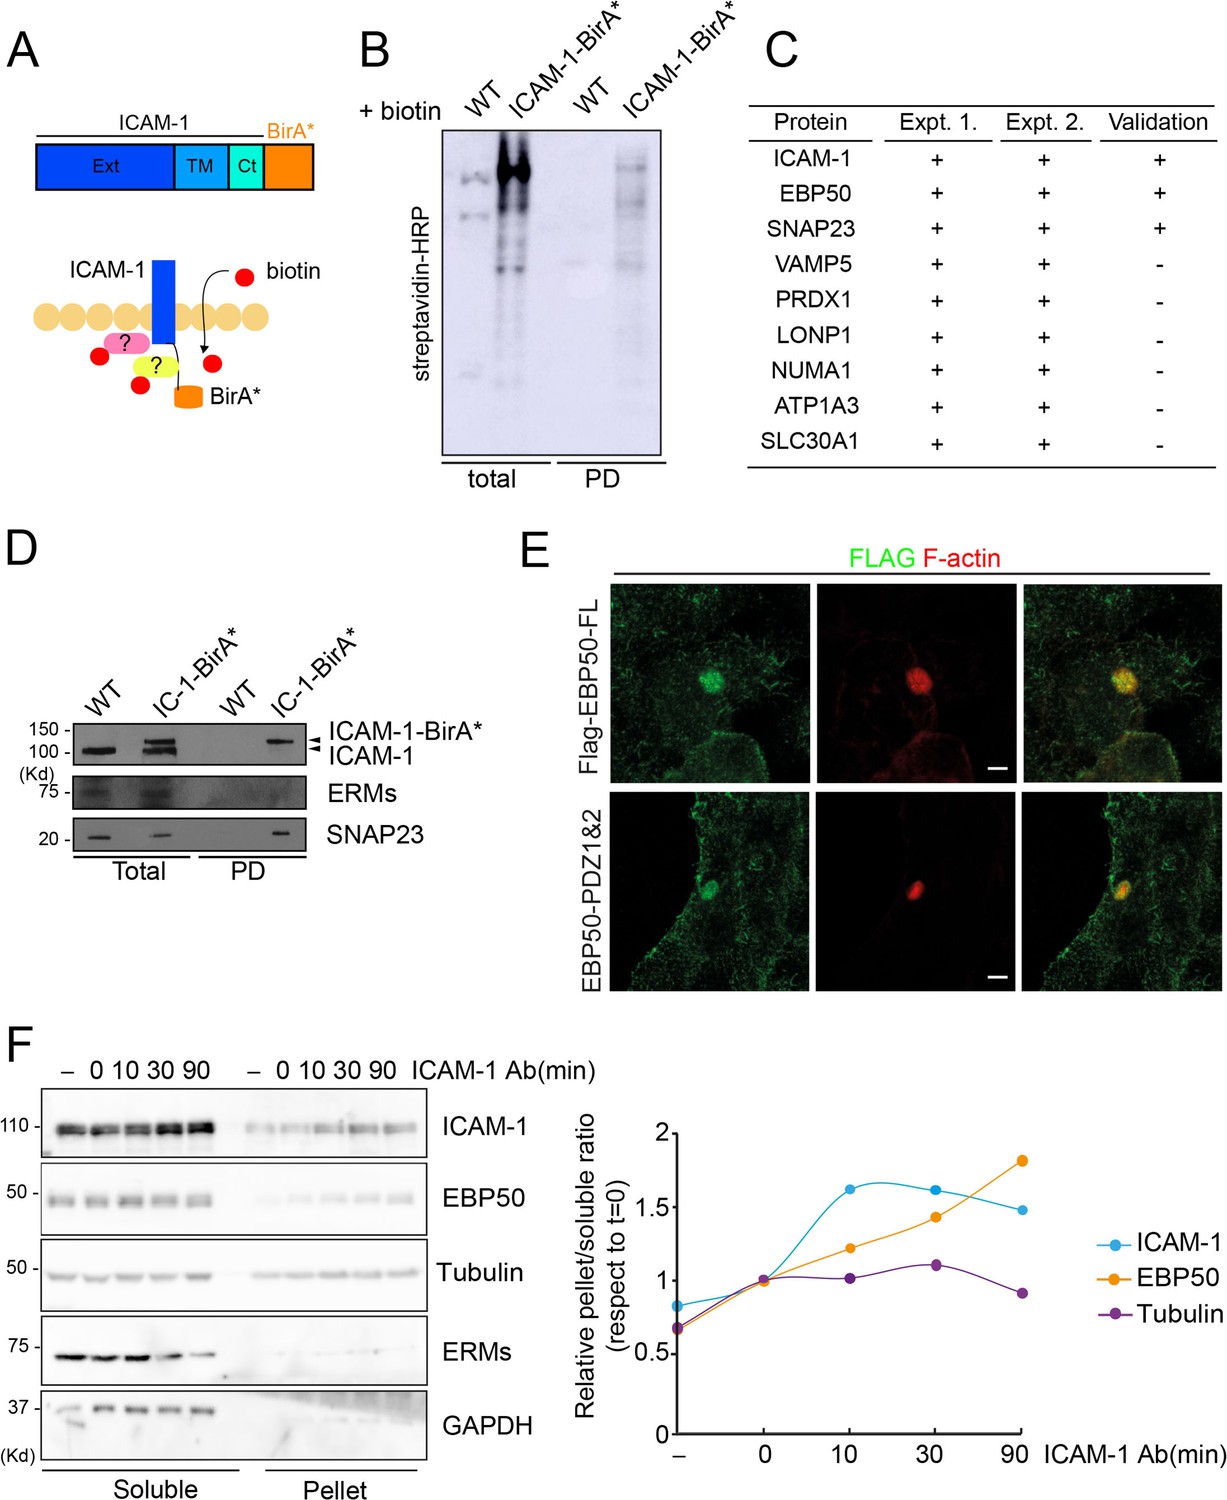
Intercellular adhesion molecule-1 (ICAM-1) BioID reveals the proximal interaction of the receptor with a new set of proteins.
(A) Schematic representation of the proximal biotinylation of proteins by the ICAM-1-BirA* chimeric protein. (B) Cells expressing ICAM-1-BirA* or not were incubated with 50 μM biotin for 16 hr, lysed and subjected to a pull-down (PD) assay with neutravidin-agarose. Biotinylated proteins were detected by blot with streptavidin-HRP. (C) PD fractions from two experiments were subjected to mass spectrometry analysis. Table shows the proteins identified exclusively in the fraction of HepG2 expressing ICAM-1-BirA* but not in the PD fraction of parental cells. EBP50 proximal interaction with ICAM-1 is validated by western blot in (A). (D) Proximal interaction of SNAP23, but not of ezrin-radixin-moesin proteins, despite both having been previously described as ICAM-1 interactors (Barreiro et al., 2002; Schoppmeyer et al., 2022). (E) Cells stably expressing the indicated Flag-tagged EBP50 proteins were cultured for 48 hr, fixed and stained for the FLAG epitope and for F-actin to localized bile canaliculi (BC). Scale bars, 5 μm. (F) Cells were incubated with anti-ICAM-1 mAb for 30 min at 4°C, washed and incubated at 37°C for the indicated times. Cells were lysed and soluble and insoluble (pellet) fractions were separated by centrifugation as described in ‘Materials and methods’. The relative distribution of the indicated proteins was analyzed by western blot (left) and quantified (right).
-
Figure 6—figure supplement 1—source data 1
Original file for the western blot analysis in Figure 6—figure supplement 1B (neutravidin-HRP).
- https://cdn.elifesciences.org/articles/89261/elife-89261-fig6-figsupp1-data1-v1.zip
-
Figure 6—figure supplement 1—source data 2
PDF containing Figure 6—figure supplement 1B and original scan of the relevant western blot (neutravidin-HRP), with the highlighted region squared.
- https://cdn.elifesciences.org/articles/89261/elife-89261-fig6-figsupp1-data2-v1.zip
-
Figure 6—figure supplement 1—source data 3
Original file for the western blot analysis in Figure 6—figure supplement 1D (anti-ICAM-1 and anti-SNAP23).
- https://cdn.elifesciences.org/articles/89261/elife-89261-fig6-figsupp1-data3-v1.zip
-
Figure 6—figure supplement 1—source data 4
Original file for the western blot analysis in Figure 6—figure supplement 1D (anti-ERMs).
- https://cdn.elifesciences.org/articles/89261/elife-89261-fig6-figsupp1-data4-v1.zip
-
Figure 6—figure supplement 1—source data 5
PDF containing Figure 6—figure supplement 1D and original scan of the relevant western blot (anti-ICAM-1, anti-ERMs, and anti-SNAP23), with the highlighted region squared.
- https://cdn.elifesciences.org/articles/89261/elife-89261-fig6-figsupp1-data5-v1.zip
-
Figure 6—figure supplement 1—source data 6
Original file for the western blot analysis in Figure 6—figure supplement 1F (anti-ICAM-1).
- https://cdn.elifesciences.org/articles/89261/elife-89261-fig6-figsupp1-data6-v1.zip
-
Figure 6—figure supplement 1—source data 7
Original file for the western blot analysis in Figure 6—figure supplement 1F (anti-EBP50).
- https://cdn.elifesciences.org/articles/89261/elife-89261-fig6-figsupp1-data7-v1.zip
-
Figure 6—figure supplement 1—source data 8
Original file for the western blot analysis in Figure 6—figure supplement 1F (anti-tubulin).
- https://cdn.elifesciences.org/articles/89261/elife-89261-fig6-figsupp1-data8-v1.zip
-
Figure 6—figure supplement 1—source data 9
Original file for the western blot analysis in Figure 6—figure supplement 1F (anti-ERMs).
- https://cdn.elifesciences.org/articles/89261/elife-89261-fig6-figsupp1-data9-v1.zip
-
Figure 6—figure supplement 1—source data 10
Original file for the western blot analysis in Figure 6—figure supplement 1F (anti-GAPDH).
- https://cdn.elifesciences.org/articles/89261/elife-89261-fig6-figsupp1-data10-v1.zip
-
Figure 6—figure supplement 1—source data 11
PDF containing Figure 6—figure supplement 1F and original scan of the relevant western blot (anti-ICAM-1, anti-EBP50, anti-tubulin, anti-ERMs, and anti-GAPDH), with the highlighted region squared.
- https://cdn.elifesciences.org/articles/89261/elife-89261-fig6-figsupp1-data11-v1.zip
Figure 7
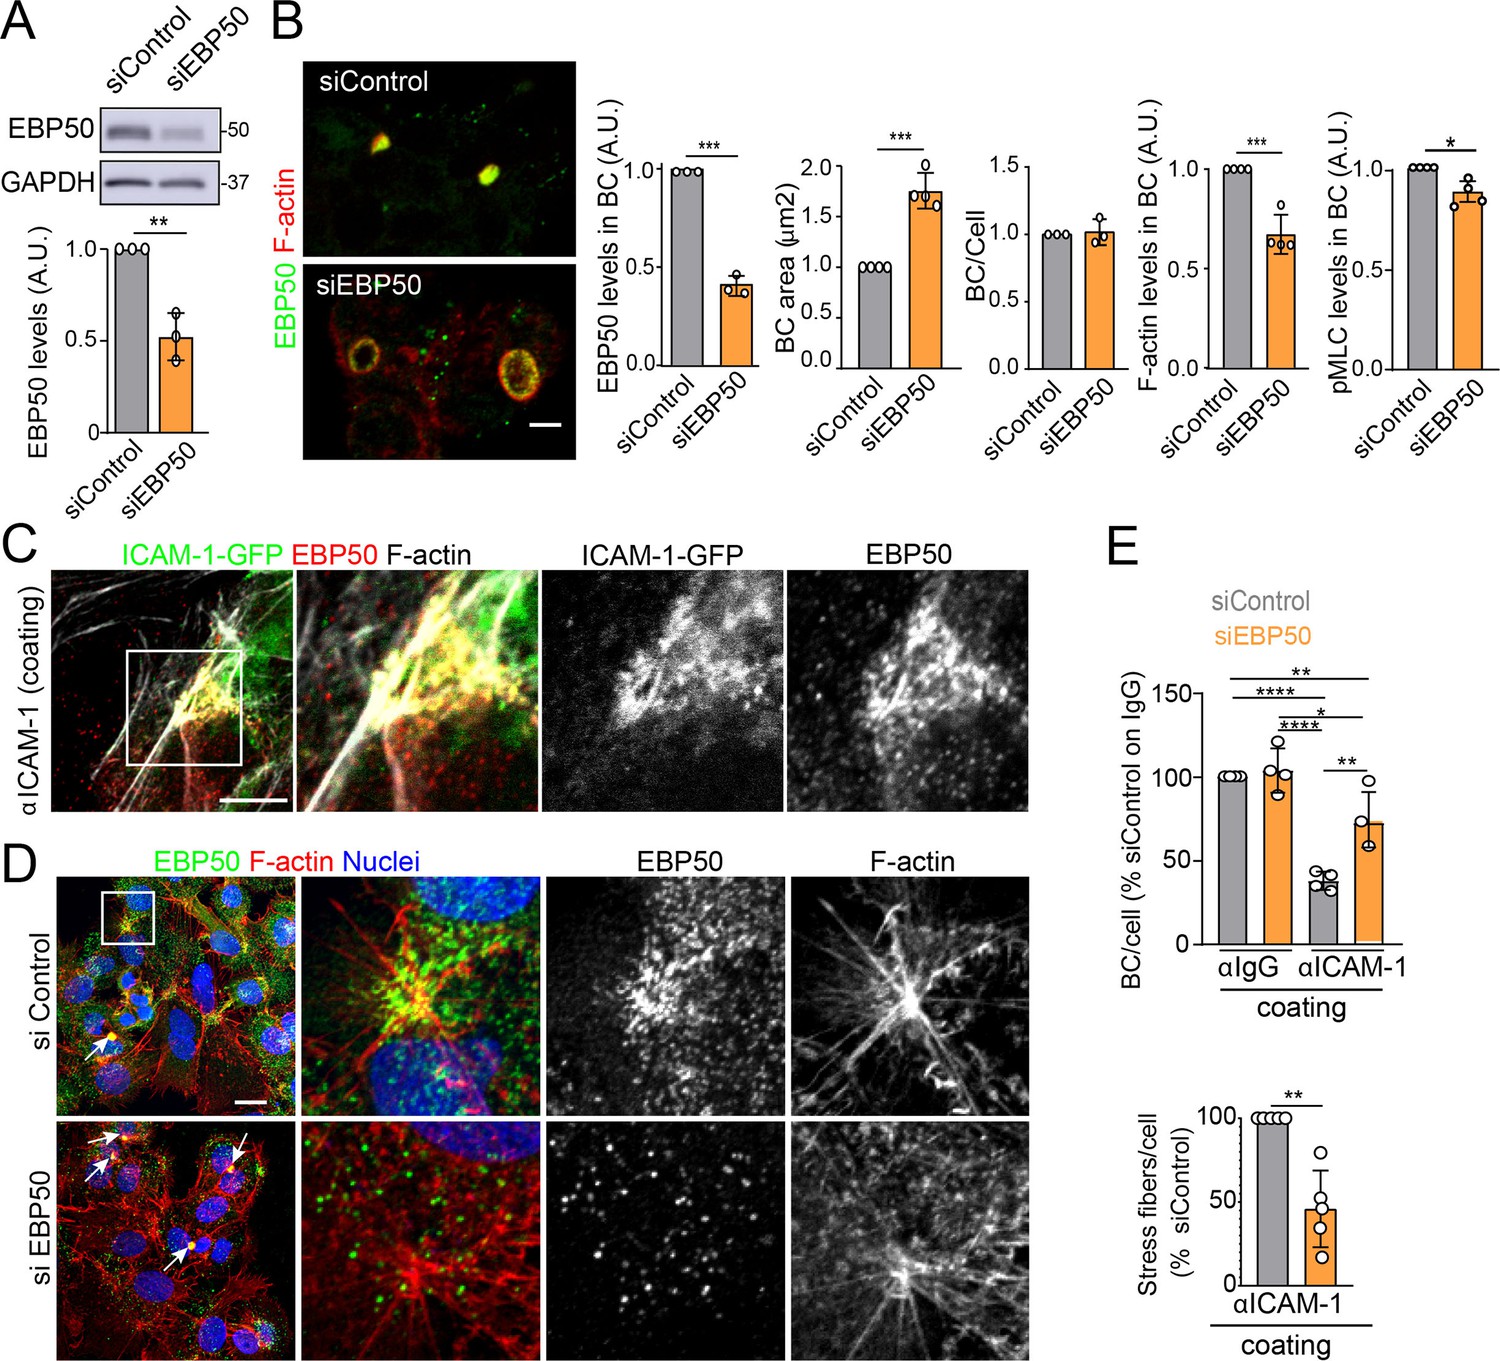
EBP50 regulates intercellular adhesion molecule-1 (ICAM-1)-mediated signaling.
(A, B) HepG2 cells were transfected with siRNA control (siControl) or with siRNA targeting EBP50 (siEBP50) and cultured for 72 hr. Cells were lysed and analyzed by western blot for the indicated antibodies (A) or fixed and stained for the indicated proteins (B) Bile canaliculi (BC) frequency and area and the intensity levels of the indicated protein at BCs were quantified. Bars represent the mean ± SD of at least three experiments. Scale bar, 10 μm. (C) HepG2 cells stably expressing ICAM-1-GFP were cultured for 24 hr on coverslips precoated with anti-ICAM-1 antibody, fixed and stained for F-actin and EBP50. Central and right images are an enlargement of the boxed area in the left confocal image, which shows a region enriched in stress fibers and stellate stress fibers. Scale bar, 5 μm. (D) HepG2 cells were transfected with siControl or siEBP50 for 48 hr, then cultured for 24 hr on coverslips precoated with anti-ICAM-1 antibody. Cells were fixed and stained for F-actin and EBP50. Central and right images are enlargements of the boxed areas in the left images, which show regions enriched in stress fibers and stellate stress fibers. Arrows point at BCs. Scale bar, 10 μm. (E) Quantification of the number of BC per cell (top) and the percentage of stress fibers per cell with respect to siControl-transfected cells (bottom) of experiments shown in (i). Bars represent the mean ± SD of at least four experiments. *p<0.05, **p<0.01, ***p<0.001, ****p<0.0001. A.U., arbitrary units. Nuclei were stained with DAPI.
-
Figure 7—source data 1
Original file for the western blot analysis in Figure 7A (anti-EBP50 and anti-GAPDH).
- https://cdn.elifesciences.org/articles/89261/elife-89261-fig7-data1-v1.zip
-
Figure 7—source data 2
PDF containing Figure 7A and original scans of the relevant western blot analysis (anti-EBP50 and anti-GAPDH), with the highlighted bands squared.
- https://cdn.elifesciences.org/articles/89261/elife-89261-fig7-data2-v1.zip
Figure 8 with 1 supplement
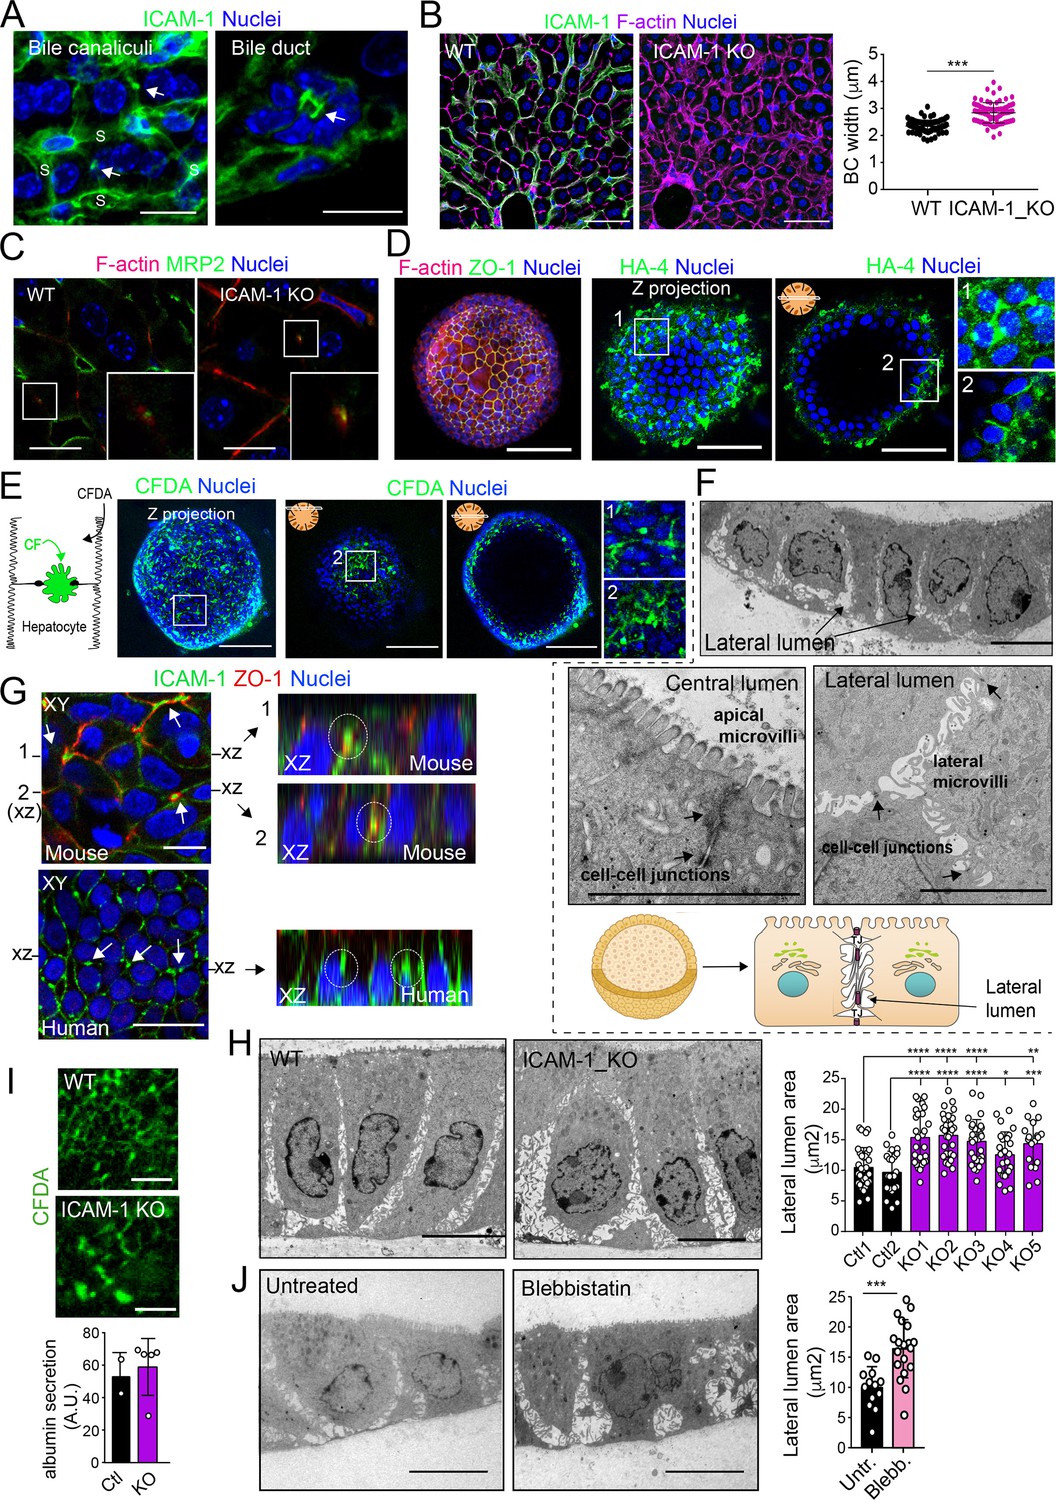
Intercellular adhesion molecule-1 (ICAM-1) and non-muscle myosin-II regulate the size of canalicular-like cavities in hepatic organoids.
(A) ICAM-1 concentrates in bile canaliculi and bile ducts in livers of LPS-stimulated mice (arrows). S, sinusoids. Scale bars, 20 μm (left image) and 10 μm (right image). (B) ICAM-1, F-actin, and nucleus staining of livers from WT and Icam1_KO mice. Scale bars, 20 μm. Right graph: quantification of bile canaliculi (BC) width from WT and ICAM-1_KO murine livers identified morphologically by F-actin staining more than 80 bile canaliculi from four WT and four Icam1_KO mice. (C) Immunohistochemical analyses of F-actin and MRP2 in bile canaliculi in WT and Icam1_KO mice. Insets show enlargements of the boxed areas. Scale bars, 6 μm. (D) Mouse liver organoids have a spherical morphology. Differentiated hepatic organoids were fixed and stained for the indicated antibodies and for F-actin and nuclei to visualize cell morphology. A Z-stack projection of an organoid is shown on the left central image. A single confocal image is shown on the central right image. Enlargement of the boxed areas is shown on the right. Scale bars, 100 μm. (E) Mouse liver organoids were treated with 25 μM CFDA for 30 min. Left panel shows the Z-stack projections of different confocal planes of an organoid. Central and right panels show the distal and central confocal planes, respectively, of the organoid in the left images. Right images show a twofold magnification of the boxed areas. Scale bars, 100 μm. (F) Mouse liver organoids were fixed and processed for transmission electron microscopy. Cells organized in sheets facing big central lumens (central left image) but also formed cavities between their lateral membranes containing cell–cell junctions and microvilli (lateral lumens) (top and central right images, bottom cartoon). Scale bars, 5 μm. (G) Mouse (top) and human (bottom) liver organoids were fixed, permeabilized, and stained for ICAM-1, F-actin, and nuclei. Left images show a confocal plane that crosses the central part of a cell sheet. F-actin and ICAM-1 accumulations were detected between cells (arrows). ZO-1 staining clearly surrounded these accumulations in the mouse organoid (bottom). Black lines on the side of the left images mark the location of the X-Z reconstructions shown in the right images. Encircled regions show lateral areas of ICAM-1 accumulation. (H) Ultrastructural analysis of differentiated WT and ICAM-1_KO liver organoids. Quantification of lateral lumen areas for organoids from two WT and five Icam1_KO mice (right). Areas of more than 20 lateral lumens were analyzed for each mouse. Bars represent the mean ± SD. Scale bars, 5 μm. (I) Functional comparison of WT and ICAM-1_KO organoids. WT and ICAM-1_KO organoids equally processed and secreted CFDA into lateral lumens (top images) and secreted albumin (bottom graph). A.U., arbitrary units. (J) Ultrastructural analysis of differentiated WT liver organoids treated or not with 10 μM blebbistatin for 24 hr. Scale bars, 5 μm. The right plot shows the quantification of lateral lumen areas. Quantifications represent the mean ± SD. *p<0.05, **p<0.01, ***p<0.001, ****p<0.0001. Nuclei were stained with DAPI in confocal images.
Figure 8—figure supplement 1
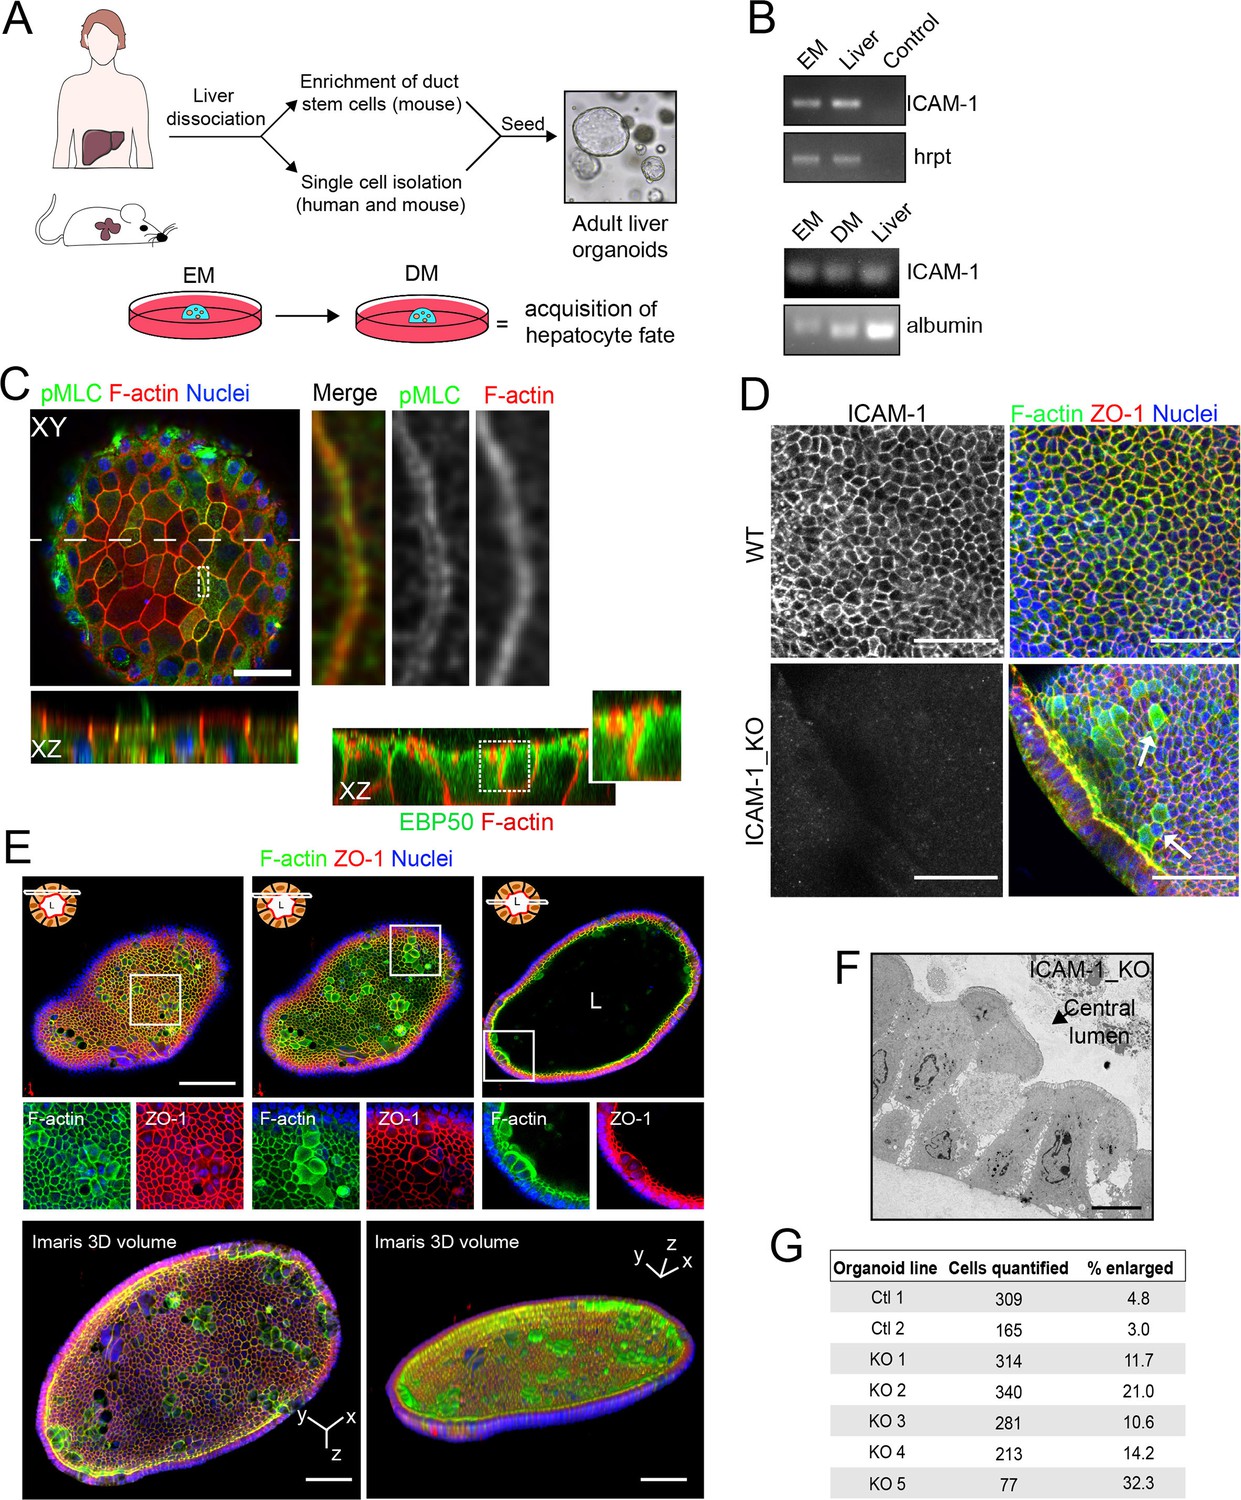
Generation of liver organoids from bipotent precursor cells and the effect of ICAM1 gene knockout on their cellular morphology.
(A) Graphical protocol of ductal stem cell isolation and differentiation from human and murine liver biopsies ( Broutier et al., 2016). Briefly, ductal stem cells were isolated from hepatic tissue and placed in a 3D environment in the presence of expansion medium (EM). Differentiation to the hepatocyte lineage was induced by changing EM to differentiation medium (DM) for 13 d. (B) PCR analysis of ICAM-1 and albumin mRNA in murine liver organoids and liver tissue. A PCR control with no primers is shown. (C) Murine liver organoids were fixed, permeabilized, and stained for pMLC, F-actin, and nuclei. Left image shows a confocal plane that crosses the central part of an epithelial sheet of the organoid. Bottom image shows the XZ reconstruction of this image in the plane labeled with a discontinuous line. Right images show an eightfold magnification of the boxed area showing that pMLC surrounds lateral, perijunctional F-actin domains. Bottom-right images show the XZ reconstruction of a murine liver organoid stained for F-actin and EBP50, in which EBP50 is enriched in perijunctional areas. (D) Z-stack projection of confocal images taken from WT and ICAM-1_KO organoids in which the size of some ICAM-1_KO cells is expanded (arrow). Scale bars, 50 μm. (E) Differentiated ICAM-1_KO organoids were fixed and stained for F-actin and ZO-1. Top images: two different confocal planes in the Z-axis of the same organoid. Bottom images show a twofold increase in the boxed area to show details of F-actin and ZO-1 distribution in the enlarged cells. Scale bars, 100 μm. Nuclei were stained with DAPI. (F) Transmission electron microscopy of ICAM-1_KO cells in which apical membranes protrude into the central lumen. Scale bar, 10 μm. (G) Quantification of EM images of WT and ICAM-1_KO organoids. Table shows the percentage of cells with enlarged morphology: abnormally enlarged and/or protruding from the cell monolayer that forms the organoid.
-
Figure 8—figure supplement 1—source data 1
Original file of the gel containing PCR analyses of several transcripts in murine liver organoids grown in expanding medium and in hepatic tissue shown in Figure 8—figure supplement 1B (panels ICAM-1 and hrpt).
- https://cdn.elifesciences.org/articles/89261/elife-89261-fig8-figsupp1-data1-v1.zip
-
Figure 8—figure supplement 1—source data 2
Original file of the gel containing PCR analyses of several transcripts of murine liver organoids cultivated in expanding medium (EM) and differentiated medium (DM) and of liver tissue shown in Figure 8—figure supplement 1B (panels ICAM-1 and albumin).
- https://cdn.elifesciences.org/articles/89261/elife-89261-fig8-figsupp1-data2-v1.zip
-
Figure 8—figure supplement 1—source data 3
PDF containing Figure 8—figure supplement 1B and original scan of the relevant PCR analyses (ICAM-1, hrpt, albumin), with the highlighted region squared.
- https://cdn.elifesciences.org/articles/89261/elife-89261-fig8-figsupp1-data3-v1.zip
Figure 9
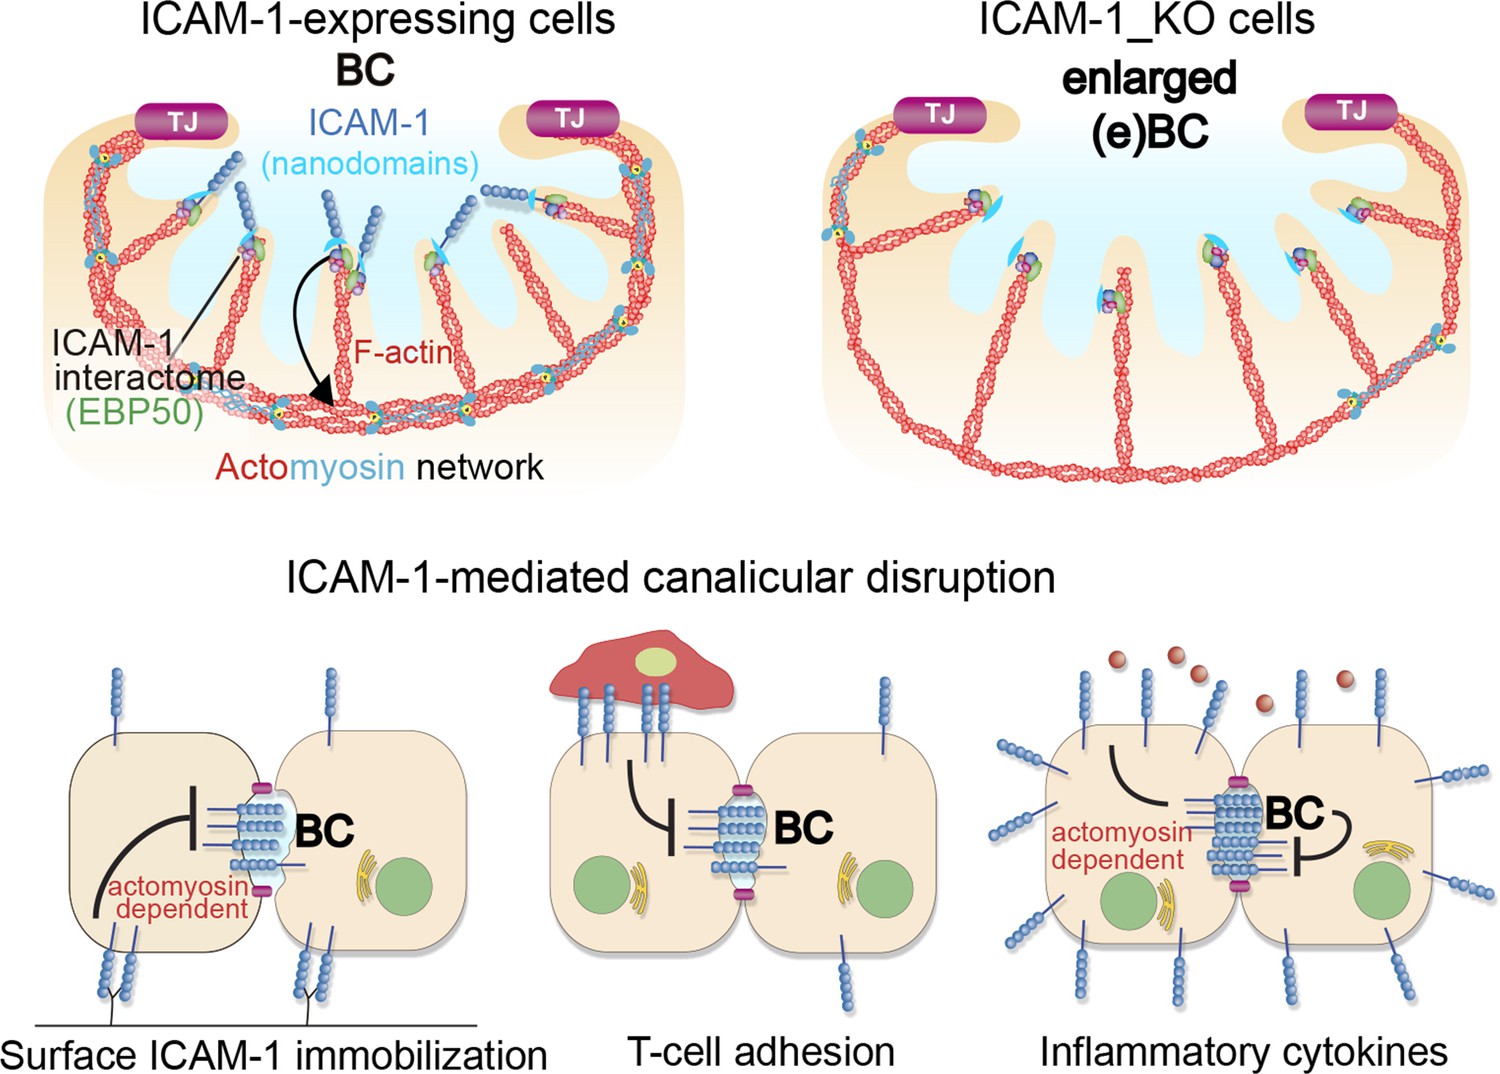
A model for the control of actomyosin-mediated contraction of bile canaliculi (BC) mediated by intercellular adhesion molecule-1 (ICAM-1) expression levels, which determine the size and frequency of these apical structures in hepatic epithelial cells.
Top images: canalicular ICAM-1 signals toward a distal canalicular actomyosin network at the base of microvilli. EBP50 links ICAM-1 to F-actin and localizes into membrane nano-scale domains to mediate this signaling. In ICAM-1_KO, actomyosin-mediated contraction is reduced and BCs are enlarged (eBCs). Bottom images: ICAM-1 can signal toward actomyosin and regulate BC frequency. Surface immobilization of ICAM-1 prevents BC formation (bottom left) or disrupts mature BCs, as shown by ICAM-1-mediated T-cell adhesion (bottom center). ICAM-1 upregulation in response to inflammatory cytokines increases actomyosin-mediated contraction at BCs, which also reduces BC frequency (bottom right).
Videos
Video 1
Time-lapse fluorescence microscopy of polarized WT HepG2 cells stably expressing MDR1-GFP.
Images were acquired at 15 min intervals for 18 hr and displayed at four frames per second. Note the fusion of two bile canaliculi (BC) between 14 and 18 hr. Scale bar, 10 μm.
Video 2
Time-lapse fluorescence microscopy of polarized ICAM-1_KO HepG2 cells stably expressing MDR1-GFP.
Images were acquired at 15 min intervals for 18 hr and displayed at four frames per second. Scale bar, 10 μm.
Video 3
Time-lapse spinning disc confocal microscopy of polarized HepG2 cells expressing GFP-tagged myosin light chain (GFP-MLC) (green) and incubated with SirActin (red).
Images were acquired at 4 min intervals for 48 min and displayed at one frame per second. Scale bar, 3 μm.
Tables
Appendix 1—key resources table
| Reagent type (species) or resource | Designation | Source or reference | Identifiers | Additional information |
|---|---|---|---|---|
| Gene (Homo sapiens) | ICAM1 | GenBank | Gene ID: 3383 | Also known as BB2; CD54; P3.58 |
| Gene (H. sapiens) | NHERF1 | GenBank | Gene ID: 9368 | Also known as EBP50; NHERF; NHE-RF; NHERF- 1; NPHLOP2; SLC9A3R1 |
| Gene (Mus musculus) | Icam1 | GenBank | Gene ID: 15894 | Also known as CD54; Ly-47; Icam-1; MALA-2 |
| Cell line (H. sapiens) | HepG2 | ATCC | ATCC HB- 8065 | |
| Cell line (H. sapiens) | Human T lymphoblasts | Donors | Human primary cells prepared from isolated peripheral blood mononuclear cells | |
| Transfected construct (H. sapiens) | ICAM-1-BirA* | This paper and Cacho-Navas et al., 2022 | Backbone pEGFP-N1 | |
| Transfected construct (H. sapiens) | ICAM-1-GFP | Dr. F. Sánchez- Madrid (Madrid, Spain) (Barreiro et al., 2002) | Backbone pEGFP-N1 | |
| Transfected construct (H. sapiens) | pSpCas9(BB)-2ª- GFP | PX458 | Addgene; 48138 | Vector for CRISPR-CAS9-medited gene edition Dr. F. Zhang (Cambridge, MA) |
| Transfected construct (H. sapiens) | GFP | Clontech | pEGFP-N1 | |
| Transfected construct (H. sapiens) | GFP-Rab11 | Dr. F. Martín- Belmonte (Madrid, Spain) (Rodríguez-Fraticelli et al., 2015) | Backbone pEGFP-C1 | |
| Transfected construct (H. sapiens) | MDR1-GFP | Dr. I.M. Arias, (Bethesda, MD) (Sai et al., 1999) | ||
| Transfected construct (H. sapiens) | GFP-RhoB | Dr. D. Pérez- Sala (Madrid, Spain) (Marcos-Ramiro et al., 2016) | Backbone pEGFP-C1 | |
| Transfected construct (H. sapiens) | GFP-Rac1 | Dr. G. Bokoch | Addgene; 12980 | |
| Transfected construct (H. sapiens) | GFP-RhoC | From Channing Der (Chapel Hill, NC) | Addgene; 23226 | Backbone pEGFP-C2 |
| Transfected construct (H. sapiens) | pCMV-FLAG-EBP50(NHERF1)-FL | Dr. M.M. Georgescu (Houston, TX) | Addgene; 28291 | Backbone pCMV-2-FLAG |
| Transfected construct (H. sapiens) | pCMV-FLAG- EBP50(NHERF1)-PDZ1-2 | Dr. M.M. Georgescu (Houston, TX) | Addgene; 28294 | Backbone pCMV-2-FLAG |
| Transfected construct (H. sapiens) | pCMV-FLAG- EBP50(NHERF1)-PDZ1iP | Dr. M.M. Georgescu (Houston, TX) | Addgene; 28295 | Backbone pCMV-2-FLAG |
| Transfected construct (H. sapiens) | pCMV-FLAG- EBP50(NHERF1)-PDZ2 | Dr. M.M. Georgescu (Houston, TX) | Addgene; 28296 | Backbone pCMV-2-FLAG |
| Transfected construct (H. sapiens) | pCMV-FLAG- EBP50(NHERF1)-EB | Dr. M.M. Georgescu (Houston, TX) | Addgene; 28297 | Backbone pCMV-2-FLAG |
| Antibody | Anti-ICAM-1 (mouse monoclonal) | R&D Systems | #BBA3; RRID:AB_356950 | IF 1/400; IP 1/100 |
| Antibody | Anti-ICAM-1 (rabbit polyclonal) | Santa Cruz Biotechnology | sc-7891; RRID:AB_647486 | WB 1/1000 |
| Antibody | Anti-ICAM-1 (mouse monoclonal) | Santa Cruz Biotechnology | sc-107; RRID:AB_627120 | IHC 1/1000 |
| Antibody | Anti-ICAM-1 (rat monoclonal) | EBioscience | 14-0542-81; RRID:AB_529544 | WB 1/1000; IF 1/200 |
| Antibody | Anti-ERK1/2 (rabbit polyclonal) | Santa Cruz Biotechnology | sc-94; RRID:AB_2140110 | WB 1/1000 |
| Antibody | Anti-EBP50 (mouse monoclonal) | Santa Cruz Biotechnology | sc-271552; RRID:AB_10649999 | WB 1/1000; IF 1/400 |
| Antibody | Anti-EBP50 (rabbit polyclonal) | Thermo Fisher Scientific | PA1-090; RRID:AB2191493 | WB 1/1000; IF 1/250 |
| Antibody | Anti-tubulin (mouse monoclonal) | Santa Cruz Biotechnology | sc-134241; RRID:AB_2009282 | WB 1/5000 |
| Antibody | Anti-SNAP23 (rabbit polyclonal) | Synaptic Systems | 111 202; RRID:AB_887788 | WB 1/1000; IF 1/400 |
| Antibody | Anti-SNAP23 (mouse monoclonal) | Santa Cruz Biotechnology | sc-374215; RRID:AB_10990315 | WB 1/1000 |
| Antibody | Anti-CD59 (mouse monoclonal) | EXBIO | MEM43 (11-233C100); RRID:AB_10735273 | IF 1/400 |
| Antibody | Anti-ERM (rabbit polyclonal) | Cell Signaling Technology | 3142; RRID:AB_2100313 | WB 1/1000; IF 1/400 |
| Antibody | Anti-GFP (mouse monoclonal) | Roche | 11814460001; RRID:AB_390913 | WB 1/1000 |
| Antibody | Anti-ZO-1 (rabbit polyclonal) | Thermo Fisher Scientific | 40-2200; RRID:AB_2533456 | IF 1/500 |
| Antibody | Anti-Rab11 (mouse monoclonal) | Thermo Fisher Scientific | 71-5300; RRID:AB_2533987 | WB 1/1000 |
| Antibody | Anti-TfR (mouse monoclonal) | Thermo Fisher Scientific | 13-6800; RRID:AB_2533029 | WB 1/1000 |
| Antibody | Anti-MLC (rabbit polyclonal) | Cell Signaling Technology | 3672; RRID:AB_10692513 | WB 1/1000; IF 1/200 |
| Antibody | Anti-p(T18/S19)- MLC (rabbit polyclonal) | Cell Signaling Technology | 3671; RRID:AB_330248 | WB 1/1000; IF 1/200 |
| Antibody | Anti-MHC-IIb (rabbit polyclonal) | BioLegend | 909902; RRID:AB_2749903 | IF 1/200 |
| Antibody | Rabbit anti-MHC- IIa (rabbit polyclonal) | BioLegend | 909802; RRID:AB_2734686 | IF 1/200 |
| Antibody | Anti-Exo70 (mouse monoclonal) | Merck (Millipore) | MABT186 clone 70X13F3 | WB 1/500 |
| Antibody | Anti-IgG (mouse monoclonal) | Merck (Sigma-Aldrich) | I5381; RRID:AB_1163670 | IP 1/100 |
| Antibody | Anti-IgG (rabbit polyclonal) | Merck (Sigma-Aldrich) | I5006; RRID:AB_1163659 | IP 1/100 |
| Antibody | Anti-F4/80 (rat monoclonal) | Abcam | ab6640; RRID:AB_1140040 | IF 1/1000 |
| Antibody | Anti-HA-4 antigen (CEACAM) (mouse monoclonal) | University of Iowa | RRID:AB_ 10659875 | IF 1/100 |
| Antibody | Anti-plasmolipin (rabbit polyclonal) | In-house (Cacho-Navas et al., 2022) | IF 1/250 | |
| Antibody | Anti-Radixin (rabbit polyclonal) | Cell Signaling | C4G7; RRID:AB_2238294 | IF 1/250 |
| Antibody | Anti-MRP2 (mouse monoclonal) | Enzo Life Sciences | ALX-801-016; RRID:AB_22 73479 | IF 1/250 |
| Antibody | Anti-CD3 OKT3 (mouse monoclonal) | ATCC | CRL-8001 | Purified from mouse hybridomas producing anti-CD3ε mAb OKT3 (our laboratory); IF 1/250 |
| Antibody | Goat F(ab) anti-mouse IgG 596 | Abcam | Abcam (ab6723); RRID:AB_955573 | IF 1/100 |
| Antibody | Donkey anti-mouse Alexa Fluor 488 | Thermo Fisher Scientific | A-21202; RRID:AB_141607 | IF 1/500 |
| Antibody | Donkey anti-mouse Alexa Fluor 555 | Thermo Fisher Scientific | A-31570; RRID:AB_2536180 | IF 1/500 |
| Antibody | Donkey anti-mouse Alexa Fluor 647 | Thermo Fisher Scientific | A-31571; RRID:AB_162542 | IF 1/500 |
| Antibody | Donkey anti-rabbit Alexa Fluor 488 | Thermo Fisher Scientific | A-21206; RRID:AB_141708 | IF 1/500 |
| Antibody | Donkey anti-rabbit Alexa Fluor 555 | Thermo Fisher Scientific | A-31572; RRID:AB_162543 | IF 1/500 |
| Antibody | Donkey anti-rabbit Alexa Fluor 647 | Thermo Fisher Scientific | A-31573; RRID:AB_2536183 | IF 1/500 |
| Antibody | Donkey anti-rat Alexa Fluor 488 | Thermo Fisher Scientific | A-21208; RRID:AB_2535794 | IF 1/500 |
| Antibody | Donkey anti-mouse HRP | Jackson Immunoresearch | 715-035-151; RRID:AB_2340771 | WB 1/5000 |
| Antibody | Donkey anti-rabbit HRP | GE Healthcare | NA934; RRID:AB_772206 | WB 1/5000 |
| Sequence-based reagent | sgRNA ICAM-1 fw | This paper | Single-guide RNA | CACCGCGCACTCCTGGTCCTGC TCG |
| Sequence-based reagent | sgRNA ICAM-1 rv | This paper | Single-guide RNA | AAACCGAGCAGGACCAGGAGT GCGC |
| Sequence-based reagent | msICAM-1 Fw | This paper | PCR primer | CTTCAACCCGTGCCAAGC |
| Sequence-based reagent | msICAM-1 Rv | This paper | PCR primer | GAAGGCTTCTCTGGGATGGA |
| Sequence-based reagent | msHRPT Fw | This paper | PCR primer | AAGCTTGCTGGTGAAAAGGA |
| Sequence-based reagent | msHRPT Rv | This paper | PCR primer | TTGCGCTCATCTTAGGCTTT |
| Sequence-based reagent | msALB Fw | This paper | PCR primer | GCGCAGATGACAGGGCGGAA |
| Sequence-based reagent | msALB Rv | This paper | PCR primer | GTGCCGTAGCATGCGGGAGG |
| Sequence-based reagent | siControl | Dharmacon | siRNA | AUGUAUUGGCCUGUAUUAGUU |
| Sequence-based reagent | siICAM-1 3’UTR | Dharmacon | siRNA | GAACAGAGUGGAAGACAUAUU |
| Sequence-based reagent | siSLC9A3R1 05 | Dharmacon | siRNA | (TS) CCAGAAACGCAGCAGCAAA |
| Sequence-based reagent | siSLC9A3R1 06 | Dharmacon | siRNA | (TS) GCGAAAACGUGGAGAAGGA |
| Sequence-based reagent | siSLC9A3R1 07 | Dharmacon | siRNA | GCGAGGAGCUGAAUUCCCA |
| Sequence-based reagent | siSLC9A3R1 08 | Dharmacon | siRNA | GAACAGUCGUGAAGCCCUG |
| Peptide, recombinant protein | Streptavidin-Alexa Fluor 555 | Thermo Fisher Scientific | S21381; RRID:AB_2307336 | IF 1/1000 |
| Peptide, recombinant protein | Streptavidin-HRP | Thermo Fisher Scientific | 815-968-0747 | WB 1/10,000 |
| Peptide, recombinant protein | Phalloidin-Alexa Fluor 647 | Thermo Fisher Scientific | A-22287; RRID:AB_2620155 | IF 1/250 |
| Peptide, recombinant protein | PHA | Thermo Fisher Scientific | 10576015 | |
| Peptide, recombinant protein | IL-2 | Thermo Fisher Scientific | PHC0021 | |
| Peptide, recombinant protein | IL-1β | Peprotech | 200-01B | |
| Peptide, recombinant protein | TNF-α | R&D Systems | 210-TA/CF | |
| Peptide, recombinant protein | IFN-γ | Peprotech/Teb- bio | 300-02 | |
| Peptide, recombinant protein | Fibronectin | Corning | 356008 | |
| Commercial assay or kit | BCG albumin assay kit | Merck (Sigma-Aldrich) | MAK124 | |
| Chemical compound, drug | DAPI | Merck | 268298 | IF 1/1000 |
| Chemical compound, drug | Geneticin | Santa Cruz Biotechnology | 29065B | |
| Chemical compound, drug | Sulfo-NHS-biotin | Thermo Fisher Scientific | 21217 | |
| Chemical compound, drug | Phorbol 12- miristate 13- acetate (PMA) | Merck (Sigma-Aldrich) | P8139 | |
| Chemical compound, drug | Calcein-AM | Thermo Fisher Scientific | C3099 | |
| Chemical compound, drug | Y-27632 | Merck (Calbiochem) | 688000 | |
| Chemical compound, drug | Blebbistatin | Merck (Sigma-Aldrich) | B-0560 | |
| Chemical compound, drug | Biotin | Merck (Sigma-Aldrich) | B4501 | |
| Chemical compound, drug | (5-and-6)- Carboxyfluorescein Diacetate (CFDA) | Thermo Fisher Scientific | C195 | |
| Other | Tissue-Tek O.C.T. | Sakura | 4583 | For preparing liver tissue samples for immunohistochemistry; see ‘Tissue immunofluorescence and immunohistochemistry’ |
| Other | Holey Carbon Grids for Cryo EM | Quantifoil | R2/2G200F1 | For culturing cells for cryo-soft-X-ray tomography; see ‘Correlative cryo-soft X-ray tomography’ |
| Other | Neutravidin Agarose | Thermo Fisher Scientific | 29201 | Neutravidin conjugated to solid substrate to perform pull-down assays of biotinylated proteins; see ‘Biotinylation of ICAM-1-proximal proteins: BioID assay’ |
| Other | Protein-G- sepharose | Rockland | PG50-00-0002 | Protein G-coated Sepharose to conjugate mouse monoclonal antibodies and perform immunoprecipitation; see ‘Immunoprecipitation assays’ |
| Other | Ficoll | STEMCELL Technologies | 07801 | Reagent for isolating human peripheral blood mononuclear cells (PBMCs) as in Millán et al., 2002; see ‘Cells and culture’ |
Additional files
Download links
A two-part list of links to download the article, or parts of the article, in various formats.
Downloads (link to download the article as PDF)
Open citations (links to open the citations from this article in various online reference manager services)
Cite this article (links to download the citations from this article in formats compatible with various reference manager tools)
ICAM-1 nanoclusters regulate hepatic epithelial cell polarity by leukocyte adhesion-independent control of apical actomyosin
eLife 12:RP89261.
https://doi.org/10.7554/eLife.89261.3


