Inhibition of the Notch signal transducer CSL by Pkc53E-mediated phosphorylation to fend off parasitic immune challenge in Drosophila
- Department of Molecular Genetics, Institute of Biology, University of Hohenheim, Germany
- Department of Medical Genetics and Applied Genomics, University of Tübingen, Germany
- Institute of Biomedical Genetics (IBMG), University of Stuttgart, Germany
- Department of Internal Medicine II, Molecular Cardiology, University of Ulm, Germany
Figures
Figure 1 with 2 supplements
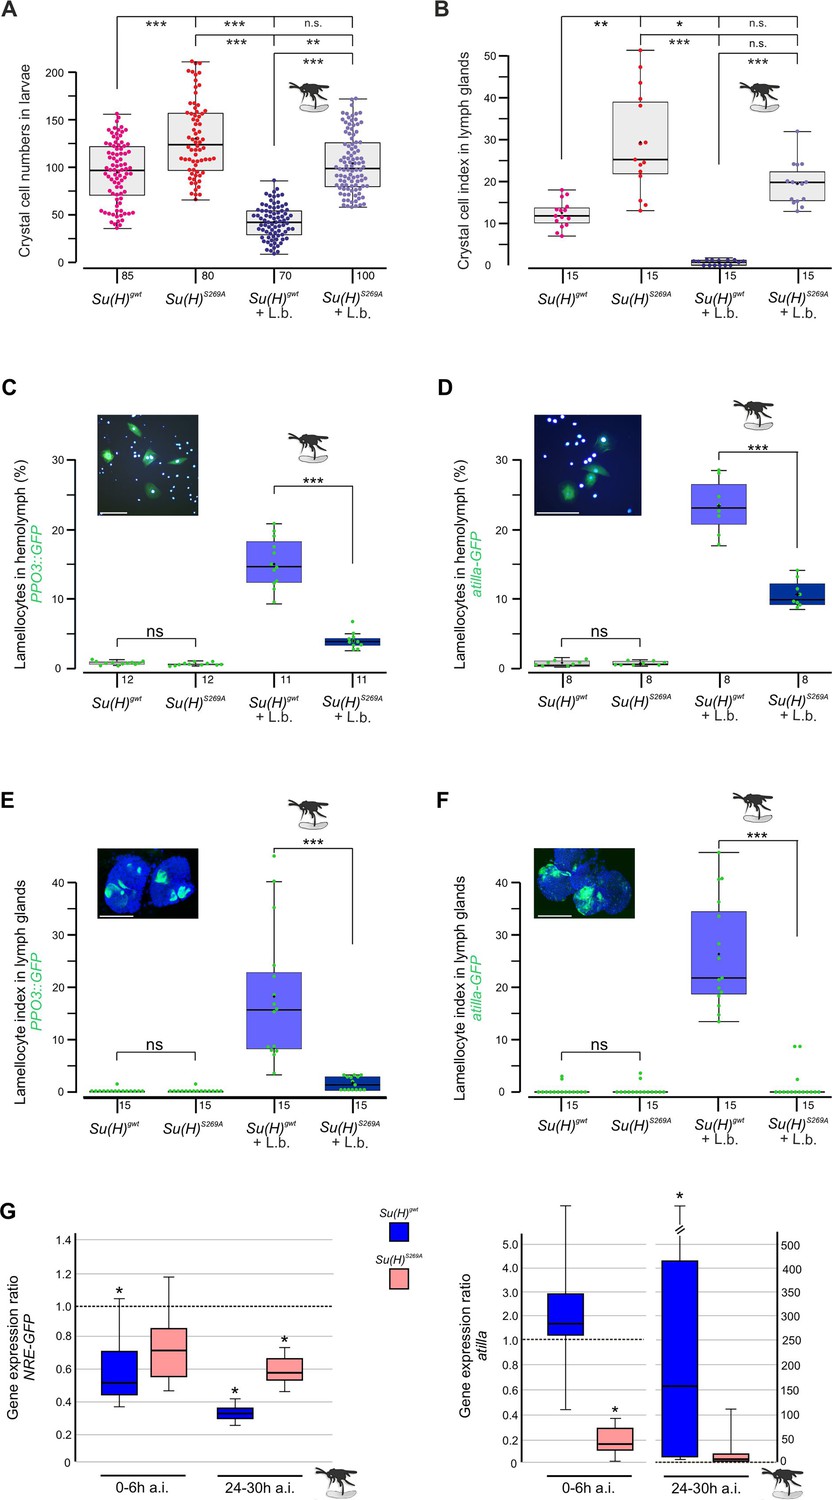
Su(H)S269A mutants are compromised in their response to parasitoid wasp infestation.
(A) Quantification of melanised crystal cells from the last two segments of Su(H)gwt and Su(H)S269A larvae with and without wasp infestation as indicated. In the control, wasp parasitism causes crystal cell numbers to drop to a level of about 50%, whereas in Su(H)S269A mutants the number settles at the uninfested Su(H)gwt level. Each dot represents one analysed larva (n=70–100 as indicated). (B) Crystal cell index in larval lymph glands is given as ratio of Hnt-positive crystal cells per 1° lobe relative to the size of the lobe. Each point represents one analysed lobus (n=15). (A, B) Statistical analyses with Kruskal-Wallis test, followed by Dunn’s test with ***p<0.001, **p<0.01, *p<0.05, ns (not significant p≥0.05). (C–F) Quantification of larval lamellocytes in the circulating hemolymph (C, D) or in lymph glands (E, F) before and after wasp infestation in Su(H)gwt versus Su(H)S269A. Lamellocytes were marked with either PPO3-Gal4::UAS-GFP (C, E) or atilla-GFP (D, F) as indicated. (C, D) The fraction of GFP-labelled lamellocytes of the total number of DAPI-labelled blood cells isolated from hemolymph is given; each dot represents 10 pooled larvae (n=8–10 as shown). Representative image of labelled control hemolymph is shown above (DAPI-labelled nuclei in light blue, GFP in green). Scale bars, 50 µm. (E, F) Lamellocyte index is given as number of GFP-labelled lamellocytes per area in the 1° lobe of the lymph gland. Each dot represents the lamellocyte index of one lobus (n=15). Representative Su(H)gwt lymph glands after wasp infestation are shown, co-stained for nuclear Pzg (in blue). Scale bars, 100 µm. Statistical analyses with unpaired Student’s t-test; only significant differences are indicated (***p<0.001). (A–F) Representative images for each genotype and condition are shown in Figure 1—figure supplement 2. (G) qRT-PCR analyses measuring expression of NRE-GFP (left panel) and atilla (right panel). Transcript levels were quantified from hemolymph isolated from infested larvae at 0–6 hr or 24–30 hr post-infestation as indicated, relative to the untreated Su(H)gwt control. Tbp and cyp33 served as reference genes. Shown data were gained from four biological and two technical replicates each. Left panel: Immediately after wasp infection, NRE-GFP expression dropped significantly in the Su(H)gwt control, and even further to about 30% 24–30 hr post-infection, whereas it remained at 60–70% in the infested Su(H)S269A mutants. Right panel: atilla transcripts remained stable at first in the Su(H)gwt control, to rise dramatically 24–30 hr post-infection, in contrast to Su(H)S269A. Mini-max depicts 95% confidence, mean corresponds to expression ratio. Exact p-values are given in the raw data table. Significance was tested using PFRR from REST (*p<0.05).
-
Figure 1—source data 1
Raw data and statistical analysis.
- https://cdn.elifesciences.org/articles/89582/elife-89582-fig1-data1-v1.xlsx
Figure 1—figure supplement 1
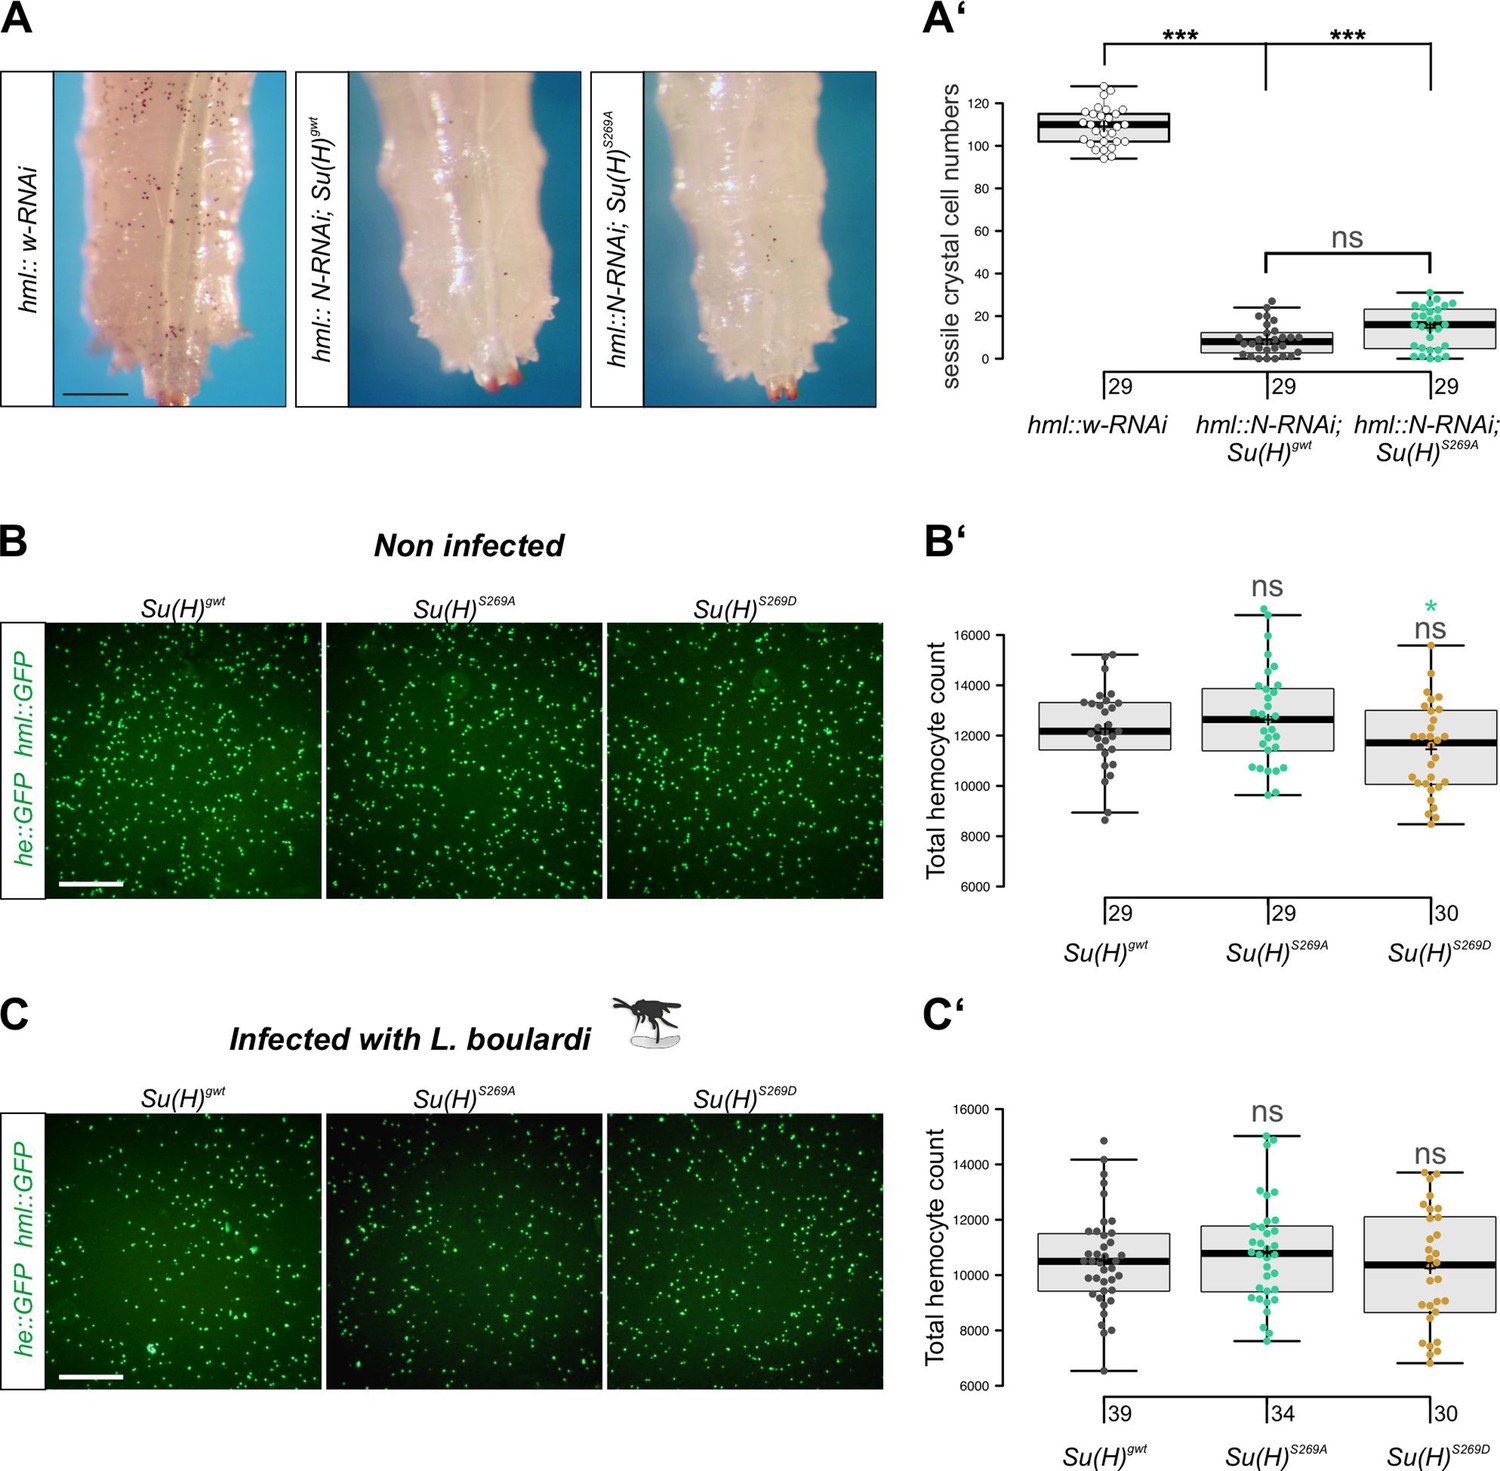
Notch acts upstream of Su(H); minor changes in hemocyte numbers in Su(H)S269 phospho-mutants.
(A, A’) Notch-Su(H)S269A epistasis experiment. RNAi against Notch was induced in the hemocytes with hml-Gal4 (hml::N-RNAi) in either Su(H)gwt or Su(H)S269A background; hml::white-RNAi served as control. (A) Representative pictures of larvae are shown. Scale bar, 250 µm. (A’) Crystal cell numbers were determined in the last two segments of heated third instar larvae (each dot represents one larva; n, as shown). Note the strong drop in crystal cell numbers in the hml::N-RNAi larvae compared to control hml::white-RNAi. There is no significant difference between the Su(H)gwt and Su(H) S269A background. Statistical analyses with Kruskal-Wallis test, followed by Dunn’s multiple comparison test with ***p<0.001 and ns (not significant p≥0.05). (B–C’) Total hemocyte count in uninfected larvae (B, B’) or in larvae 24 hr after infection with L. boulardi (C, C’). (B, C) Hemocytes were visualised by green fluorescence (he::GFP hml::GFP). Representative pictures of hemolymph are shown. Scale bar, 300 µm. (B’, C’) The total number of hemocytes in Su(H)gwt, Su(H)S269A, or Su(H)S269D larvae in each condition was not significantly different, albeit a subtle increase in Su(H)S269A and a subtle decrease in Su(H)S269D was noted. Each dot represents the hemocyte count of one larva; the total number of animals tested is indicated below. Statistical analysis with ANOVA, followed by Tukey’s multiple comparisons test relative to control Su(H)gwt, *p<0.05, ns (not significant p≥0.05).
-
Figure 1—figure supplement 1—source data 1
Raw data and statistical analysis.
- https://cdn.elifesciences.org/articles/89582/elife-89582-fig1-figsupp1-data1-v1.xlsx
Figure 1—figure supplement 2
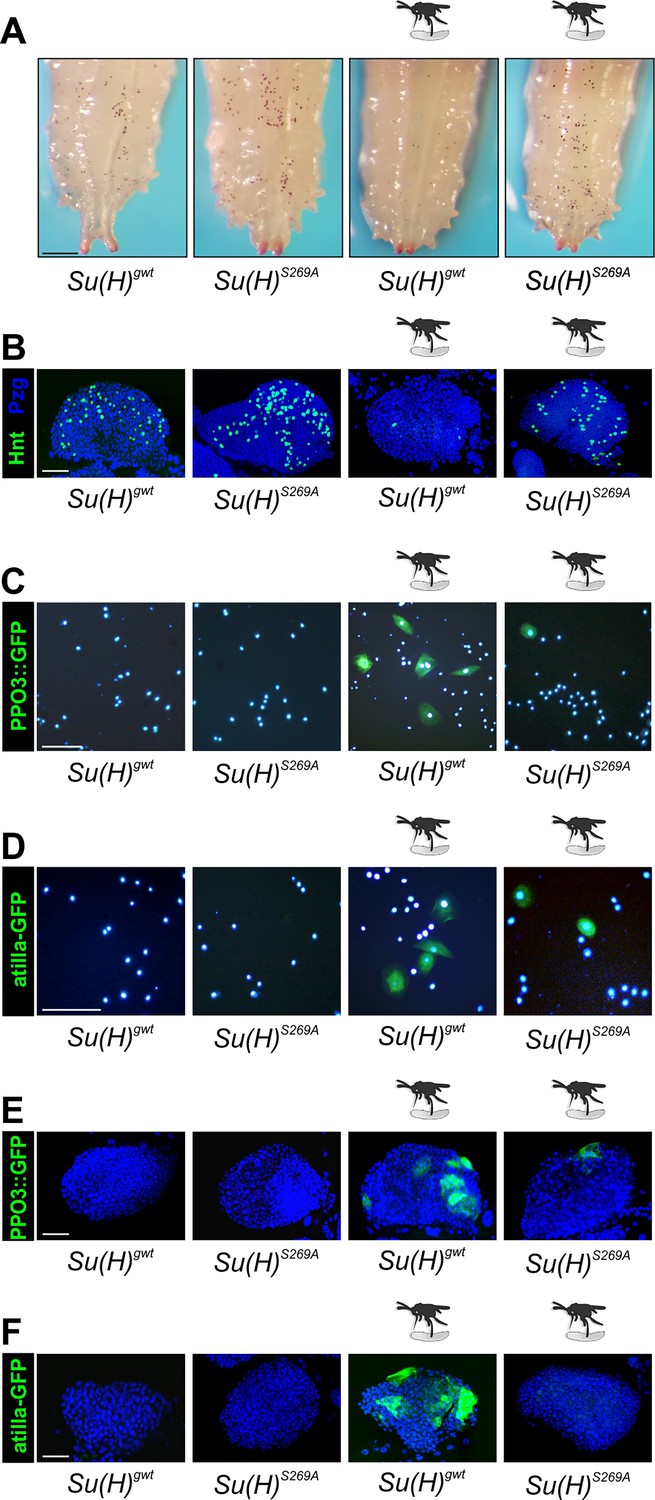
Representative images for the various settings.
(A) Representative images of heated larvae of the given genotype used for crystal cell counting. (B, E, F) Representative images of one lymph gland 1° lobe. Nuclei stained with Pzg antibodies (blue). Labelling of crystal cells (Hnt in B), or of lamellocytes (PPO3::GFP in E, atilla-GFP in F) is shown in green. (C, D) Representative images of hemolymph derived from larvae of the given genotype. Lamellocytes labelled green with PPO3::GFP (C) or atilla-GFP (D); nuclei blue (DAPI). (A–F) Infestation with L. boulardi indicated by the wasp schematic. Scale bar, 250 µm in (A), 50 µm in (B–F).
Figure 2 with 1 supplement
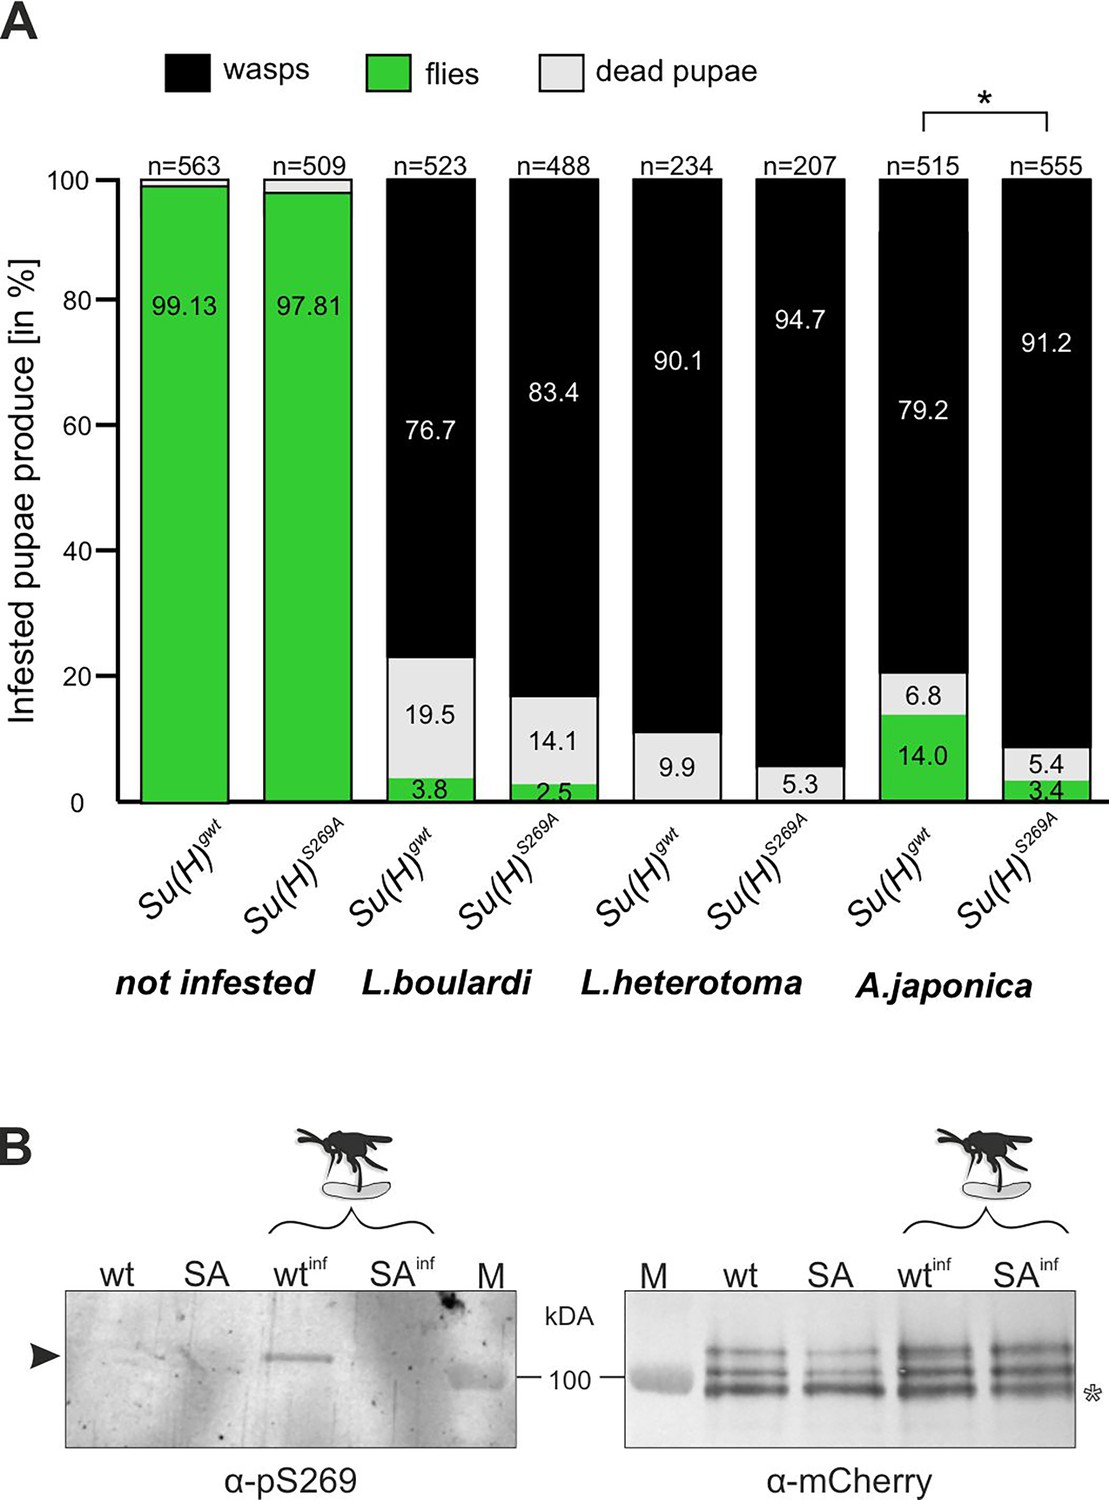
Resistance to wasp infestation and phosphorylation at S269.
(A) Resistance of Su(H)gwt and Su(H)S269A to the infestation with parasitic wasp strains L. boulardi and L. heterotoma (both family Figitidae) and Asobara japonica (family Braconidae), as indicated. Numbers of eclosed flies versus wasps as well as of dead pupae are presented in relation to the total of infested pupae. Left two columns are from non-infested controls. At least three independent experiments were performed, n=number of infested pupae. Statistically significant difference determined by Student’s t-test is indicated with *p<0.05. (B) Su(H) is phosphorylated at Serine 269 upon parasitoid wasp infestation. Protein extracts from Su(H)gwt-mCh (wt) and Su(H)S269A-mCh (SA) larvae, respectively, infested (wtinf, SAinf) with L. boulardi or uninfested, were isolated by RFP-Trap precipitation and probed in western blots. The anti-pS269 antiserum specifically detects wild-type Su(H) protein only in wasp infested larvae (arrowhead), but not the Su(H)S269A isoform. The blot on the right served as loading control, probed with anti-mCherry antibodies, revealing the typical Su(H) protein pattern in all lanes; the lowest band presumably stems from degradation (open asterisk). M, prestained protein ladder, protein size is given in kDa.
-
Figure 2—source data 1
Original, uncropped western blots shown in Figure 2B, probed with anti-pS269 and anti-mCherry, respectively.
- https://cdn.elifesciences.org/articles/89582/elife-89582-fig2-data1-v1.zip
-
Figure 2—source data 2
Original, uncropped western blots shown in Figure 2B, probed with anti-pS269 and anti-mCherry, respectively - with labelling.
Boxed areas correspond to regions shown in the main figure.
- https://cdn.elifesciences.org/articles/89582/elife-89582-fig2-data2-v1.zip
-
Figure 2—source data 3
Raw data and statistical analysis.
- https://cdn.elifesciences.org/articles/89582/elife-89582-fig2-data3-v1.xlsx
Figure 2—figure supplement 1
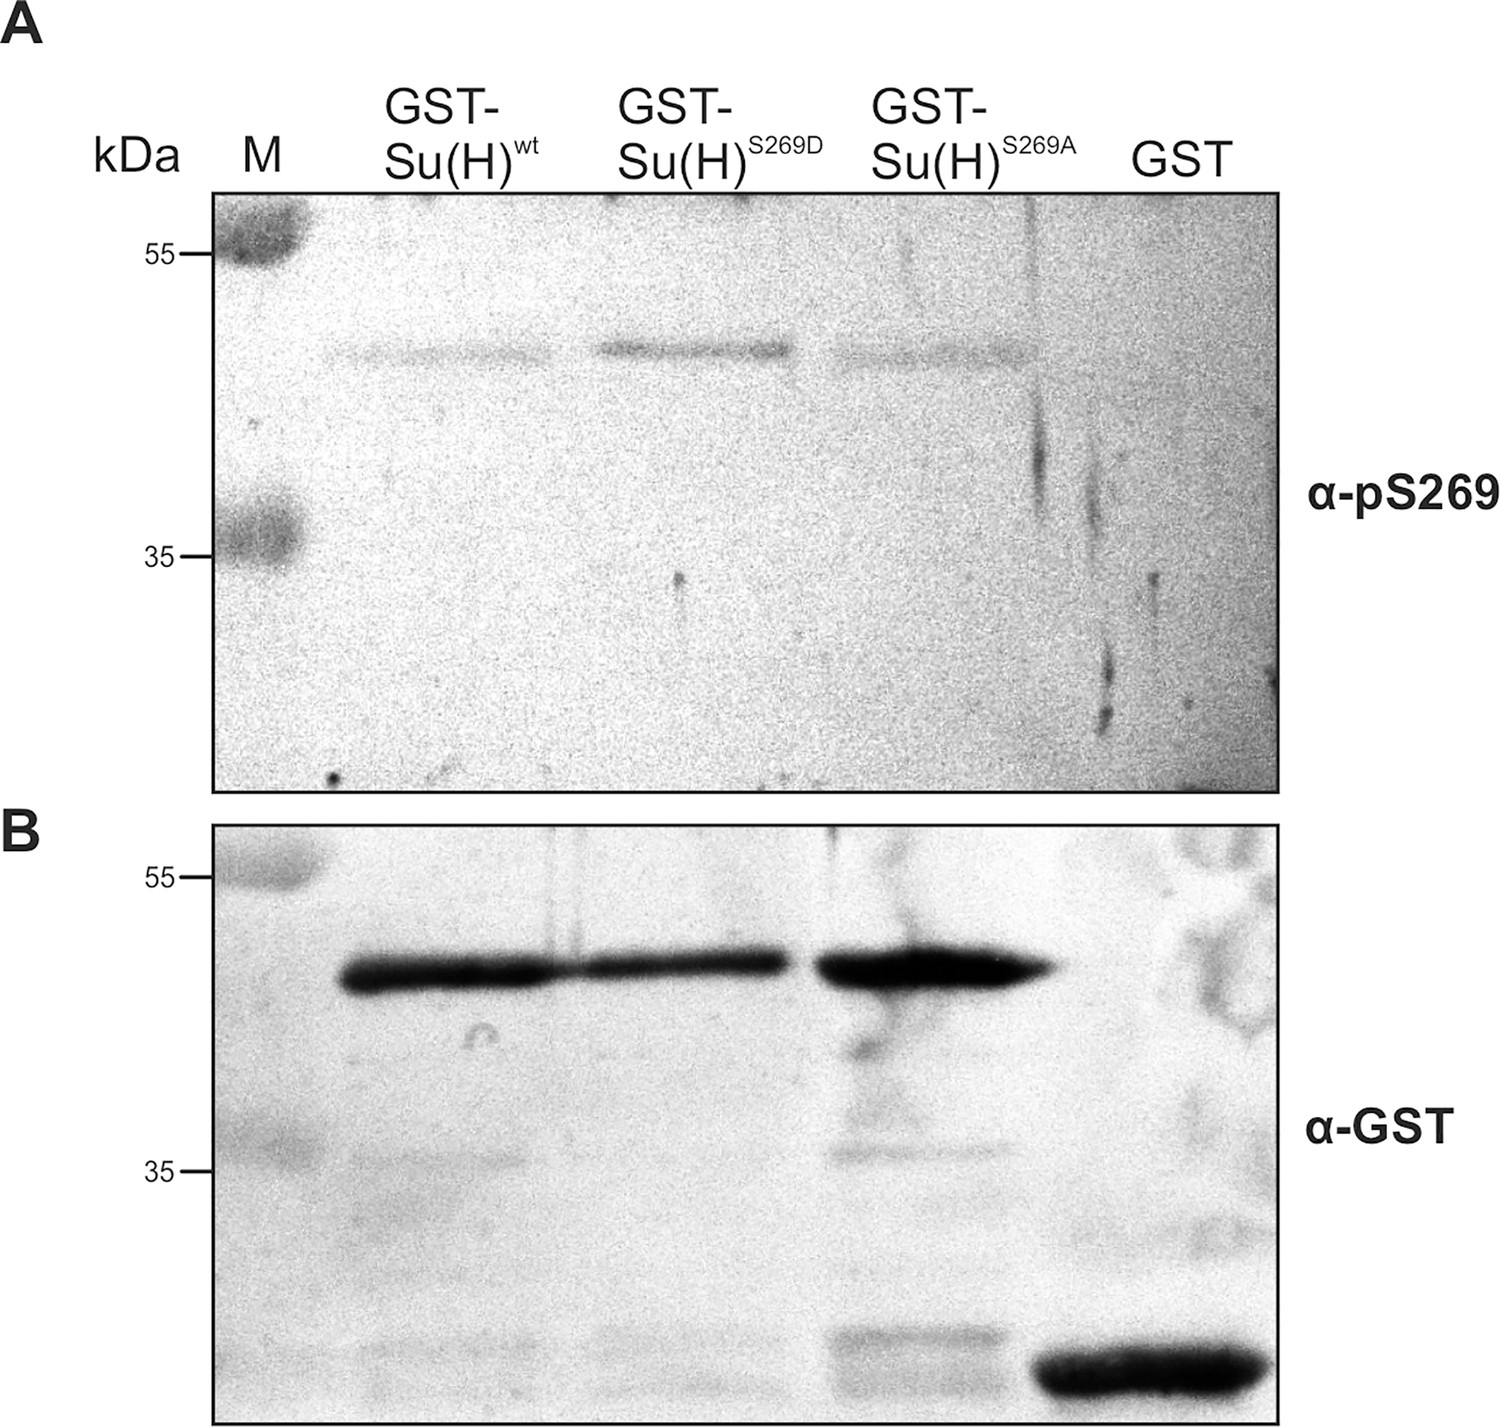
The α-pS269 antiserum detects the phospho-mimetic Su(H) variant in vitro.
(A) Western blot with purified GST-BTD-Su(H) phospho-variants as indicated, as well as GST alone as control. pS269 antibody detects preferentially the phospho-mimetic BTD-Su(H)S269D variant, and to a lesser degree wild-type BTD-Su(H)wt as well as BTD-Su(H)S269A. (B) Same samples detected with α-GST. Note unequal loading: there is more GST-Su(H)wt and GST-Su(H)S269A proteins loaded in comparison to BTD-Su(H)S269D. BTD, beta-trefoil domain.
-
Figure 2—figure supplement 1—source data 1
Original, uncropped western blot.
- https://cdn.elifesciences.org/articles/89582/elife-89582-fig2-figsupp1-data1-v1.zip
-
Figure 2—figure supplement 1—source data 2
Original, uncropped western blot - labelled.
Boxed areas correspond to regions shown in the main figure.
- https://cdn.elifesciences.org/articles/89582/elife-89582-fig2-figsupp1-data2-v1.zip
Figure 3 with 2 supplements
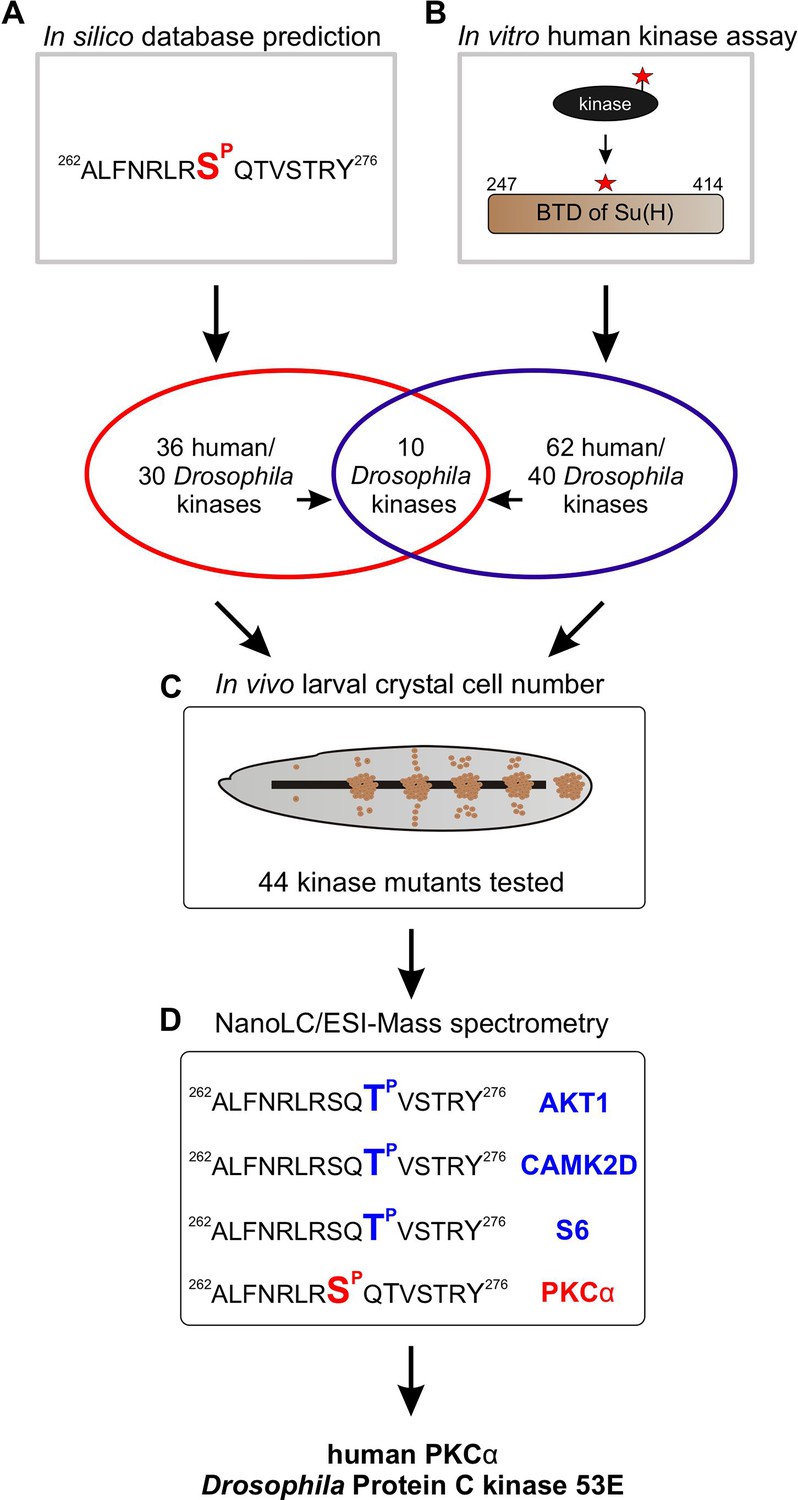
Pipeline of screening procedures for kinase candidates triggering phosphorylation at Su(H)S269.
(A) In silico screening of database(s) predicting kinase recognition motif in Su(H)S269; see Supplementary file 1. (B) In vitro assay screening 245 human Ser/Thr kinases for their ability to phosphorylate the beta-trefoil domain (BTD) domain of Su(H); see Supplementary file 2. (C) In vivo screen of 44 different Drosophila kinase mutants for crystal cell occurrence in third instar larvae; see Supplementary file 3, Supplementary file 4, and Figure 3—figure supplement 1. (D) NanoLC/ESI mass spectrometry with active human kinases monitoring their ability to phosphorylate the given Su(H) peptide. PKCα phosphorylates S269, whereas AKT1, CAMK2D, and S6 kinase prefer T271. Spectra are shown in Figure 3—figure supplement 2.
Figure 3—figure supplement 1
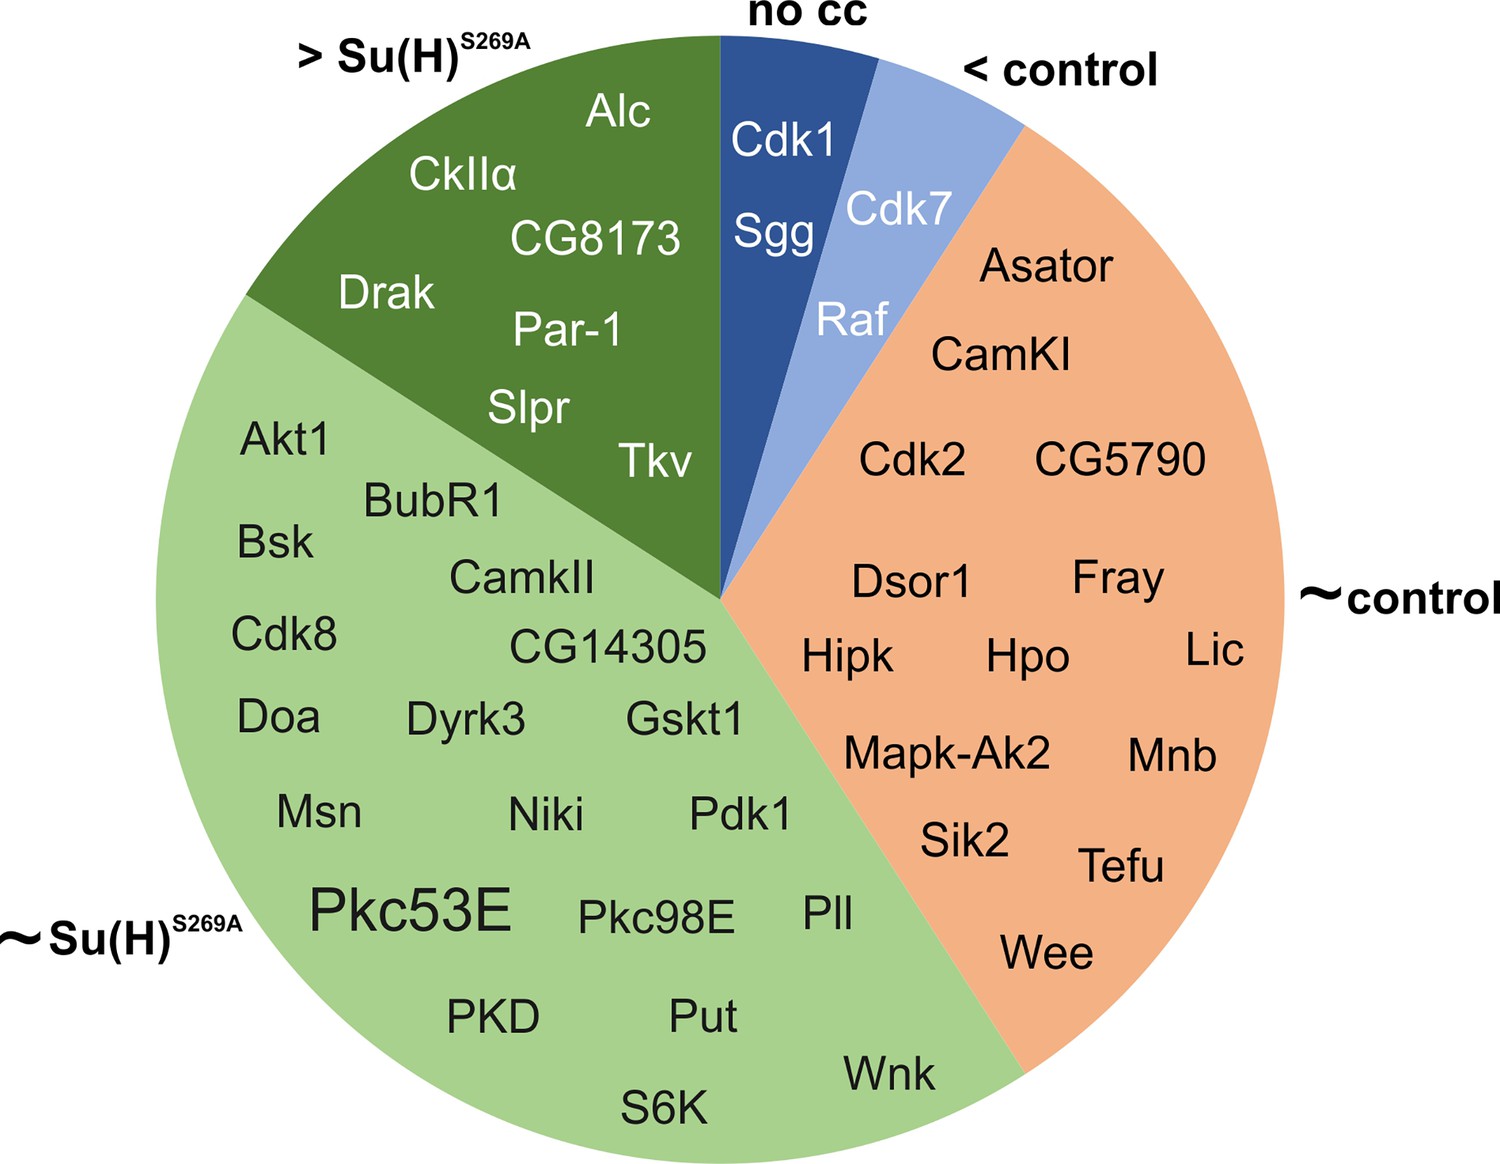
Overview of the results from the kinase screen.
Crystal cell numbers recorded in the respective kinase mutants served the classification. Dark blue: no crystal cells; light blue: reduced number of crystal cells; orange: numbers match the control; light green: numbers match Su(H)S269A mutants; dark green: numbers largely exceed the Su(H)S269A mutants. More details are found in Supplementary file 4.
Figure 3—figure supplement 2
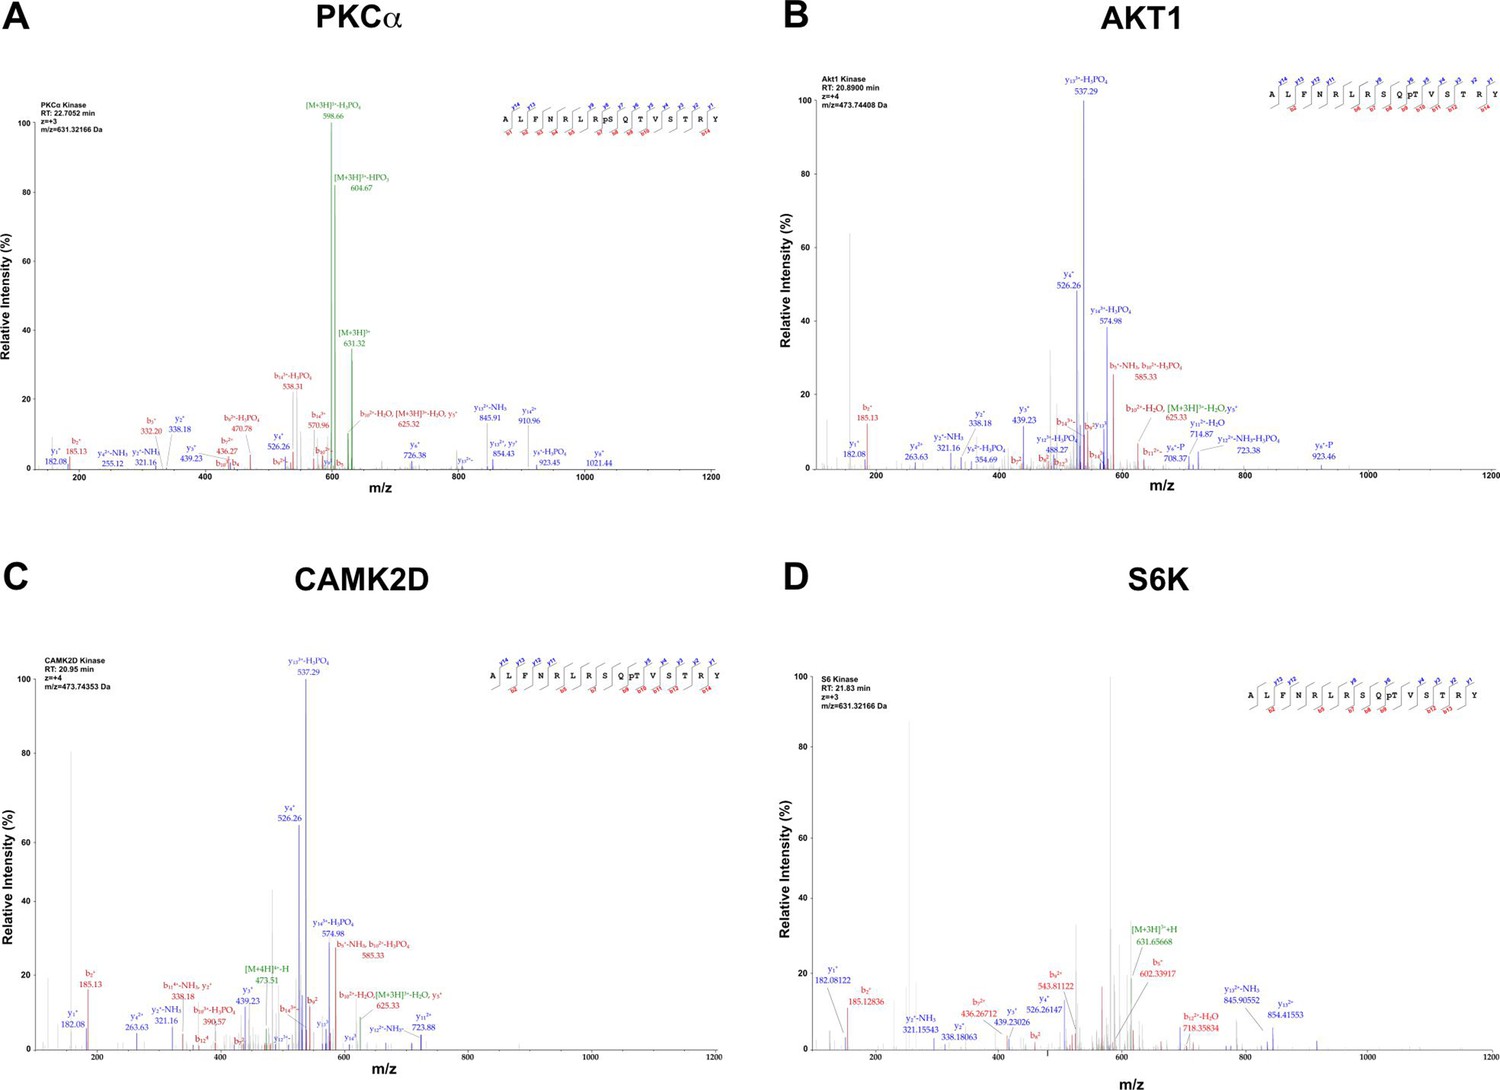
MS/MS spectra of the phosphorylated Su(H) peptide.
(A) MS/MS spectrum on the Su(H) phosphopeptide 262-ALFNRLRpSQTVSTRY-276 after treatment with activated human kinases PKC⍺. (B–D) MS/MS spectra of the Su(H) phosphopeptide 262-ALFNRLRSQpTVSTRY-276 after incubation with activated human AKT1 (B), CAMK2D (C), and S6 kinase (D), respectively. The phosphorylation at S8, corresponding to S269 and at T10, corresponding to T271 in Su(H) was confirmed by b- and y-ion series as indicated in blue and red, respectively. Neutral loss reactions of H2O and H3PO4 from the precursor peptide are indicated in green.
Figure 4 with 1 supplement
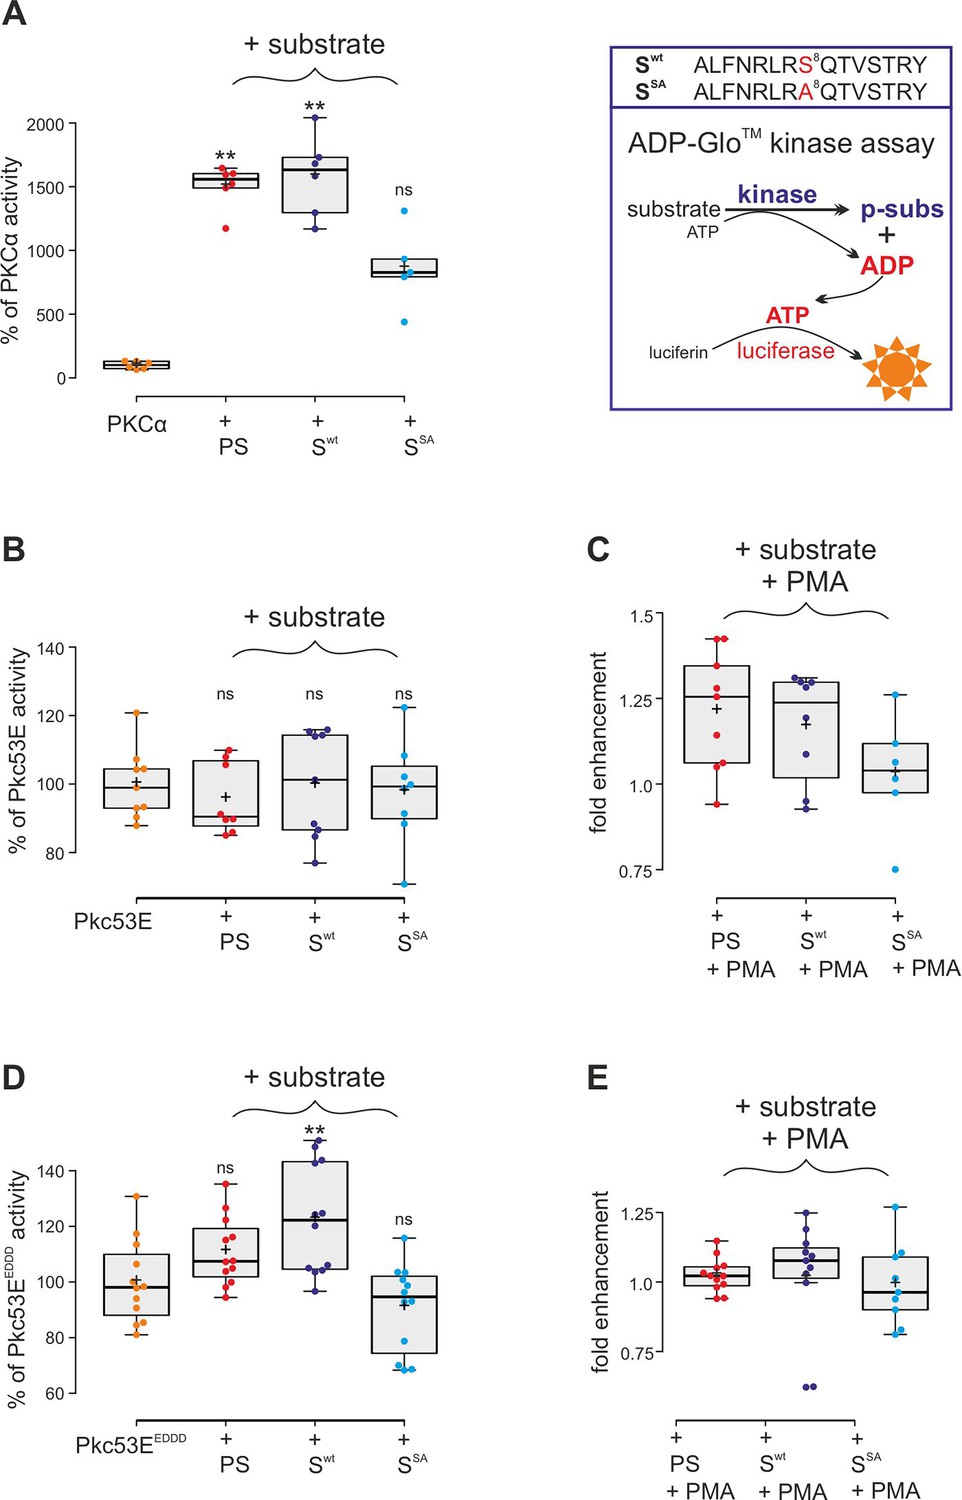
Kinase assays using activated PKCα and Drosophila Pkc53E variants.
(A) Right, schema of ADP-Glo assay to quantify kinase activity. The wild-type (Swt) and mutant (SSA) Su(H) peptides 262–276 offered as specific kinase substrates are indicated above. Left, the commercially available, active human PKCα very efficiently phosphorylates the pseudosubstrate PS and the Su(H) Swt peptide, but less efficiently the SSA mutant peptide. Activity is given as percentage of the auto-active kinase without substrate. Each dot represents one experiment (n=5-6). (B) Bacterially expressed Pkc53E has no activity on any of the offered substrates PS, Swt, or SSA (n=8-9). (C) PMA (phorbol 12-myristate 13-acetate) raised Pkc53E activity to nearly 125% for PS and Swt but not for SSA (n=6-9). (D) Activated Pkc53EDDD phosphorylates PS and Swt but not for SSA (n=12). (E) Addition of PMA does not change Pkc53EDDD activity (n=9-12). Statistical analyses were performed with Kruskal-Wallis test followed by Dunn’s test (A, C, E) or ANOVA followed by Tukey’s approach in (B, D) with **p<0.01, ns (not significant p≥0.05).
-
Figure 4—source data 1
Raw data and statistical analysis.
- https://cdn.elifesciences.org/articles/89582/elife-89582-fig4-data1-v1.xlsx
Figure 4—figure supplement 1
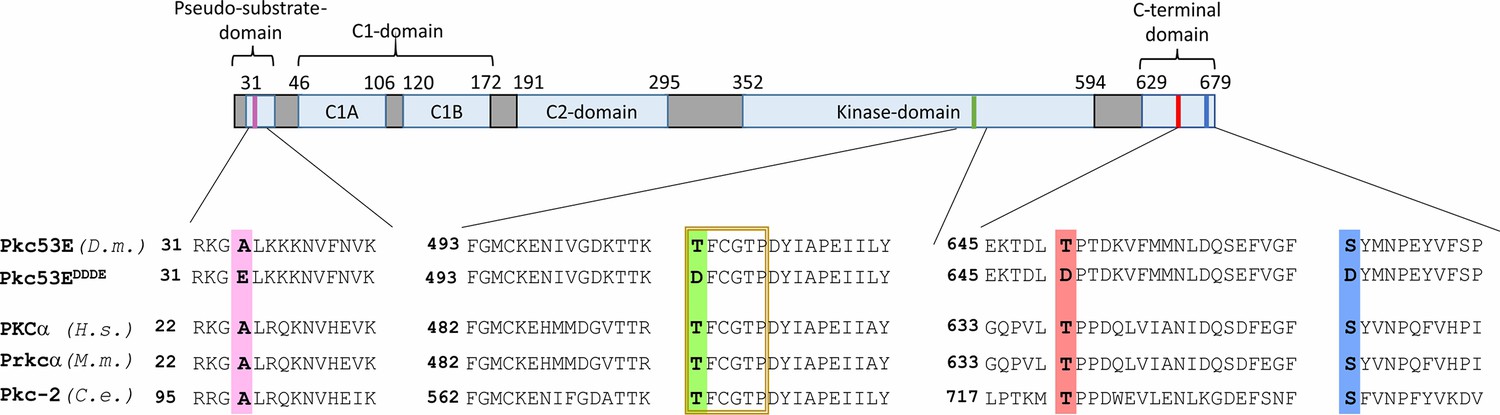
Conservation of Pkc53E and generation of an activated Pkc53EEDDD isoform.
The typical PKC structure is shown, including the highly conserved pseudosubstrate domain at the N-terminus, the cofactor sensitive C1- and C2-domains, the catalytically active kinase domain and the C-terminal domain, harbouring the activation centre. A comparison of these conserved domains including Pkc53E from D. melanogaster (D.m.), PKCα from Homo sapiens (H.s.), Prkcα from Mus musculus (M.m.), and Pkc-2 from Caenorhabditis elegans (C.e.) is depicted. Highlighted in colour are the amino acids phosphorylated in the course of PKC activation, as well as their exchange to an aspartate (D) or glutamate (E) residue in the activated Pkc53EEDDD mutant isoform.
Figure 5 with 1 supplement
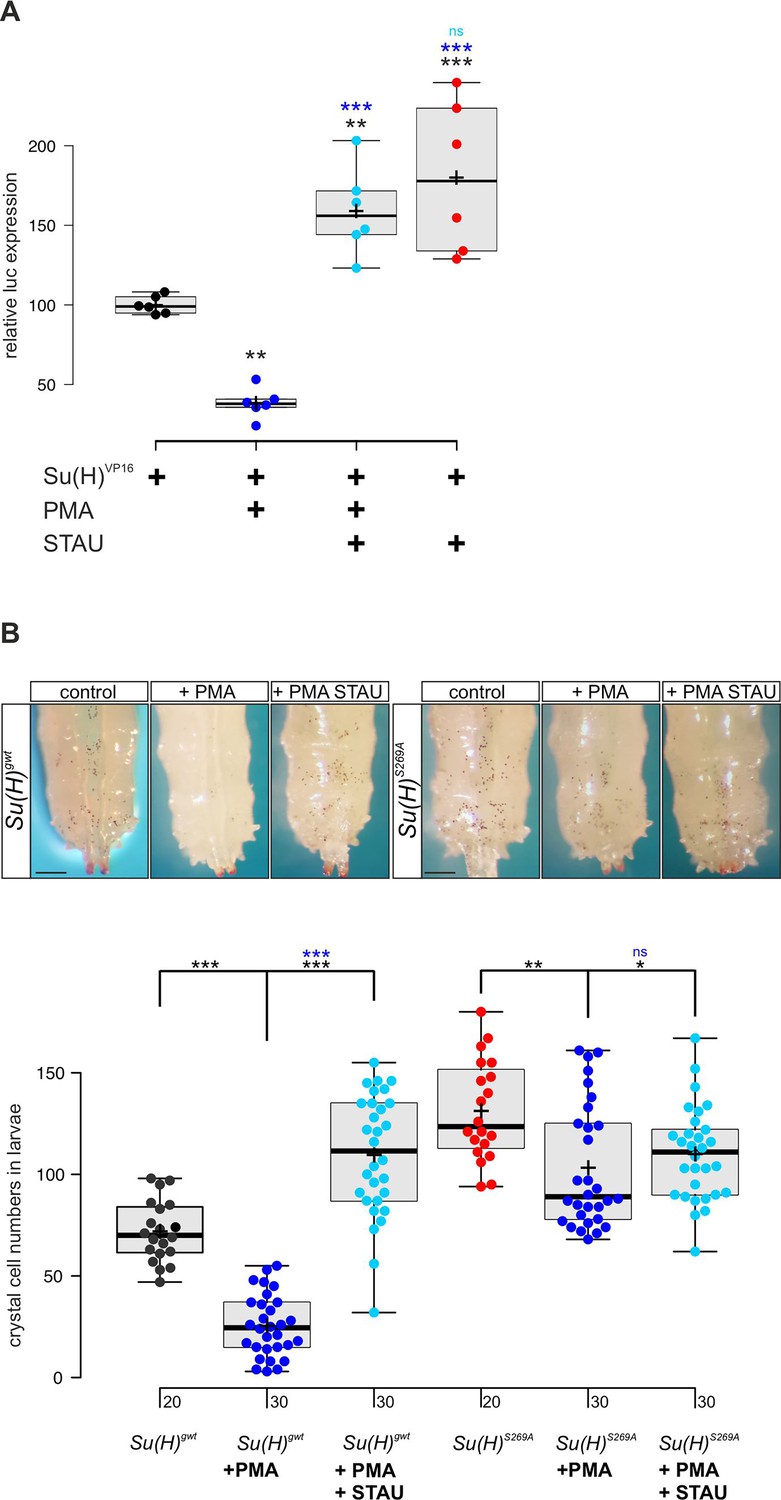
PMA (phorbol 12-myristate 13-acetate) inhibits Su(H) transcriptional activity in vitro and crystal cell formation in vivo.
(A) Expression of NRE-luciferase reporter gene in RBPjko HeLa cells, transfected with 2xMyc-Su(H)-VP16 [Su(H)VP16]. Luciferase activity is given relative to the reporter construct normalised to Su(H)-VP16 set to 100%. Addition of PMA causes reduction of Su(H)-VP16-dependent transcriptional activity to about 40%, which is reversed by the kinase inhibitor staurosporine (STAU). STAU itself results in increased Su(H)-VP16 activity. Each dot represents one experiment (n=6). Statistical analysis was performed with ANOVA followed by Dunnet’s multiple comparison test with ***p<0.001, **p<0.01 relative to Su(H)-VP16 alone (black asterisks) or to Su(H)-VP16 plus PMA (blue asterisks). (B) Number of melanised larval crystal cells determined in the last two segments of larvae fed with fly food plus 10% DMSO (control), or with fly food supplemented with 1 mM PMA, or 1 mM PMA plus 0.2 mM STAU (n=20 or n=30, as indicated). Note strong drop of crystal cell numbers in the Su(H)gwt control fed with PMA, and a reversal by STAU addition even above control levels. In contrast, PMA has a small effect on crystal cell number in the Su(H)S269A mutant, which is reversed by STAU. Representative animals are shown above; scale bar, 250 µm. Statistical analysis was performed by ANOVA followed by Tukey’s multiple comparison test (***p<0.001), significant differences are colour coded.
-
Figure 5—source data 1
Raw data and statistical analysis.
- https://cdn.elifesciences.org/articles/89582/elife-89582-fig5-data1-v1.xlsx
Figure 5—figure supplement 1
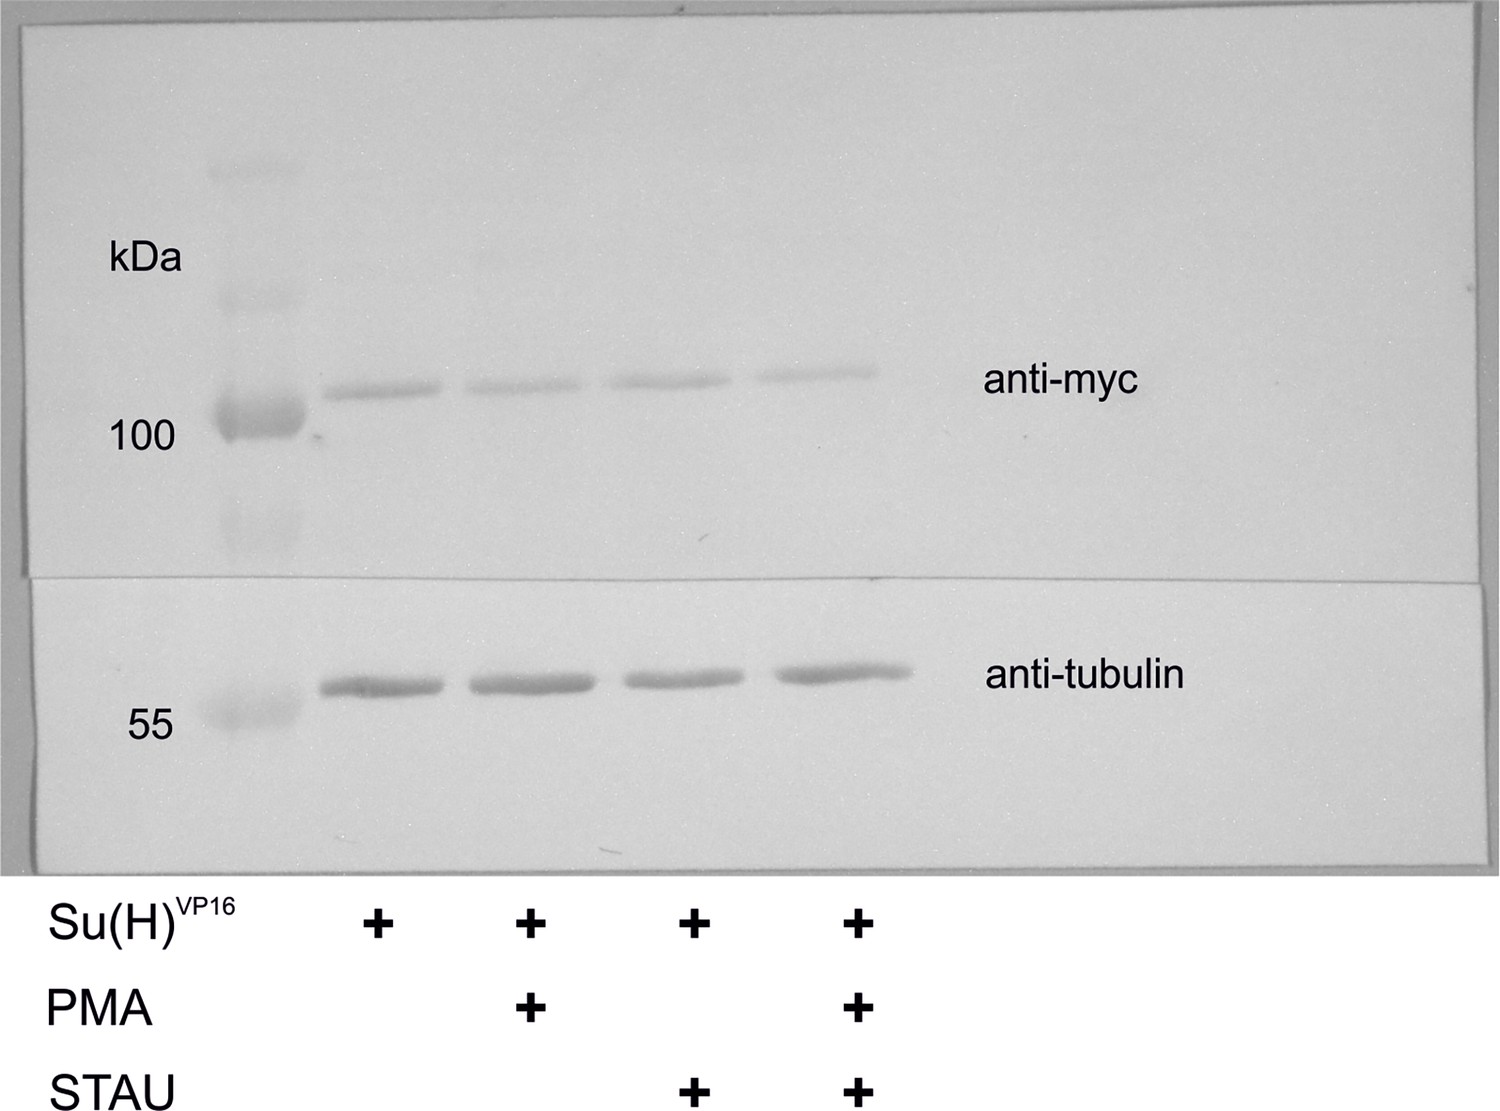
Expression of Su(H)VP16-myc is not influenced by PMA (phorbol 12-myristate 13-acetate) or staurosporine (STAU).
Western blot of HeLa RBPjko cells, transfected with Su(H)VP16-myc and treated with PMA and/or STAU as indicated. Expression of Su(H)VP16 was detected with anti-myc antibodies; beta-tubulin expression served as loading control. The blot was sliced before independent treatment with the two antibodies; the entire blot is shown.
-
Figure 5—figure supplement 1—source data 1
Original western blot.
- https://cdn.elifesciences.org/articles/89582/elife-89582-fig5-figsupp1-data1-v1.zip
-
Figure 5—figure supplement 1—source data 2
Original western blot, labelled.
- https://cdn.elifesciences.org/articles/89582/elife-89582-fig5-figsupp1-data2-v1.zip
Figure 6 with 2 supplements
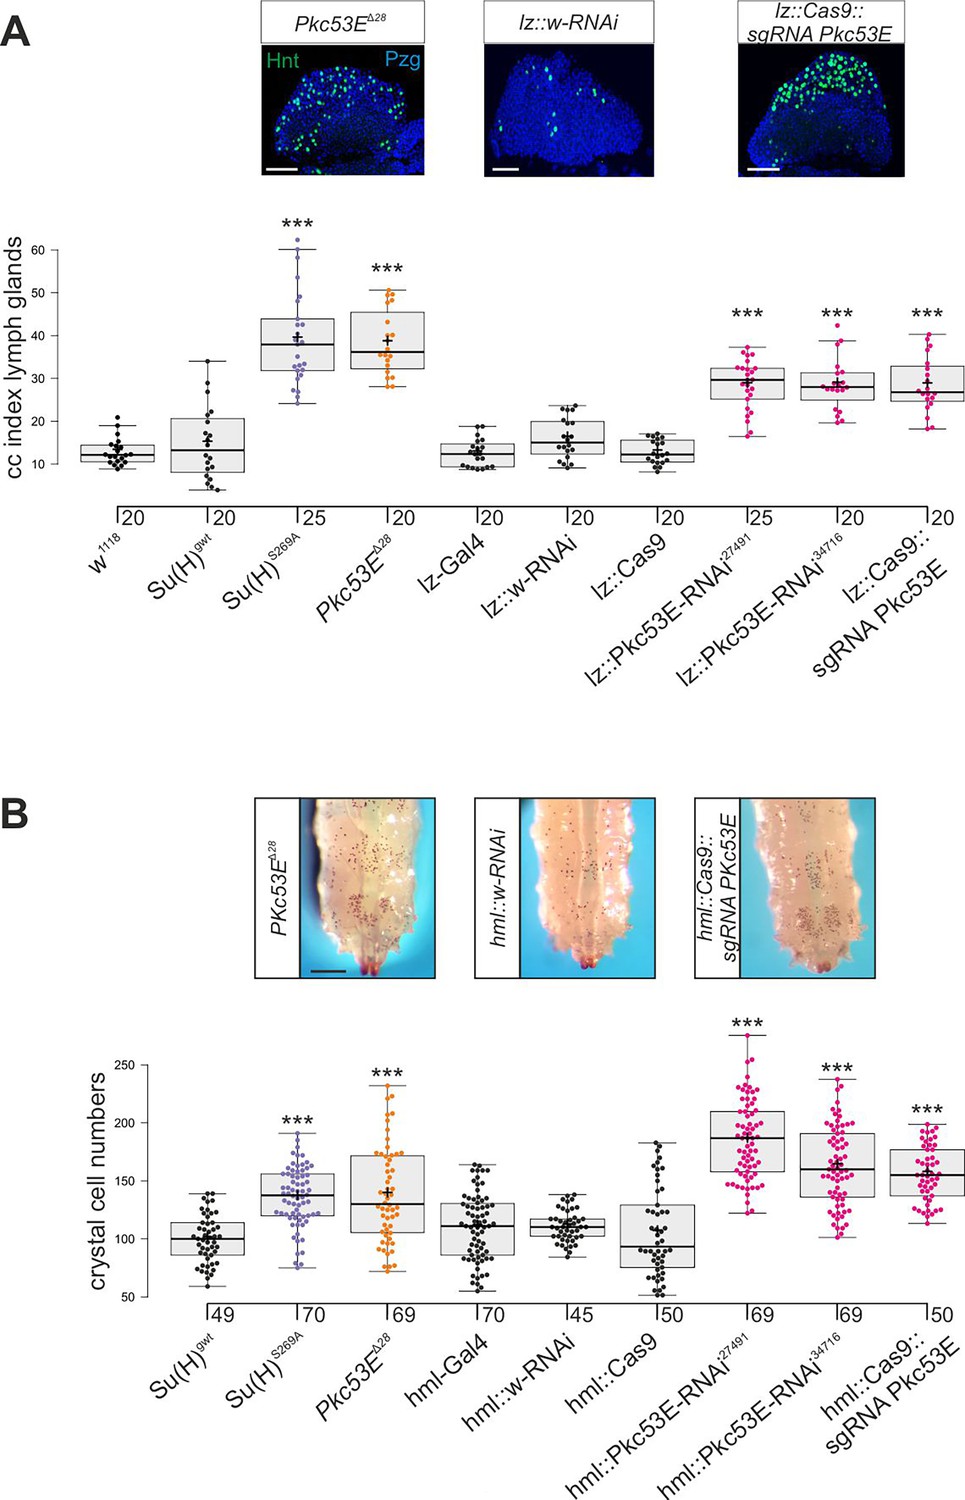
Loss of Pkc53E causes a gain of crystal cell number.
Depletion of Pkc53E activity in the Pkc53EΔ28 mutant or after knockdown by Pkc53E-RNAi or sgPkc53E with the help of the Gal4-UAS system using lz-Gal4 (A) or hml-Gal4 (B). Controls as indicated. (A) Crystal cell index in lymph glands; each dot represents the value of an analysed lobus (n=20 or n=25, as indicated). Examples of Pkc53EΔ28, lz::Pkc53-RNAi, and lz::Cas9 sgPkc53E are shown above. Crystal cells are labelled with Hnt (green), the lobe is stained with α-Pzg (blue). Scale bar, 50 µm. Representative images of lymph glands for each genotype are shown in Figure 6—figure supplement 2A. Statistical analysis by ANOVA followed by Tukey’s multiple comparison test relative to controls with ***p<0.001. (B) Melanised crystal cells enumerated from the last two segments of larvae with the given genotype (n=45–70 as indicated). Examples of respective Pkc53EΔ28, lz::Pkc53-RNAi, and lz::Cas9 sgPkc53E larvae are shown above. Scale bar, 250 µm. Representative larval images for each genotype are shown in Figure 6—figure supplement 2B. Statistical analysis by Kruskal-Wallis test, followed by Dunn’s test relative to controls with ***p<0.001. Note that there were no significant differences between any of the controls shown in black.
-
Figure 6—source data 1
Raw data and statistical analysis.
- https://cdn.elifesciences.org/articles/89582/elife-89582-fig6-data1-v1.xlsx
Figure 6—figure supplement 1
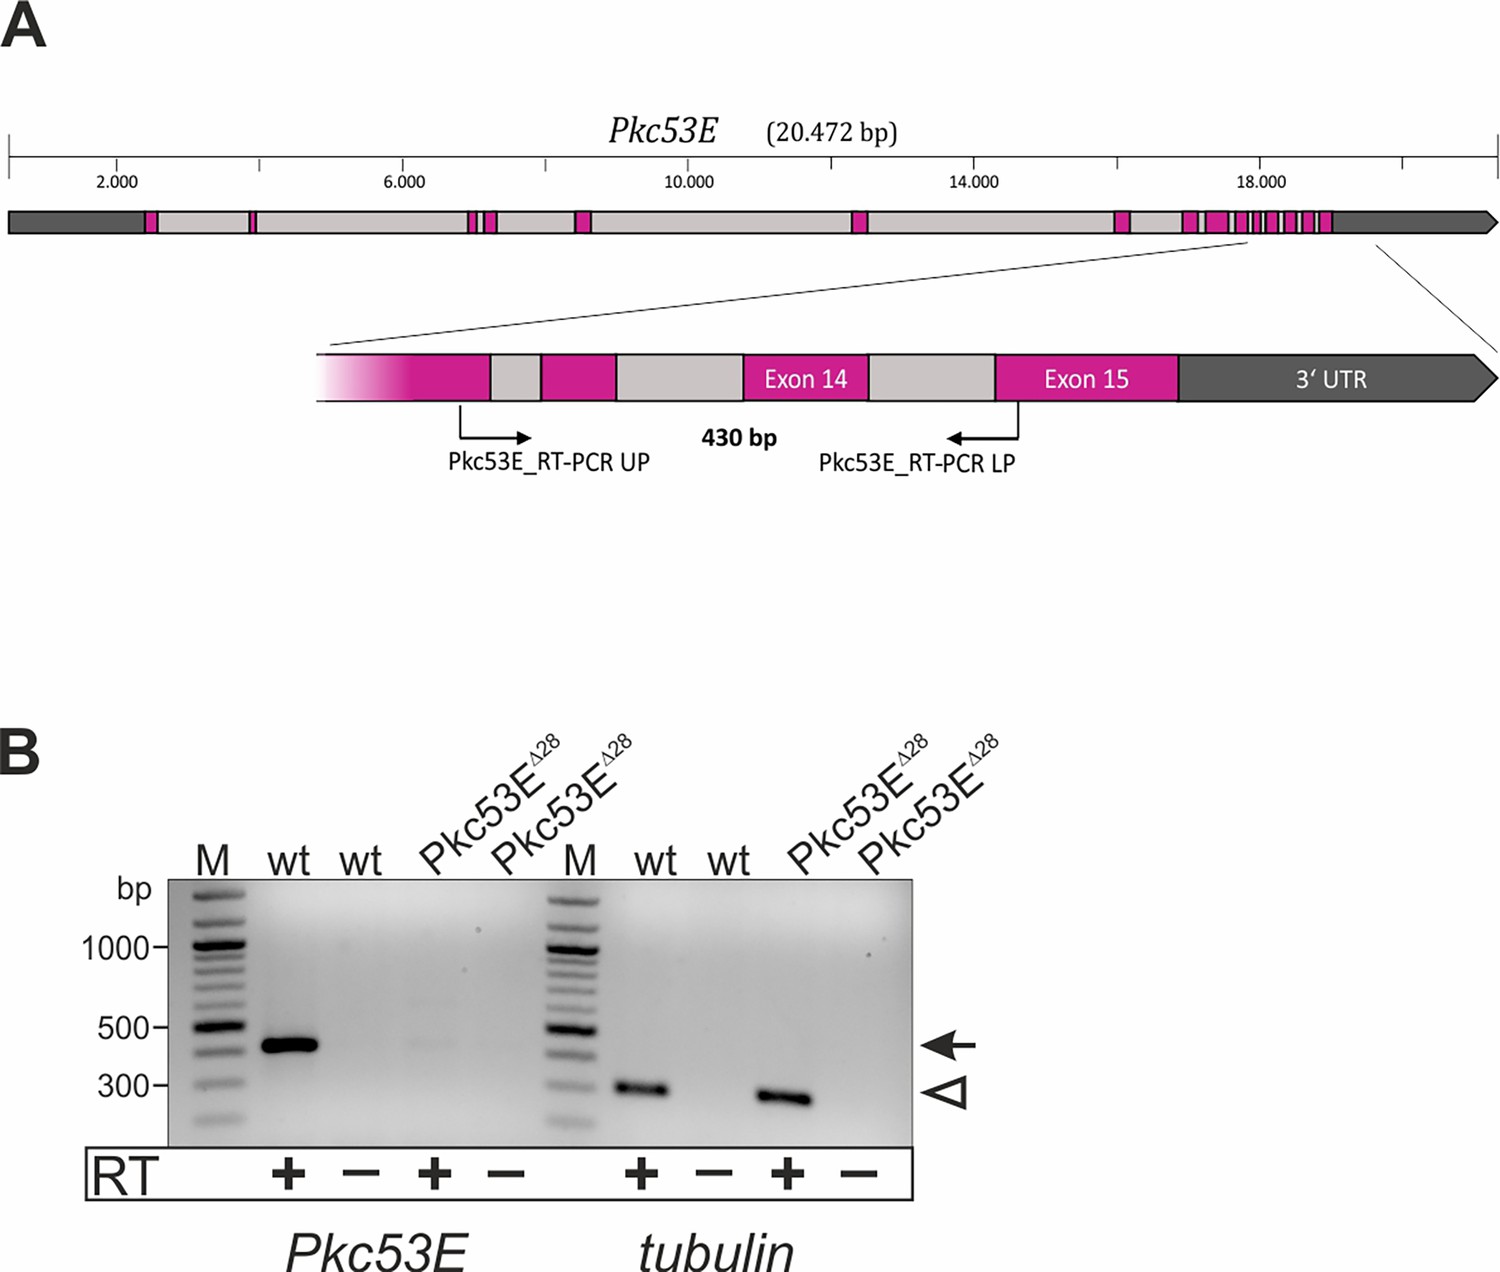
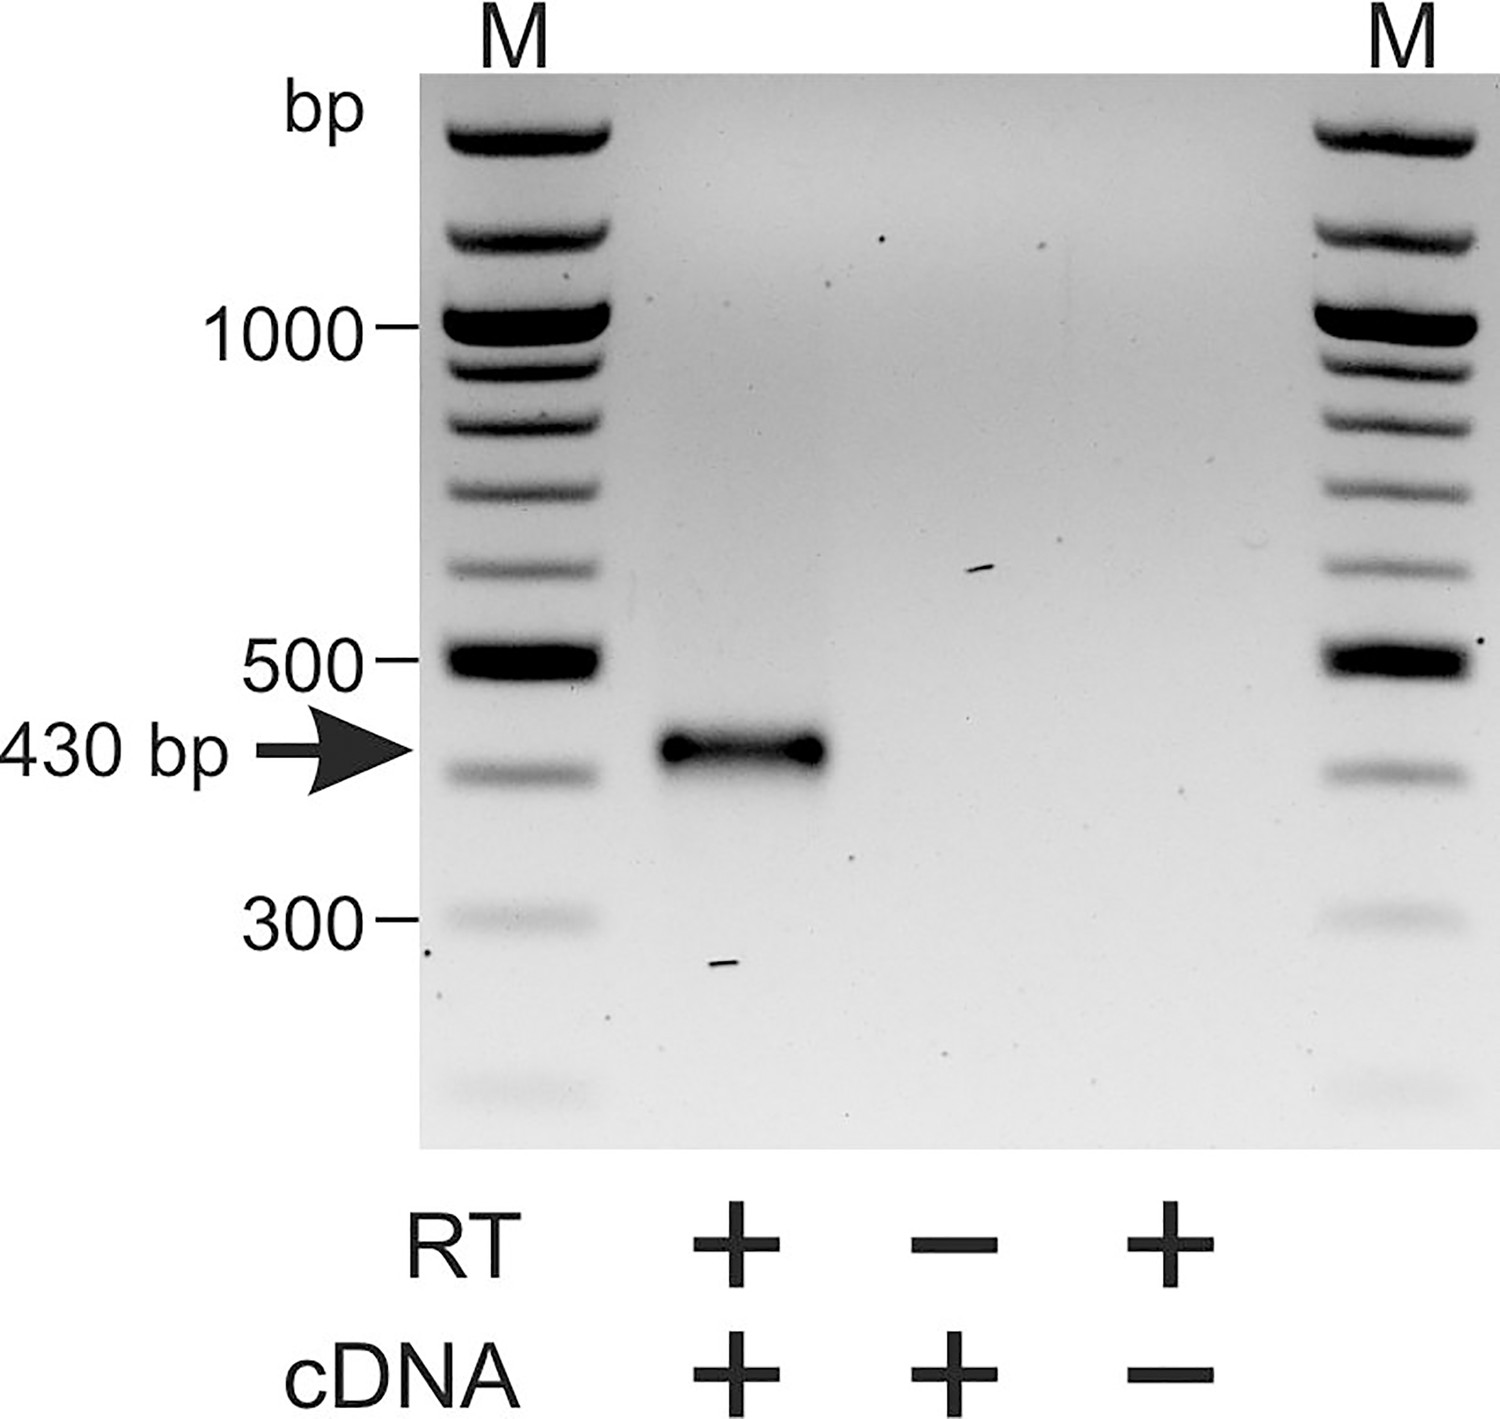
The Pkc53EΔ28 allele is a null mutant.
(A) Genomic map of the Pkc53E locus covering in total more than 20 kilo bases. Numbers above give the size of the whole locus on the right arm of the second chromosome. Exons are shown as magenta boxes, introns as light grey boxes; untranslated regions (UTR) in dark grey. The region amplified in the RT-PCR is enlarged underneath. Primers were chosen to overlap the last three introns of Pkc53E. (B) RT-PCR performed on RNA of each 50 Pkc53EΔ28 and y1 w67c23 control larvae (wt), respectively, with (+) and without (-) reverse transcriptase. Primer pairs Pkc53E_RT-PCR UP/LP overlap the last three introns of Pkc53E, resulting in a product of 430 bp (arrow). Tubulin served as control for intact mRNA (tubulin, expected product 299 bp, open arrowhead). M, size standard (1000 bp, 500 bp, and 300 bp are labelled for reference). Pkc53E transcript was detected in the wt control, but not in Pkc53EΔ28, demonstrating the mutant to be null.
-
Figure 6—figure supplement 1—source data 1
Original agarose gel showing RT-PCR of Pkc53EΔ28 mutant including relevant controls.
- https://cdn.elifesciences.org/articles/89582/elife-89582-fig6-figsupp1-data1-v1.zip
-
Figure 6—figure supplement 1—source data 2
Original agarose gel showing RT-PCR of Pkc53EΔ28 mutant including relevant controls - labelled.
Boxed area corresponds to region shown in the main figure.
- https://cdn.elifesciences.org/articles/89582/elife-89582-fig6-figsupp1-data2-v1.zip
Figure 6—figure supplement 2
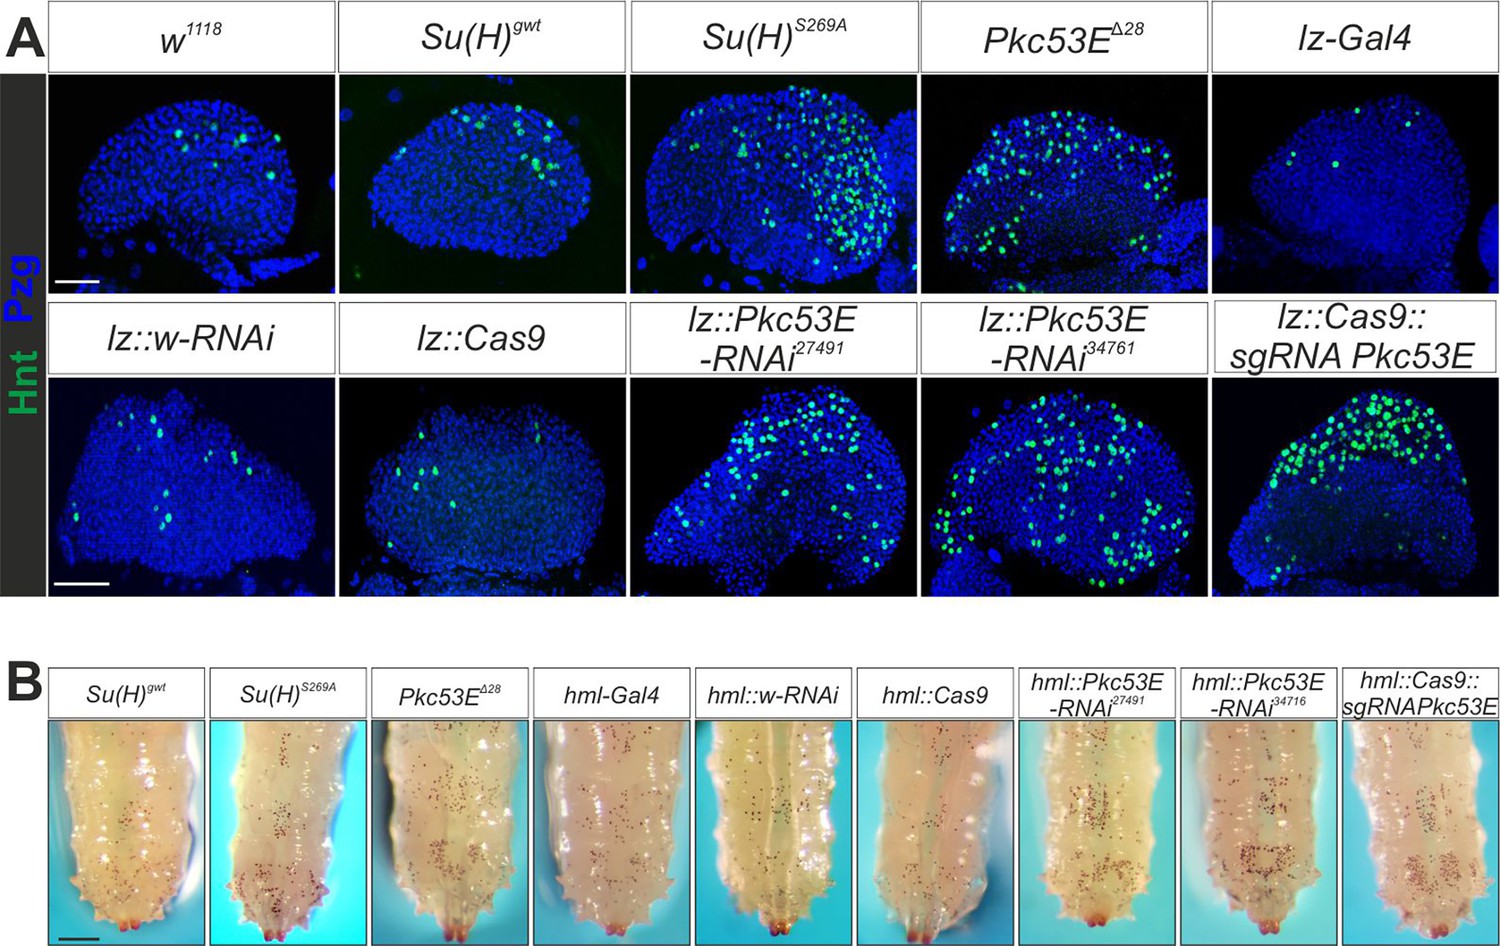
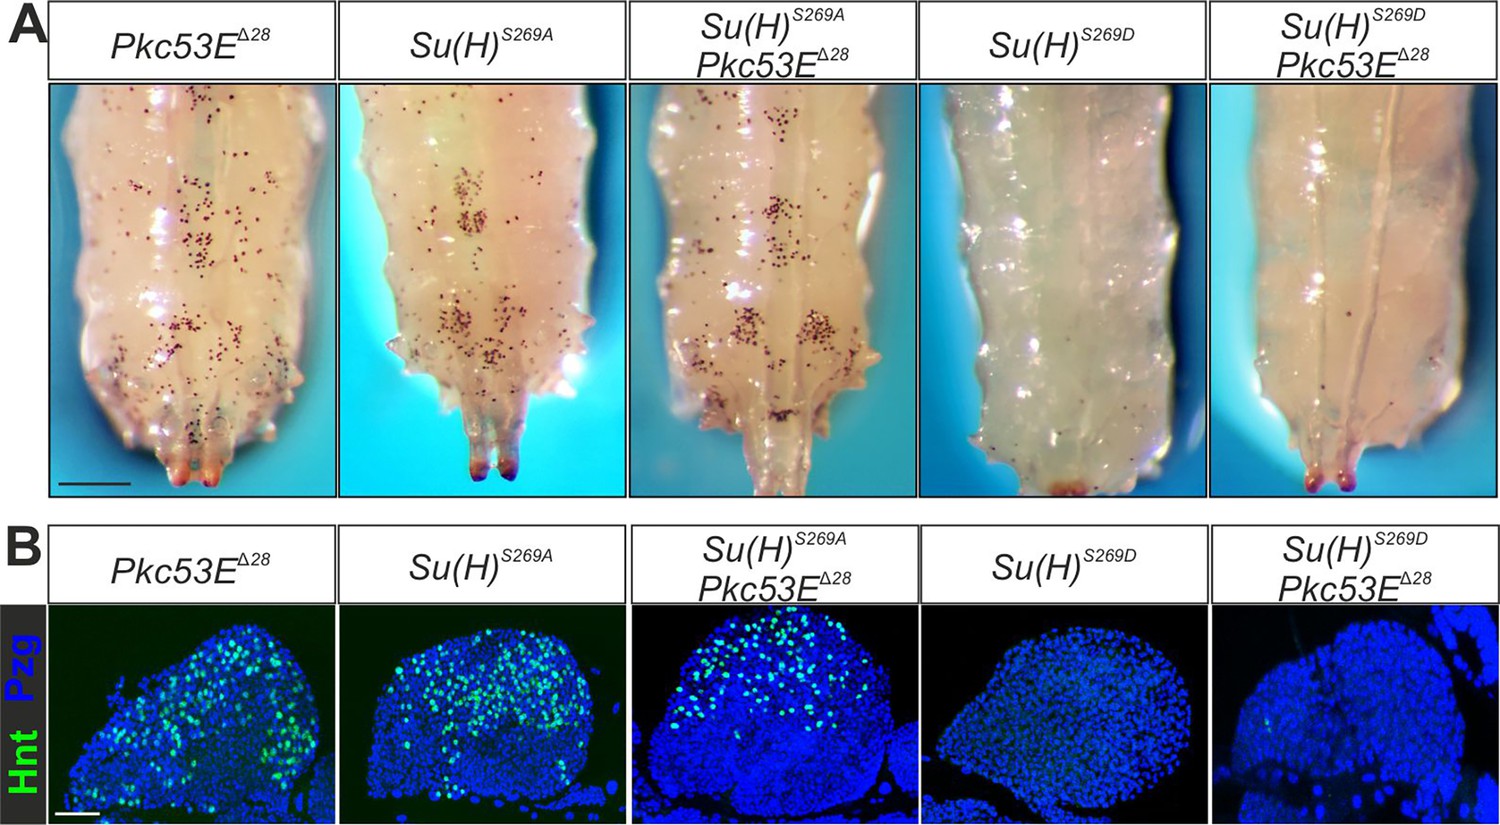
Representative images for the various settings.
(A) Representative images of one 1° lobe of the lymph gland derived from larvae of the given genotype. Crystal cells were stained with anti-Hnt (green) and nuclei with anti-Pzg (blue). Scale bar, 50 µm. (B) Representative images of heat-induced larvae of the given genotype used for crystal cell counts. Scale bar, 250 µm.
Figure 7 with 1 supplement
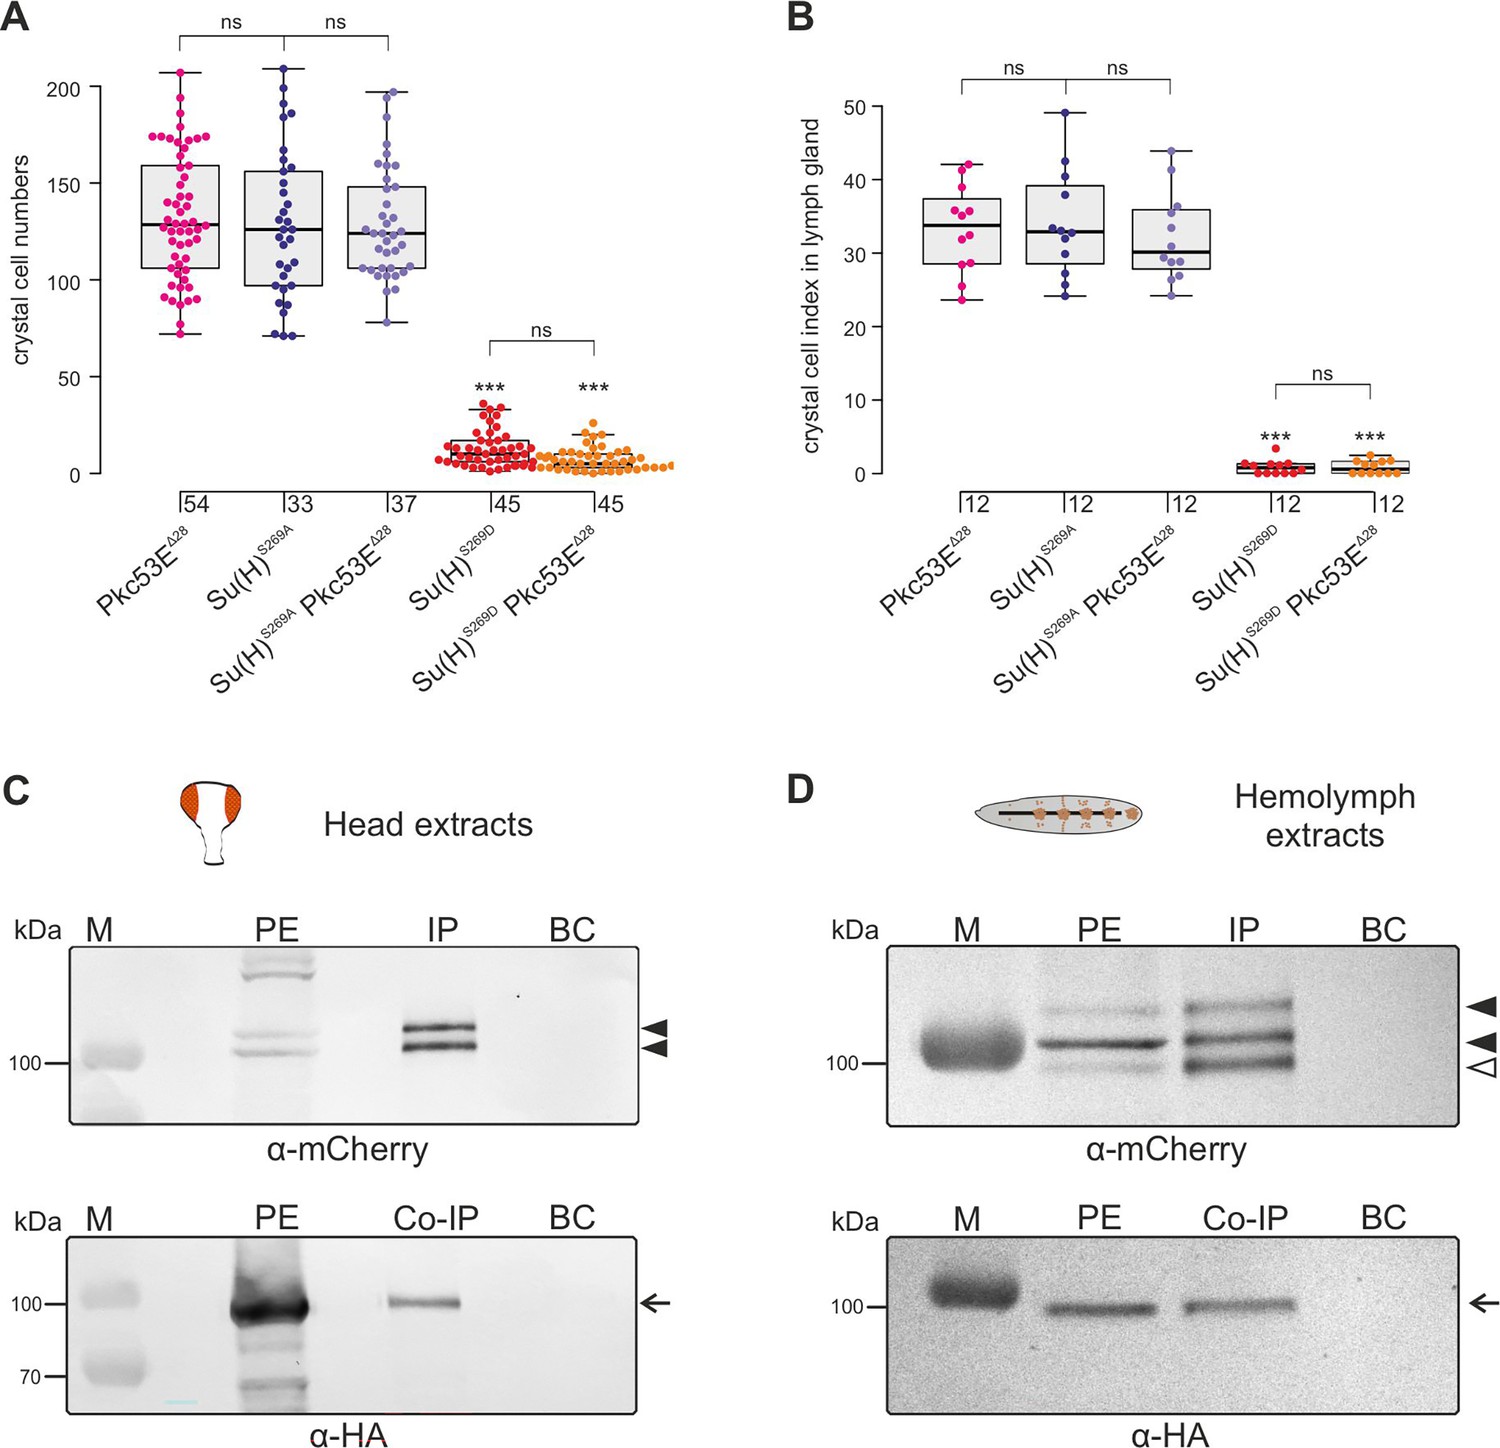
Pkc53E interacts with Su(H) at a genetic and a physiological level.
(A) Larval crystal cell numbers and (B) crystal cell indices in lymph glands were determined in the given genotypes. Each dot represents one analysed larva (n, as indicated) (A) or lymph gland lobus (n=12). (B) Statistical analysis by Kruskal-Wallis test, followed by Dunn’s test relative to controls with ***p<0.001; p≥0.05 ns (not significant). Representative images of sessile crystal cells and of lymph glands for each genotype are shown in Figure 7—figure supplement 1. (C, D) Co-immunoprecipitation of Pkc53EHA with Su(H)gwt-mCh protein. RFP-Trap IP was performed with protein extracts from 400 heads (C) or 25 third instar larvae (D), respectively. UAS-Pkc53E-HA expression was induced with Gmr-Gal4 in the head or with hml-Gal4 in the hemolymph. Endogenous mCherry-tagged Su(H) was trapped and detected with anti-mCherry antibodies (black arrowheads). The lowest band from the hemolymph is presumably a degradation product (open arrowhead in (D)). HA-tagged Pkc53E was specifically co-precipitated as detected with anti-HA antibodies (arrow). 10% of the protein extract (PE) used for the IP-Trap was loaded for comparison. BC corresponds to the Trap with only agarose beads as a control. M, prestained protein ladder; protein size is given in kDa.
-
Figure 7—source data 1
Original, uncropped western blots of Su(H)-mCh and Pkc53E-HA co-IP in head extracts and hemolymph, respectively, shown in Figure 7C and D.
- https://cdn.elifesciences.org/articles/89582/elife-89582-fig7-data1-v1.zip
-
Figure 7—source data 2
Original, uncropped western blots of Su(H)-mCh and Pkc53E-HA co-immunoprecipitation (co-IP) in head extracts and hemolymph, respectively, shown in Figure 7C and D - labelled.
Boxed areas correspond to the regions shown in the main figure.
- https://cdn.elifesciences.org/articles/89582/elife-89582-fig7-data2-v1.zip
-
Figure 7—source data 3
Raw data and statistical analysis.
- https://cdn.elifesciences.org/articles/89582/elife-89582-fig7-data3-v1.xlsx
Figure 7—figure supplement 1
Representative images for the various settings.
(A) Representative images of heat-induced larvae of the given genotype used for crystal cell counts. Scale bar, 250 µm. (B) Representative images of one 1° lobe of the lymph gland derived from larvae of the given genotype. Crystal cells were stained with anti-Hnt (green) and nuclei with anti-Pzg (blue). Scale bar, 50 µm.
Figure 8 with 1 supplement
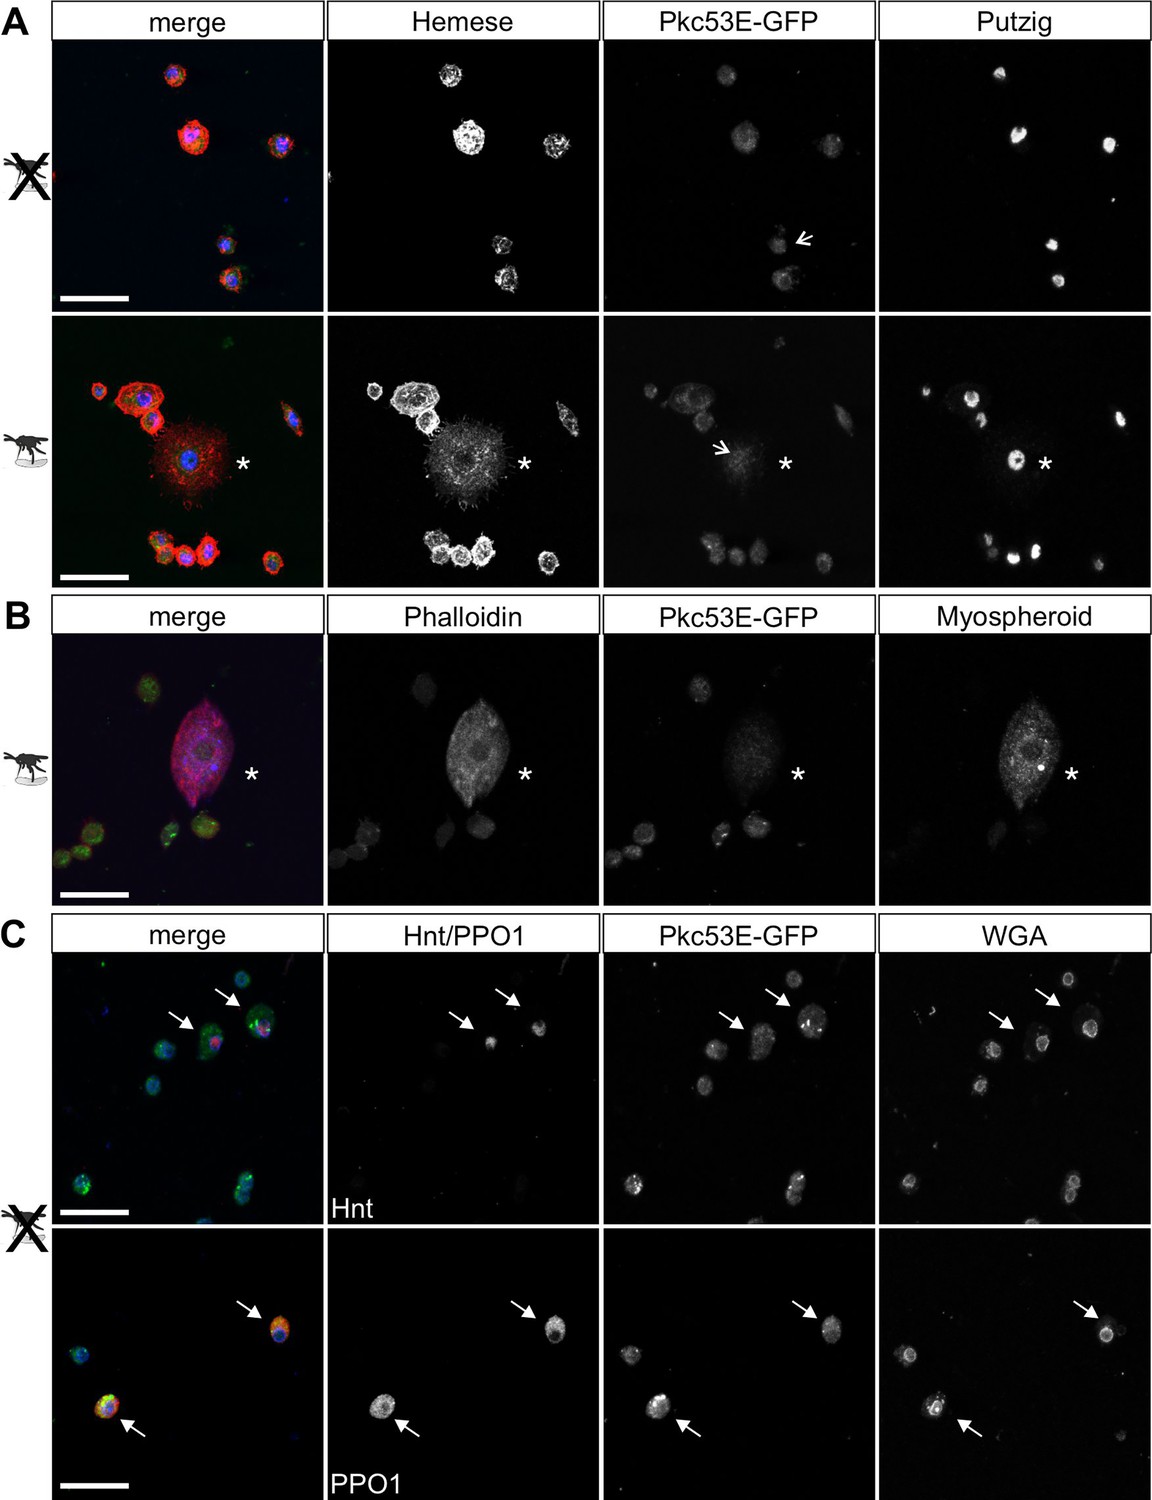
Pkc53E-eGFP is expressed in the cytoplasm of all hemocytes.
Hemocytes derived from Pkc53E-eGFP expressing larvae, either infested or not infested with L. boulardi were stained with the antibodies and compounds indicated. (A) Pkc53E-eGFP is present in the cytoplasm of hemocytes independent of wasp infection. Note complete overlap with Hemese (red) marking all types of blood cells; Putzig (blue) labels nuclei. Asterisk denotes lamellocyte in hemolymph of infected larvae. Arrows point to nuclei expressing Pkc53E-eGFP. (B) Pkc53E-eGFP is expressed in the cytoplasm of a lamellocyte (asterisk), labelled with myospheroid (blue) and rhodamine-coupled phalloidin (red). (C) Pkc53E-eGFP is enriched in the cytoplasm of crystal cells (arrow), labelled either with Hnt (red) or PPO1 (red), as indicated. Wheat germ agglutinin (WGA, blue) served to label nuclear lamina. Scale bar, 25 µm.
Figure 8—figure supplement 1
Pkc53E is expressed in hemocytes.
RT-PCR for Pkc53E expression in hemocytes of Su(H)gwt control larvae. A PCR product of 430 bp is expected (arrow). RT, reverse transcriptase. M, 100 bp DNA ladder.
-
Figure 8—figure supplement 1—source data 1
Original agarose gel showing RT-PCR for Pkc53E expression in hemocytes.
- https://cdn.elifesciences.org/articles/89582/elife-89582-fig8-figsupp1-data1-v1.zip
-
Figure 8—figure supplement 1—source data 2
Original agarose gel showing RT-PCR for Pkc53E expression in hemocytes - labelled.
Boxed area corresponds to region shown in the main figure.
- https://cdn.elifesciences.org/articles/89582/elife-89582-fig8-figsupp1-data2-v1.zip
Figure 9 with 2 supplements
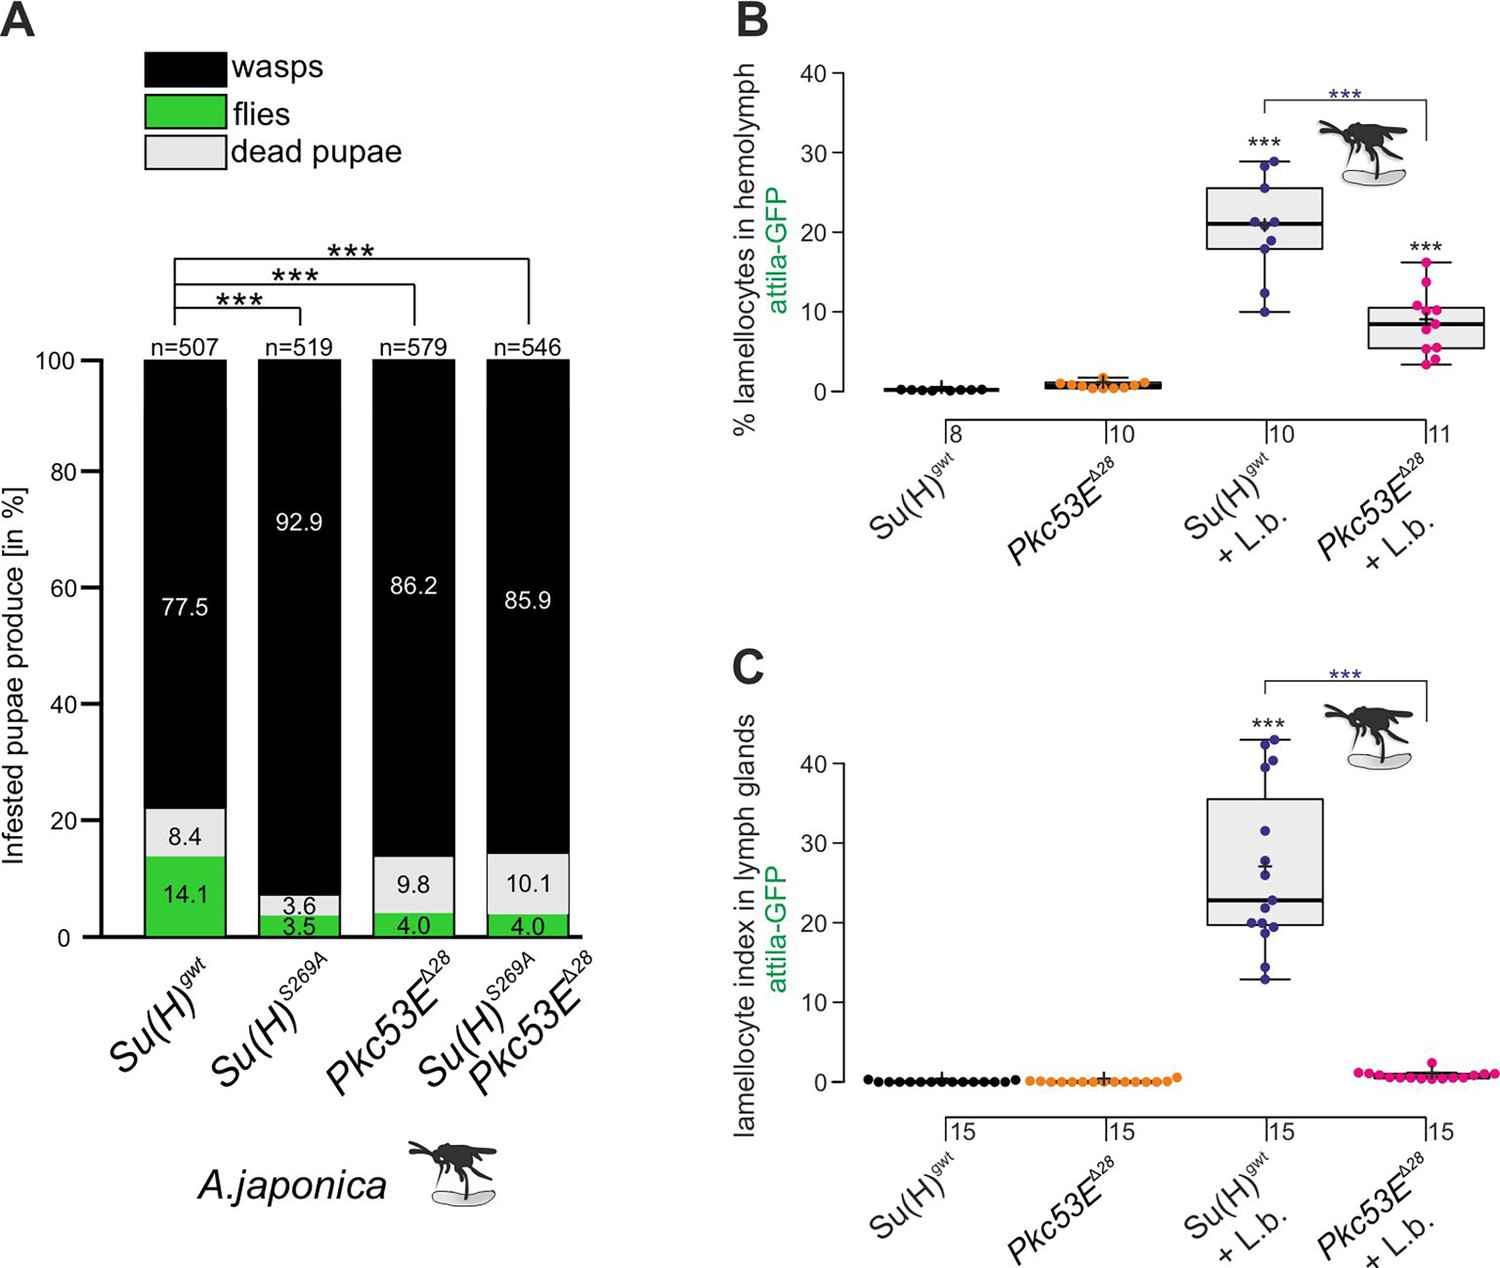
The Pkc53EΔ28 null mutant is immune-compromised.
(A) Resistance of Pkc53EΔ28 and the double mutant Su(H)S269A Pkc53EΔ28, compared to Su(H)gwt and Su(H)S269A for control, to the infestation with parasitic wasp strain A. japonica. Numbers of eclosed wasps versus flies as well as of dead pupae are presented in relation to the total of infested pupae (n, number of infested pupae). Statistical analysis by ANOVA followed by Tukey’s multiple comparison test relative to control Su(H)gwt; *p<0.05; ***p<0.001. (B, C) Quantification of lamellocytes labelled with the atilla-GFP reporter in the circulating hemolymph (B) or in the lymph glands (C), in uninfested conditions or upon wasp infestation as indicated. Representative images of hemolymph and of lymph glands for each genotype are shown in Figure 9—figure supplement 2. (B) Fraction of GFP-positive lamellocytes relative to the total of DAPI-stained hemocytes in the pooled hemolymph from 10 larvae. Each dot represents one larval pool (n, number of experiments as shown). (C) Lamellocyte index, i.e., number of GFP-labelled cells relative to the size of the lymph gland (n=15). Statistical analysis by ANOVA followed by Tukey’s multiple comparison test; ***p<0.001; significant differences are colour coded.
-
Figure 9—source data 1
Raw data and statistical analysis.
- https://cdn.elifesciences.org/articles/89582/elife-89582-fig9-data1-v1.xlsx
Figure 9—figure supplement 1
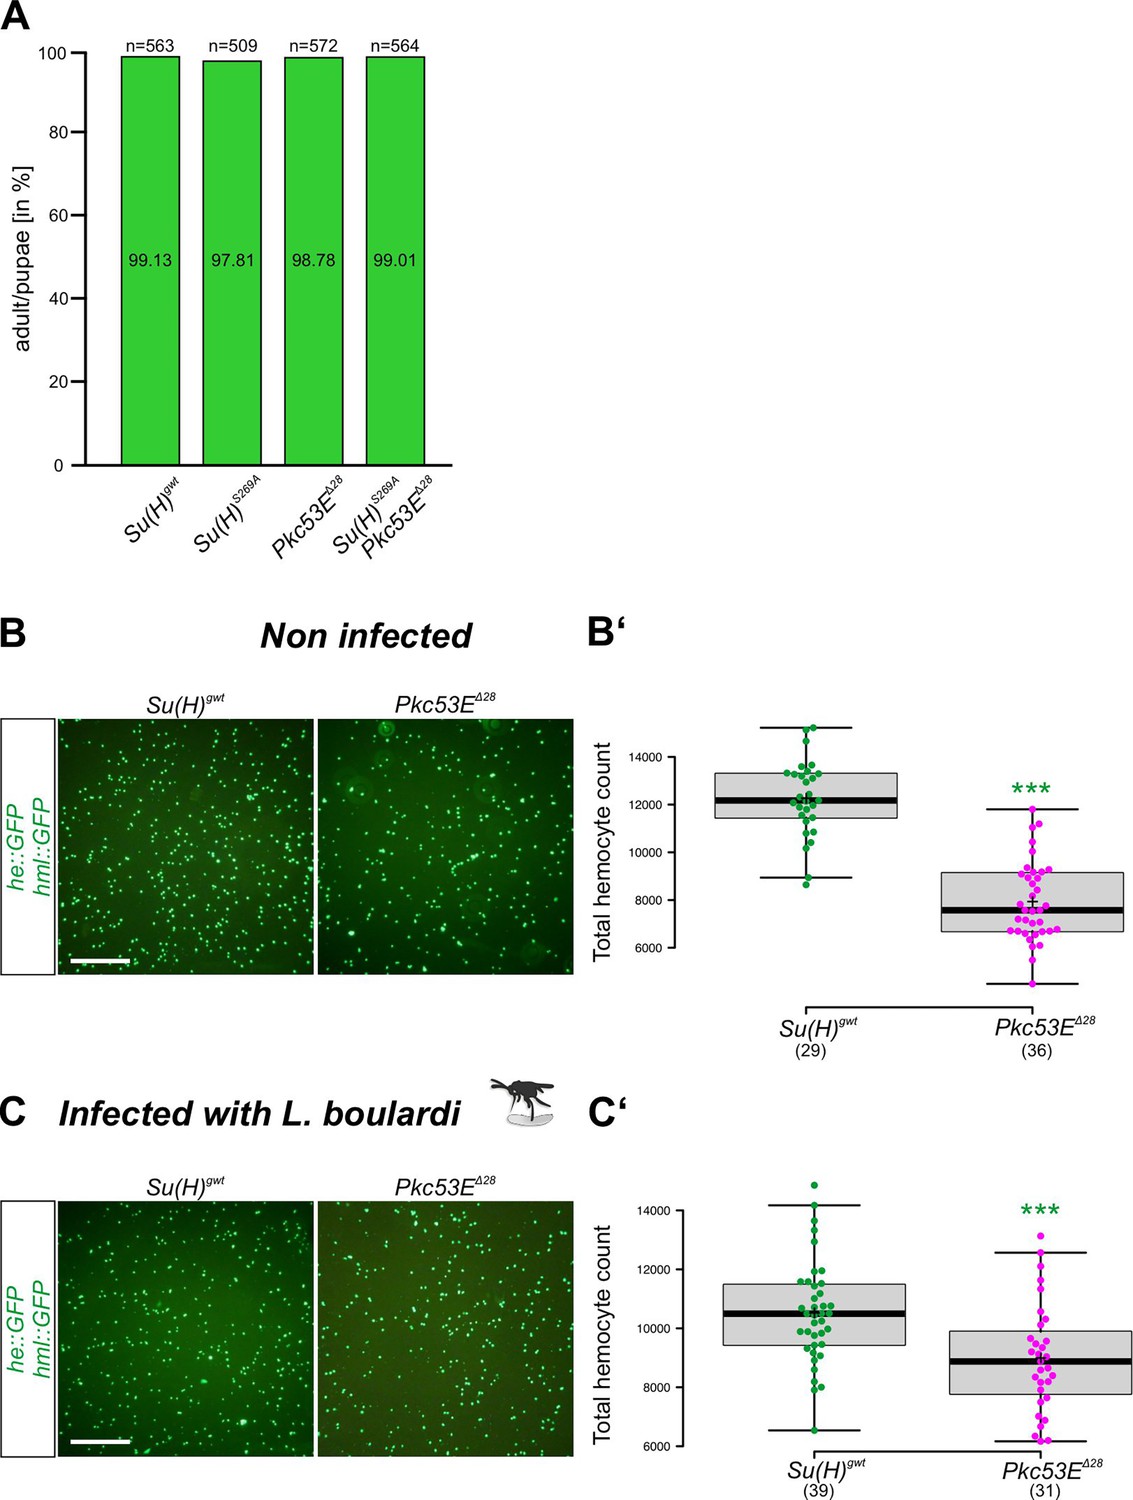
Pkc53EΔ28 is sensitive to wasp infestation.
(A) Fly eclosure in the absence of wasp infestation. Percentage of adult flies with the given genotype hatched from at least 500 pupae (number as indicated). Statistical analyses with Kruskal-Wallis test, followed by Dunn’s multiple comparison test, ns (not significant p≥0.05). (B, C) Representative pictures of hemocytes (green) labelled with he::GFP hml::GFP, not/infested with L. boulardi as indicated. Scale bar, 300 µm. (B’, C’) Every dot represents the hemocyte count of one larvae; number of analysed larvae is shown below. Statistical analyses with unpaired Student’s t-test, ***p<0.001.
-
Figure 9—figure supplement 1—source data 1
Raw data and statistical analysis.
- https://cdn.elifesciences.org/articles/89582/elife-89582-fig9-figsupp1-data1-v1.xlsx
Figure 9—figure supplement 2
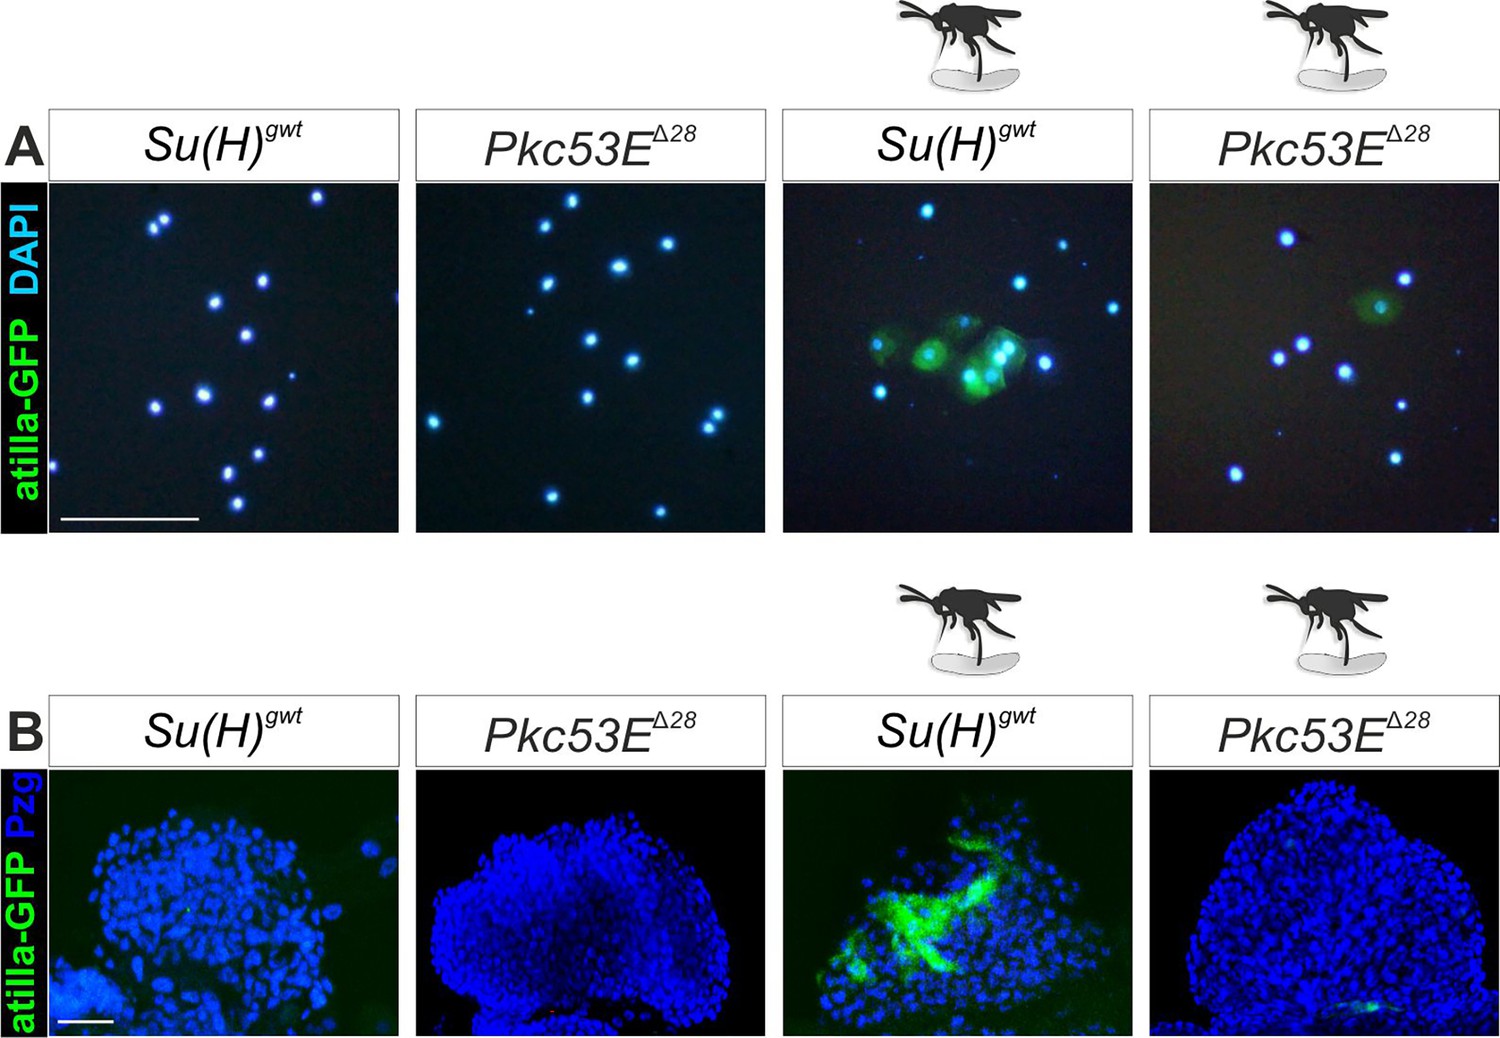
Representative images for the various settings.
(A) Representative images of hemolymph derived from larvae of the given genotype. Lamellocytes labelled green with atilla-GFP; nuclei blue (DAPI). (B) Representative images of one lymph gland 1° lobe of larvae with the given genotype. Lamellocytes are shown in green (atilla-GFP), nuclei in blue (anti-Pzg). (A, B) Infestation with L. boulardi indicated by the wasp schematic. Scale bar, 50 µm.
Tables
Appendix 1—key resources table
| Reagent type (species) or resource | Designation | Source or reference | Identifiers | Additional information |
|---|---|---|---|---|
| Gene (D. melanogaster) | Pkc53E cDNA | Drosophila Genome Resource Center | GH03188 | |
| Recombinant DNA reagent | pBT-3xHA-Pkc53E | This paper | N/A, available upon request | HA-tagged Pkc53E subclone in pBT |
| Recombinant DNA reagent | Pkc53EEDDD | This paper | A34E/T508D/T650D/S669D | In vitro mutagenised 3xHA-Pkc53E cDNA |
| Gene (D. melanogaster) | Su(H) cDNA | Maier et al., 2011 | N/A | |
| Recombinant DNA reagent | Su(H) BTD in pGEX-2T | This paper | N/A, available upon request | For bacterial expression of a BTD-GST fusion protein |
| Recombinant DNA reagent | 2xMyc-Su(H) in pCDNA3.1 | This paper | N/A, available upon request | myc-tagged version of Su(H) |
| Recombinant DNA reagent | HSV-TK 2xMyc-Su(H)-VP16 | This paper | N/A, available upon request | myc-tagged version of Su(H) with VP16 activation domain under HSV control |
| Transfected construct (D. melanogaster) | HSV-TK 2xMyc-Su(H)-VP16 in RBPjKO HeLa cells | Wolf et al., 2019; this paper | N/A | Assay on the influence of PMA/Stau on Su(H)-VP16 activity |
| Recombinant DNA reagent | pGL3 NRE | Bray et al., 2005 | N/A | |
| Recombinant DNA reagent | pUAST Su(H)-VP16 | Cooper et al., 2000 | N/A | |
| Recombinant DNA reagent | pUAST-attB | Bischof et al., 2007 | RRID:DGRC_1419 | |
| Recombinant DNA reagent | pBT-3xHA | This paper | N/A, available upon request | Three HA-tags cloned into Acc65I/XbaI sites of pBT |
| Recombinant DNA reagent | pGEX-2T | Smith and Johnson, 1988 | N/A | |
| Recombinant DNA reagent | pMAL | Riggs, 1994 | N/A | |
| Recombinant DNA reagent | pCDNA3.1 | Invitrogen | Cat# V79020 | |
| Recombinant DNA reagent | pRL TK | Promega | Cat# E2241 | |
| Strain, strain background (Leptopilina boulardi) | Leptopilina boulardi | Häußling, J Stökl, Bayreuth | N/A | Parasitoid wasp |
| Strain, strain background (Leptopilina heterotoma) | Leptopilina heterotoma | Häußling, J Stökl, Bayreuth | N/A | Parasitoid wasp |
| Strain, strain background (Asobara japonica) | Asobara japonica | Häußling, J Stökl, Bayreuth | N/A | Parasitoid wasp |
| Genetic reagent (D. melanogaster) | atilla-GFP, i.e. w1118; Mi{ET1}atillaMB03539 | Bloomington Drosophila Stock Center | BDSC:23540 | |
| Genetic reagent (D. melanogaster) | He-Gal4 UAS-GFP, i.e. w*; P{He-GAL4.Z}85, P{UAS-GFP.nls}8 | Bloomington Drosophila Stock Center | BDSC:8700 | |
| Genetic reagent (D. melanogaster) | hml-Gal4, i.e. w1118; P{Hml-GAL4.Δ}3/MKRS | Bloomington Drosophila Stock Center | BDSC:30141 | |
| Genetic reagent (D. melanogaster) | hmlΔ-Gal4 UAS-GFP, i.e. w1118; P{Hml-GAL4.Δ}3, P{UAS-2xEGFP}AH3/MKRS | Bloomington Drosophila Stock Center | BDSC:30142 | |
| Genetic reagent (D. melanogaster) | PPO3-Gal4 UAS mCD8-GFP | Dudzic et al., 2015 | N/A | |
| Genetic reagent (D. melanogaster) | lz-Gal4 | Lebestky et al., 2000 | N/A | |
| Genetic reagent (D. melanogaster) | NRE-GFP, i.e. w1118; P{NRE-EGFP.S}1 | Bloomington Drosophila Stock Center | BDSC:30728 | |
| Genetic reagent (D. melanogaster) | Pkc53E-EGFP, i.e. Pkc53EMI05296-GFSTF.0 | Bloomington Drosophila Stock Center | BDSC:59413 | |
| Genetic reagent (D. melanogaster) | UAS-white-RNAi, i.e. y1 v1; P{TRiP.JF01574}attP2/TM3, Ser1 | Bloomington Drosophila Stock Center | BDSC:31231 | |
| Genetic reagent (D. melanogaster) | UAS-N-RNAi, i.e. P{UAS-N.RNAi.P}14E, w* | Bloomington Drosophila Stock Center | BDSC:7078 | |
| Genetic reagent (D. melanogaster) | UAS-sgRNA-Pkc53E | Vienna Drosophila Resource Center | VDRC341127 | |
| Genetic reagent (D. melanogaster) | UAS-µMCas9 | Vienna Drosophila Resource Center | VDRC 340002 | |
| Genetic reagent (D. melanogaster) | UAS-HA-Pkc53E | This study | N/A | HA-Pkc53E under UAS-control integrated at 96E (3R) |
| Genetic reagent (D. melanogaster) | vasa-φC31; 96E-attB/TM3 | Bischof et al., 2007 | N/A | |
| Genetic reagent (D. melanogaster) | Su(H)gwt | Praxenthaler et al., 2017 | N/A | |
| Genetic reagent (D. melanogaster) | Su(H)gwt-mCh, i.e. y1 w*; TI{TI}Su(H)gwt-mCh | Praxenthaler et al., 2017 | BDSC:94607 | |
| Genetic reagent (D. melanogaster) | Su(H)S269A, i.e. y1 w*; TI{TI}Su(H)S269A | Frankenreiter et al., 2021 | BDSC:94609 | |
| Genetic reagent (D. melanogaster) | Su(H)S269D/CyO-GFP, i.e. y1 w*; TI{TI}Su(H)S269D/CyO, P{GAL4-Hsp70.PB}TR1, P{UAS-GFP.Y}TR1 | Frankenreiter et al., 2021 | BDSC:94610 | |
| Genetic reagent (D. melanogaster) | Su(H)S269A-mCh, i.e. y1 w*; TI{TI}Su(H)S269A-mCh | This study | N/A | Knock-in allele of mCherry-tagged Su(H)S269A into the native Su(H) locus |
| Genetic reagent (D. melanogaster) | Kinase mutant flies tested in the larval kinase screen are listed in Supplementary file 3 | BDSC, VDRC, and various donors as indicated in Supplementary file 3 | ||
| Cell line (H. sapiens) | RBPjKO HeLa cells (origin is ATCC: CLL-2; DSMZ: ACC57) | Wolf et al., 2019; gift of F Oswald (University of Ulm) and T Borggrefe (University of Giessen) | N/A | Homozygous knockout of the RBPj gene |
| Antibody | Mouse monoclonal anti-Hnt, 1G9 | Developmental Studies Hybridoma Bank, developed by H Lipshitz | RRID: AB_528278 | IF(1:20) |
| Antibody | Mouse monoclonal anti-mys, CF.6G11 | Developmental Studies Hybridoma Bank, developed by D Brower | RRID: AB_528310 | IF(1:10) |
| Antibody | Mouse monoclonal anti-beta tubulin, E7 | Developmental Studies Hybridoma Bank, developed by M Klymkowsky | RRID: AB_2315513 | WB(1:500) |
| Antibody | Mouse monoclonal anti-myc 9B11 | Cell Signaling Techn. | RRID: AB_331783; Cat# 2276 | WB(1:500) |
| Antibody | Mouse monoclonal anti-Hemese | Kurucz et al., 2003; gift from I Andó, Szeged, Hungary | N/A | IF(1:50) |
| Antibody | Guinea pig polyclonal anti-Pzg | Kugler and Nagel, 2007 | N/A | IF(1:500) |
| Antibody | Mouse monoclonal anti-PPO1, 12F6 | Trenczek and Bennich, 1992; gift from TE Trenczek, Giessen, Germany | N/A | IF(1:3) |
| Antibody | Mouse monoclonal anti-GST (8-326) | Invitrogen | S RRID: AB_10979611, Cat# MA4-004 | WB(1:1000) |
| Antibody | Rabbit polyclonal anti-pS269 | This paper, DAVIDS Biotechnology GmbH | N/A | WB(1:100) |
| Antibody | Rabbit polyclonal anti-GFP | Santa Cruz | RRID: AB_641123; Cat# sc-8334 | IF(1:100) |
| Antibody | Rabbit polyclonal anti-mCherry | GeneTex | RRID: AB_2721247; Cat# GTX128508 | WB(1:1000) |
| Antibody | Rat monoclonal anti-HA 3F10 | ROCHE | RRID:AB_390918 Cat# 11867423001 | WB(1:500) |
| Antibody | Donkey polyclonal anti-mouse IgG, Cy3 | Jackson ImmunoResearch Laboratories | RRID: AB_2315777 Cat# 715-165-151 | IF(1:200) |
| Antibody | Donkey polyclonal anti-mouse IgG, Cy5 | Jackson ImmunoResearch Laboratories | RRID: AB_2340820 Cat# 715-175-151 | IF(1:200) |
| Antibody | Donkey polyclonal anti- guinea pig IgG, Cy5 | Jackson ImmunoResearch Laboratories | RRID: AB_2340462 Cat# 706-175-148 | IF(1:200) |
| Antibody | Donkey polyclonal anti- rabbit IgG, FITC | Jackson ImmunoResearch Laboratories | RRID: AB_2315776 Cat# 711-095-152 | IF(1:200) |
| Antibody | Goat polyclonal anti-guinea pig IgG, Alexa Fluor 647 | Jackson ImmunoResearch Laboratories | RRID: AB_2337446; Cat# 106-605-003 | IF(1:200) |
| Antibody | Goat polyclonal anti-mouse IgG, FITC | Jackson ImmunoResearch Laboratories | RRID: AB_2338601; Cat# 1115-095-166 | IF(1:200) |
| Antibody | Goat polyclonal anti-rabbit IgG, alkaline phosphatase | Jackson ImmunoResearch Laboratories | RRID: AB_2337947; Cat# 111-055-003 | WB(1:1000) |
| Antibody | Goat polyclonal anti-rat IgG, alkaline phosphatase | Jackson ImmunoResearch Laboratories | RRID: AB_2338148; Cat# 112-055-003 | WB(1:1000) |
| Antibody | Goat polyclonal anti-mouse IgG, alkaline phosphatase | Jackson ImmunoResearch Laboratories | RRID: AB_2338528; Cat# 115-055-003 | WB(1:1000) |
| Other | Normal donkey serum | Jackson ImmunoResearch Laboratories | RRID: AB_2337258 Cat# 017-000-121 | IF(1:400) |
| Other | Normal goat serum | Jackson ImmunoResearch Laboratories | RRID: AB_2336990 Cat# 005-000-121 | IF(1:400) |
| Peptide, recombinant protein | Activated PKCα | ProQinase | Cat# 0222-0000-1 | |
| Peptide, recombinant protein | Activated Akt1 | ProQinase | Cat# 1379-0000-2 | |
| Peptide, recombinant protein | Activated GSK3 beta | ProQinase | Cat# 0310-0000-1 | |
| Peptide, recombinant protein | Activated S6K | ProQinase | Cat# 0318-0000-2 | |
| Peptide, recombinant protein | CAMK2D | Invitrogen | NP_742113 | |
| Peptide, recombinant protein | Pseudosubstrate | peptides & elephants | PS | RFARLGSLRQKNV |
| Peptide, recombinant protein | Su(H) peptide | peptides & elephants | Swt | ALFNRLRSQTVSTRY |
| Peptide, recombinant protein | Su(H)SA peptide | peptides & elephants | SSA | ALFNRLRAQTVSTRY |
| Peptide, recombinant protein | Su(H) phosphopeptide | DAVIDS Biotechnology GmbH | N/A | NLRLpSQTVSTRYLHVE |
| Commercial assay or kit | RFP-Trap Magnetic Agarose | ChromoTek | Cat# rtma-20 | |
| Commercial assay or kit | Amylose resin | New England Biolabs GmbH | Cat# E8021S | |
| Commercial assay or kit | ADP-Glo Kinase Assay | Promega | Cat# V6930 | |
| Commercial assay or kit | PolyATract System Kit 1000 | Promega | Cat# Z5400 | |
| Commercial assay or kit | Dynabeads mRNA DIRECT micro purification kit | Invitrogen, Thermo Fisher | Cat# 61021 | |
| Commercial assay or kit | qScriber cDNA Synthesis Kit | highQu | Cat# RTK0104 | |
| Commercial assay or kit | Q5 Site directed Mutagenesis Kit | New England Biolabs GmbH | Cat# E0554S | |
| Commercial assay or kit | Blue S’Green qPCR Kit | Biozym | Cat# 331416 | |
| Commercial assay or kit | Dual-Luciferase Reporter Assay | Promega | Cat# E1910 | |
| Commercial assay or kit | Pap-pen | Kisker Biotech | Cat# MKP-1 | |
| Chemical compound, drug | DAPI | Cell Signaling Techn. | Cat# 4083 | (1 µg/ml) |
| Chemical compound, drug | DNase I | New England Biolabs GmbH | Cat# M0303 | (2 U/µl) |
| Chemical compound, drug | PMA, Phorbol-12-myristat-13-acetat | Sigma-Aldrich | Cat# P8139-1MG | (1 mM) |
| Chemical compound, drug | Staurosporine | Sigma-Aldrich | Cat# S4400-1MG | (0.2 mM) |
| Chemical compound, drug | Protease inhibitors, cOmplete ULTRA-tablets Mini | Roche | Cat# 5892791001 | (1 tablet/10 ml) |
| Chemical compound, drug | PhosSTOP (Phosphatase inhibitor) | Roche | Cat# 4906837001 | (1 tablet/10 ml) |
| Chemical compound, drug | Wheat germ agglutinin (WGA), Alexa Fluor 647 conjugate | Fisher Scientific | Cat# 11510826 | (1:200) |
| Chemical compound, drug | Phalloidin, coupled to rhodamine | Invitrogen, Thermo Fisher | Cat# R415 | (1:200-1:400) |
| Chemical compound, drug | Vectashield | Biozol | Cat# VEC-H_1000 | Mounting medium |
| Software, algorithm | GPS3.0 software | Xue et al., 2011 | ||
| Software, algorithm | ImageJ 1.51 | Schindelin et al., 2012 | https://imagej.nih.gov/ij/ | |
| Software, algorithm | GraphPad Prism version 9.0 | GraphPad Software, Inc | https://www.graphpad.com/ | |
| Software, algorithm | MIC PCR software version v2.12.7 | bms/Biozym | Cat# 68MiC-HRM | |
| Software, algorithm | Weka machine learning and data analysis software version 3.8 | Eibe et al., 2016 | https://waikato.github.io/weka-site/index.html | |
| Sequence-based reagent | Supplementary file 5, oligonucleotides | Microsynth AG |
Additional files
-
Supplementary file 1
List of kinases predicted to recognise S269 in Su(H) as substrate in silico.
Computationally determined candidate Ser/Thr kinases predicted to pilot Serine 269 in Su(H). The list contains the human and the corresponding Drosophila candidates.
- https://cdn.elifesciences.org/articles/89582/elife-89582-supp1-v1.docx
-
Supplementary file 2
List of kinases accepting the beta-trefoil domain (BTD) domain of Su(H) as substrate in vitro.
List of Ser/Thr kinases that tested positive in accepting Drosophila Su(H) BTD as a substrate for phosphorylation in an in vitro assay. The list contains the 62 human and the corresponding 40 Drosophila candidates, highlighting the 10 from Drosophila also identified in the in silico screen.
- https://cdn.elifesciences.org/articles/89582/elife-89582-supp2-v1.docx
-
Supplementary file 3
Fly strains used for the larval crystal cell screen.
This file contains a list of the mutant alleles and RNAi strains of the Drosophila Ser/Thr kinases screened for alterations in crystal cell numbers with identifier, reference and/or source (BL, Bloomington Drosophila Stock Center; VDRC, Vienna Drosophila Resource Center).
- https://cdn.elifesciences.org/articles/89582/elife-89582-supp3-v1.docx
-
Supplementary file 4
Larval crystal cell screen.
This file contains the results from the larval crystal cell screen. The list displays the Ser/Thr kinases and the relevant controls tested in the screen, the alleles or RNAi settings used, the average crystal cell number of the tested mutant and the percentage gain or loss of crystal cells relative to the control, SD, and sample size.
Heated larvae of kinase mutants and/or hml-Gal4::UAS-kinase-RNAi/UAS-kinaseDN genotypes were counted for the appearance of melanised crystal cells (cc) in the last two segments. If UAS-transgenes were used, the number of crystal cells was compared between uninduced (UAS-line alone) and induced with hml-Gal4. Mutant genotypes were related to the Su(H)gwt wild-type control.
- https://cdn.elifesciences.org/articles/89582/elife-89582-supp4-v1.docx
-
Supplementary file 5
List of oligonucleotides.
This file contains a list of oligonucleotides used for cloning, mutagenesis, and verification of constructs, as well as for RT-PCR and qRT-PCR analyses, including PCR conditions.
- https://cdn.elifesciences.org/articles/89582/elife-89582-supp5-v1.docx
-
MDAR checklist
- https://cdn.elifesciences.org/articles/89582/elife-89582-mdarchecklist1-v1.docx
Download links
A two-part list of links to download the article, or parts of the article, in various formats.
Downloads (link to download the article as PDF)
Open citations (links to open the citations from this article in various online reference manager services)
Cite this article (links to download the citations from this article in formats compatible with various reference manager tools)
Inhibition of the Notch signal transducer CSL by Pkc53E-mediated phosphorylation to fend off parasitic immune challenge in Drosophila
eLife 12:RP89582.
https://doi.org/10.7554/eLife.89582.3


