Identification of key yeast species and microbe–microbe interactions impacting larval growth of Drosophila in the wild
- Graduate School of Biostudies, Kyoto University, Japan
- Center for Cancer Immunotherapy and Immunobiology, Kyoto University, Japan
- National Institute of Genetics, Japan
- Graduate School of Science and Engineering, Ehime University, Japan
- Graduate School of Medical Sciences, Kyushu University, Japan
- Center for Living Systems Information Science, Kyoto University, Japan
- AMED-CREST, Japan
- JST FOREST, Japan
Figures
Figure 1 with 2 supplements

The composition of both yeast and bacteria in the food microbiota shifts as fermentation progresses, independently of the presence of larvae.
Sampling designs and results for the analyses of microbial compositions in natural food sources of Drosophila (A, B), effects of larval presence on the microbial composition shift (C, D), or microbial compositions in adult flies, larvae, and their foods (E, F). (A, C, E) Designs of the samplings for microbial analyses. Traps with bananas were set up outdoors near human habitations in order to collect food samples on which wild Drosophila spp. lay eggs. Fermented food samples were collected from the traps at two time points: the early stage (just after trap collection) and the late stage (when larvae in the foods developed into late third instars). Collected samples are indicated in bold letters. (C) In this sampling, the collected early-stage food was crushed in phosphate-buffered saline (PBS), and the liquid portion (microbial suspension) was added to fresh bananas with or without germ-free embryos (Cg-Gal4, UAS-mCD8:GFP). After incubation, late-stage food and surface-sterilized larvae were collected. (E) In addition to the food samples, adult flies in the traps and larvae from the late-stage foods were collected. This sampling was conducted independently from that shown in (C) and (D), although the sampling places were in common (see Supplementary file 1A). Both adults and larvae were surface sterilized. Note that all of the adults in the traps at Places 7 and 8 were collected for the microbial analysis, while 20 out of 37 were collected at Place 9. (B, D, F) The relative abundances of fungi or bacteria in the fermented banana or fly samples. The compositions were analyzed using primer sets amplifying the fungal internal transcribed spacer (ITS) region or bacterial 16S rDNA region. Operational taxonomic units (OTUs) accounting for >1% in any of the samples were grouped by families, as shown. The ratio of those accounting for <1% was summed and is indicated as ‘Others’. The genera belonging to uncertain families (incertae sedis) are indicated by their genus name in parentheses. (B) The result corresponding to the sampling depicted in (A). The numbers on the horizontal axis indicate each numbered sampling location. ‘No-fly’ indicates the food samples from Sampling Place 6, where no fly or larva was found in the trap or the foods, respectively. (D, F) The result corresponding to the sampling depicted in (C) and (E), respectively. E, early-stage food; L, late-stage food; Susp, microbial suspension; w/o L, late-stage food without larvae; w/ L, late-stage food with larvae; Lar, larvae.
Figure 1—figure supplement 1
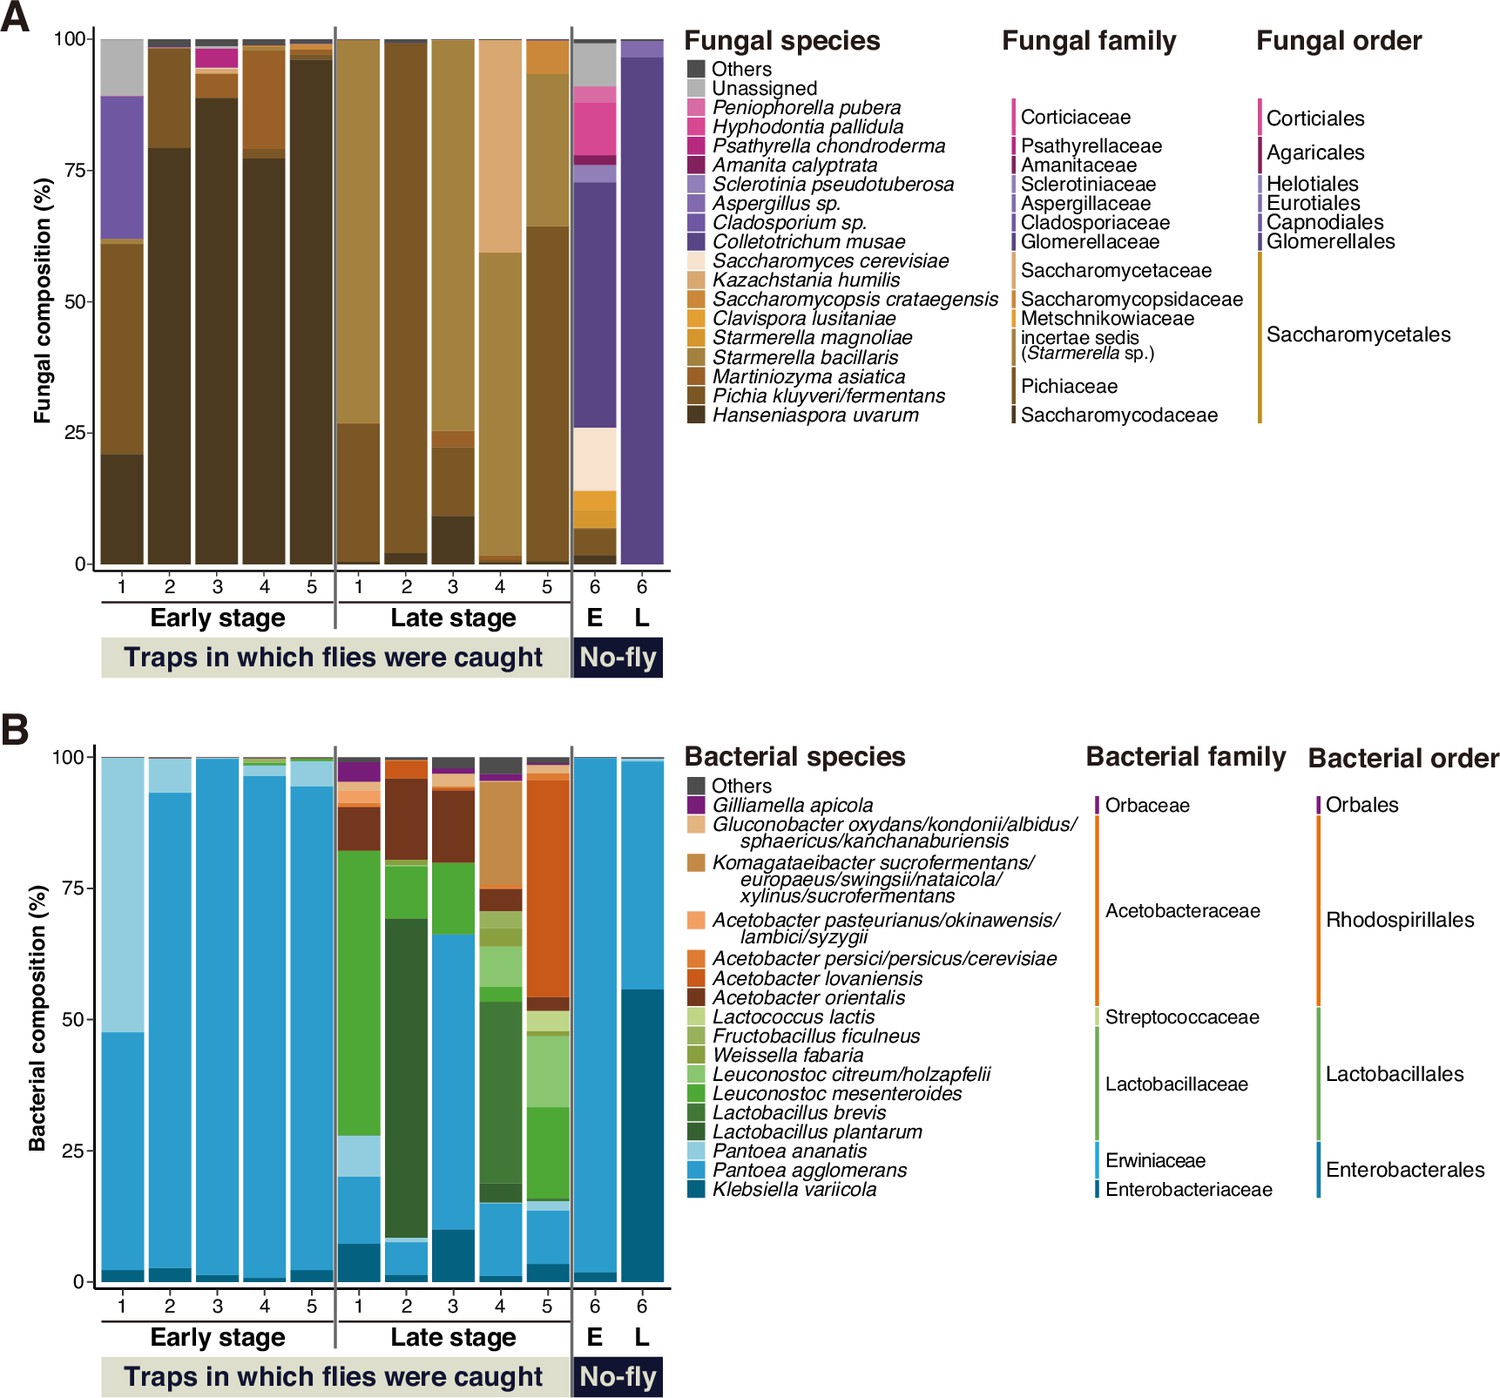
Fungal and bacterial species compositions in natural food sources of Drosophila.
(A, B) Results of microbial composition analysis corresponding to Figure 1B. The relative abundances of fungal (A) or bacterial (B) species in the fermented banana are shown. The compositions were analyzed using primer sets amplifying the fungal internal transcribed spacer (ITS) region or bacterial 16S rDNA region. Operational taxonomic units (OTUs) accounting for >1% in any of the samples were grouped by species, as shown. The ratios of those accounting for <1% or those of unidentified species were summed and indicated as ‘Others’. The genera belonging to uncertain families (incertae sedis) are indicated by their genus name in parentheses. The numbers on the horizontal axis represent each numbered sampling location, corresponding to those indicated in Figure 1B. ‘No-fly’ highlights the food samples from Sampling Place 6, where no fly or larva was found in the trap or the foods, respectively. E, early-stage food; L, late-stage food.
Figure 1—figure supplement 2
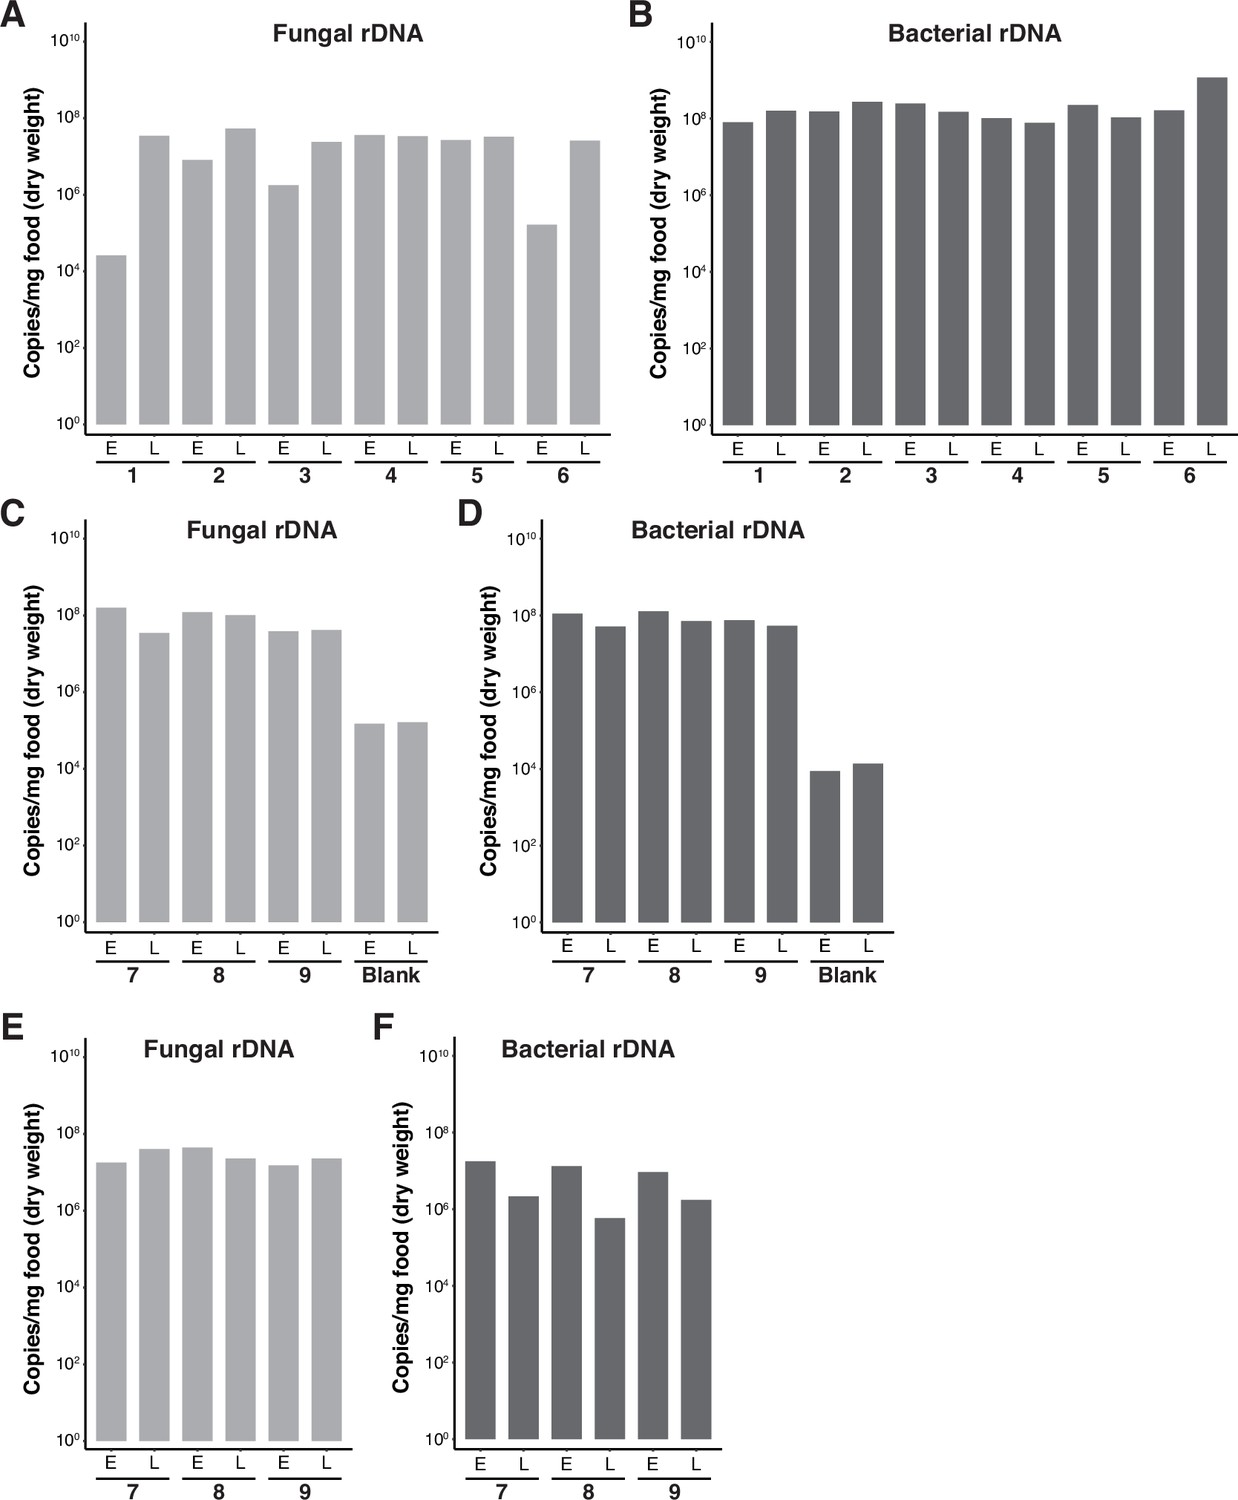
Copy numbers of microbial rDNA in fermented banana samples.
Graphs showing the copy numbers of the fungal internal transcribed spacer (ITS) region (A, C, E) or bacterial 16S rRNA region (B, D, F) in the fermented banana samples shown in Figure 1A, B (A, B), Figure 1C, D (C, D), and Figure 1E, F (E, F).Numbers below each pair of foods indicate the sampling places, which correspond to those indicated in Figure 1. (C, D) Yeast and bacteria were also detected in Blank banana samples, in which sterile phosphate-buffered saline (PBS) instead of microbial suspensions was added. They might have invaded the fruit by passing through wounds on the peel (Oyewole, 2012). E, early-stage food; L, late-stage food.
-
Figure 1—figure supplement 2—source data 1
Raw data displayed in Figure 1—figure supplement 2.
- https://cdn.elifesciences.org/articles/90148/elife-90148-fig1-figsupp2-data1-v1.xlsx
Figure 2 with 2 supplements
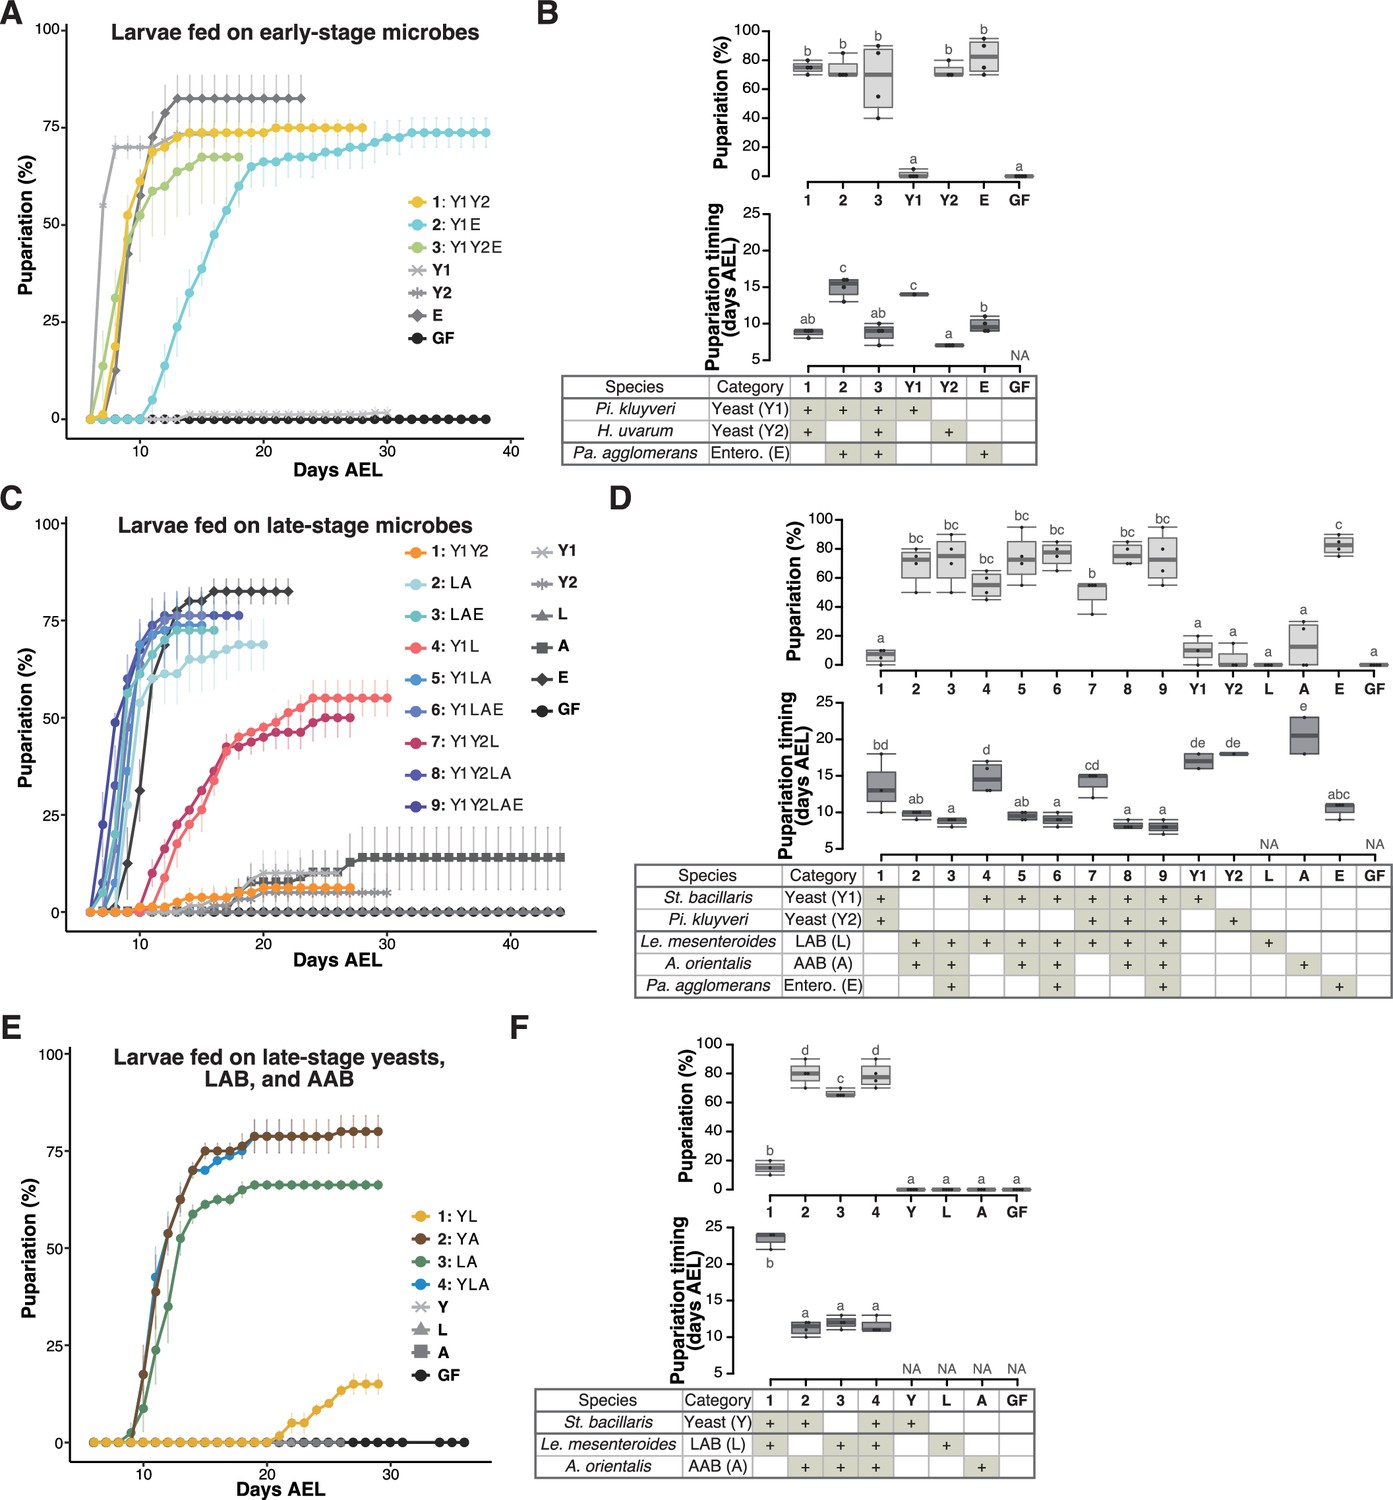
Prominent acceleration of larval development occurred with early-stage-dominant yeast alone, as well as in combination with late-stage-dominant acetic acid bacteria (AAB) and other microbes.
The percentage and timing of pupariation of larvae feeding on microbes detected in the early-stage food (A, B), or five (C, D) or three (E, F) microbes detected in the late-stage food from Sampling Place 1 in Figure 1B. (A, C, E) Each data point represents the average percentage of individuals per tube that pupariated by each day. n = 3–4. Colored lines are for mixed conditions, while gray lines are for mono-associated or germ-free conditions. The codes for individual species are provided in the chart at the bottom of (B), (D), and (E), respectively. Error bars represent standard error of the mean (SEM). (C) The color coding for the respective foods is as follows: includes yeasts only (orange); includes yeast(s) and lactic acid bacteria (LAB) but no AAB (red); includes LAB and AAB (blue). (B, D, F) Percentage of the larvae pupariated (pupariation ratio; upper) and the timing at which 50% of the pupariation ratio was achieved (lower). Boxes represent upper and lower quartiles, while the central lines indicate the median. Whiskers extend to the most extreme data points, which are no more than 1.5 times the interquartile range. Unique letters indicate significant differences between groups (Tukey–Kramer test, p < 0.05). Pi. kluyveri, Pichia kluyveri; Pa. agglomerans, Pantoea agglomerans; St. bacillaris, Starmerella bacillaris; Le. mesenteroides, Leuconostoc mesenteroides; Entero., Enterobacterales; GF, germ-free; NA, not applicable; days AEL, days after egg laying.
-
Figure 2—source data 1
Raw data displayed in Figure 2.
- https://cdn.elifesciences.org/articles/90148/elife-90148-fig2-data1-v1.xlsx
Figure 2—figure supplement 1
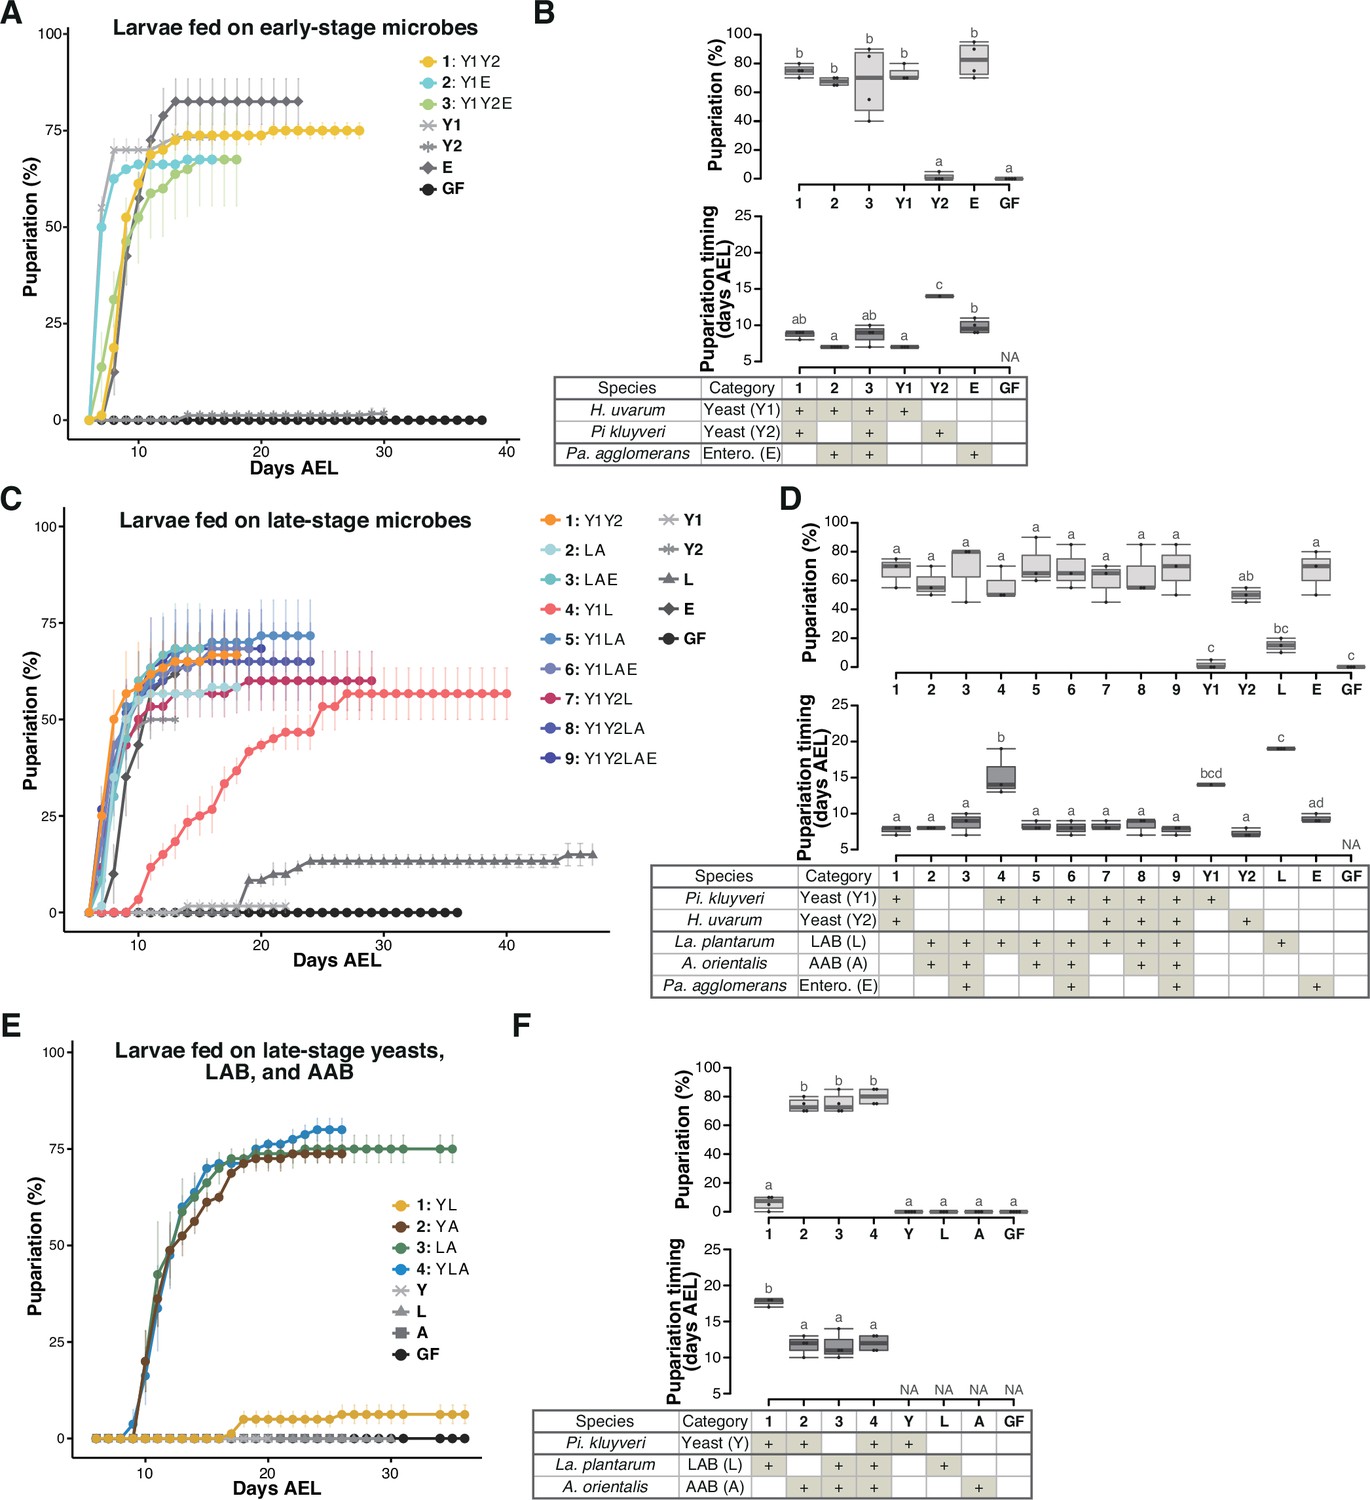
Larvae feeding on mixtures of isolated microbial species detected in the food samples from Sampling Place 2 in Figure 1B.
The percentage and timing of pupariation of larvae feeding on (A, B) microbes derived from the early-stage food, or (C, D) five, or (E, F) three microbes derived from the late-stage food. (A, C, E) The codes for individual species are provided in the chart at the bottom of (B), (D), and (F), respectively. (B, D, F) Graphs are presented as in Figure 2. n = 3–4. Pi. kluyveri, Pichia kluyveri; Pa. agglomerans, Pantoea agglomerans; La. plantarum, Lactiplantibacillus plantarum; Entero., Enterobacterales; GF, germ-free; NA, not applicable; days AEL, days after egg laying.
-
Figure 2—figure supplement 1—source data 1
Raw data displayed in Figure 2—figure supplement 1.
- https://cdn.elifesciences.org/articles/90148/elife-90148-fig2-figsupp1-data1-v1.xlsx
Figure 2—figure supplement 2
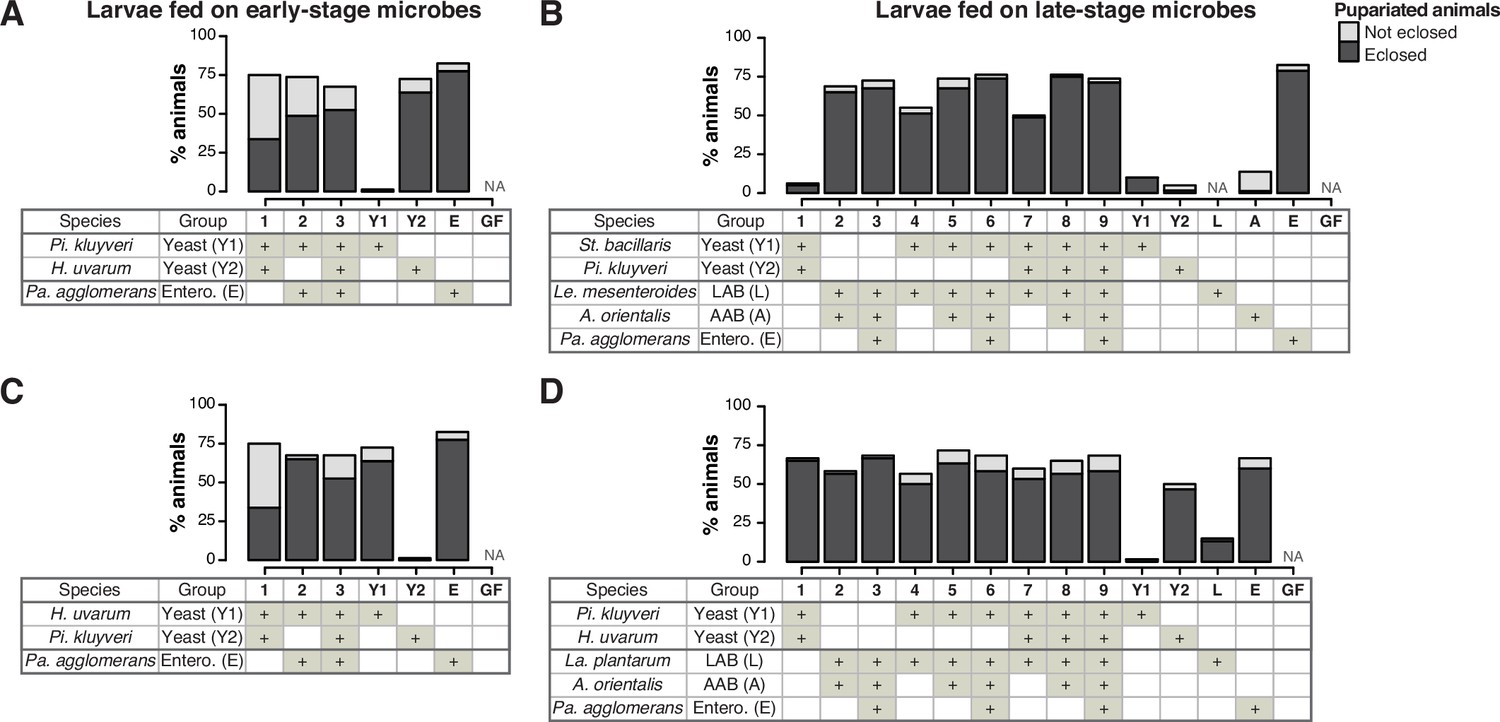
The percentage of pupariation and eclosion of the larvae feeding on microbes.
Graphs showing the percentage of larvae that pupariated in the experiments shown in Figure 2A and B (A), Figure 2C and D (B), Figure 2—figure supplement 1A and B (C), or Figure 2—figure supplement 1C, D (D). The mean percentages of the pupariated and eclosed (dark gray) or pupariated and not eclosed (light gray) individuals are shown. n = 3–4. Pi. kluyveri, Pichia kluyveri; Pa. agglomerans, Pantoea agglomerans; St. bacillaris, Starmerella bacillaris; Le. mesenteroides, Leuconostoc mesenteroides; La. plantarum, Lactiplantibacillus plantarum; Entero., Enterobacterales; GF, germ-free; NA, not applicable.
-
Figure 2—figure supplement 2—source data 1
Raw data displayed in Figure 2—figure supplement 2.
- https://cdn.elifesciences.org/articles/90148/elife-90148-fig2-figsupp2-data1-v1.xlsx
Figure 3 with 1 supplement
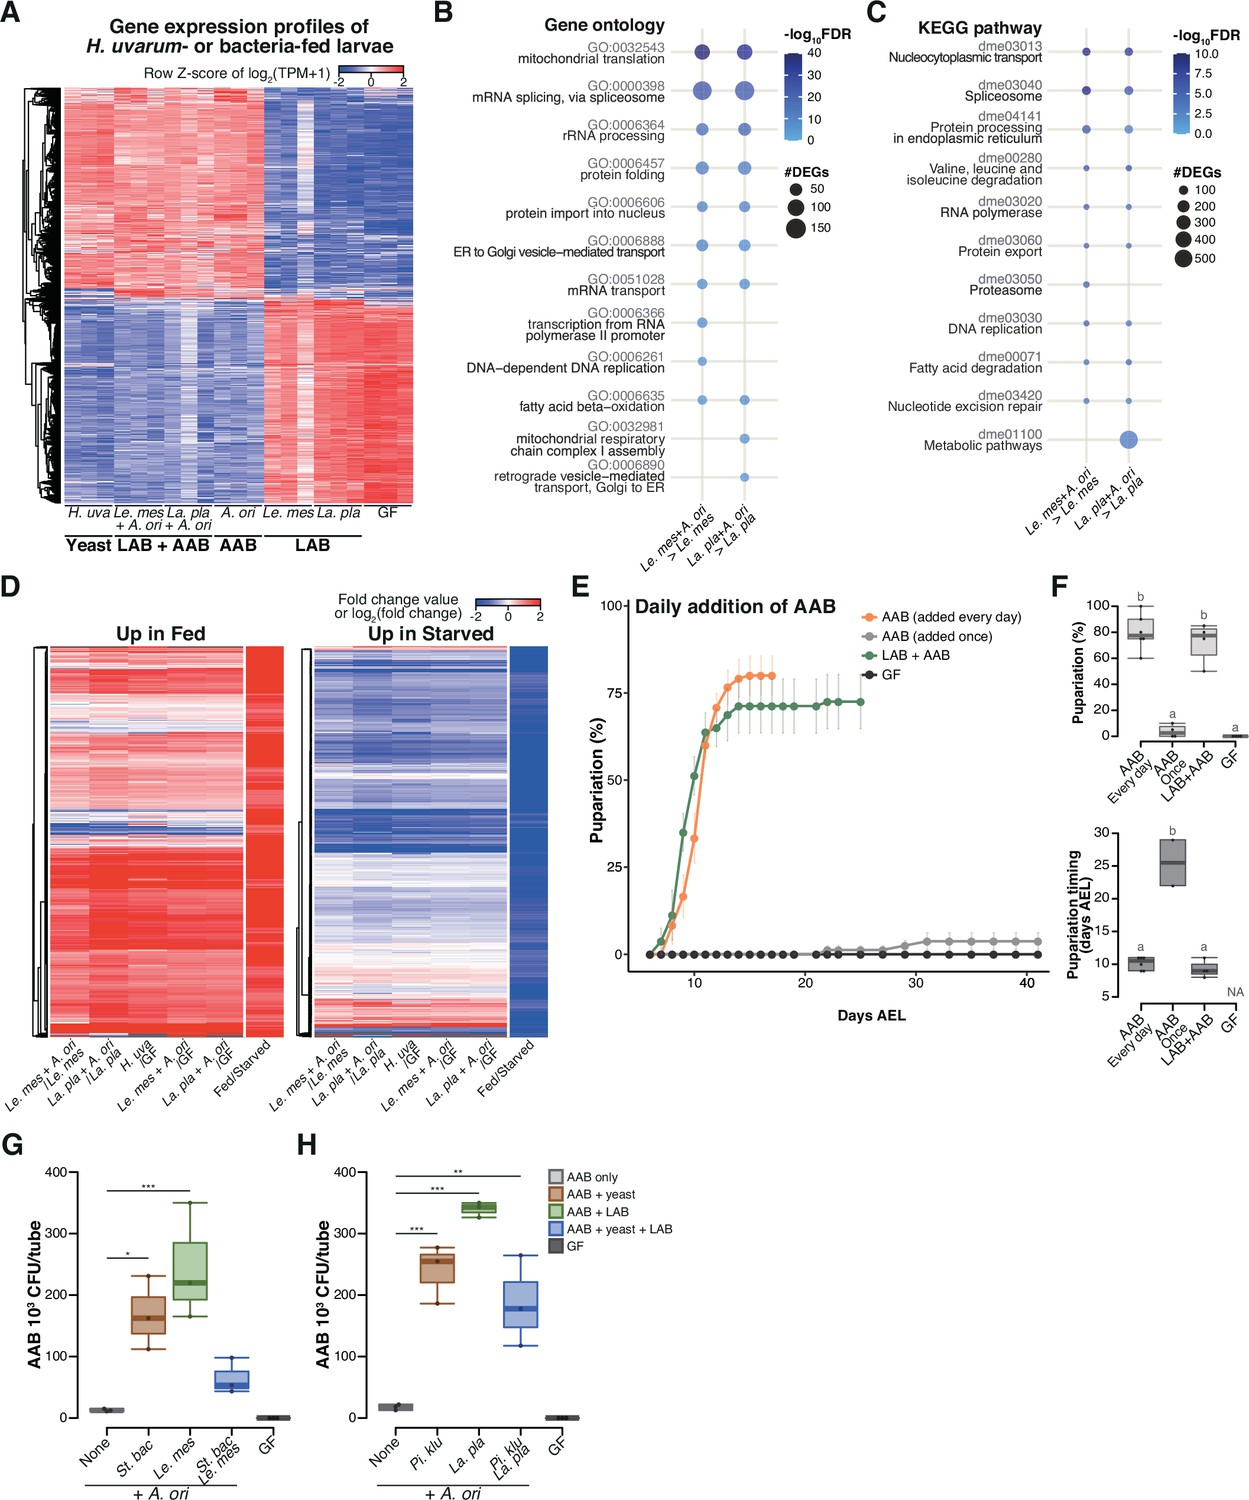
During the late stage, acetic acid bacteria (AAB) play a crucial role in supporting larval development through interspecies interactions among the microbes.
(A) Heat map of gene expression values for first instar larvae fed H. uvarum or bacteria. Freshly hatched germ-free larvae were placed on banana agar inoculated with each microbe and collected after 15 hr feeding to examine gene expression of the whole body. The data of the genes that were differentially expressed between ‘LAB’-fed conditions and the respective ‘LAB + AAB’ conditions are shown. Plots showing the result of Gene Ontology (GO) term (B) or Kyoto Encyclopedia of Genes and Genomes (KEGG) pathway (C) enrichment analysis of the RNA-seq data. 10 terms/pathways that showed the smallest false discovery rate (FDR) in each analysis are shown. (D) Heat maps showing the similarity between our RNA-seq data and microarray data in a previous study (Zinke et al., 2002). Zinke et al. used larvae at 47–49 hr AEL and fed them yeast paste or starved them for 12 hr before comparing the gene expression profiles. The data from Zinke et al., 2002 are labeled as ‘Fed/Starved’ in the righthand column of each heat map, which show the fold change value of each gene. Only the genes exhibiting significant differences in their analysis are shown. For our data, log2(fold change) were calculated using TPM of each gene in the larvae on the supportive conditions versus those on the non-supportive conditions. (E, F) The percentage and timing of pupariation of the larvae feeding on AAB on banana agar. Graphs are presented as in Figure 2. n = 3–4. (G, H) AAB load of foods inoculated with AAB, with or without other microbial species. Boxplots are depicted as in Figure 2 (Dunnett’s test, *p < 0.05, **p < 0.01, ***p < 0.001). La. pla, Lactiplantibacillus plantarum; Le. mes, Leuconostoc mesenteroides; A. ori, Acetobacter orientalis; H. uva, Hanseniaspora uvarum; St. bac, Starmerella bacillaris; Pi. klu, Pichia kluyveri; GF, germ-free; NA, not applicable; days AEL, days after egg laying.
-
Figure 3—source data 1
Raw data displayed in Figure 3.
- https://cdn.elifesciences.org/articles/90148/elife-90148-fig3-data1-v1.xlsx
Figure 3—figure supplement 1
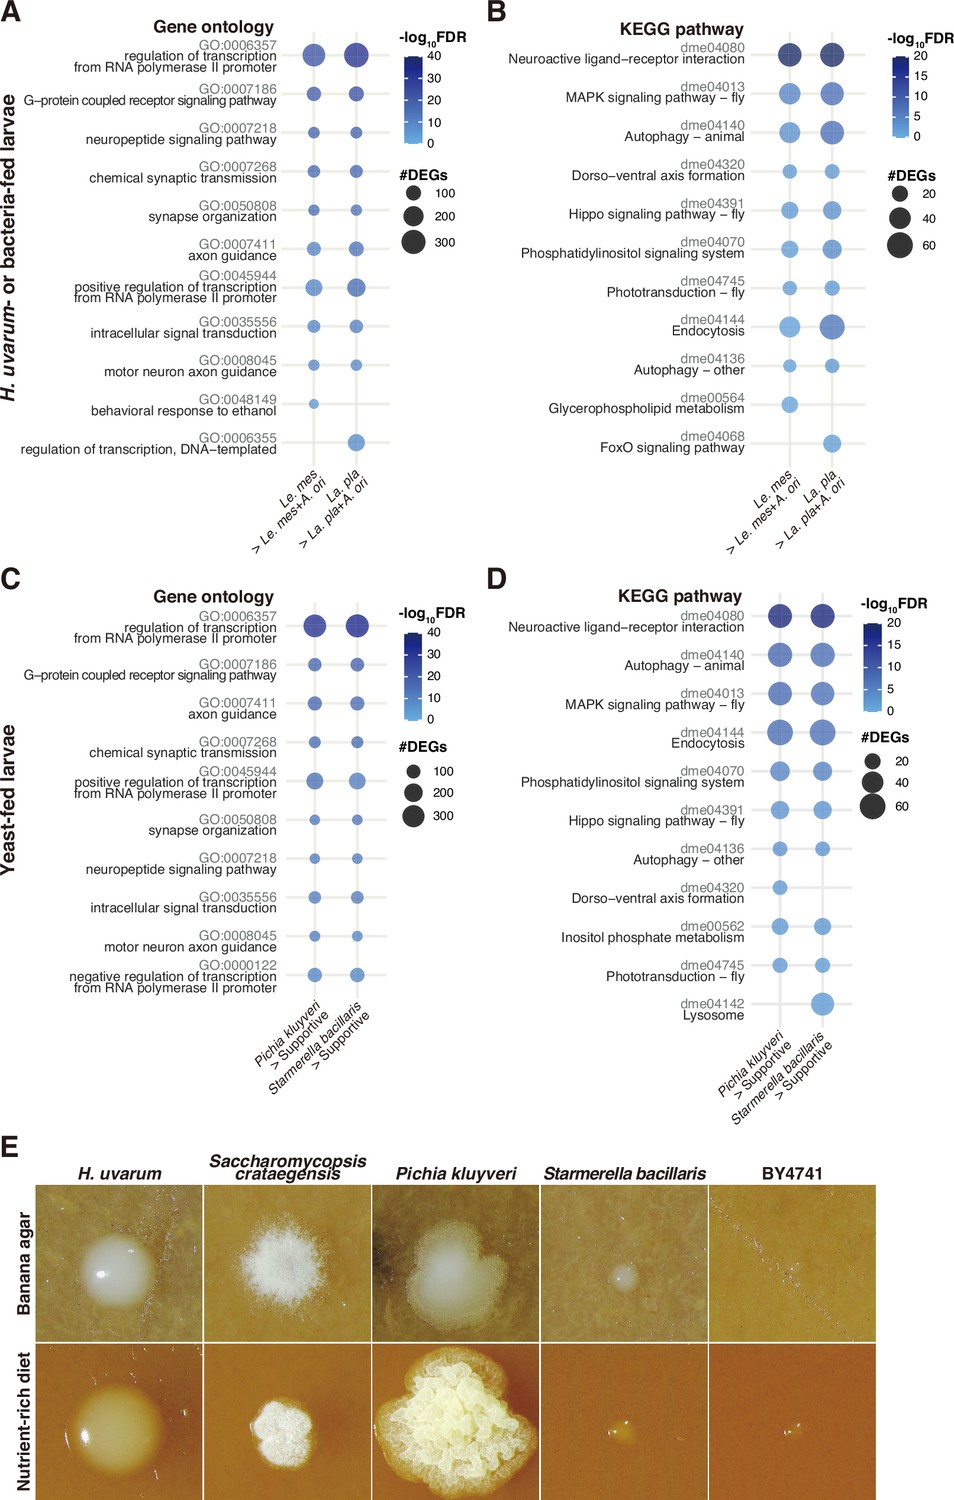
Enrichment analyses of the genes upregulated in non-supportive conditions and morphology of yeast colonies grown on a nutrient-rich diet.
Plots showing the result of GO term (A, C) or KEGG pathway (B, D) enrichment analysis of the RNA-seq data shown in Figure 3A (A, B) and Figure 4C (C, D). Plots were generated as described in Figure 3. (E) Images of single yeast colonies grown on banana agar or the nutrient-rich diet. The images were taken after a 2-day incubation at 25°C. La. pla, Lactiplantibacillus plantarum; Le. mes, Leuconostoc mesenteroides; A. ori, Acetobacter orientalis.
-
Figure 3—figure supplement 1—source data 1
Raw data displayed in Figure 3—figure supplement 1.
- https://cdn.elifesciences.org/articles/90148/elife-90148-fig3-figsupp1-data1-v1.xlsx
-
Figure 3—figure supplement 1—source data 2
Raw data of the images displayed in Figure 3—figure supplement 1E.
- https://cdn.elifesciences.org/articles/90148/elife-90148-fig3-figsupp1-data2-v1.zip
Figure 4
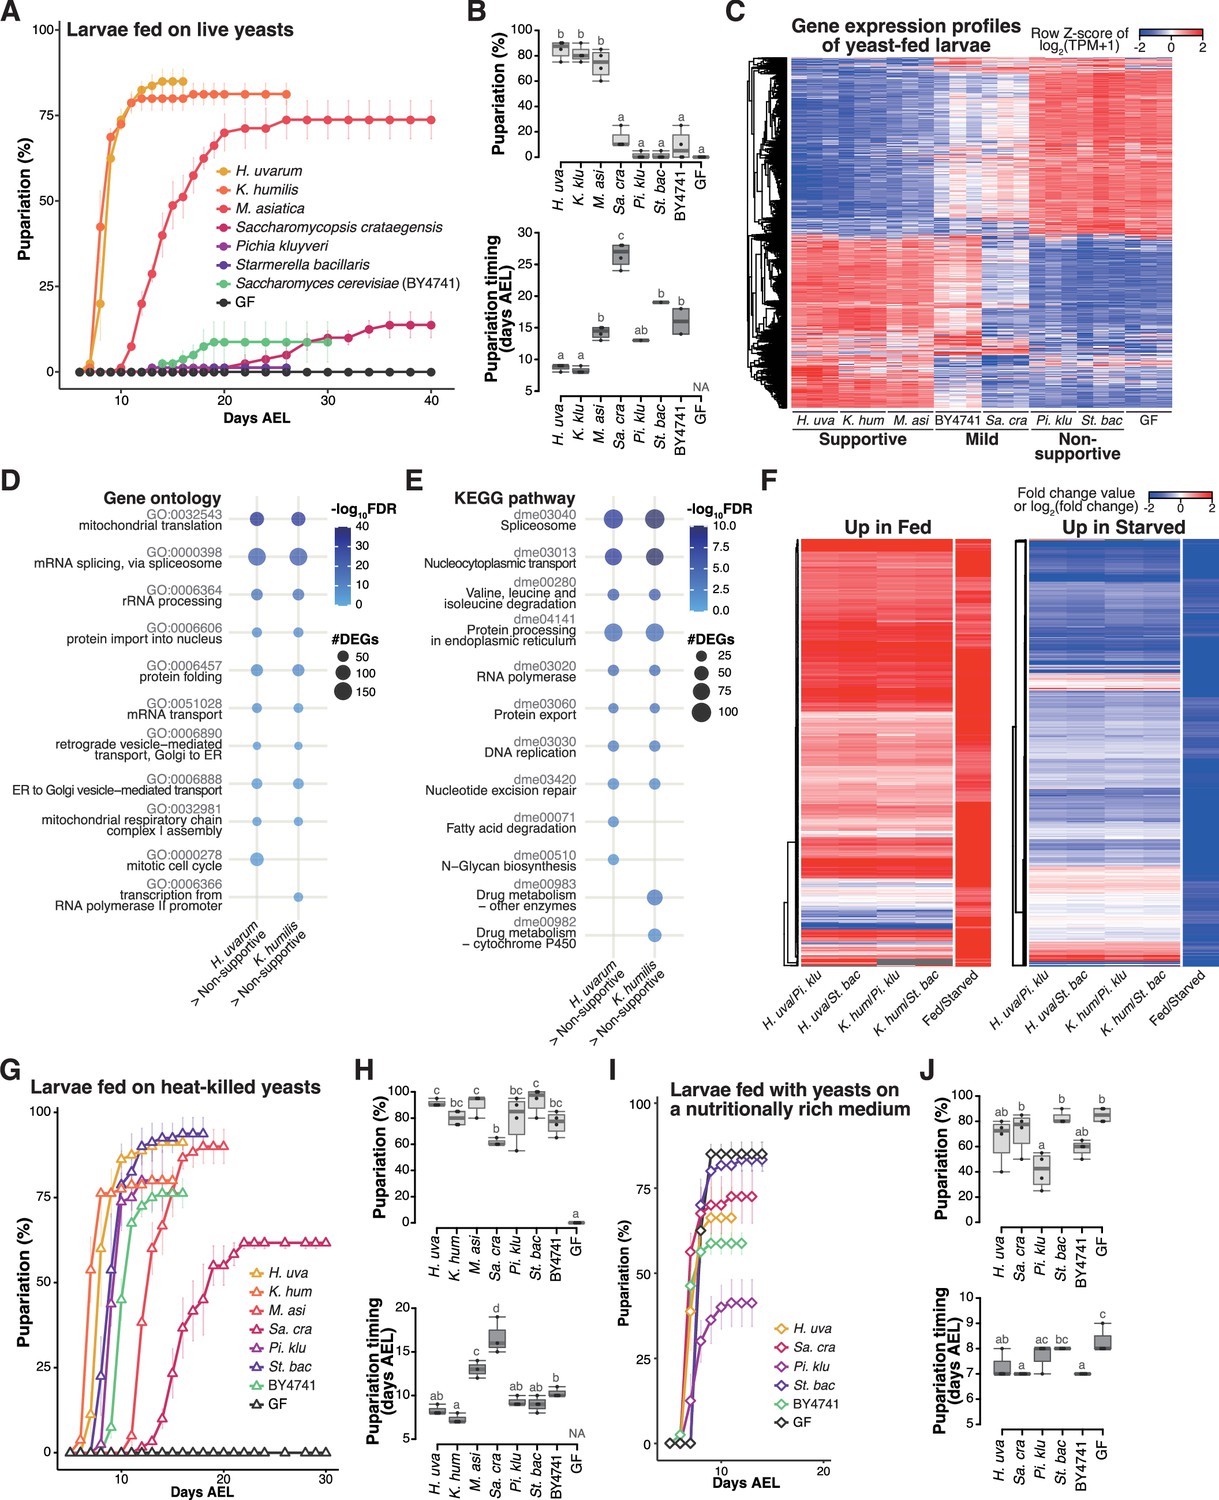
Isolated yeast species promote larval development to varying degrees, but all support larval development upon heat killing.
(A, B) The percentage and timing of pupariation of larvae feeding on live yeasts on banana agar. Graphs are presented as in Figure 2. n = 3–4. (C) Heat map of gene expression values for first instar larvae fed on each yeast species. Freshly hatched germ-free larvae were placed on banana agar inoculated with each microbe and collected after 15 hr feeding to examine gene expression of the whole body. The data of the genes that were differentially expressed between the H. uvarum-fed larvae and the Starmerella bacillaris-fed larvae are shown. Plots showing the result of GO term (D) or KEGG pathway (E) enrichment analysis of the RNA-seq data. Genes that showed significantly higher expression on each of the supportive species than on both the non-supportive species were analyzed. 10 terms/pathways that showed the smallest FDR in each analysis are shown. (F) Heat maps showing the similarity between our RNA-seq data and microarray data in Zinke et al., 2002, shown as described in Figure 3. (G–J) The percentage and timing of pupariation of the larvae feeding on heat-killed yeasts on banana agar (G, H) or live yeasts on a nutritionally rich medium (I, J). Graphs are depicted as in Figure 2. n = 3–4. H. uva, Hanseniaspora uvarum; K. hum, Kazachstania humilis; M. asi, Martiniozyma asiatica; Sa. cra, Saccharomycopsis crataegensis; Pi. klu, Pichia kluyveri; St. bac, Starmerella bacillaris; BY4741, Saccharomyces cerevisiae BY4741 strain; GF, germ-free; NA, not applicable; days AEL, days after egg laying.
-
Figure 4—source data 1
Raw data displayed in Figure 4.
- https://cdn.elifesciences.org/articles/90148/elife-90148-fig4-data1-v1.xlsx
Figure 5 with 1 supplement

Metabolomic analysis of yeast cells, yeast-conditioned banana-agar plates, or cell suspension supernatants.
Heat maps displaying all detected metabolites (A, C, E) or only the metabolites included in a chemically defined synthetic (holidic) medium for Drosophila melanogaster (Piper et al., 2014) (B, D, F) detected from the metabolomic analysis of banana-agar plates (A, B), yeast cells (C, D), or yeast-cell suspension supernatants (E, F). Row Z-scores of normalized peak areas are shown. Normalized peak areas of leucine (G) and isoleucine (H) in yeast-cell suspension supernatants. Boxplots are presented as in Figure 2. Unique letters indicate significant differences between groups (Steel–Dwass test, p < 0.05).
Figure 5—figure supplement 1
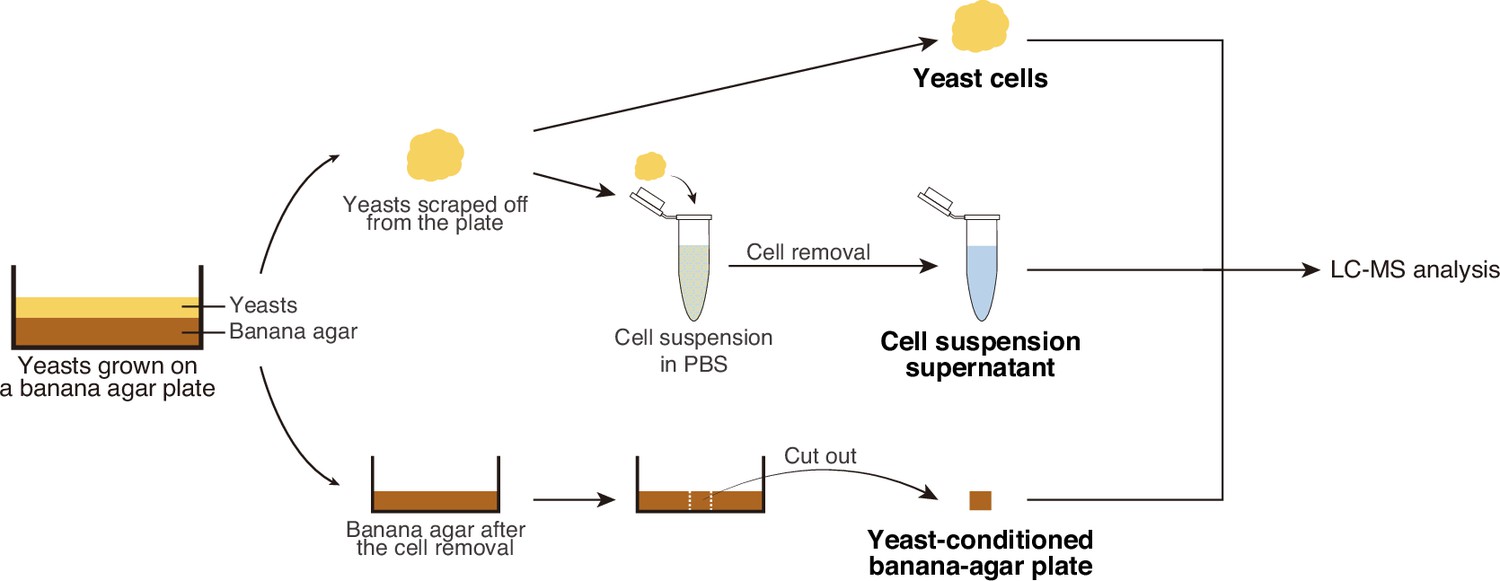
Sample preparations for the metabolomic analysis.
Sample preparation process for the metabolomic analysis. We suspected that the supportive live yeast cells may release critical nutrients for larval growth, whereas the non-supportive yeasts may not. To test this possibility, we made three distinct sample preparations of individual yeast strains (yeast cells, yeast-conditioned banana-agar plates, and cell suspension supernatants). Yeast cells were for the analysis of intracellular metabolites, whereas yeast-conditioned banana-agar plates and cell suspension supernatants were for that of extracellular metabolites. The samples were prepared as the following procedures. Yeasts were grown on banana-agar plates for 2 days at 25°C, and then scraped from the plates to obtain ‘yeast cells’. Next, the remaining yeasts on the resultant plates were thoroughly removed, and a portion from each plate was cut out (‘yeast-conditioned banana agar’). In addition, we suspended yeast cells from the agar plates into sterile phosphate-buffered saline (PBS), followed by centrifugation and filtration to eliminate the yeast cells, to prepare ‘cell suspension supernatants’.
Figure 6
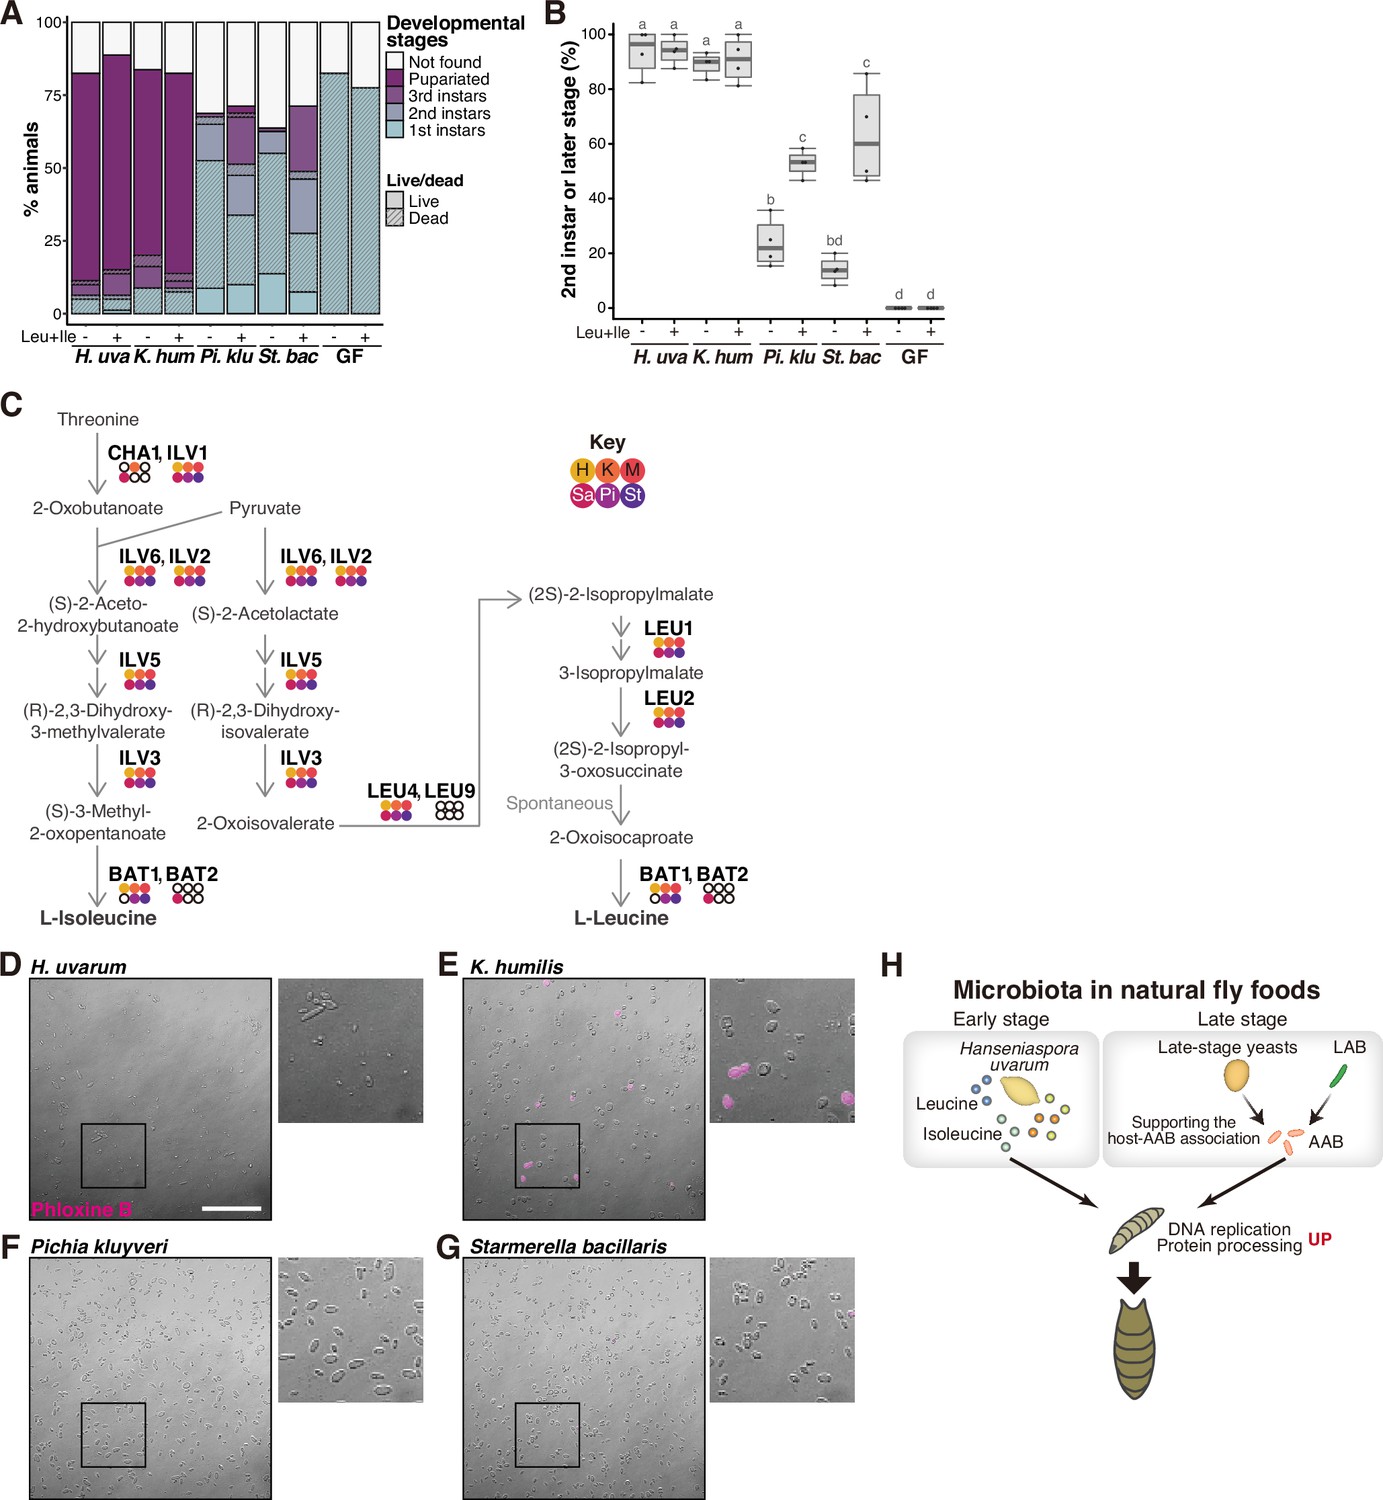
Supportive yeasts facilitate larval growth by providing nutrients, including branched-chain amino acids, by releasing them from their cells.
(A, B) Growth of larvae feeding on yeasts on banana agar supplemented with leucine and isoleucine. (A) The mean percentage of the live/dead individuals in each developmental stage. n = 4. (B) The percentage of larvae that developed into second instar or later stages. The ‘Not found’ population in (A) was omitted from the calculation. Each data point represents data from a single tube. Unique letters indicate significant differences between groups (Tukey–Kramer test, p < 0.05). (C) The biosynthetic pathways for leucine and isoleucine with Saccharomyces cerevisiae gene names are shown. The colored dots indicate enzymes that are conserved in the six isolated species, while the white dots indicate those that are not conserved. Abbreviations of genera are given in the key in the upper right corner. LEU2 is deleted in BY4741. (D–G) Representative image of Phloxine B-stained yeasts. The right-side images are expanded images of the boxed areas. The scale bar represents 50 µm. (H) Summary of this study. H. uvarum is predominant in the early-stage food and provides Leu, Ile, and other nutrients that are required for larval growth. In the late-stage food, AAB directly provides nutrients, while lactic acid bacteria (LAB) and yeasts indirectly contribute to larval growth by enabling the stable larva–AAB association. The host larva responds to the nutritional environment by dramatically altering gene expression profiles, which leads to growth and pupariation. H. uva, Hanseniaspora uvarum; K. hum, Kazachstania humilis; Pi. klu, Pichia kluyveri; St. bac, Starmerella bacillaris; GF, germ-free.
-
Figure 6—source data 1
Raw data displayed in Figure 6.
- https://cdn.elifesciences.org/articles/90148/elife-90148-fig6-data1-v1.xlsx
-
Figure 6—source data 2
Raw data of the images displayed in Figure 6D–G.
- https://cdn.elifesciences.org/articles/90148/elife-90148-fig6-data2-v1.zip
Author response image 1

Gene expression profiles of larvae fed on the various supporting microbes show striking similarities to each other.
Heat map showing the gene expression of the first-instar larvae that fed on yeasts or bacteria. Freshly hatched germ-free larvae were placed on banana agar inoculated with each microbe and collected after 15 h feeding to examine gene expression of the whole body. Note that data presented in Figures 3A and 4C in the original manuscript, which are obtained independently, are combined to generate this heat map. The labels under the heat map indicate the microbial species fed to the larvae, with three samples analyzed for each condition. The lactic acid bacteria (“LAB”) include Lactiplantibacillus plantarum and Leuconostoc mesenteroides, while the lactic acid bacterium (“AAB”) represents Acetobacter orientalis. “LAB + AAB” signifies mixtures of the AAB and either one of the LAB species. The asterisks in the label highlight “LAB + AAB” or “LAB” samples clustered separately from the other samples in those conditions; “” indicates a sample in a “LAB + AAB” condition (Lactiplantibacillus plantarum + Acetobacter orientalis), and “*” indicates a sample in a “LAB” condition (Leuconostoc mesenteroides). Brown abbreviations of scientific names are for the yeast-fed conditions. H. uva, Hanseniaspora uvarum; K. hum, Kazachstania humilis; M. asi, Martiniozyma asiatica; Sa. cra, Saccharomycopsis crataegensis; P. klu, Pichia kluyveri; St.bac, Starmerella bacillaris; BY4741, Saccharomyces cerevisiae BY4741 strain.
Author response image 2

Supportive yeasts facilitate larval growth by providing nutrients, including branched-chain amino acids, by releasing them from their cells (Figure 6 from the original manuscript).
(A and B) Growth of larvae feeding on yeasts on banana agar supplemented with leucine and isoleucine. (A) The mean percentage of the live/dead individuals in each developmental stage. n=4. (B) The percentage of larvae that developed into second instar or later stages. The “Not found” population in Figure 6A was omitted from the calculation. Each data point represents data from a single tube. Unique letters indicate significant differences between groups (Tukey-Kramer test, p < 0.05). (C) The biosynthetic pathways for leucine and isoleucine with S. cerevisiae gene names are shown. The colored dots indicate enzymes that are conserved in the six isolated species, while the white dots indicate those that are not conserved. Abbreviations of genera are given in the key in the upper right corner. LEU2 is deleted in BY4741. (D-G) Representative image of Phloxine B-stained yeasts. The right-side images are expanded images of the boxed areas. The scale bar represents 50 µm. (H) Summary of this study. H. uvarum is predominant in the early-stage food and provides Leu, Ile, and other nutrients that are required for larval growth. In the late-stage food, AAB directly provides nutrients, while LAB and yeasts indirectly contribute to larval growth by enabling the stable larva-AAB association. The host larva responds to the nutritional environment by dramatically altering gene expression profiles, which leads to growth and pupariation. H. uva, Hanseniaspora uvarum; K. hum, Kazachstania humilis; Pi. klu, Pichia kluyveri; St. bac, Starmerella bacillaris; GF, germ-free.
Author response image 3

Comparison of the original and revised version of bacterial composition graph in Figure 1B.
Comparison of the original (left) and revised (right) version of the graph at the bottom of Figure 1B, which shows the result of bacterial composition analysis. The color key, which is unmodified, is placed below the revised version.
Author response image 4

Comparison of the original and revised version of Figures 3A and 4C.
(A and B) Comparison of the original (left) and revised (right) version of Figures 3A (A) or 4C (B).
Author response image 5

Comparison of the original and revised version of Figures 3D and 4F.
(A and B) Comparison of the original (left) and revised (right) version of Figures 3D (A) or 4F (B).
Author response image 6

Comparison of the original and revised version of Figures S5C and S5D.
(A and B) Comparison of the original (left) and revised (right) versions of Figures S5C (A) or S5D (B). The original figures corresponding to the aforementioned figures were Figures S4C and S4D, respectively.
Tables
Table 1
List of microbial species used in the feeding experiments.
Percentages indicate the relative abundance of each species in the foods shown in Figure 1B.
| Yeast or bacterium | Family | Species | Sampling Place 1 (early stage) | Sampling Place 1 (late stage) | Sampling Place 2 (early stage) | Sampling Place 2 (late stage) |
|---|---|---|---|---|---|---|
| Yeast | Saccharomycodaceae | Hanseniaspora uvarum | 20.93% | 79.28% | 2.11% | |
| Yeast | Pichiaceae | Pichia kluyveri | 40.09% | 26.26% | 19.07% | 97.14% |
| Yeast | incertae sedis | Starmerella bacillaris | 72.97% | |||
| Bacterium | Erwiniaceae | Pantoea agglomerans | 45.31% | 12.81% | 90.56% | 6.17% |
| Bacterium | Lactobacillaceae | Leuconostoc mesenteroides | 54.17% | |||
| Bacterium | Lactobacillaceae | Lactiplantibacillus plantarum | 60.84% | |||
| Bacterium | Acetobacteraceae | Acetobacter orientalis | 8.25% | 15.48% |
Appendix 1—key resources table
| Reagent type (species) or resource | Designation | Source or reference | Identifiers | Additional information |
|---|---|---|---|---|
| Genetic reagent (Drosophila melanogaster) | Canton-Special | EHIME-Fly Drosophila Stocks of Ehime University | E-10002 | |
| Genetic reagent (D. melanogaster) | Cg-GAL4 | Asha et al., 2003 (doi: 10.1093/genetics/163.1.203) | ||
| Strain, strain background (Saccharomyces cerevisiae) | BY4741 | NBRP-Yeast | BY23849 | |
| Strain, strain background (Lactiplantibacillus plantarum) | WJL | Kim et al., 2021 (doi: 10.1038/s41586-021-03522-2) | ||
| Strain, strain background (Lactiplantibacillus plantarum) | LactoBCAA | Kim et al., 2021 (doi: 10.1038/s41586-021-03522-2) | ||
| Sequence-based reagent | ITS3 | White et al., 1990 | PCR primers | GCATCGATGAAGAACGCAGC |
| Sequence-based reagent | ITS4 | White et al., 1990 | PCR primers | TCCTCCGCTTATTGATATGC |
| Sequence-based reagent | 341 F | Hugerth et al., 2014 (doi: 10.1128/AEM.01403-14) | PCR primers | CCTACGGGNGGCWGCAG |
| Sequence-based reagent | 805R | Hugerth et al., 2014 (doi: 10.1128/AEM.01403-14) | PCR primers | GACTACHVGGGTATCTAATCC |
| Sequence-based reagent | 518F | https://www.macrogen-japan.co.jp/cap_seq_0104.php | PCR primers | CCAGCAGCCGCGGTAATACG |
| Sequence-based reagent | NL1 | Chandler et al., 2012 (doi: 10.1128/AEM.01741-12) | PCR primers | GCATATCAATAAGCGGAGGAAAAG |
| Sequence-based reagent | NL4 | Chandler et al., 2012 (doi: 10.1128/AEM.01741-12) | PCR primers | GGTCCGTGTTTCAAGACGG |
| Sequence-based reagent | 27F | Chandler et al., 2011 (doi: 10.1371/journal.pgen.1002272) | PCR primers | AGAGTTTGATCCTGGCTCAG |
| Sequence-based reagent | 1492R | Chandler et al., 2011 (doi: 10.1371/journal.pgen.1002272) | PCR primers | GGTTACCTTGTTACGACTT |
| Commercial assay or kit | QIAamp DNA Stool Mini Kit | QIAGEN | Cat# 51504 | |
| Commercial assay or kit | THUNDERBIRD SYBR qPCR Mix | TOYOBO | Cat# QPS-201 | |
| Commercial assay or kit | InstaGene Matrix | Bio-Rad | Cat# 7326030 | |
| Commercial assay or kit | KOD FX | TOYOBO | Cat# KFX-101 | |
| Commercial assay or kit | Wizard SV Gel and PCR Clean-Up System | Promega | Cat# A9282 | |
| Commercial assay or kit | QIAGEN Genomic-tip 20G kit | QIAGEN | Cat# 10223 | |
| Commercial assay or kit | QIAseq FX DNA Library Kit | QIAGEN | Cat# 180477 | |
| Commercial assay or kit | Rapid Barcoding Kit | ONT | Cat# SQK-RBK004 | |
| Commercial assay or kit | RNeasy mini kit | QIAGEN | Cat# 74104 | |
| Commercial assay or kit | NEBNext Ultra II Directional RNA Library Prep Kit for Illumina | NEB | Cat# E7760 | |
| Commercial assay or kit | Biomasher II homogenizer kit | NIP | Cat# 320103 | |
| Chemical compound, drug | MRS Broth | Merck Millipore | Cat# 110661 | |
| Chemical compound, drug | YPD medium | Clontech | Cat# 630409 | |
| Chemical compound, drug | Potato Dextrose Broth | Sigma-Aldrich | Cat# P6685-250G | |
| Chemical compound, drug | Propionic acid | Nacalai Tesque | Cat# 29018-55 | |
| Chemical compound, drug | Cycloheximide | Wako | Cat# 037-20991 | |
| Chemical compound, drug | Ampicillin | Nacalai Tesque | ||
| Chemical compound, drug | Zymolyase-20T | Nacalai Tesque | Cat# 07663-91 | |
| Chemical compound, drug | Leucine | Nacalai Tesque | Cat# 20327-62 | |
| Chemical compound, drug | Isoleucine | Peptide Institute | Cat# 2712 | |
| Chemical compound, drug | Phloxine B | Wako | Cat# 166-02072 | |
| Software, algorithm | FLASH | Magoč and Salzberg, 2011 (doi: 10.1093/bioinformatics/btr507) | ||
| Software, algorithm | CD-HIT-OTU | Fu et al., 2012 (doi: 10.1093/bioinformatics/bts565); Li and Godzik, 2006 (doi: 10.1093/bioinformatics/btl158) | ||
| Software, algorithm | QIIME | Caporaso et al., 2010 (doi: 10.1038/nmeth.f.303) | ||
| Software, algorithm | NCBI BLAST search | Johnson et al., 2008 (doi: 10.1093/nar/gkn201) | ||
| Software, algorithm | RDP sequence match tool | Cole et al., 2014 (doi: 10.1093/nar/gkt1244) | ||
| Software, algorithm | Platanus_trim | http://platanus.bio.titech.ac.jp/pltanus_trim | ||
| Software, algorithm | GenomeScope | Vurture et al., 2017 (doi: 10.1093/bioinformatics/btx153) | ||
| Software, algorithm | Albacore ver. 2.3.3. | ONT | ||
| Software, algorithm | NanoFilt | De Coster et al., 2018 (doi: 10.1093/bioinformatics/bty149) | ||
| Software, algorithm | Porechop | https://github.com/rrwick/Porechop | ||
| Software, algorithm | MaSuRCA v3.2.6 | Zimin et al., 2013 (doi: 10.1093/bioinformatics/btt476) | ||
| Software, algorithm | BUSCO | Simão et al., 2015 (doi: 10.1093/bioinformatics/btv351) | ||
| Software, algorithm | GenomeMatcher | Ohtsubo et al., 2008 (doi: 10.1186/1471-2105-9-376) | ||
| Software, algorithm | FunGAP | Min et al., 2017 (doi: 10.1093/bioinformatics/btx353) | ||
| Software, algorithm | Hisat2 | Kim et al., 2015 (doi: 10.1038/nmeth.3317) | ||
| Software, algorithm | gplots | Warnes et al., 2022 (https://CRAN.R-project.org/package=gplots) | ||
| Software, algorithm | R | R Development Core Team, 2020 | RRID:SCR_001905 | |
| Software, algorithm | Database for annotation, visualization and integrated discovery (DAVID) Functional Annotation Chart | Huang et al., 2009 (doi: 10.1038/nprot.2008.211); Sherman et al., 2022 (doi: 10.1093/nar/gkac194) | ||
| Software, algorithm | MetaboAnalystR 3.3.0. | Pang et al., 2020 (doi: 10.3390/metabo10050186) | ||
| Other | UltrafreeMC-PLHCC for Metabolome Analysis column | Human Metabolome Technologies | Cat# UFC3LCCNB-HMT | See 'Preparing samples for LC–MS analysis' in Materials and methods |
| Other | Discovery HS F5-3 column | Sigma-Aldrich | Cat# 567503-U | See 'LC–MS/MS measurement' in Materials and methods |
Author response table 1
Antimicrobial peptide genes are not up-regulated by any of the microbes.
Antimicrobial peptides gene expression profiles of whole bodies of first-instar larvae fed on yeasts. TPM values of all samples and comparison results of gene expression levels in the larvae fed on supportive and non-supportive yeasts are shown. Antibacterial peptide genes mentioned in Hanson and Lemaitre, 2020 are listed. NA or na, not available.
| TRM mulem | ||||||||||||||||||||||||||||||
|---|---|---|---|---|---|---|---|---|---|---|---|---|---|---|---|---|---|---|---|---|---|---|---|---|---|---|---|---|---|---|
| M sabites | avasat | arm-tios | ||||||||||||||||||||||||||||
| a | 2 | a^(3)+2x-2 | 2 = | N.wa,os sin s | N.ws,a twac | |||||||||||||||||||||||||
| Anososen | opt | 0 | 0 | 0 | 4 | 0 | 51 | na | m | mas | m | ma | NA | NA | Ma | |||||||||||||||
| pos | 8 | g | g | if | A3 | g. | 6 | 8 | 昰 | na | m | m | m | m | AA | MA | m | |||||||||||||
| Egno1 1200 | sh | 0 | 0 | 0 | 2 | 0 | 01 | 11 | 0 | 6 | 0 | 6 | na | m | m | ma | MA | MA | ||||||||||||
| As | 0 | 0 | 0 | 0 | 0 | 0 | 5 | 0 | 0 | 02 | 26 | 0 | 0 | 0 | 15 | na | m | mo | m | man | AA | NA | ||||||||
| tan oo415 | sac | 0 | 0 | a | 0 | 0 | a | a | 02 | 0 | a | a | nà | m | m | m | m | NA | NA | ma | ||||||||||
| Mo | 0 | 0 | o | G | I | G | g | 需 | g | 0 | o | na | m | ma | m | ma | MA | MA | Ma | |||||||||||
| tan 01039 | oo | a | 3 | 0 | 6 | 10 | 0 | 7 | na | m | in | AA | MA | ma | ||||||||||||||||
| sec | 0 | 6 | 1 | 0 | 0 | 4 | 0 | 0 | 0 | 15 | na | ma | as | m | NA | MA | in | |||||||||||||
| oacses | 0 | 0 | 可 | 0 | 0 | 可 | 0 | 6 | 1 | 0 | 0 | a | 百 | na | ma | mis | m | ma | NA | NA | m | |||||||||
| aces | 0 | a | 百 | 0 | 0 | a | of | 0 | 0 | 0 | 0 | o | 0 | 8 | na | m | in | in | m | NA | NA | ma | ||||||||
| cos | g | g | if | 1) | a | 0 | 8 | 1 | 0. | 8 | 4 | na | m | |||||||||||||||||
| Fono00034 | anp | 0 | of | 0 | 0 | pi | of | 0 | 6 | 0 | 0 | 8 | 0 | 0 | na | m | ma | na | ma | AA | AA | 44 | ||||||||
| det | 0 | 0 | 0 | 0 | 3 | 0 | 0 | 0 | 0 | 0 | 0 | 1 | na | m | m | ma | MA | NA | mas | |||||||||||
| a_(5) | 可 | 1 | 3 | 8 | 0 | o. | 18 | 25 | a | 5 | 13 | 8 | 0. | ná | mas | |||||||||||||||
| axsin | 0 | G | G | g | 0 | g | 0 | a | 0 | na | 成 | (日) | 用 | m | MA | MA | m | |||||||||||||
| |x:22 | 8 | 0 | a | o | a | 8 | a | a | 0 | a | a | na | m | it | II | m | MA | MA | Ma | |||||||||||
| Egnos | orel | 0 | 0 | 0 | 0 | 0 | 0 | 0 | 0 | 0 | 0 | 0 | 0 | 0 | na | ma | ma | ma | m | NA | NA | 14 | ||||||||
| ares | 0 | 0 | 0 | 6 | 0 | 0 | theta | 0 | 0 | 0 | 0 | 0 | 0 | na | m | m | ma | in | NA | NA | in | |||||||||
| 00035444 | ars 5 | a | 1 | a | 4 | a | a | 0 | 0 | 0 | 1 | 2 | 0 | 6 | na | ma | in | m | m | NA | NA | |||||||||
| axse | 0 | of | g | g | G | g | g | 0 | 6 | rarr | 0 | na | m | m | m | ma | MA | MA | m | |||||||||||
| m | 2 | 2 | 2 | 0 | 5 | 2 | 25 | 1 | 2 | 2 | n | NA | m | |||||||||||||||||
| 国onoses | min | 5 | (4)/(4) | 3 | 0 | 6 | 可 | (1)/(1) | 4 | 23 | 1 | 1 | 3 | 1 | 2 | ns | pi | ma | ma | 0.28 | 0.16 | NA | ins | |||||||
| M:4 | 1 | 百 | a | 0 | 讨 | G | a | 06 | 可 | 6 | 0 | 0 | if | 12 | na | m | m | กล | m | NA | NA | Nas | ||||||||
| Æoncos4512 | 3 | 10 | 11 | 8 | 7 | (3) | 15 | 172 | 27 | 9 | 13 | 23 | M∼oo AF=N | K min sin x | -1.54 | -1.97 | -1.o+ | |||||||||||||
| tonosys9 | Mt | 0 | 0 | 0 | 19 | 1 | 211 | 16 | 1 | 1 | 3 | na | ia | m | M | NA | NA | m | ||||||||||||
| कotat & | 1 | 1 | a | 11 | 13. | 16 | 2 | 10 | 1a | na | n=0 sin s | mi | K sin sise | NA | -200 | NA | ||||||||||||||
| Enos: | Me | 0 | 0 | 者 | pi | 0 | 8 | 66 | 0 | 10 | 4 | na | sin | ros | m | sh | NA | NA | m | |||||||||||
| mos | 0 | 8 | 保 | g | 8 | 12 | rarr | 01 | 0 | 8 | 2 | pi | na | ma | - | m | MA | MA | NA | m | ||||||||||
| orsin: | 2 | 8 | 2 | a) | 1 | 22 | 24 | 3 | 3 | 15 | 11 | na | ma | m | m | MA | MA | ma | ||||||||||||
| cosse: | 0 | 0 | 13 | 213 | 36 | 0 | 14: | a | กล | r sin,< 5sax | a | ma | 908 | NA | -925 | |||||||||||||||
| 03.420 | 0 | 8 | 0 | 1 | 6 | 6 | 1 | na | is | m | Na | NA | NA | Ma | ||||||||||||||||
| 3 | theta | 0 | 0 | 0 | 5 | 0 | 8 | na | na | ai | m | M | NA | NA | mh | |||||||||||||||
| Enos | cas7a | 0 | a | 2 | 1 | 3 | - | m | Ma | |||||||||||||||||||||
| mes | 0 | 0 | theta1 | 10 | 0 | G | 6 | na | in | m | m | res | 13 | A | mas | |||||||||||||||
| tonow3 | काळब | 0 | 0 | f | 可 | 0 | g | 1 | 图 | 0 | 11 | 19 | 0 | 0 | 3 | na | is | m | ma | ma | NA | NA | ma | |||||||
| 0 | 0 | 0 | 0 | na | กิ | ma | ma | NA | NA | MA |
Author response table 2
Most of the peptidase genes reported by Erkosar et al.
, 2015 are more highly expressed under the non-supportive conditions than the supportive conditions. Comparison of the expression levels of seven peptidase genes derived from the RNA-seq analysis of yeast-fed (A) or bacteria-fed (B) first-instar larvae. A previous report demonstrated that the expression of these genes is upregulated upon association with a strain of Lactiplantibacillus plantarum, and that the PGRP-LE/Imd/Relish signaling pathway, at least partially, mediates the induction (Erkosar et al., 2015). H. uva, Hanseniaspora uvarum; K. hum, Kazachstania humilis; P. klu, Pichia kluyveri; S. bac, Starmerella bacillaris; La. pla, Lactiplantibacillus plantarum; Le. mes, Leuconostoc mesenteroides; A. ori, Acetobacter orientalis; ns, not significant.
| FlyBase ID | symbol | gene_name | Significant difference between conditions | log 2 (fold change) | ||||||
|---|---|---|---|---|---|---|---|---|---|---|
| H. uva (H) or P. klu (P) | H. uva (H) or S. bac (S) | K. hum (K) or P. Kiu (P) | K. hum (K) or S. bac (S) | H. uva /P. Kiu | H. uva /S. bac | K. hum /P. klu | K. hum IS. bac | |||
| FBgn0035887 | Jon 66 Cii | Jonah 66Cii | H > P | H > S | ns | ns | 0.47 | 0.50 | -0.24 | -0.21 |
| FBgn0035886 | Jon 66Ci | Jonah 66Ci | H <= P | H≪S | K <= P | -1.27 | -0.91 | -1.31 | -0.94 | |
| FBgn0001285 | Jon44E | Jonah 44E | H < P | H < S | K < P | K&S | -0.66 | -0.52 | -0.96 | -0.82 |
| FBgn0035667 | Jon65Ai | Jonah 65Ai | H < P | H < S | K < P | K < S | -0.51 | -0.59 | -0.60 | -0.68 |
| FBgn0003358 | Jon 99Ci | Jonah 99Ci | H > P | H > S | Kos | 0.77 | 0.97 | 0.67 | 0.87 | |
| FBgn0036023 | CG18179 | - | H < P | H < S | K < P | K < S | -1.38 | -0.55 | -1.38 | -0.56 |
| FBgn0036024 | CG18180 | - | H < P | H < S | K < P | -0.84 | -0.69 | -0.53 | -0.38 |
Additional files
-
Supplementary file 1
Details of the samplings of fermented bananas and wild Drosophila.
- https://cdn.elifesciences.org/articles/90148/elife-90148-supp1-v1.xlsx
-
Supplementary file 2
Microbial composition analysis results.
- https://cdn.elifesciences.org/articles/90148/elife-90148-supp2-v1.xlsx
-
Supplementary file 3
Microbial isolation and species identification.
- https://cdn.elifesciences.org/articles/90148/elife-90148-supp3-v1.xlsx
-
Supplementary file 4
RNA-seq data of whole bodies of first instar larvae fed on H. uvarum or bacteria.
- https://cdn.elifesciences.org/articles/90148/elife-90148-supp4-v1.xlsx
-
Supplementary file 5
RNA-seq data of whole bodies of first instar larvae fed on yeasts.
- https://cdn.elifesciences.org/articles/90148/elife-90148-supp5-v1.xlsx
-
Supplementary file 6
Results of metabolomic analysis of yeast samples.
- https://cdn.elifesciences.org/articles/90148/elife-90148-supp6-v1.xlsx
-
Supplementary file 7
Final genome assembly and annotation statuses of six yeast strains.
- https://cdn.elifesciences.org/articles/90148/elife-90148-supp7-v1.xlsx
-
Supplementary file 8
RNA-seq data of isolated yeasts.
- https://cdn.elifesciences.org/articles/90148/elife-90148-supp8-v1.xlsx
-
Supplementary file 9
Statistical details of experiments.
- https://cdn.elifesciences.org/articles/90148/elife-90148-supp9-v1.xlsx
-
MDAR checklist
- https://cdn.elifesciences.org/articles/90148/elife-90148-mdarchecklist1-v1.docx
Download links
A two-part list of links to download the article, or parts of the article, in various formats.
Downloads (link to download the article as PDF)
Open citations (links to open the citations from this article in various online reference manager services)
Cite this article (links to download the citations from this article in formats compatible with various reference manager tools)
Identification of key yeast species and microbe–microbe interactions impacting larval growth of Drosophila in the wild
eLife 12:RP90148.
https://doi.org/10.7554/eLife.90148.3


