Bone canonical Wnt signaling is downregulated in type 2 diabetes and associates with higher advanced glycation end-products (AGEs) content and reduced bone strength
- Department of Medicine and Surgery, Research Unit of Endocrinology and Diabetes, Università Campus Bio-Medico di Roma, Via Alvaro del Portillo, Italy
- Operative Research Unit of Osteometabolic and Thyroid Diseases, Fondazione Policlinico Universitario Campus Bio-Medico, Via Alvaro del Portillo, Italy
- Operative Research Unit of Geriatrics, Fondazione Policlinico Universitario Campus Bio Medico, Via Alvaro del Portillo, Italy
- Operative Research Unit of Orthopedic and Trauma Surgery, Fondazione Policlinico Universitario Campus Bio-Medico, Via Alvaro del Portillo, Italy
- Department of Human Sciences and Promotion of the Quality of Life San Raffaele Roma Open University Via di Val Cannuta, Italy
- Predictive Molecular Diagnostic Unit, Pathology Department, Fondazione Policlinico Universitario Campus Bio-Medico, Via Alvaro del Portillo, Italy
- Microscopic and Ultrastructural Anatomy Unit, Università Campus Bio-Medico di Roma, Via Alvaro del Portillo, Italy
- Department of Medicine, Division of Bone and Mineral Diseases, Musculoskeletal Research Center, Washington University School of Medicine, United States
- Department of Orthopaedic Surgery, Washington University in St. Louis, United States
- Department of Biotechnological and Applied Clinical Sciences, University of L’Aquila, Via Vetoio snc, Italy
- European Center for Brain Research, Santa Lucia Foundation IRCCS, Italy
Figures
Figure 1
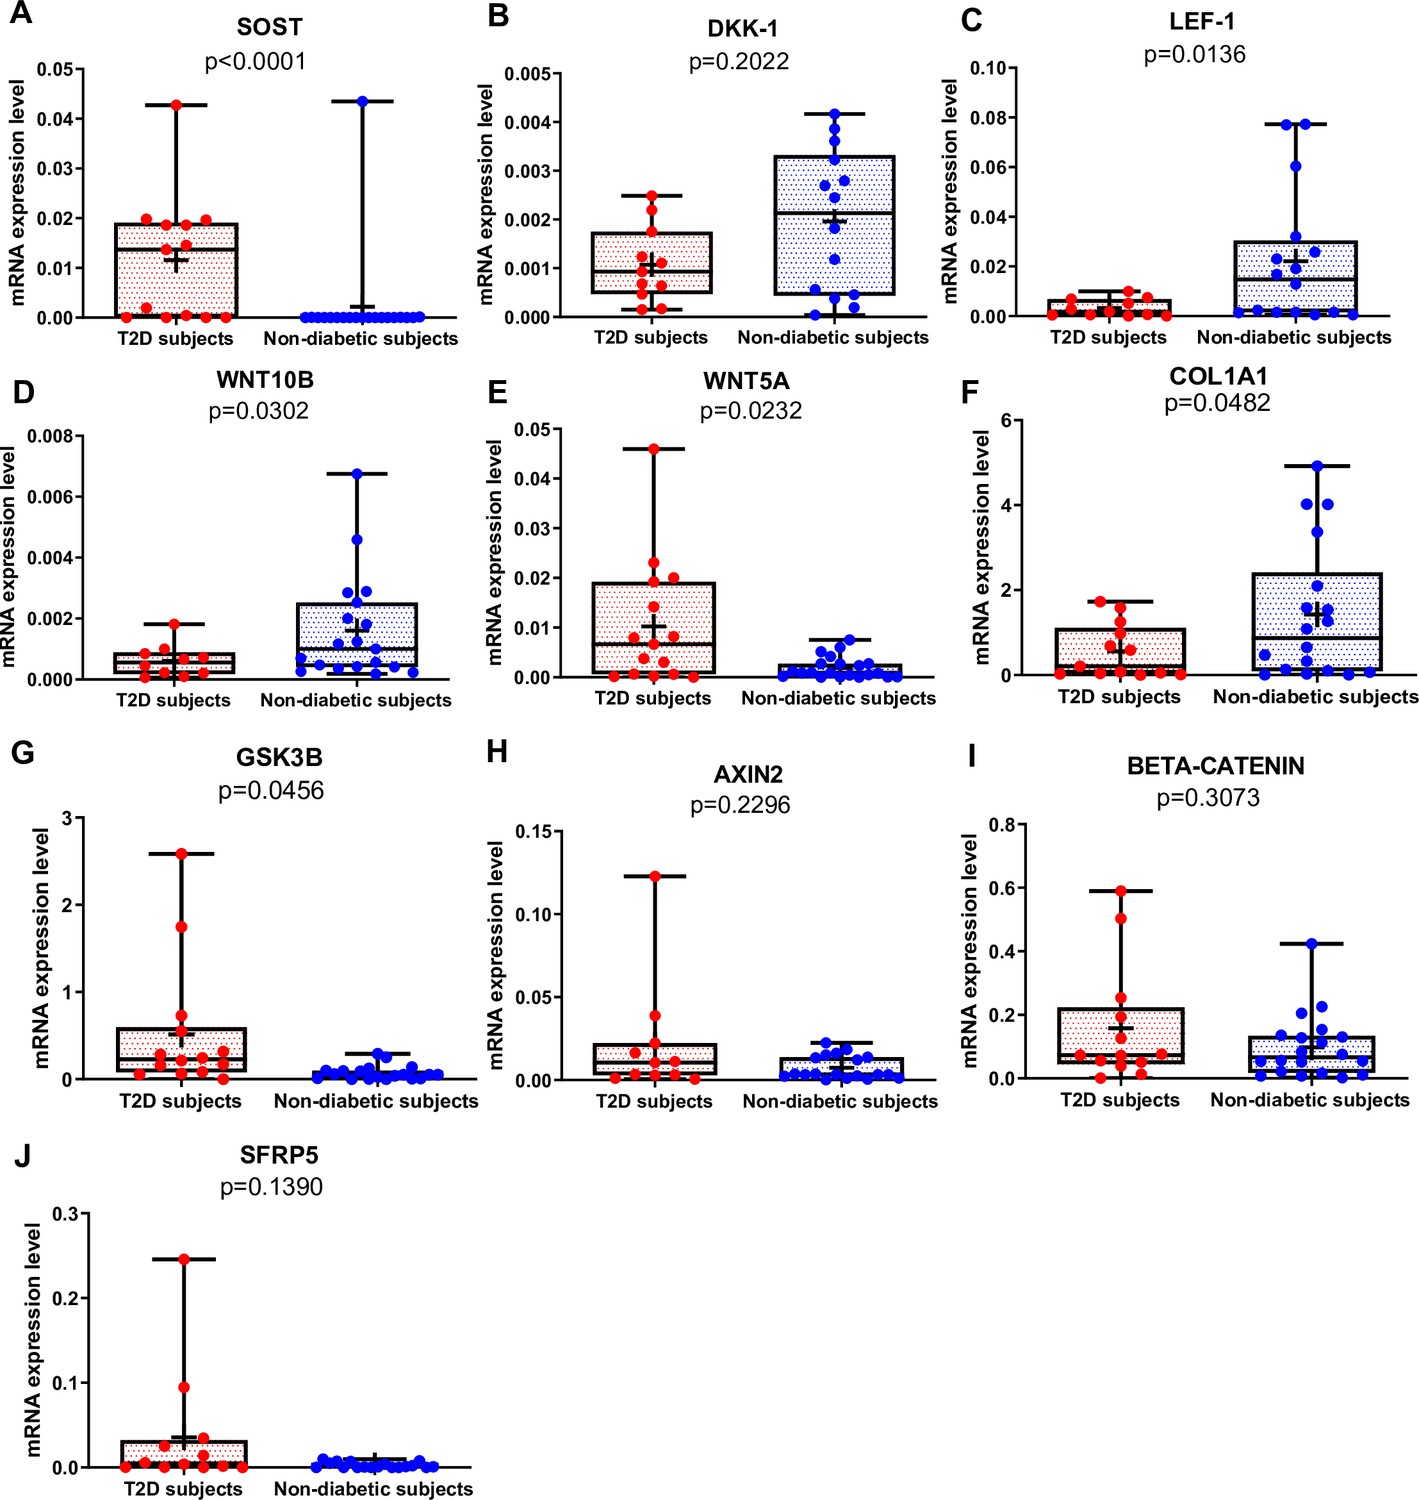
Gene expression analysis in trabecular bone samples.
(A) SOST mRNA levels resulted higher in type 2 diabetes (T2D) subjects versus non-diabetic subjects (p<0.0001). (B) DKK-1 mRNA expression level was not different between groups (p=0.2022). (C) LEF-1 mRNA levels resulted lower in T2D subjects versus non-diabetics subjects (p=0.0136). (D) WNT10B mRNA expression level was lower in T2D subjects versus non-diabetic subjects (p=0.0302). (E) WNT5A mRNA resulted higher in T2D subjects versus non-diabetics subjects (p=0.0232). (F) COL1A1 mRNA levels resulted lower in T2D subjects versus non-diabetic subjects (p=0.0482). (G) GSK3B mRNA levels resulted higher in T2D subjects versus non-diabetic subjects (p=0.0456). (H–J) AXIN2, BETA-CATENIN, SFRP5 mRNA levels were not different between groups (p=0.2296, p=0.3073, p=0.1390). Data are expressed as fold changes over beta-actin. Medians and interquartile ranges, differences between non-diabetics and T2D subjects were analyzed using Mann-Whitney test.
-
Figure 1—source data 1
Data represented by each point in Figure 1A–J.
- https://cdn.elifesciences.org/articles/90437/elife-90437-fig1-data1-v1.xlsx
Figure 2
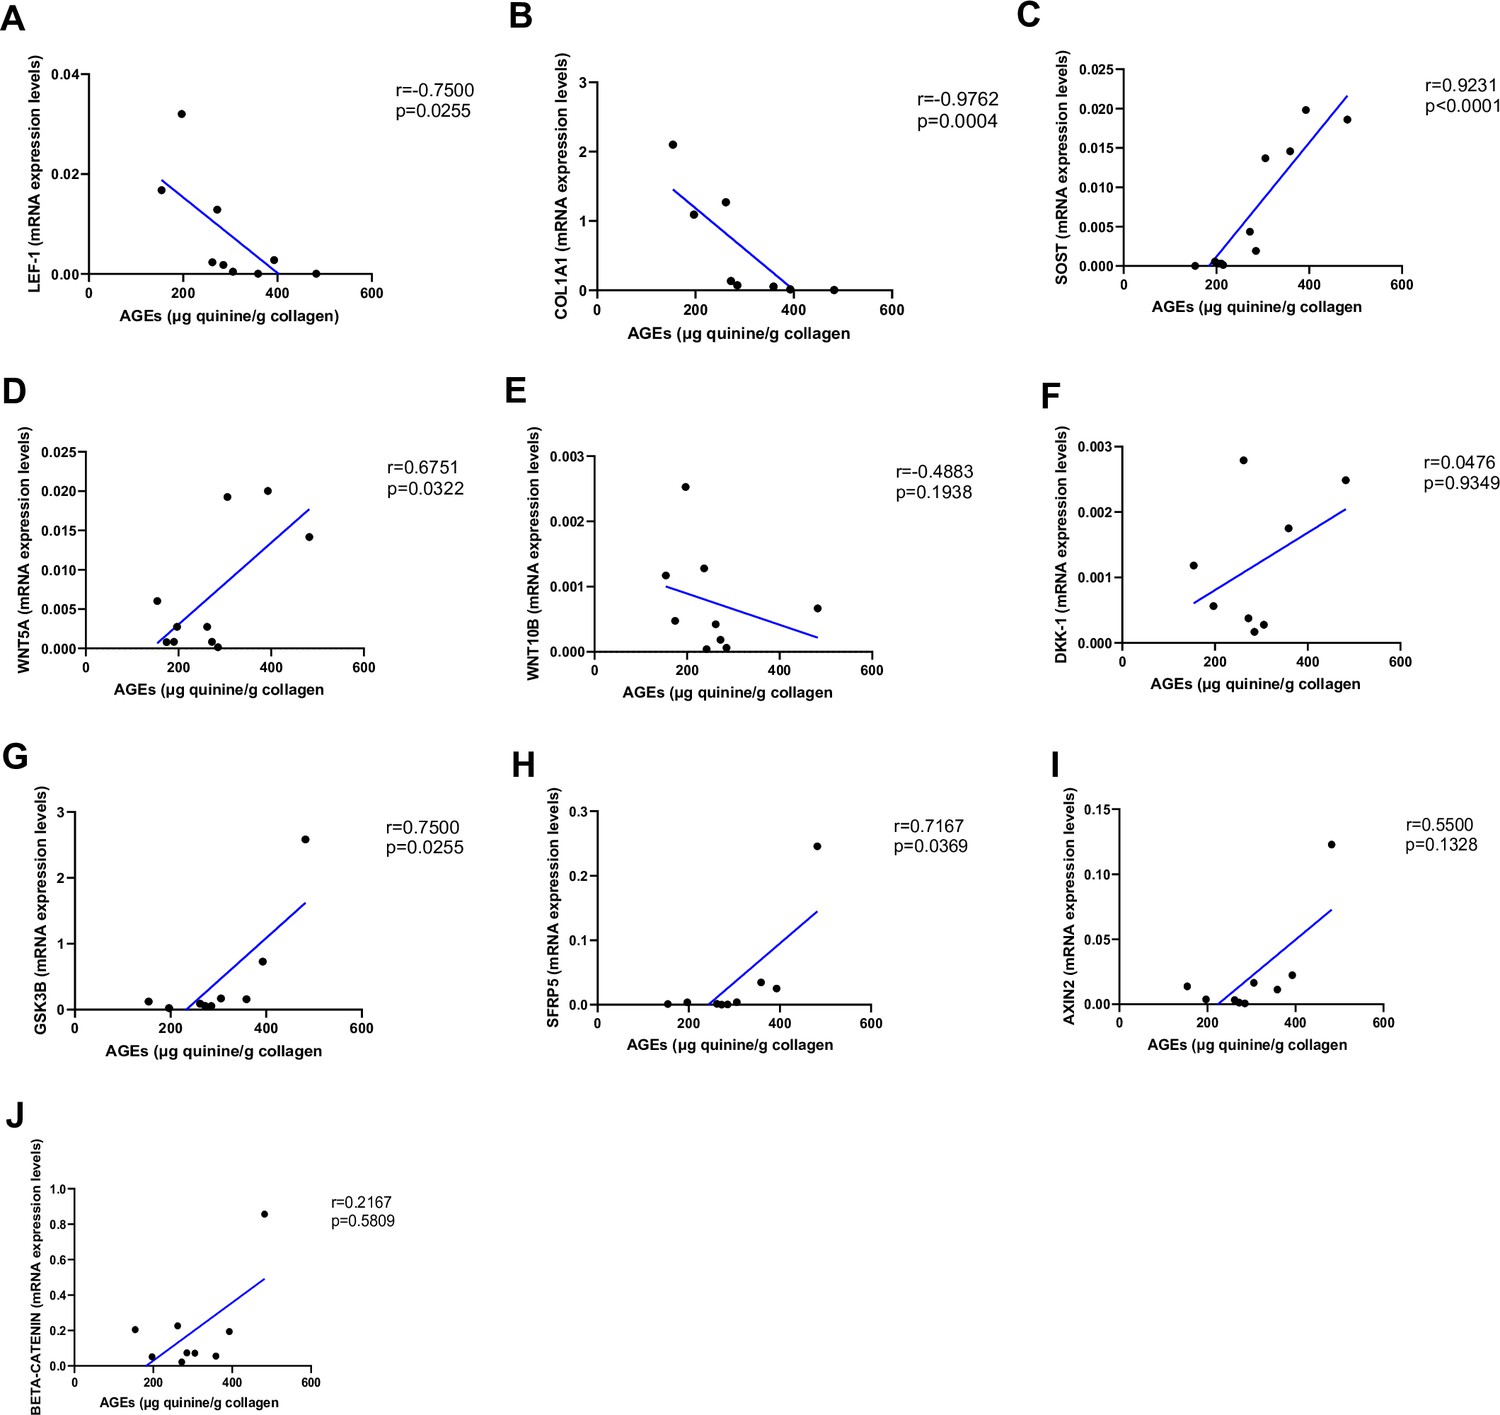
Relationship between advanced glycation end-products (AGEs) (µg quinine/g collagen) bone content and mRNA level of the Wnt signaling key genes in type 2 diabetes (T2D) and non-diabetic subjects.
(A) LEF-1 negatively correlated with AGEs (r=−0.7500; p=0.0255). (B) COL1A1 negatively correlated with AGEs (r=−0.9762; p=0.0004). (C) SOST mRNA level expression positively correlated with AGEs (r=0.9231; p<0.0001). (D) WNT5A mRNA expression level positively correlated with AGEs (r=0.6751; p=0.0322). (E) WNT10B mRNA expression level was not correlated with AGEs (r=−0.4883; p=0.1938). (F) DKK1 mRNA expression level was not correlated with AGEs (r=0.0476; p=0.9349). (G) GSK3B mRNA expression level was positively correlated with AGEs (r=0.7500; p=0.0255). (H) SFRP5 mRNA expression level was positively correlated with AGEs (r=0.7167; p=0.0369). (I) AXIN2 and (J) SFRP5 mRNA expression levels were not correlated with AGEs (r=0.5500, p=0.1328; r=0.2167, p=0.5809). Data were analyzed using nonparametric Spearman correlation analysis and r represents the correlation coefficient.
-
Figure 2—source data 1
Data represented by each point in Figure 2A–J.
- https://cdn.elifesciences.org/articles/90437/elife-90437-fig2-data1-v1.xlsx
Figure 3 with 1 supplement
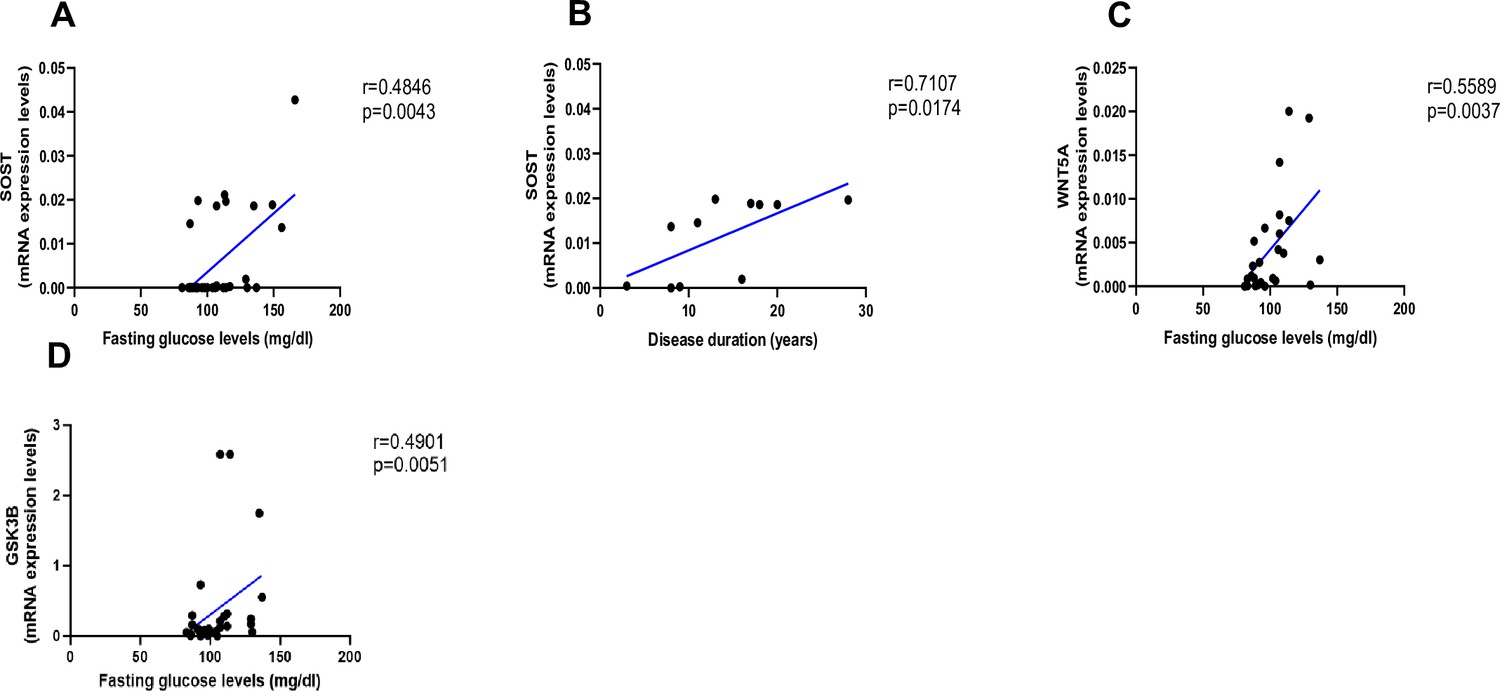
Relationship between fasting glucose levels (mg/dl) and disease duration with SOST and WNT5A mRNA levels.
(A) SOST positively correlated with fasting glucose levels (r=0.4846; p=0.0043). (B) SOST positively correlated with disease duration (r=0.7107; p=0.0174). (C) WNT5A positively correlated with fasting glucose levels (r=0.5589; p=0.0037). (D) GSK3B positively correlated with fasting glucose levels (r=0.4901; p=0.0051). Data were analyzed using nonparametric Spearman correlation analysis and r represents the correlation coefficient.
-
Figure 3—source data 1
Data represented by each point in Figure 3A–D.
- https://cdn.elifesciences.org/articles/90437/elife-90437-fig3-data1-v1.xlsx
Figure 3—figure supplement 1
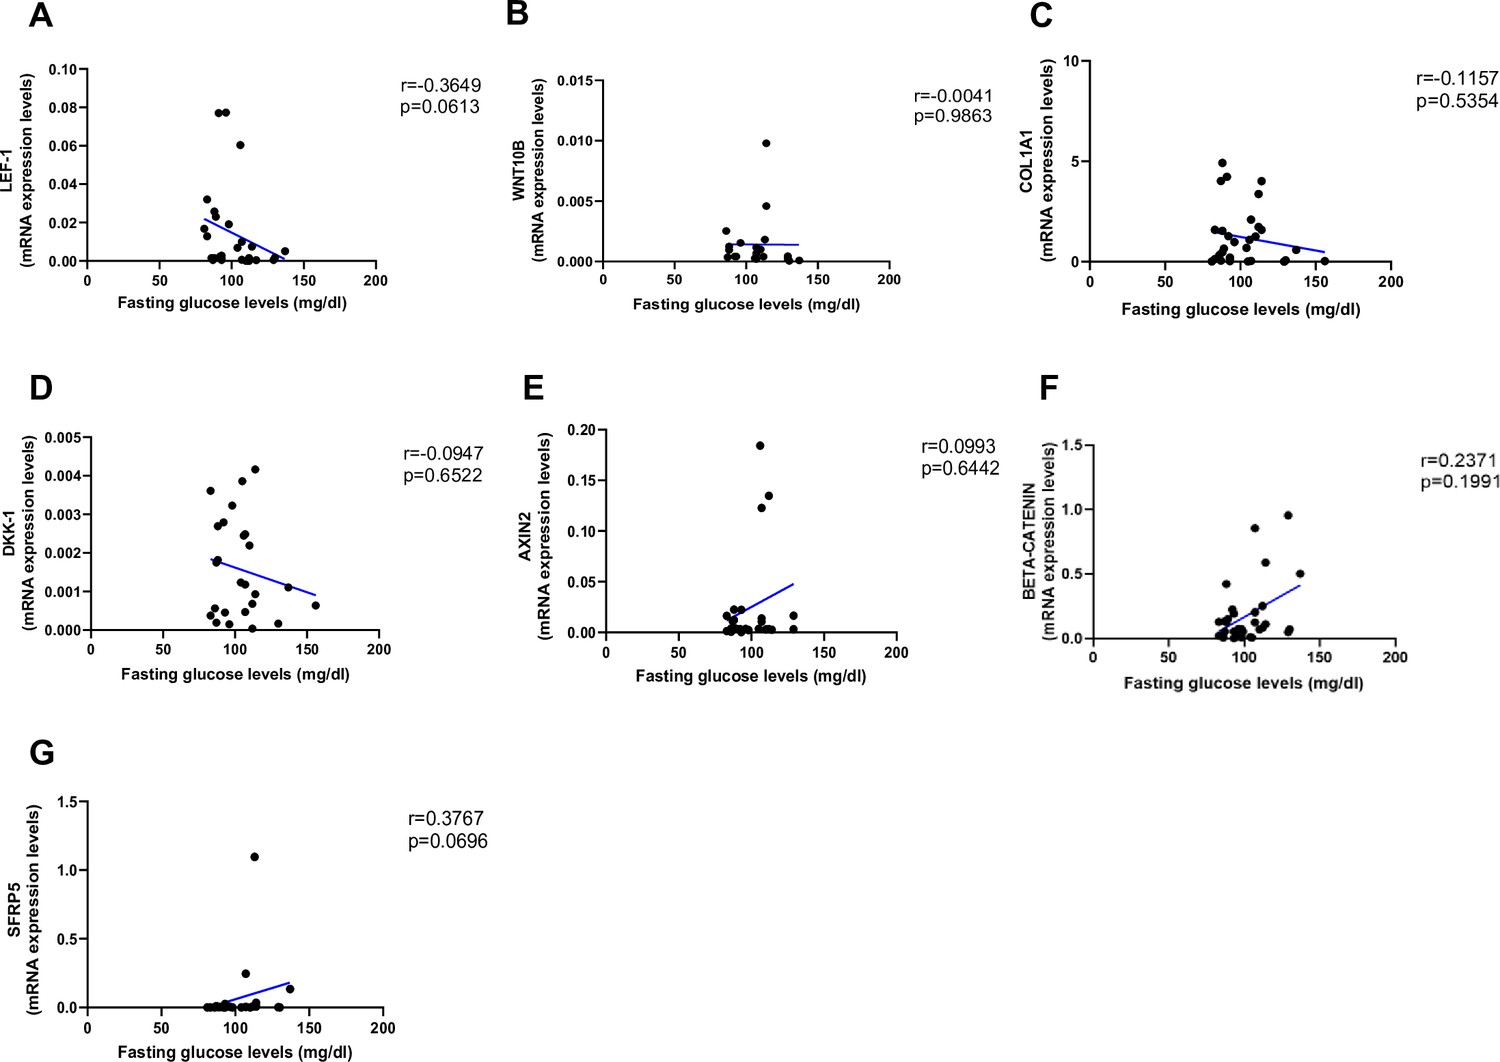
Relationship between fasting glucose levels (mg/dl) and LEF 1, WNT5A, WNT10B, DKK-1, COL1A1 mRNA levels.
(A–E) Data showed negative correlations between fasting glucose levels (mg/dl) and (A) LEF-1 (r=–0.3649; p=0.0613), (B) WNT10B (r=–0.0041; p=0.9863), (C) COL1A1 (r=–0.1157; p=0.5354), (D) DKK-1 (r=–0.0947; p=0.6522) mRNA levels. Data showed positive correlations between fasting glucose levels (mg/dl) with (E) AXIN2 (r=0.0993; p=0.6442), (F) BETA-CATENIN (r=0.2371; p=0.1991), and (G) SFRP5 (r=0.3767; p=0.0696). Data were analyzed using nonparametric Spearman correlation analysis and r represents the correlation coefficient.
Figure 4 with 1 supplement
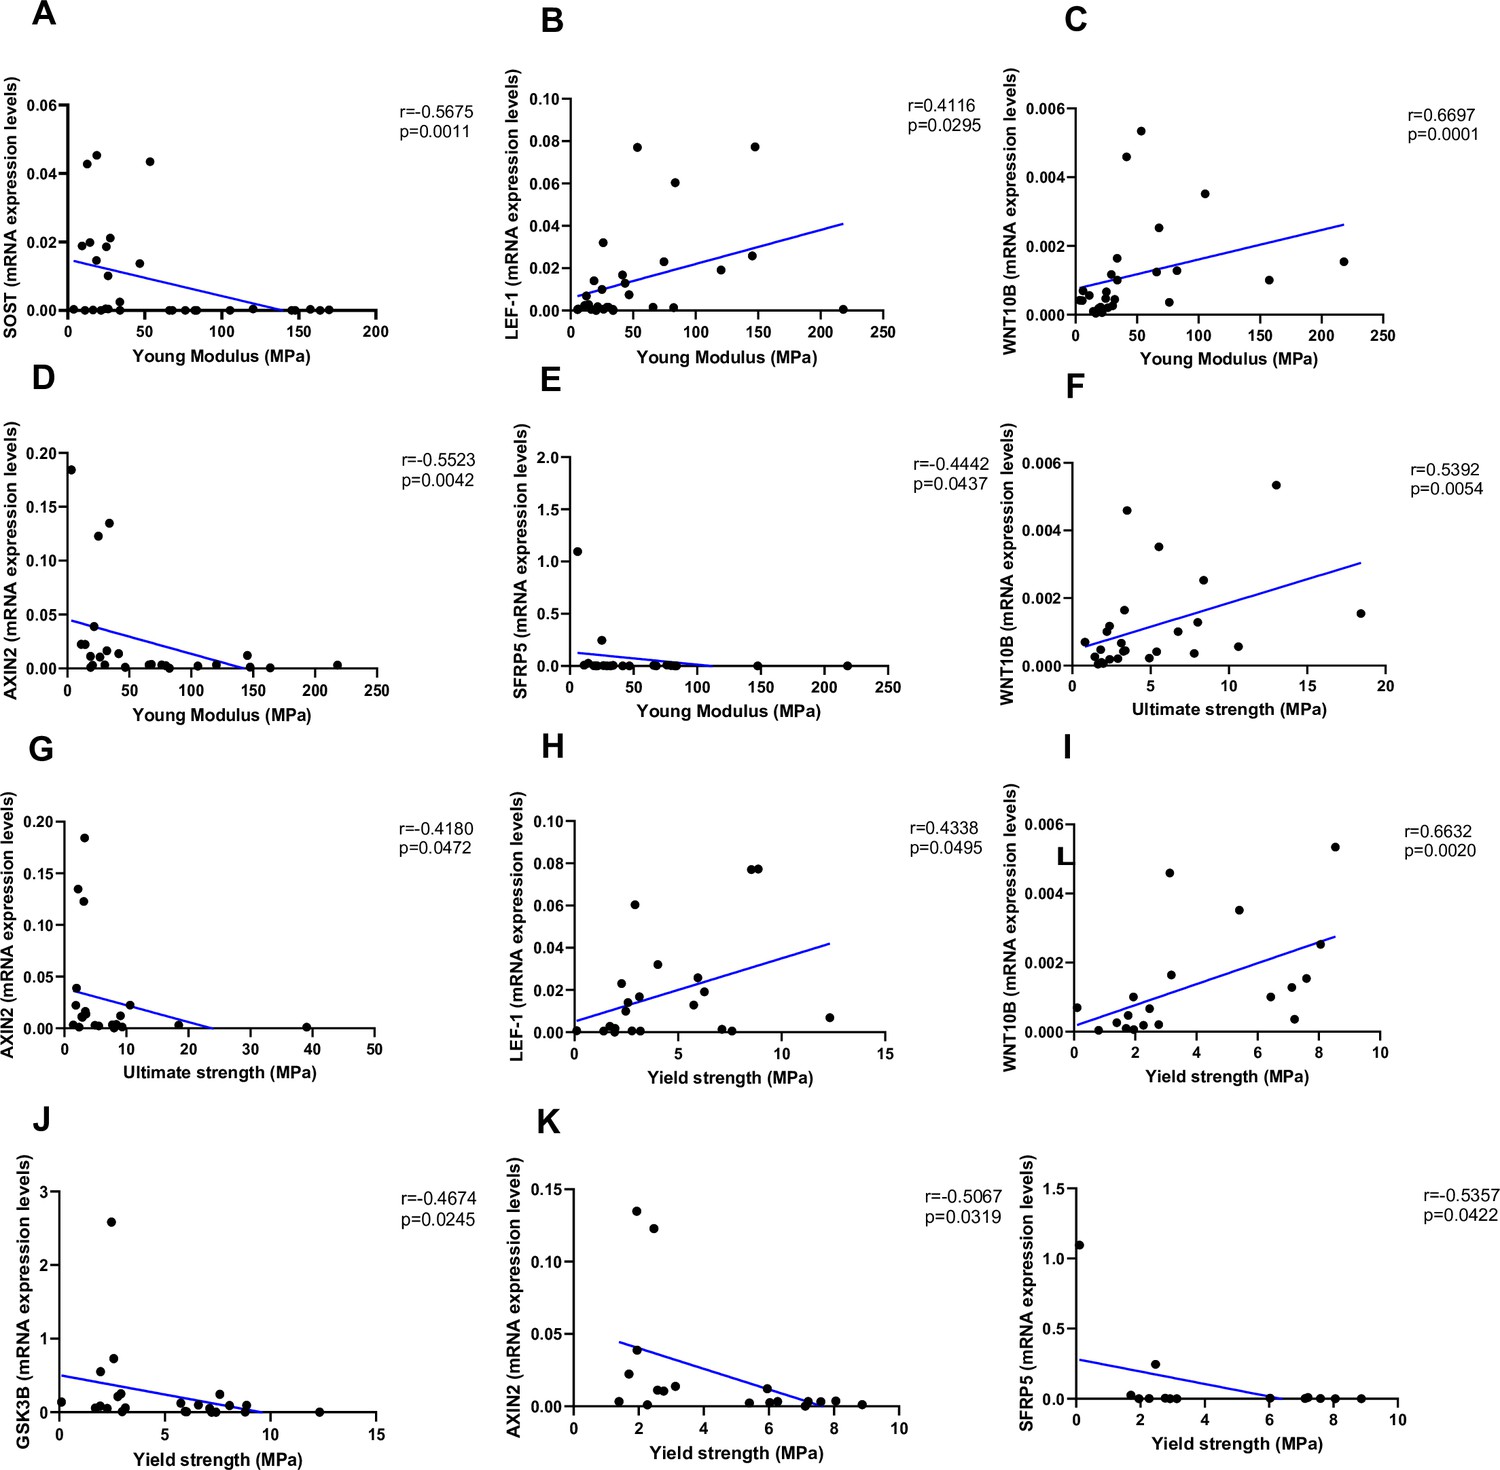
Relationship between Young’s modulus (MPa), ultimate strength (MPa), and yield strength (MPa) with mRNA levels of the Wnt signaling key genes in type 2 diabetes (T2D) and non-diabetic subjects.
(A) SOST negatively correlated with Young’s modulus (MPa); (r=−0.5675; p=0.0011). (B) LEF-1 positively correlated with Young’s modulus (MPa); (r=0.4116; p=0.0295). (C) WNT10B positively correlated with Young’s modulus (MPa); (r=0.6697; p=0.0001). (D) AXIN2 negatively correlated with Young’s modulus (MPa); (r=−0.5523; p=0.0042). (E) BETA-CATENIN negatively correlated with Young’s modulus (MPa); (r=−0.5244; p=0.0050). (F) SFRP5 negatively correlated with Young’s modulus (MPa); (r=−0.4442; p=0.0437). (G) WNT10B positively correlated with ultimate strength (MPa); (r=0.5392; p=0.0054). (H) AXIN2 negatively correlated with ultimate strength (MPa); (r=−0.4180; p=0.0472). (I) BETA-CATENIN negatively correlated with ultimate strength (MPa); (r=−0.5528; p=0.0034). (J) LEF-1 positively correlated with yield strength (MPa); (r=0.4338; p=0.0495). (K) WNT10B positively correlated with yield strength (MPa); (r=0.6632; p=0.0020). (L) GSK3B negatively correlated with yield strength (MPa); (r=−0.4674; p=0.0245). (M) AXIN2 negatively correlated with yield strength (MPa); (r=−0.5067; p=0.0319). (N) BETA-CATENIN negatively correlated with yield strength (MPa); (r=−0.5491; p=0.0149). (O) SFRP5 negatively correlated with yield strength (MPa); (r=−0.5357; p=0.0422). Data were analyzed using nonparametric Spearman correlation analysis and r represents the correlation coefficient.
-
Figure 4—source data 1
Data represented by each point in Figure 4A–L.
- https://cdn.elifesciences.org/articles/90437/elife-90437-fig4-data1-v1.xlsx
Figure 4—figure supplement 1
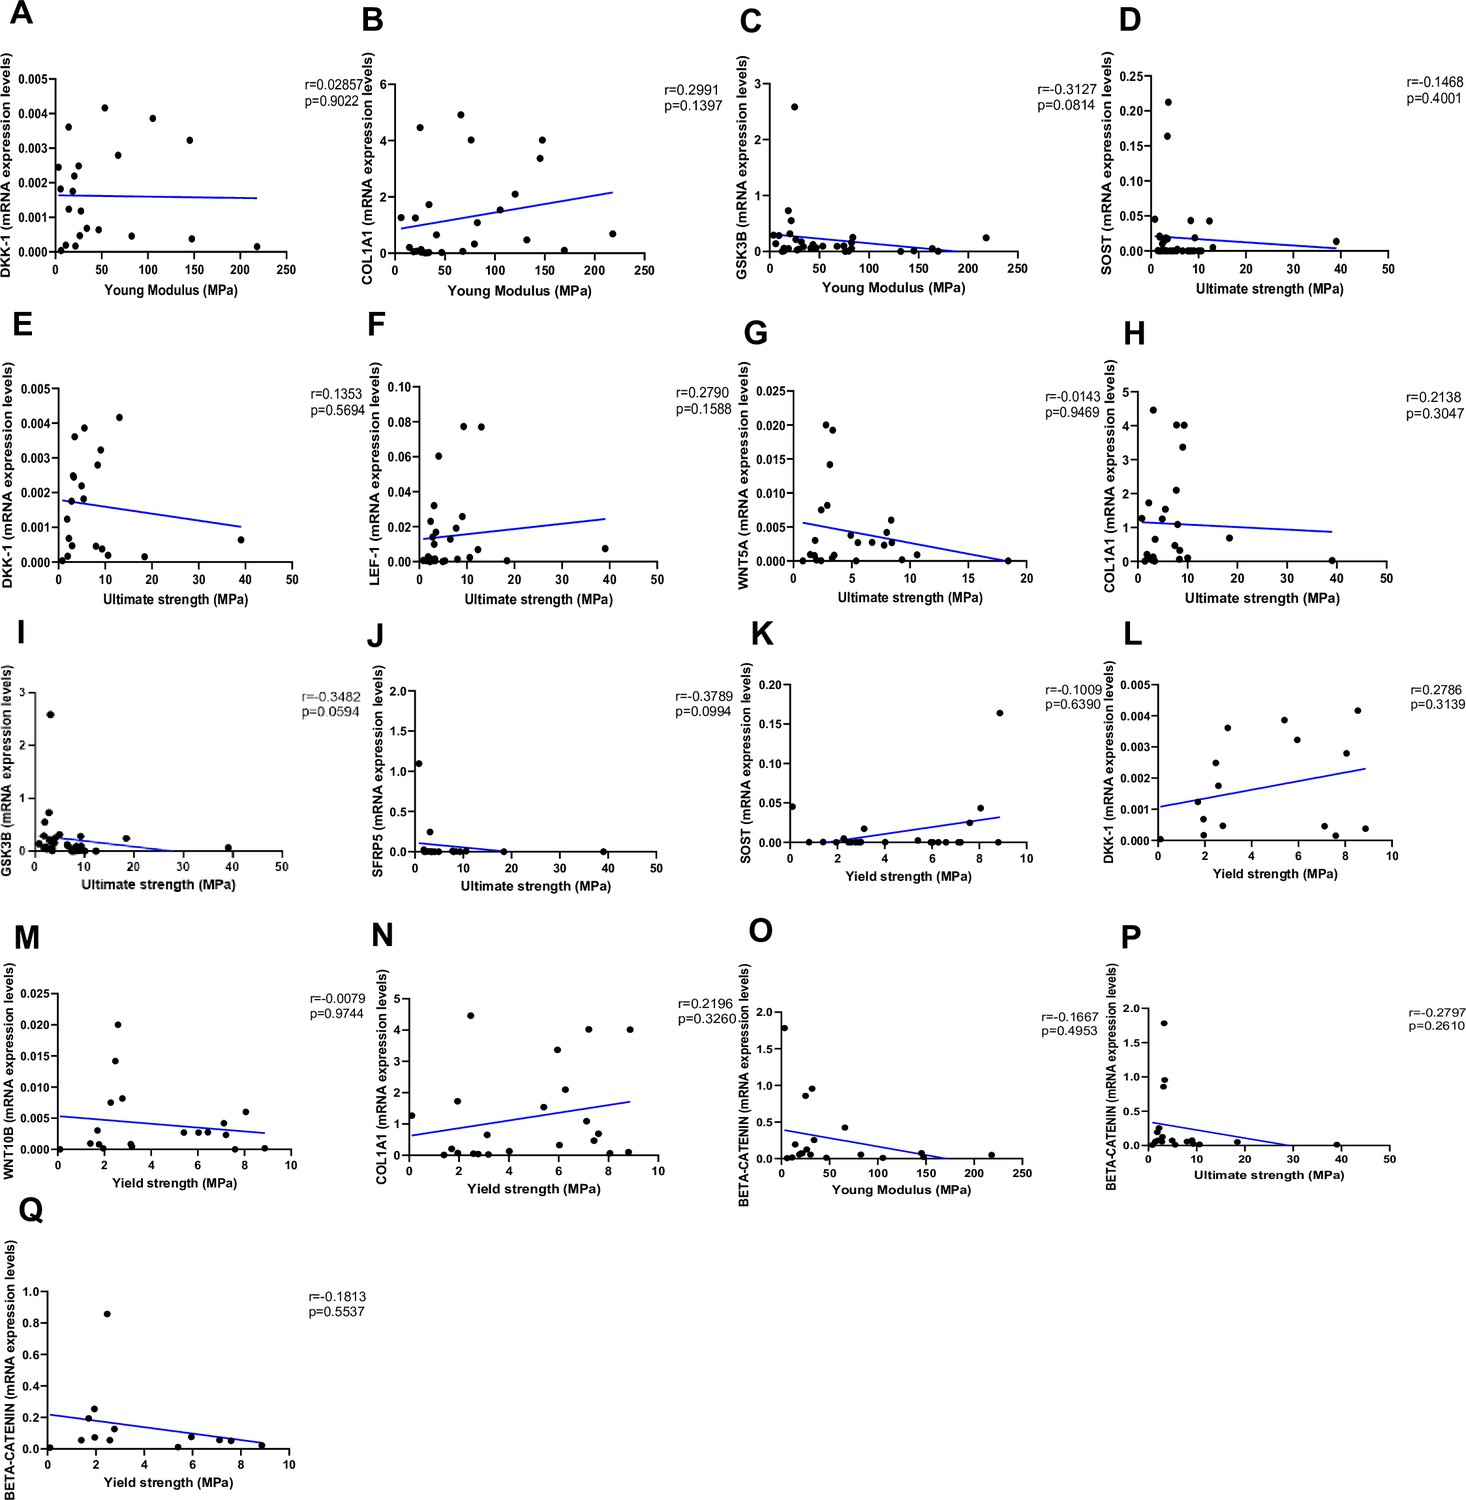
Relationship between Young’s modulus (MPa), ultimate strength (MPa), and yield strength (MPa) with mRNA levels of the Wnt signaling genes in type 2 diabetes (T2D) and non-diabetic subjects.
(A) DKK-1 positively correlated with Young’s modulus (MPa); (r=0.02857; p=0.9022). (B) COL1A1 positively correlated with Young’s modulus (MPa); (r=0.2991; p=0.1397). (C) GSK3B negatively correlated with Young’s modulus (MPa); (r=0.3127; p=0.0814). (D) SOST negatively correlated with ultimate strength (MPa); (r=-0.1468; p=0.4001). (E) DKK-1 negatively correlated with ultimate strength (MPa); (r=0.1353; p=0.5694). (F) LEF-1 positively correlated with ultimate strength (MPa); (r=0.2790; p=0.1588). (G) WNT5A negatively correlated with ultimate strength (MPa); (r=-0.0143; p=0.9469). (H) COL1A1 positively correlated with ultimate strength (MPa); (r=0.2138; p=0.3047). (I) GSK3B negatively correlated with ultimate strength (MPa); (r=-0.3482; p=0.0594). (J) SFPR5 negatively correlated with ultimate strength (MPa); (r=-0.3789; p=0.0994). (K) SOST positively correlated with yield strength (MPa); (r=0.1009; p=0.6390). (L) DKK-1 positively correlated with yield strength (MPa); (r=0.2786; p=0.3139). (M) WNT10B negatively correlated with yield strength (MPa); (r=–0.0079; p=0.9744). (N) COL1A1 positively correlated with yield strength (MPa); (r=0.2196; p=0.3260). (O) BETA-CATENIN negatively correlated with Young’s modulus strength (MPa); (r=–0.1667; p=0.4953). (P) BETA-CATENIN negatively correlated with ultimate strength (MPa); (r=–0.2797; p=0.2610). (Q) BETA-CATENIN negatively correlated with yield strength (MPa); (r=–0.1813; p=0.5537). Data were analyzed using nonparametric Spearman correlation analysis and r represents the correlation coefficient.
Figure 5
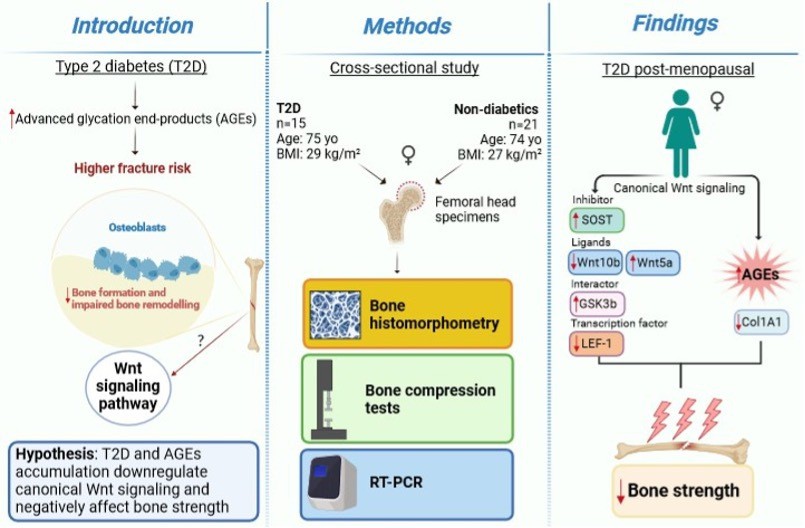
A graphical summary of the study.
Author response image 1

Tables
Table 1
Clinical features of the study subjects.
Results were analyzed using unpaired t-test with Welch’s correction and are presented as median and percentiles (25th and 75th).
| T2D subjects(n=15) | Non-diabetic subjects(n=21) | p-Value | |||
|---|---|---|---|---|---|
| Age (years) | 73.00 (67.00–80.00) | 73.00 (68.50–79.00) | 0.644 | ||
| BMI (kg/m2) | 30.81 (24.44–34.00) | 25.00 (24.00–31.50) | 0.117 | ||
| Menopausal age (years) | 50.00 (42.50–52.75) | 52.00 (48.00–53.00) | 0.344 | ||
| Fasting glucose levels (mg/dl) | 112.00 (104.00–130.0) | 94.00 (87.25–106.3) | **0.009 | ||
| Disease duration (years) | 14.50 (7.25–19.25) | – | – | ||
| HbA1c (%) | 6.95 (6.37–7.37) | – | – | ||
| Serum calcium (mg/dl) | 9.05 (8.800–9.550) | 9.15 (9.000–9.550) | 0.535 | ||
| eGFR (ml/min/1.73 m2) | 78,30 (59.90–91.10) | 75.60 (61.35–88.55) | 0.356 | ||
| Serum blood urea nitrogen (mg/dl) | 42.00 (36.00–53.00) | 37.00 (31.75–46.50) | 0.235 | ||
-
** p value ≤ 0.01.
Table 2
Histomorphometric parameters of trabecular bone of the study subjects.
Results were analyzed using unpaired t-test with Welch’s correction and are presented as median and percentiles (25th and 75th).
| T2D subjects(n=9) | Non-diabetic subjects(n=9) | p-Value | |
|---|---|---|---|
| BV/TV (%) | 0.248 (0.157–0.407) | 0.358 (0.271–0.456) | 0.120 |
| Md.V/BV (%) | 0.994 (0.984–0.998) | 0.995 (0.985–0.997) | 0.998 |
| Md.V/TV (%) | 0.249 (0.156–0.366) | 0.352 (0.269–0.454) | 0.053 |
| OV/BV (%) | 0.009 (0.002–0.009) | 0.004 (0.002–0.015) | 0.704 |
| OV/TV (%) | 0.001 (0.0002–0.0058) | 0.001 (0.0007–0.0056) | 0.896 |
| OS/BS (%) | 0.026 (0.022–0.161) | 0.035 (0.009–0.117) | 0.525 |
Table 3
Bone mechanical parameters of trabecular bone of the study subjects.
Results were analyzed using unpaired t-test with Welch’s correction and are presented as median and percentiles (25th and 75th).
| T2D subjects(n=11) | Non-diabetic subjects(n=21) | p-Value | |
|---|---|---|---|
| Young’s modulus (MPa) | 21.60 (13.46–30.10) | 76.24 (26.81–132.9) | 0.002 |
| Ultimate strength (MPa) | 3.015 (2.150–13.86) | 7.240 (3.150–8.898) | 0.914 |
| Yield strength (MPa) | 2.525 (1.943–6.393) | 6.150 (3.115–7.423) | 0.159 |
Additional files
Download links
A two-part list of links to download the article, or parts of the article, in various formats.
Downloads (link to download the article as PDF)
Open citations (links to open the citations from this article in various online reference manager services)
Cite this article (links to download the citations from this article in formats compatible with various reference manager tools)
Bone canonical Wnt signaling is downregulated in type 2 diabetes and associates with higher advanced glycation end-products (AGEs) content and reduced bone strength
eLife 12:RP90437.
https://doi.org/10.7554/eLife.90437.3


