Purine nucleosides replace cAMP in allosteric regulation of PKA in trypanosomatid pathogens
- Faculty of Biology, Genetics, Ludwig-Maximilians University Munich (LMU), Germany
- Max Planck Institute of Molecular Physiology, Germany
- TU Dortmund, Department of Chemistry and Chemical Biology, Germany
- Max Planck Institute for Biochemistry, Germany
- BIOLOG Life Science Institute GmbH & Co KG, Germany
- Department of Molecular Biology and Genetics, Aarhus University, Denmark
Figures
Figure 1 with 3 supplements
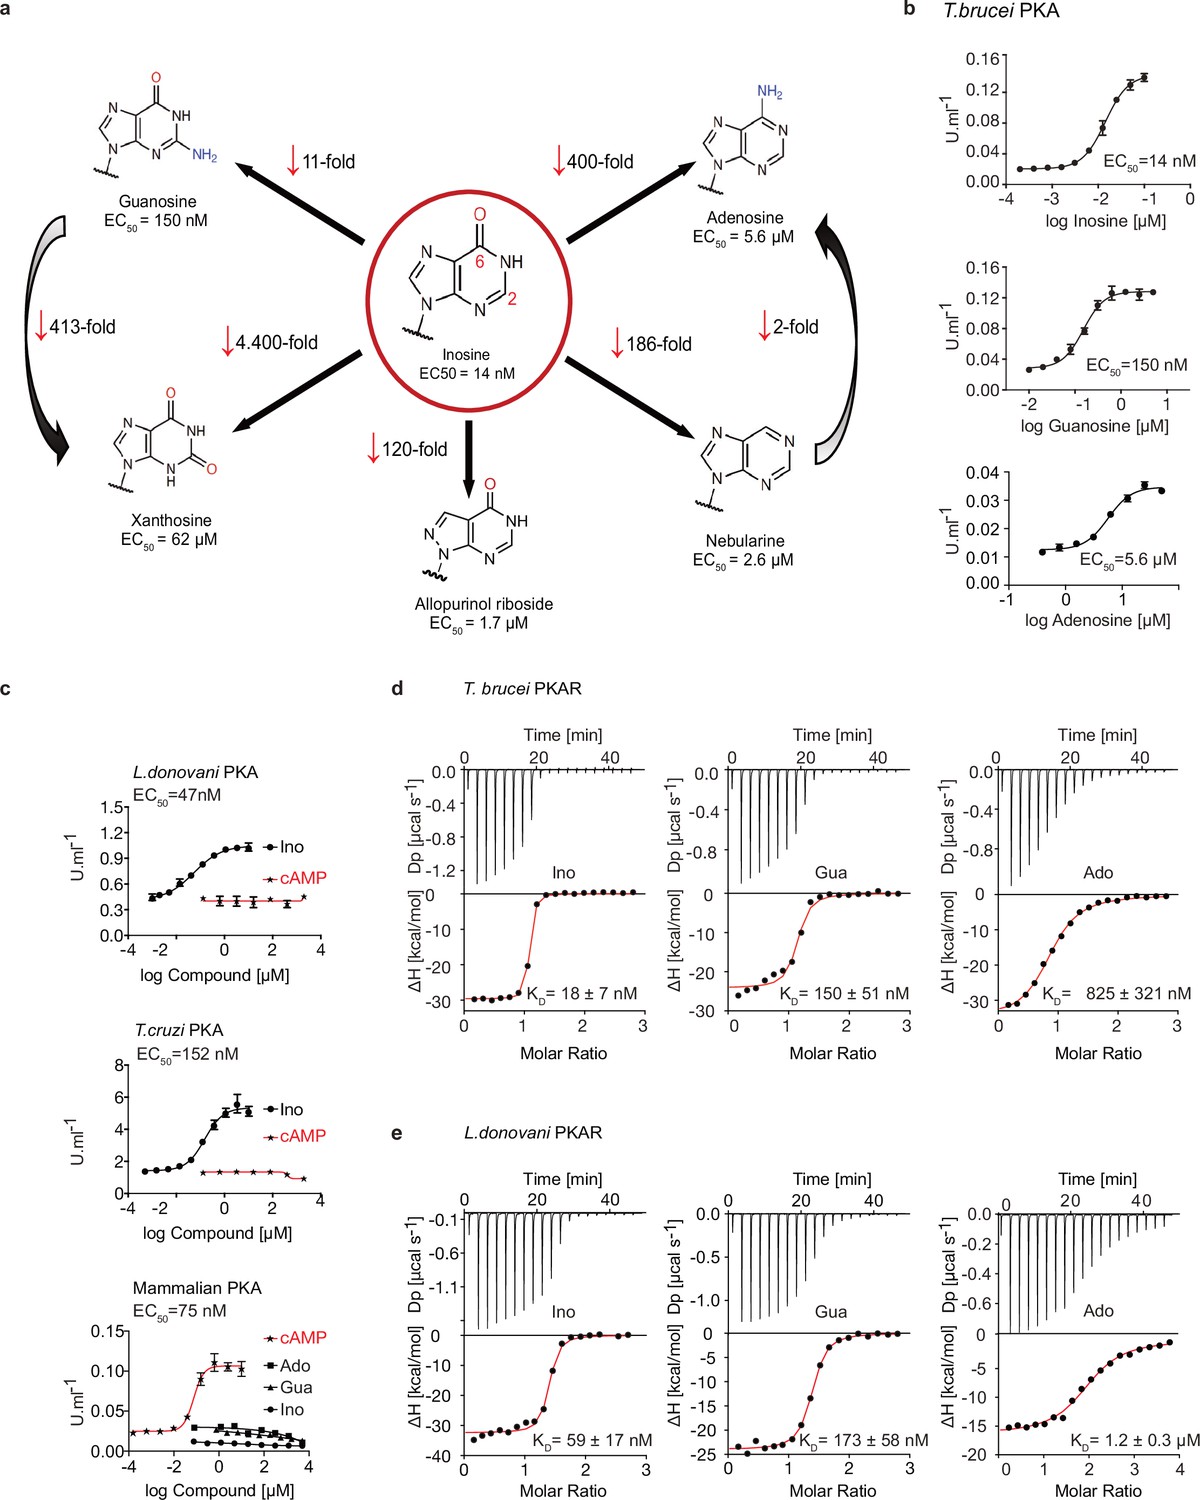
Trypanosomatid PKA binds to and is selectively activated by purine nucleosides.
(a) Structure-activity relationship (SAR) analysis for TbPKA kinase activation by nucleoside derivatives. Chemical structures and the corresponding EC50 values are taken from Table 1. For representative dose-response curves see Figure 1—figure supplement 1. (b) Representative dose-response curves for activation of T. brucei PKAR-PKAC1 holoenzyme by inosine, guanosine or adenosine (in vitro kinase assay, n≥3 biological replicates). The calculated EC50 values are displayed next to the graph and in Table 1, error bars indicate SD of technical triplicates. Purity of PKA enzymes is shown in Figure 1—figure supplement 1a. (c) Representative dose-response curves for activation of L. donovani, T. cruzi and mammalian (human RIα/mouse Cα) holoenzymes by purine nucleosides and cAMP, as in A. The calculated EC50 values are displayed next to the curve and in Table 1, error bars indicate SD of technical triplicates; Purity of PKA holoenzyme is shown in Figure 1—figure supplement 1b, c. (d) Binding isotherms (ITC) of nucleoside-depleted (APO) T. brucei PKAR(199-499) upon titration with purine nucleosides. The graphs give the difference power (DP) between the reference and sample cells upon ligand injection as a function of time (upper panel). In the lower panel, the total heat exchange per mole of injectant (integrated peak areas from upper panel) is plotted against the molar ratio of ligand to protein. A representative curve out of ≥3 independent replicates is shown. The final given KD (as in Supplementary file 1) was calculated as the mean (± SD) of at least three independent experiment (see source data files). For purity of R subunit eluted from SEC see Figure 2—figure supplement 1a, b. (e) Binding isotherms (ITC) of nucleoside-depleted (APO) L. donovani PKAR1(200–502) upon titration with purine nucleosides, as in D. Purity, aggregation state and thermal stability of protein sample prior to binding assays is shown in Figure 2—figure supplement 1c, d.
-
Figure 1—source data 1
In vitro kinase activation assays of T. brucei PKAR-PKAC1 holoenzyme by inosine, guanosine, or adenosine.
- https://cdn.elifesciences.org/articles/91040/elife-91040-fig1-data1-v1.xlsx
-
Figure 1—source data 2
In vitro kinase activation assays of T.cruzi PKAR-PKAC2, L. donovani PKAR1-PKAC1 by inosine or cAMP (no activation) and of H. sapiens PKARIα-PKAC holoenzyme by inosine, guanosine, and adenosine (no activation) or cAMP.
- https://cdn.elifesciences.org/articles/91040/elife-91040-fig1-data2-v1.xlsx
-
Figure 1—source data 3
ITC measurements for inosine, guanosine or adenosine titrated to nucleoside-depleted (APO) T. brucei PKAR(199-499).
- https://cdn.elifesciences.org/articles/91040/elife-91040-fig1-data3-v1.xlsx
-
Figure 1—source data 4
ITC measurements for inosine, guanosine or adenosine titrated to nucleoside-depleted (APO) L. donovani PKAR1(200–502).
- https://cdn.elifesciences.org/articles/91040/elife-91040-fig1-data4-v1.xlsx
Figure 1—figure supplement 1
Kinetoplastid PKA activation.
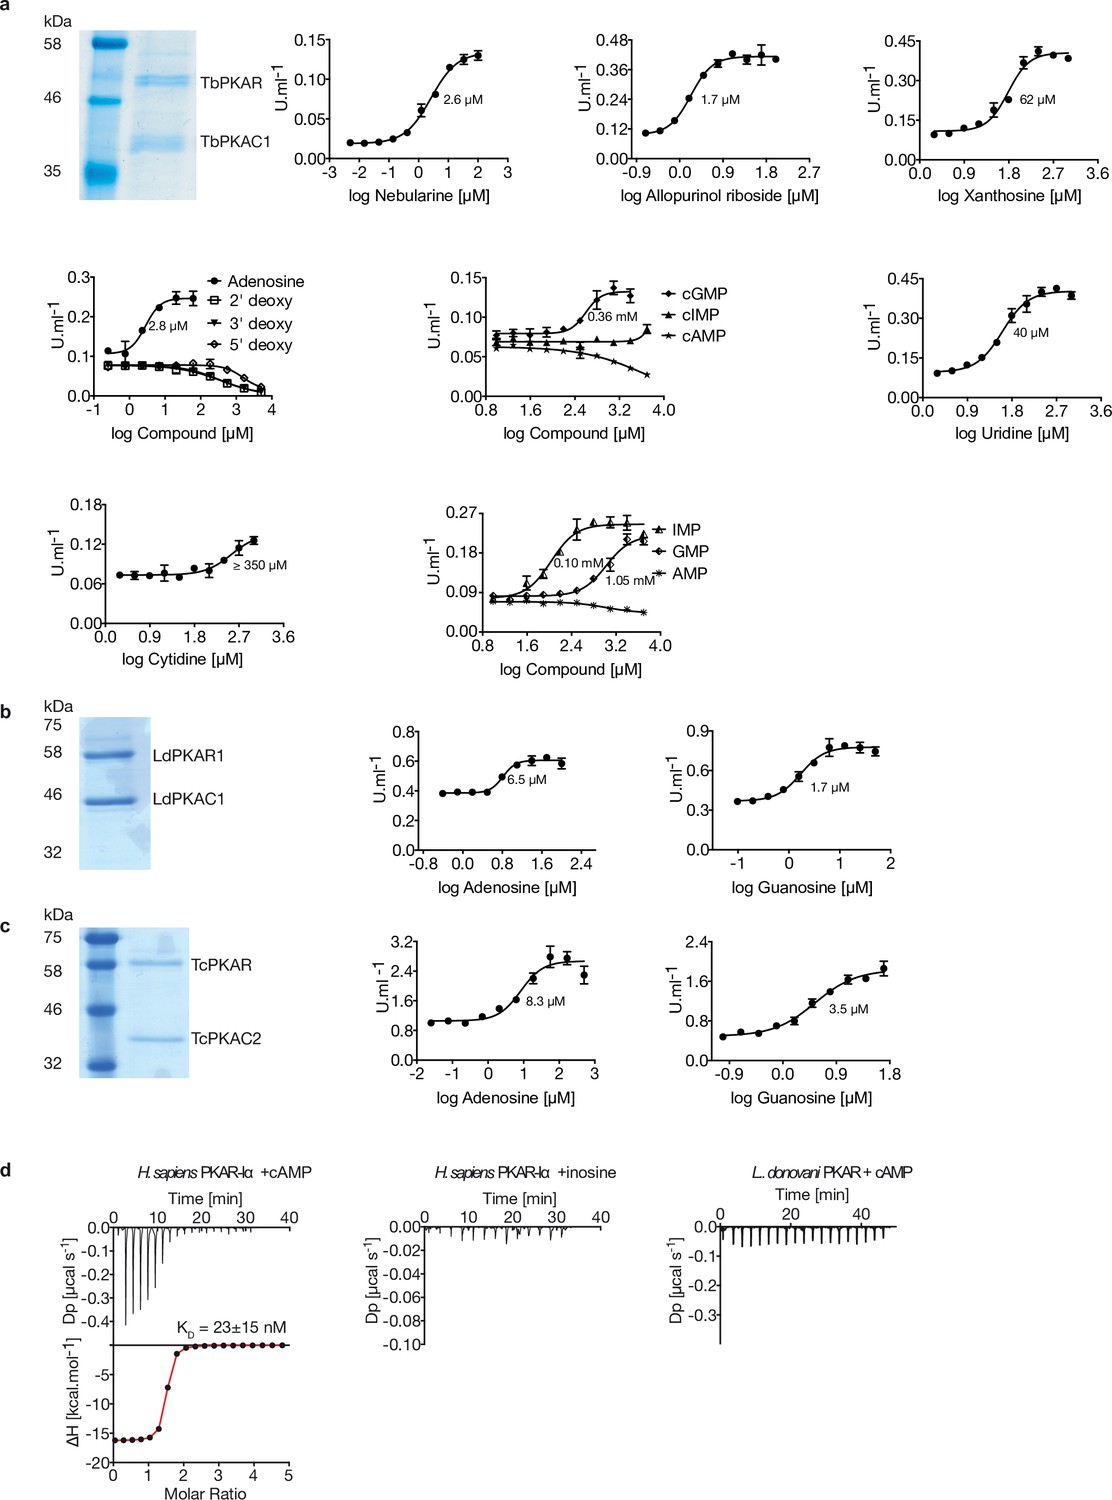
(a) Representative dose-response curves for activation of T. brucei PKAR-PKAC1 holoenzyme by compounds (structural formula of some in Figure 1a). The calculated EC50 values (taken from Table 1) are displayed next to the curve, error bars indicate SD of technical triplicates. Purity of recombinant TbPKA (6xHis-TbPKAR/strep-TbPKAC1) was confirmed by SDS-PAGE (left). (b, c) as in A for LdPKA (6xHis-LdPKAR1/strep-LdPKAC1) and TcPKA (6xHis-TcPKAR/strep-TcPKAC2). Purity of recombinant proteins was confirmed by SDS-PAGE (left). (d) Binding isotherms of refolded APO H. sapiens PKARIα(1-381) in response to cAMP (left) and inosine (centre). On the right, binding isotherm for L. donovani PKAR1(200–502) in response to cAMP. Data representation as in Figure 1d, the calculated KD value for H. sapiens PKARIα(1-381) binding of cAMP (mean ± SD) is taken from .
-
Figure 1—figure supplement 1—source data 1
Original Coomassie stained gels of tandem affinity purification of T.cruzi PKAR-PKAC2, L. donovani PKAR1-PKAC1and T. brucei PKAR-PKAC1.
- https://cdn.elifesciences.org/articles/91040/elife-91040-fig1-figsupp1-data1-v1.zip
-
Figure 1—figure supplement 1—source data 2
Original Coomassie stained gels of tandem affinity purification of T.cruzi PKAR-PKAC2, L. donovani PKAR1-PKAC1and T. brucei PKAR-PKAC1 (labelled).
- https://cdn.elifesciences.org/articles/91040/elife-91040-fig1-figsupp1-data2-v1.pdf
-
Figure 1—figure supplement 1—source data 3
In vitro kinase activation assays of T. brucei PKAR-PKAC1 holoenzyme by compounds.
- https://cdn.elifesciences.org/articles/91040/elife-91040-fig1-figsupp1-data3-v1.xlsx
-
Figure 1—figure supplement 1—source data 4
In vitro kinase activation assays of L. donovani PKAR1-PKAC1 by guanosine and adenosine.
- https://cdn.elifesciences.org/articles/91040/elife-91040-fig1-figsupp1-data4-v1.xlsx
-
Figure 1—figure supplement 1—source data 5
In vitro kinase assays for activation of T. cruzi PKAR-PKAC2 by guanosine and adenosine.
- https://cdn.elifesciences.org/articles/91040/elife-91040-fig1-figsupp1-data5-v1.xlsx
-
Figure 1—figure supplement 1—source data 6
ITC measurement of cAMP titrated to H.sapiens PKARIα or L. donovani PKAR1(200–502).
- https://cdn.elifesciences.org/articles/91040/elife-91040-fig1-figsupp1-data6-v1.xlsx
Figure 1—figure supplement 2
Mass spectrometry identification of ligands bound to recombinant PKAR.
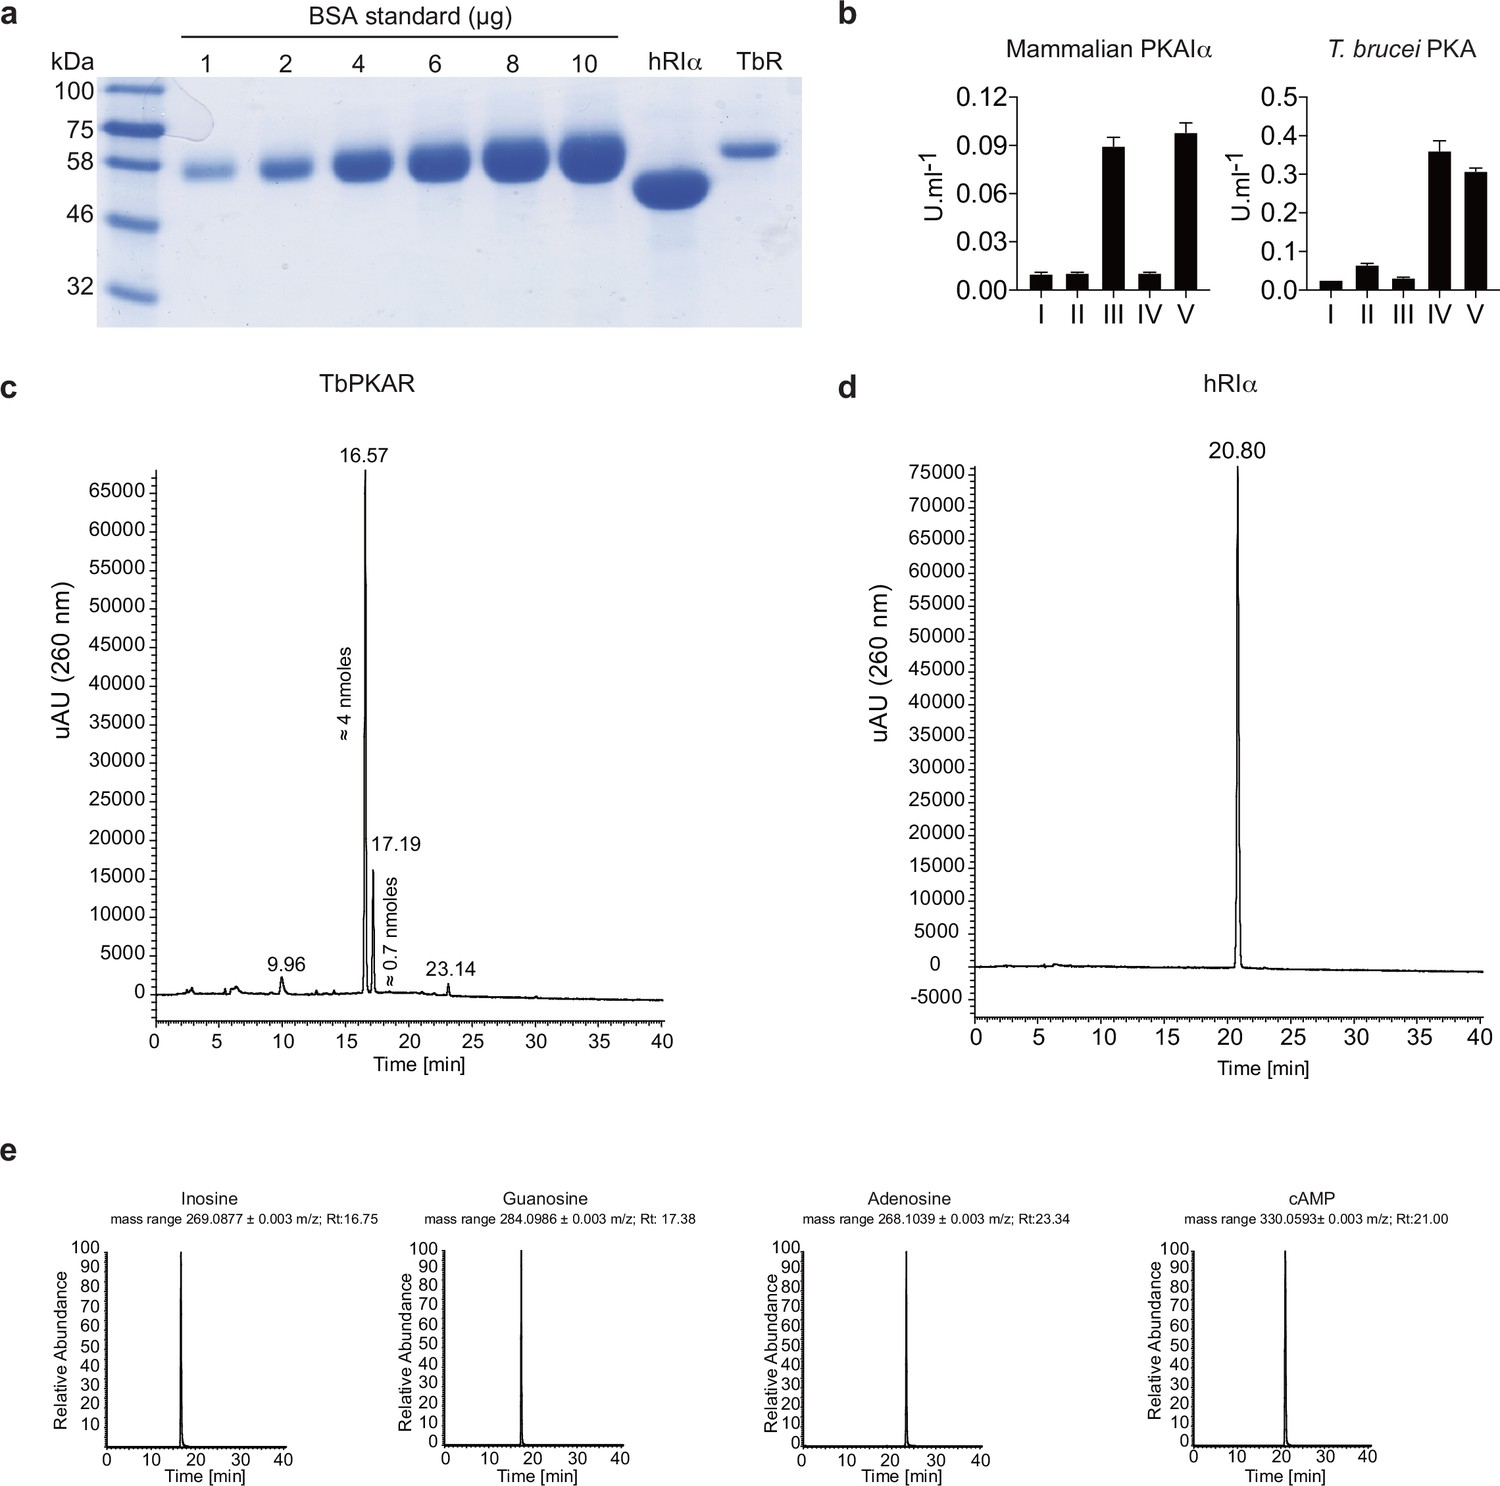
(a) Coomassie staining and quantification relative to a BSA standard of purified 6xHis-TbPKAR (TbR, 800 μg) and H. sapiens 6xHis-PKARIα (hRIα, 2400 μg) expressed in E. coli. (b) Proteins from A were boiled in MS grade H2O to release bound ligands and supernatants were tested for activation of mammalian PKAIα (left) and T. brucei PKA (right): (I) basal kinase activity (buffer control) (II) supernatant from mock purification from E. coli harboring an empty vector (III) supernatant from boiled hRIα (IV) supernatant from boiled TbPKAR (V) 10 μM of positive control ligand: inosine for TbPKA holoenzyme and cAMP for human PKAIα holoenzyme. (c) UV chromatogram (260 nm) from high-resolution HPLC-MS analysis of ligands from ≈ 3 nmoles of boiled TbPKAR. The amounts of inosine (16.57) and guanosine (17.19) are indicated next to the respective peak in the UV. Quantification has been performed by UV signal integration according to a standard curve. Amounts of adenosine were below the range of reliable UV quantification. (d) As in C for ligands released from human RIα; only cAMP was identified without quantification. (e) MS chromatogram from the HPLC-MS analysis described in c and d. The selected mass range ([M + H+]+/-0.003 m/z) for inosine, guanosine, adenosine and cAMP is individually presented (from left to right) as indicated. The retention time (Rt) is given for each identified peak.
-
Figure 1—figure supplement 2—source data 1
Original Coomassie stained gel.
- https://cdn.elifesciences.org/articles/91040/elife-91040-fig1-figsupp2-data1-v1.zip
-
Figure 1—figure supplement 2—source data 2
Original Coomassie stained gel (labelled).
- https://cdn.elifesciences.org/articles/91040/elife-91040-fig1-figsupp2-data2-v1.pdf
Figure 1—figure supplement 3
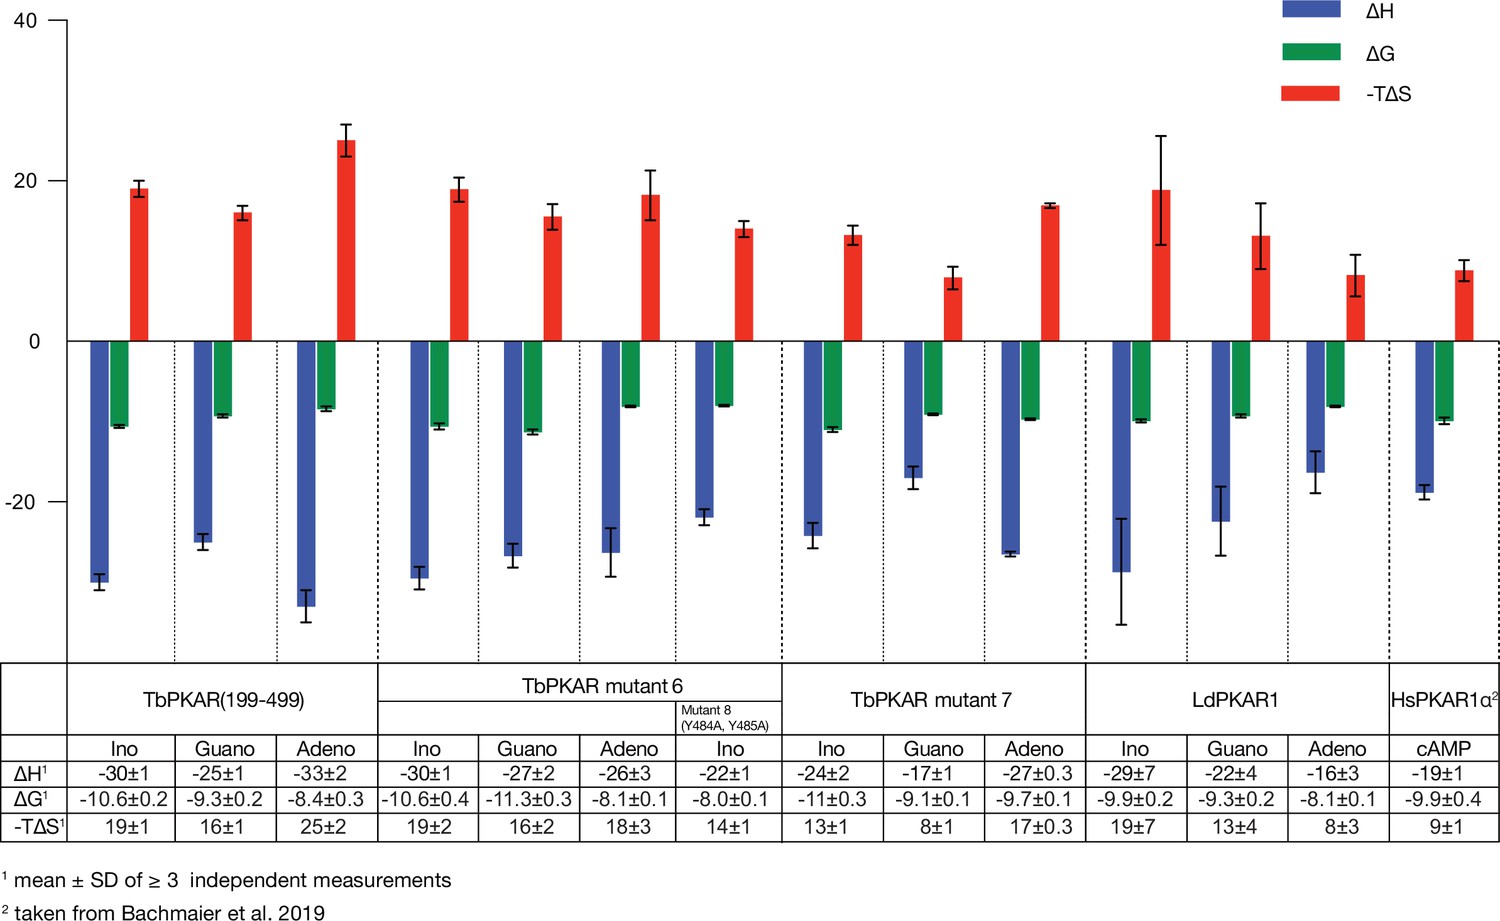
Thermodynamic signatures of ligand binding from ITC experiments.
Direct comparison of the thermodynamic signatures from all ITC experiments summarized in . Binding enthalpy is shown in green (ΔH), Gibbs free energy in blue (ΔG) and entropy in red (-TΔS).
Figure 2 with 1 supplement
Crystal structures of T. cruzi and T. brucei PKAR bound to inosine.
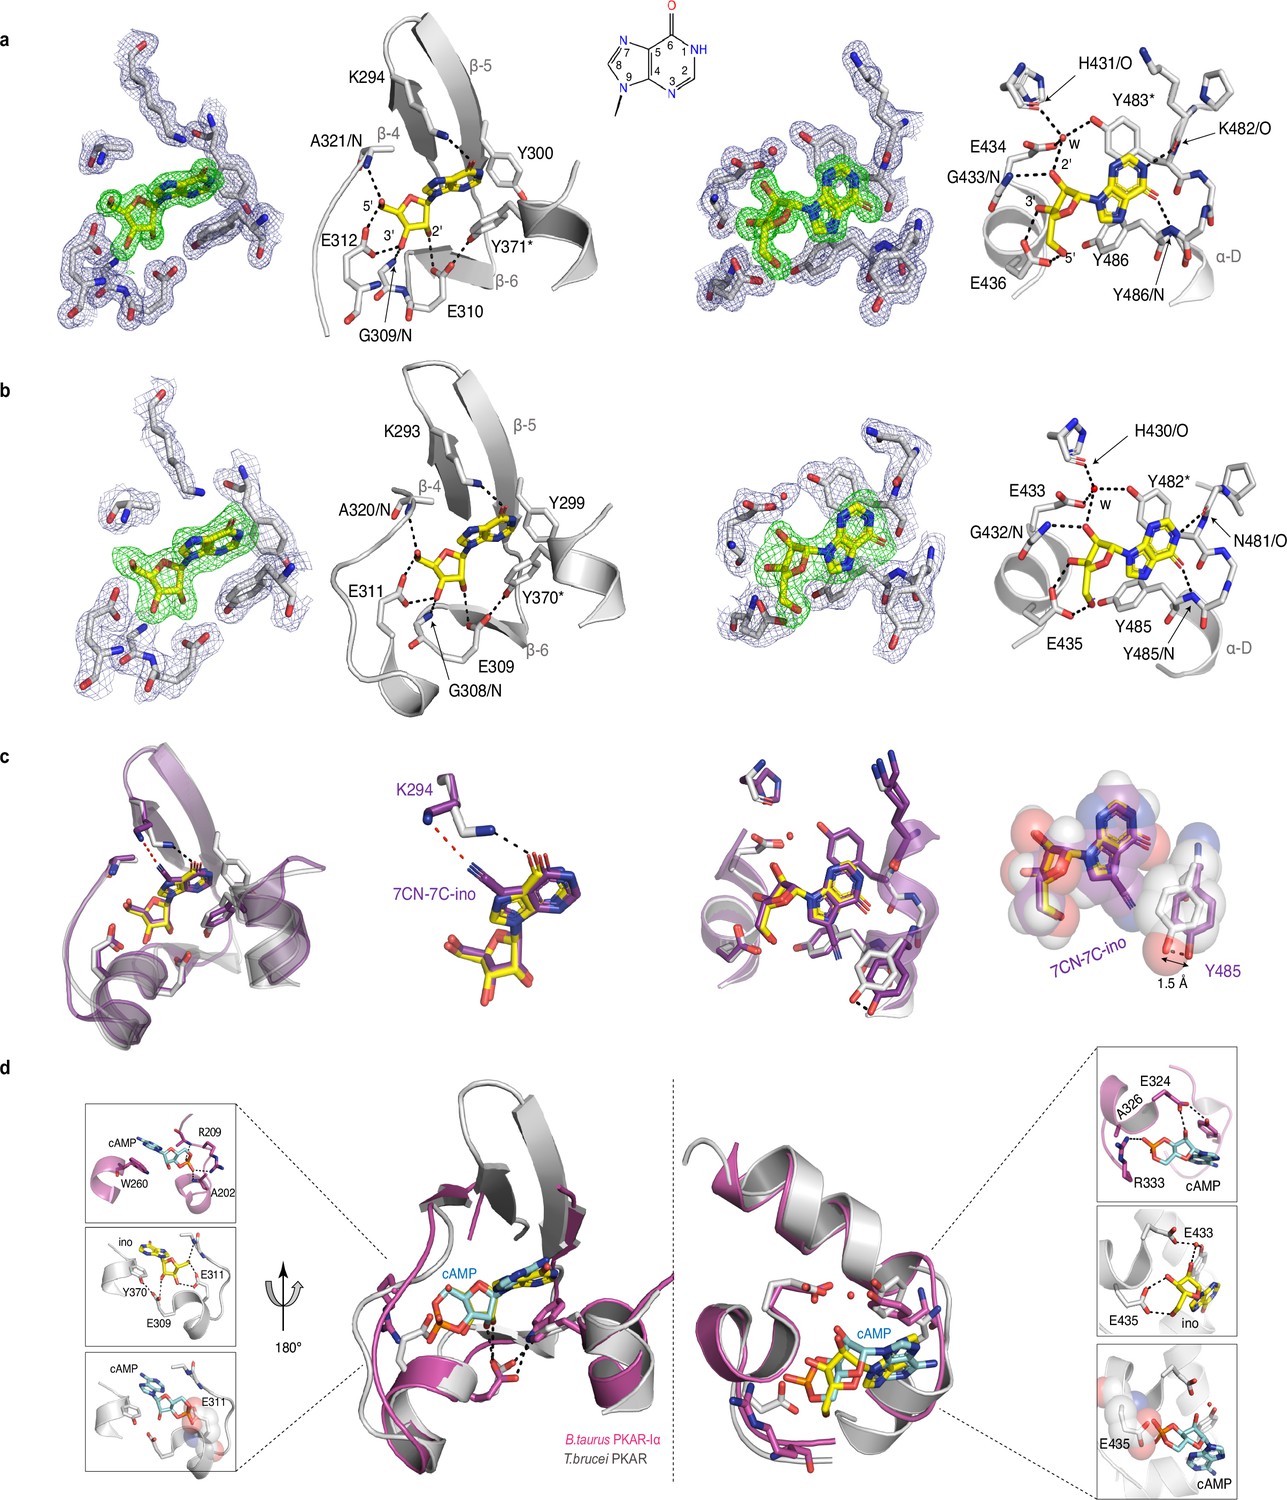
(a) Electron density (ED) maps of site A (left) and site B (right) of T. cruzi PKAR(200-503) and corresponding ball and stick models of the hydrogen bond network around the bound inosine molecule. The inosine molecule was modeled into the omit map (Fo-Fc, 3σ, green) in each binding site. The surrounding protein atoms are shown together with a 2Fo-Fc map (1σ, dark blue). The black dashed lines represent hydrogen bonds (≤3 Å cutoff). Residues G309; E310; E312 and A321 belong to Ribose Binding Cassette A (RBC-A), while G433; E434 and E436 are part of Ribose Binding Cassette B (RBC-B). Capping residues (Y371 and Y483) taking part in a π-stacking interaction with the hypoxanthine ring of inosine are marked with an asterisk. Purine ring nomenclature is shown in the middle. PDB: 6HYI. (b) T. brucei PKAR(199-499) displayed as in A, Residues G308, E309, E311, and A320 are part of RBC-A while G432, E433, and E435 belong to RBC-B. Capping residues (Y370 and Y482) are marked with an asterisk. PDB: 6FLO. (c) Structural alignment of inosine-bound T. cruzi PKAR (PDB: 6HYI; protein grey, inosine yellow) and 7-CN-7C-Ino-bound T. cruzi PKAR (PDB: 6FTF; protein and ligand in purple). The different ligand binding to K294 (A-site, left) and a 1.5 Å displacement of Y485 due to the bulky cyano group of 7-CN-7-C-Ino (B-site, right) are shown at two magnifications. (d) Structural alignment of TbPKAR (PDB: 6FLO; protein grey, inosine yellow) and B. taurus PKARIα (PDB: 1RGS; protein magenta, cAMP cyan) for binding sites A (left) and B (right). In the blow-up panels, ligand-protein interactions are highlighted for the mammalian PKARIα (upper panel), TbPKAR (middle panel), and TbPKAR overlayed with the cAMP ligand of the aligned PKARIα structure. A clash between the exocyclic oxygens of cAMP and the side chain of glutamate residues (faded sphere-representation) is seen in both binding sites.
Figure 2—figure supplement 1
Protein purification and quality controls for ITC and crystallization experiments for TbPKAR, LdPKAR1, and TcPKAR.
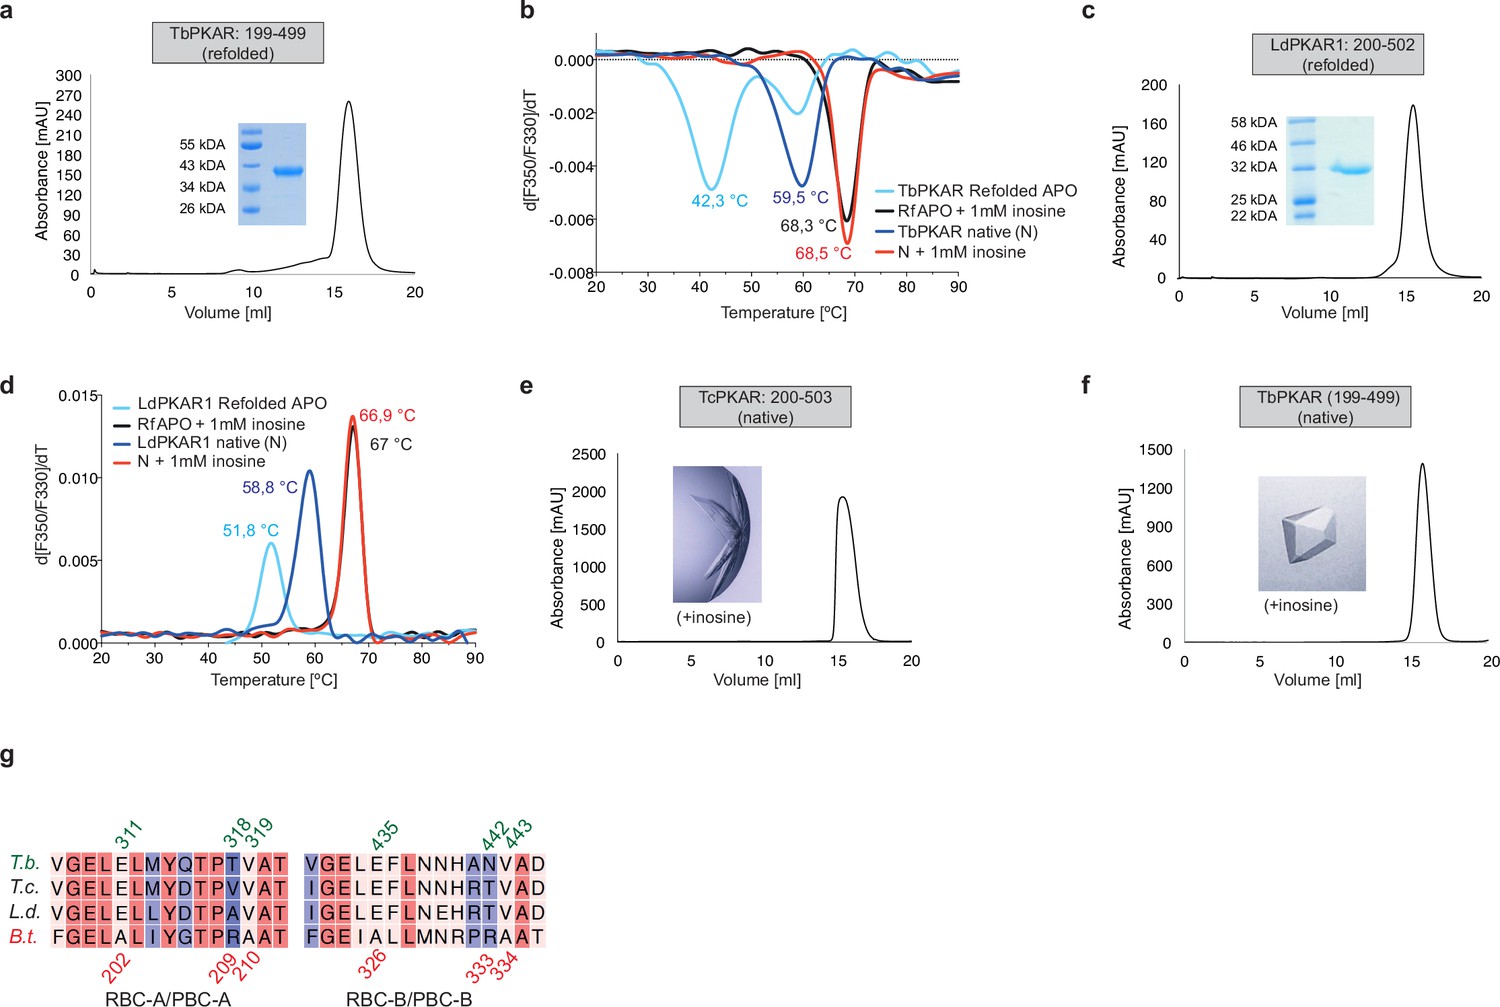
(a, c) Size Exclusion Chromatogram (SEC) of refolded APO TbPKAR(199-499) and LdPKAR1(200–502), respectively, used for ITC. Purity and expected molecular mass of protein samples are confirmed by SDS-PAGE (inset). (b) Thermal denaturation profiles (nanoDSF) of refolded APO (RfAPO) and native (N) T. brucei PKAR(199-499) with and without ligands. (d) Same as b for LdPKAR1(200–502) in absence or upon addition of 1 mM inosine. (e–f) Size exclusion chromatograms of purified TcPKAR(200-503) and TbPKAR(199- 499). Ligands added for co-crystallization are given next to the image of a representative crystal. (g) Sequence alignment of RBC-A/PBC-A(left) and RBC-B/PBC-B (right) motifs within CNB-A (left) and CNB-B (right) of PKAR from T. brucei (T.b.), T. cruzi (T.c.), L. donovani (L.d.), and B. taurus (B.t). Numbering refers to sequence of T. brucei (top, green) and B. taurus (bottom, red). Degree of sequence conservation is indicated in a color code from red (high conservation) to blue (low conservation).
-
Figure 2—figure supplement 1—source data 1
Original Coomassie stained gel showing refolded (APO) LdPKAR1(200–502).
- https://cdn.elifesciences.org/articles/91040/elife-91040-fig2-figsupp1-data1-v1.zip
-
Figure 2—figure supplement 1—source data 2
Original Coomassie stained gel showing refolded (APO) LdPKAR1(200–502) (labelled).
- https://cdn.elifesciences.org/articles/91040/elife-91040-fig2-figsupp1-data2-v1.pdf
Figure 3 with 2 supplements
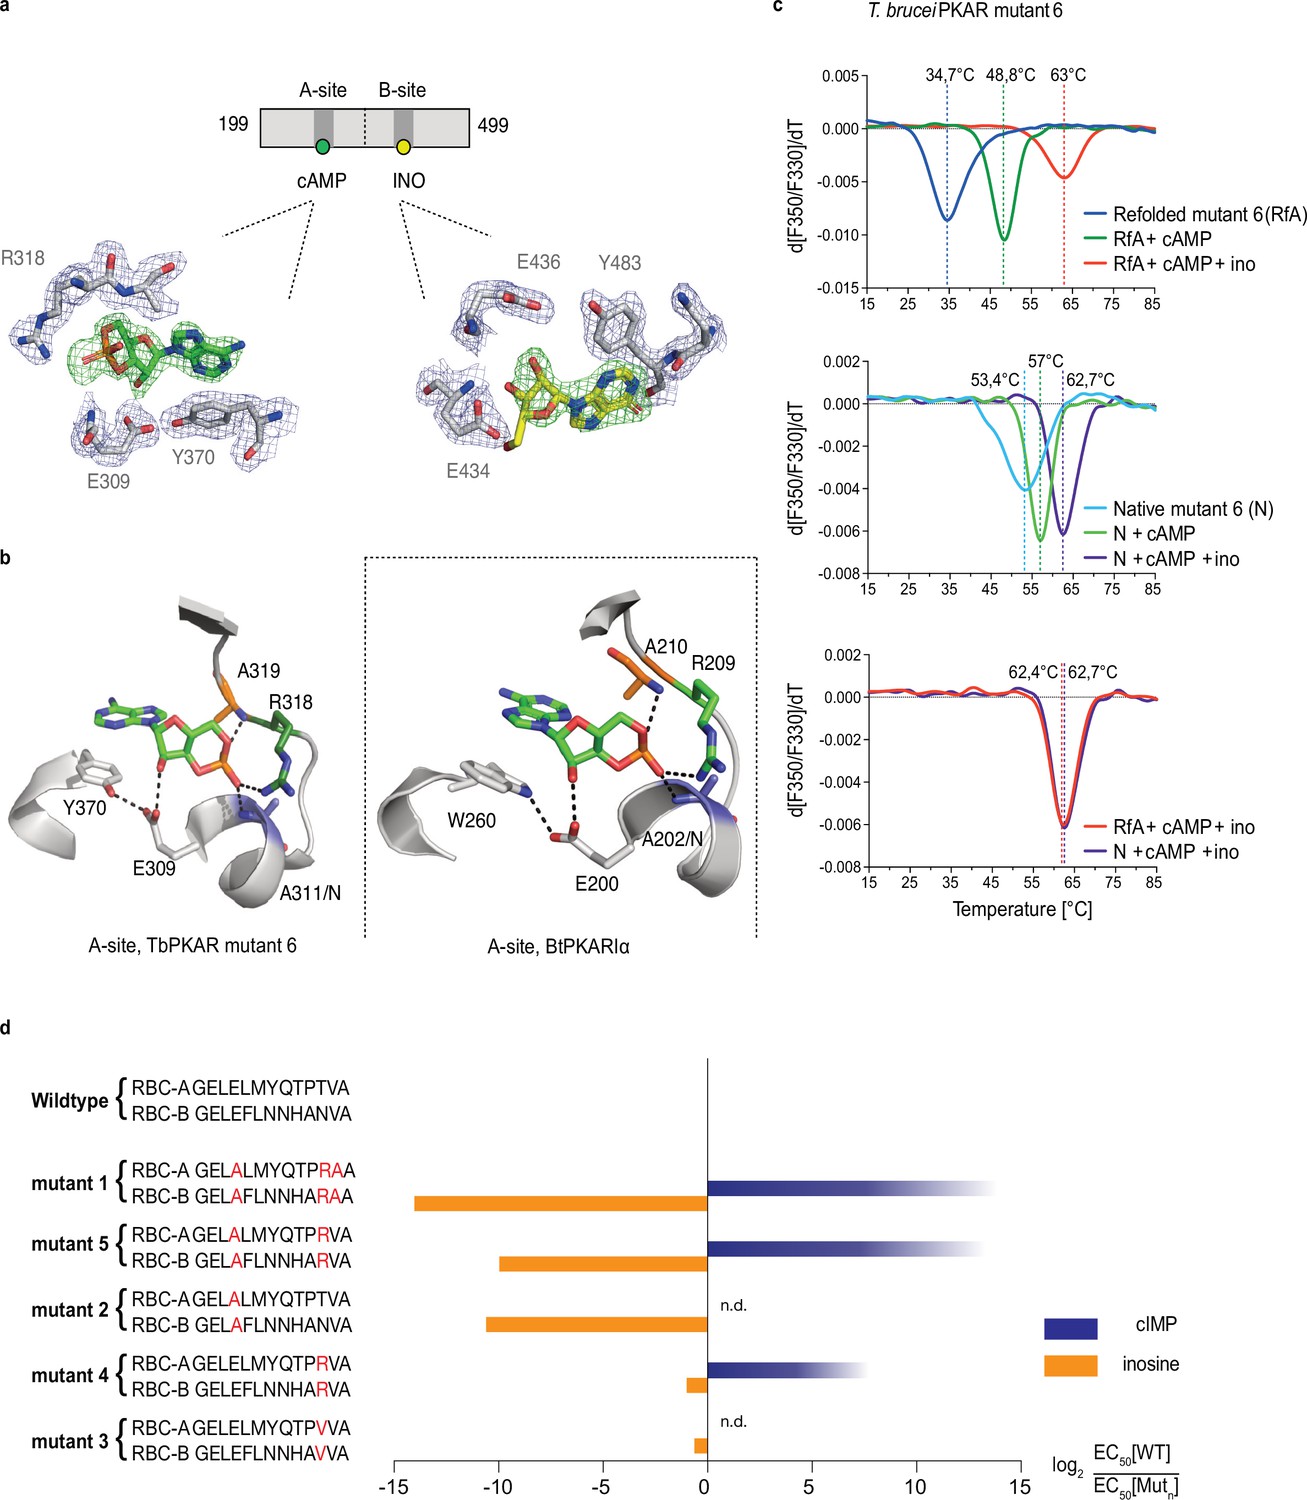
Conversion of TbPKAR to cyclic nucleotide specificity (a) Structure of ligand binding sites of TbPKAR(199-499) mutant 6 crystallized in presence of 1 mM cAMP (Figure 3—figure supplement 2a, PDB: 6H4G).
The scheme above the electron density map highlights binding of cAMP to site A and inosine to site B. Below, the electron densities show the protein atoms inside the 2Fo-Fc (1σ, dark blue) map and ligands inside the Fo-Fc omit map (3σ, green). (b) Structural comparison between the A pocket of TbPKAR(199-499) mutant 6 (left) and BtPKARIα (right, PDB: 1RGS). The point mutations in mutant 6 are colored in purple (E311A), green (T318R) and orange (V319A). The same color code was used for the corresponding amino acids in BtPKARIα. Hydrogen bonds (3 Å) are indicated as dashed lines. (c) Thermal denaturation profiles (nanoDSF) of refolded APO (upper panel) and native mutant 6 TbPKAR(199-499) (middle panel) in the absence and presence of 1 mM ligands as indicated. The lower panel is a superposition of the thermal denaturation profiles of the two protein preparations (native and refolded APO) both incubated with 1 mM cAMP plus 1 mM inosine. (d) Mutational analysis of TbPKAR nucleoside binding sites. Relative kinase activation potency by inosine (orange) and cIMP (blue) is displayed as log2 of the EC50[Wildtype]/EC50 [Mutantn] ratio on the x-axis. Since up to 5 mM cIMP did not activate the WT, this value was taken as minimal estimate of EC50[WT] for cIMP. This uncertainty propagating into the calculated ratio is indicated by a color gradient at the right end of the columns. All data are taken from Table 2. Missing columns are not determined (n. d). The sequences of RBC-A and RBC-B of mutants 1–5, with mutated amino acids highlighted in red, are shown on the left to the respective columns.
Figure 3—figure supplement 1
Activation of mutant TbPKA holoenzymes by different ligands.
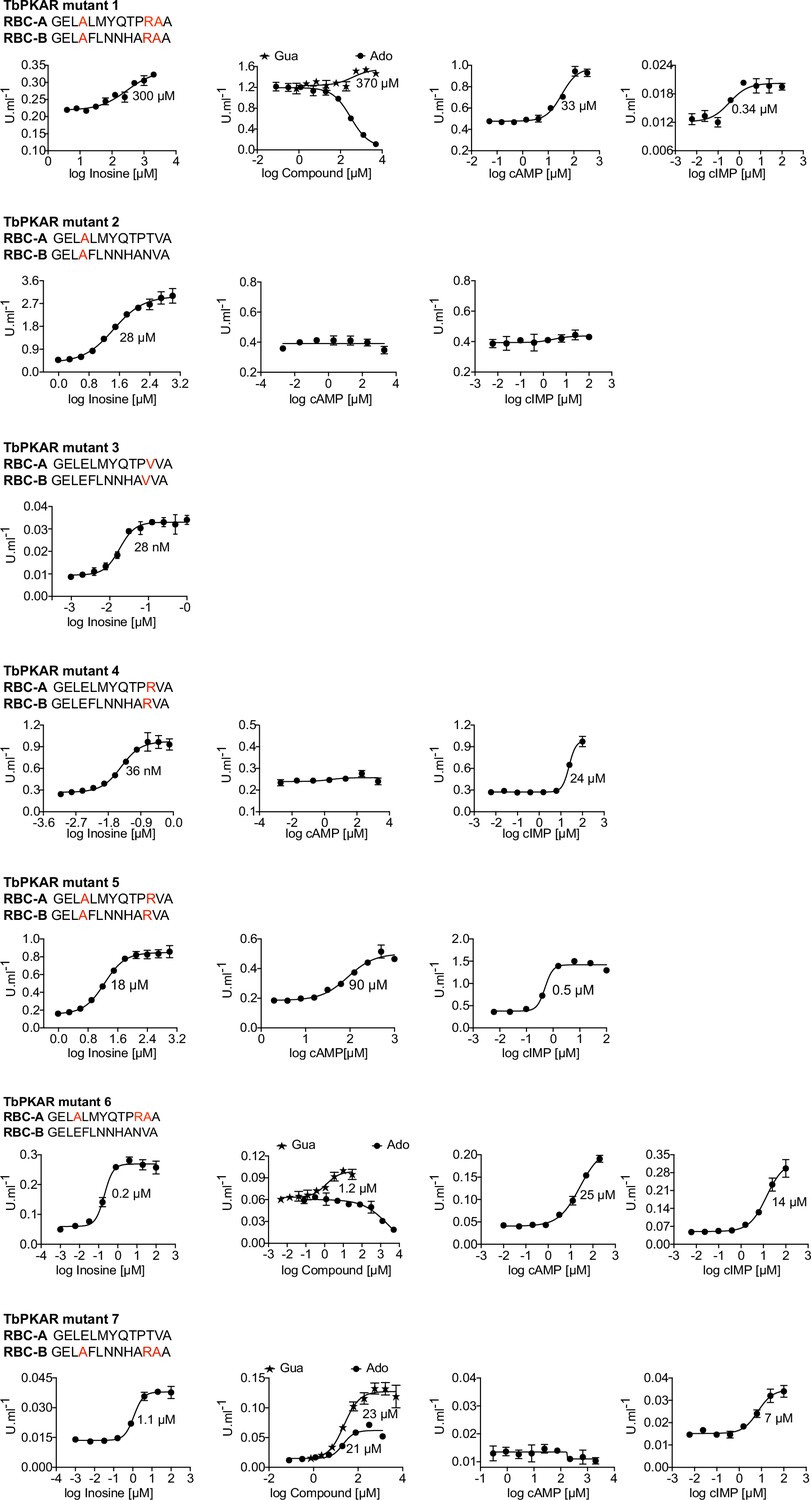
Representative dose-response curves for activation of T. brucei PKA holoenzyme mutants 1–7 by purine nucleosides and cyclic nucleotides as in Figure 1a. The sequences of RBC-A and RBC-B of mutants 1–7 are placed above the graphs with mutated amino acids highlighted in red. Calculated EC50 values are taken from Table 2.
-
Figure 3—figure supplement 1—source data 1
In vitro kinase activation assays of mutants 1–7 of T. brucei PKAR-PKAC1 holoenzyme by nucleosides and cyclic nucleotides.
- https://cdn.elifesciences.org/articles/91040/elife-91040-fig3-figsupp1-data1-v1.xlsx
Figure 3—figure supplement 2
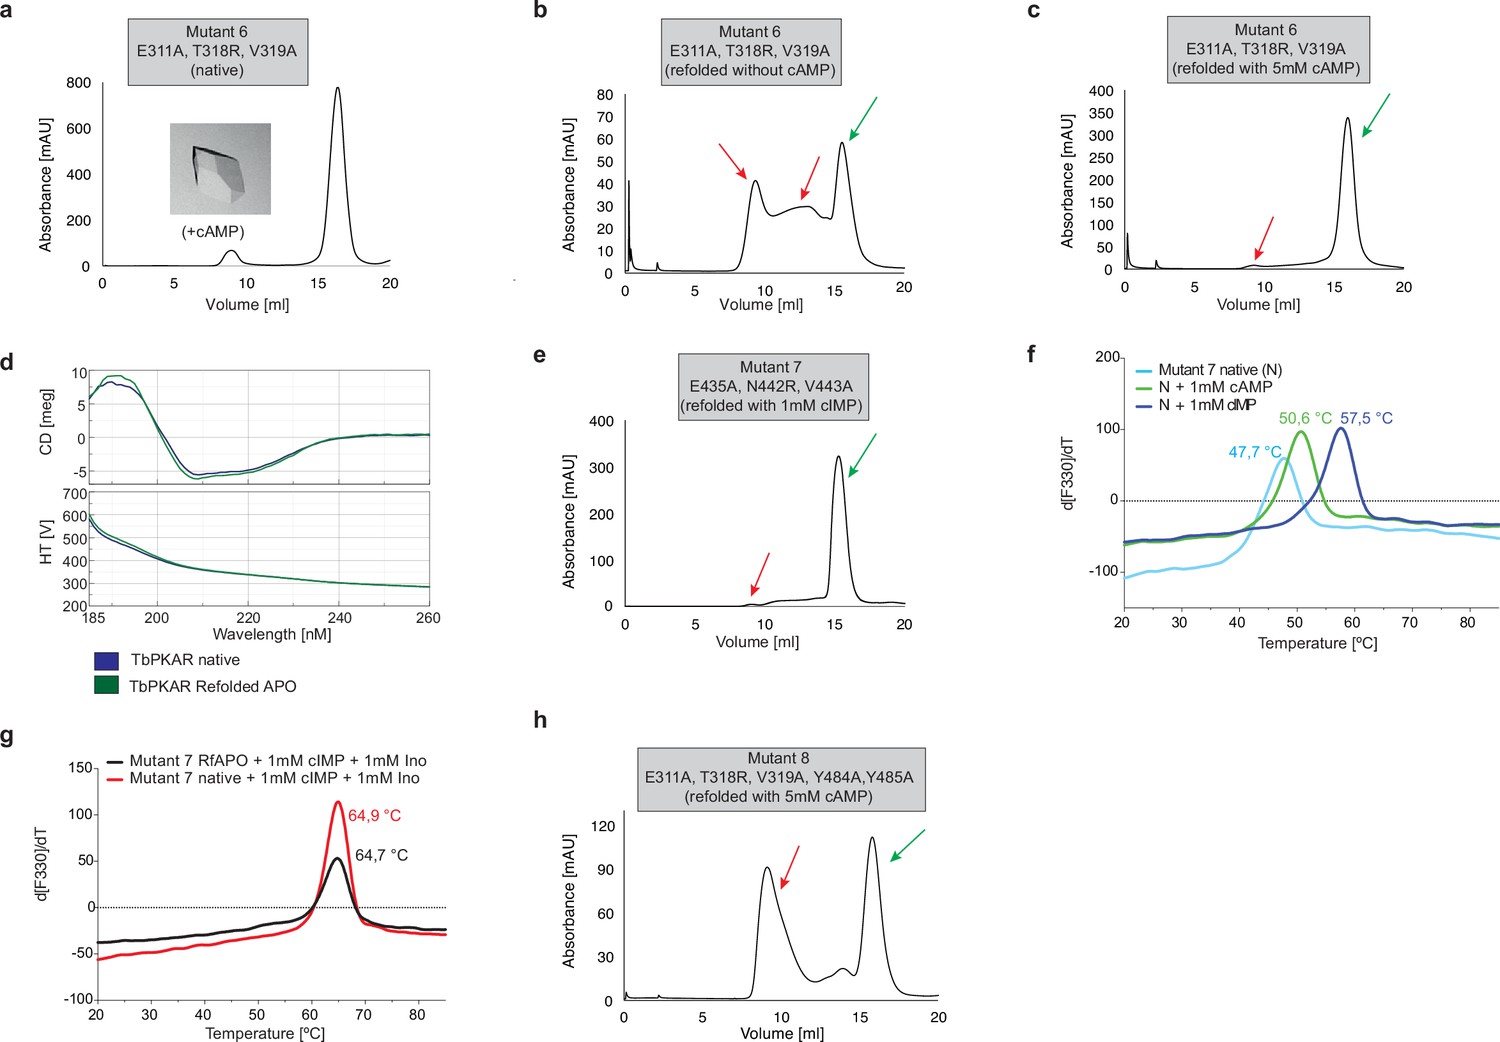
Protein purification and quality controls for ITC and crystallization experiments for TbPKAR mutant 6–8.
(a) Size exclusion chromatograms of purified TbPKAR mutant 6. Ligand added for co-crystallization is given next to the image of a representative crystal. (b, c) Size Exclusion Chromatogram (SEC) of APO TbPKAR mutant 6 refolded without cAMP (b) and with 5 mM cAMP (c). Green arrows indicate protein monomers, red arrows indicate aggregated or misfolded protein. (d) Circular dichroism spectra (average of 20 scans) of TbPKAR mutant 6 native (dark blue) and refolded APO (green) preparations. (e) Same as b for TbPKAR mutant 7 refolded in presence of 1 mM cIMP. (f) Thermal denaturation profiles (nanoDSF) of native (N) TbPKAR mutant 7 in absence (light blue) and upon incubation with 1 mM cAMP (green) or 1 mM cIMP (dark blue). (g) Same as f for native TbPKAR mutant 7 (red) and refolded APO TbPKAR mutant 7(RfAPO, black) in presence of 1 mM cIMP and 1 mM inosine. (h) Same as b for TbPKAR mutant 8.
Figure 4 with 1 supplement
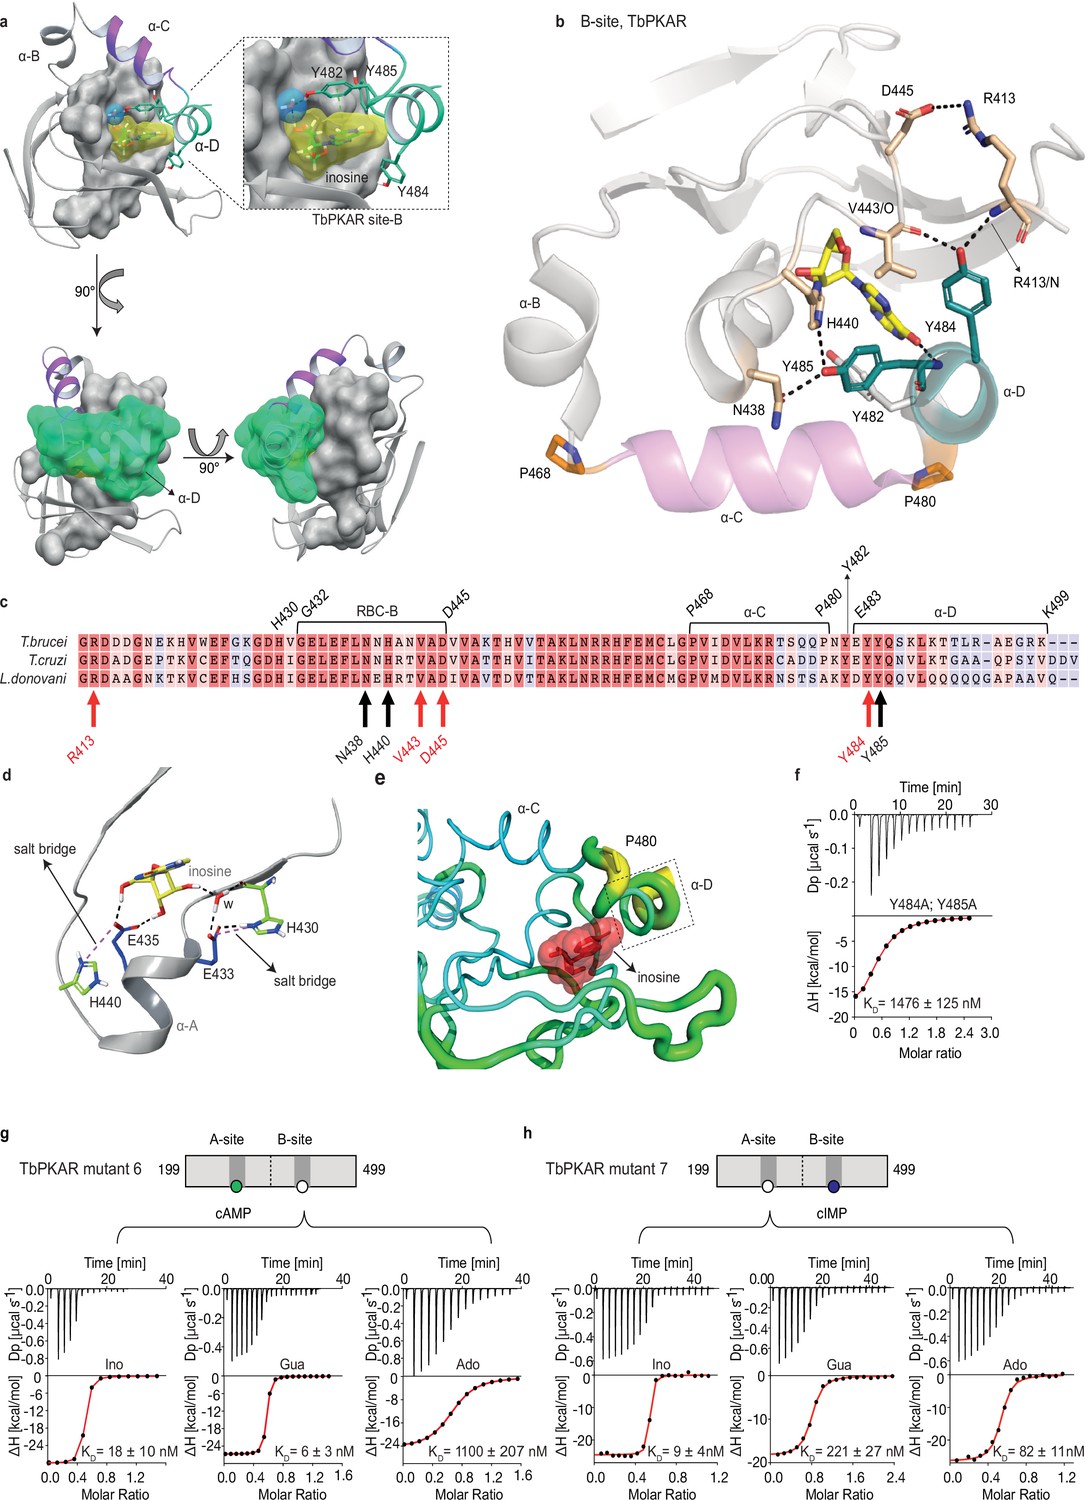
The αD helix of TbPKAR determines high binding affinity and ligand selectivity of the B-site.
(a) C-terminal helices αB (grey), αC (purple) and αD (green) in CNB-B of TbPKAR, illustrating the lid-like position of the αD helix. The ribose binding cassette (RBC, residues 432–445) is shown in surface representation (grey). Inosine (yellow) and one water molecule (blue) are sandwiched between RBC-B and the αD helix (enlarged view in the blow-up panel). The 90o rotations of the structure show that the αC and αD helices are orthogonally positioned to each other. (b) The hydrogen-bond network formed between Y484 and Y485 in αD helix and amino acids in the beta barrel of site B. Hydrogen bonds (3 Å) are displayed as black dashed lines. (c) Sequence alignment of C-terminal domains from T. brucei, T. cruzi, and L. donovani PKARs. Only TbPKAR numbering is shown. Red arrows mark residues involved in the hydrogen bond network with Y484, black arrows mark residues involved in the hydrogen bond network with Y485. (d) Extended network of hydrogen bonds and salt bridges (purple dashed lines) between two conserved histidines (H430 and H440) and the ribose-binding glutamates E433 and E435. (e) Beta factor representation of TbPKAR site B showing a higher overall atom displacement in the crystal structure of the αD helix and in particular of P480. The Beta factor value increases from blue to red and from thin to thick, indicating an increase of atom displacement in the crystal. (f) Representative binding isotherm (ITC) for inosine binding to TbPKAR mutant 8 (mutant 6 with additional substitutions Y484A, Y485A). Data representation as in Figure 1d, the KD value is taken from . (g, h) Representative binding isotherms (ITC) for mutant 6 refolded in presence of 1 mM cAMP (g) and mutant 7 refolded in presence of 1 mM cIMP (h). Data representation as in Figure 1d, the KD values are taken from . For sequences of mutants see Table 2, for purity and non-aggregated state of R subunits see Figure 3—figure supplement 2c, e.
-
Figure 4—source data 1
ITC measurements for inosine titrated to T. brucei PKAR mutant 8.
- https://cdn.elifesciences.org/articles/91040/elife-91040-fig4-data1-v1.xlsx
-
Figure 4—source data 2
ITC measurements for inosine, guanosine, or adenosine titrated to T. brucei PKAR mutant 6.
- https://cdn.elifesciences.org/articles/91040/elife-91040-fig4-data2-v1.xlsx
-
Figure 4—source data 3
ITC measurements for inosine, guanosine, or adenosine titrated to T. brucei PKAR mutant 7.
- https://cdn.elifesciences.org/articles/91040/elife-91040-fig4-data3-v1.xlsx
Figure 4—figure supplement 1
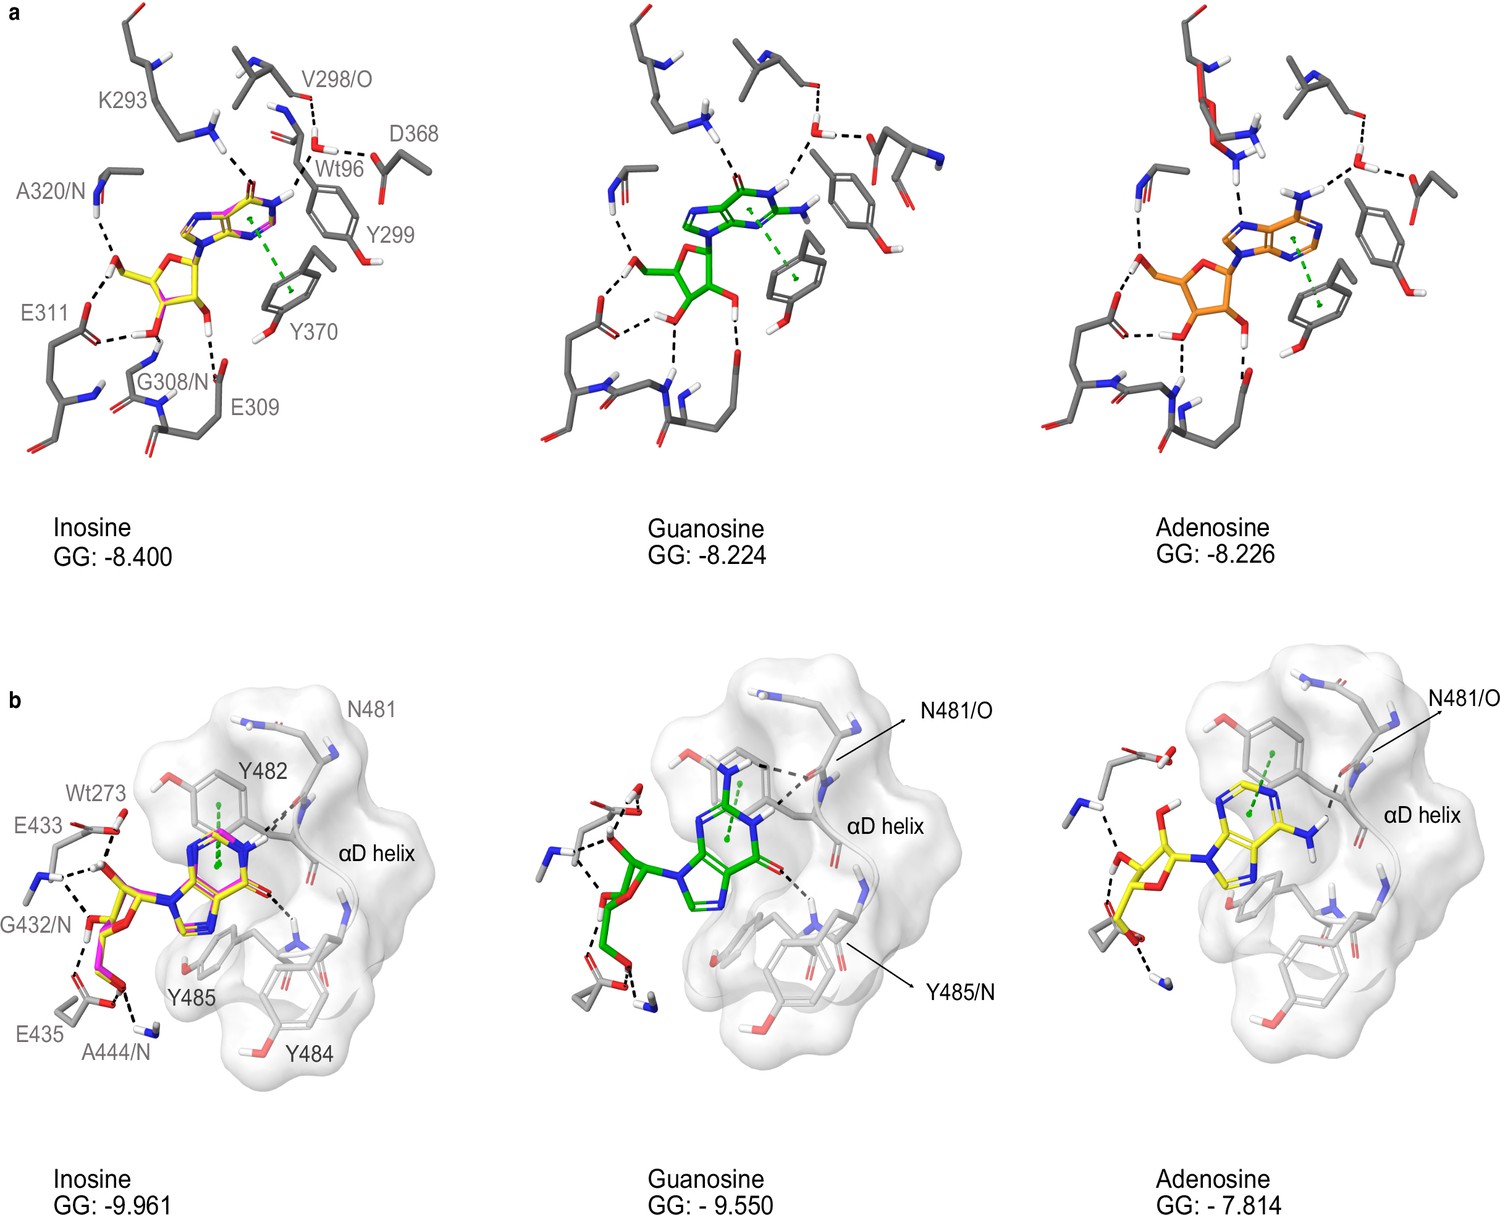
Docking of nucleosides to A and B site of TbPKAR.
(a) Purine nucleosides (guanosine and adenosine) were docked into site A in the T. brucei PKAR crystal structure (PDB: 6FLO, chain B,) using GLIDE (Friesner et al., 2004), as implemented in Maestro (Schrödinger). Best poses were chosen according to the Glide G score (GG), given in the figure. (b) Same as A for site B. As a control, re-docking of inosine (magenta) was performed for comparison with the ligand in the crystal structures (yellow). RMSD values are 0.035 Å for site A and 0.036 Å for site B.
Figure 5
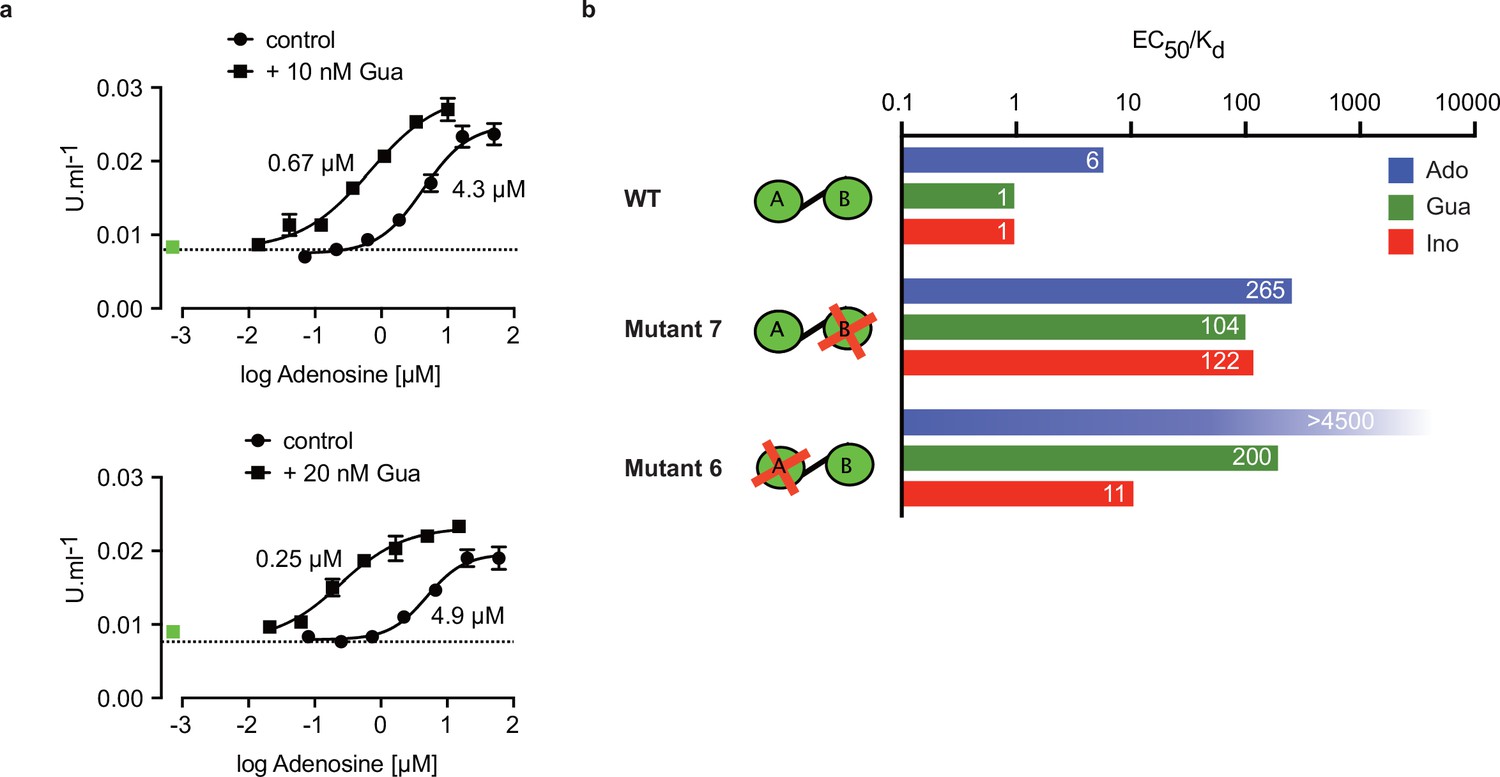
Binding site selectivity and synergism of nucleosides.
(a) Dose-response curves for kinase activation of TbPKA by adenosine in presence of 10 nM or 20 nM guanosine. Error bars are m ± SD of technical triplicates, the calculated EC50 values are given next to the respective curve. Basal kinase activity in the absence of any ligand is indicated by a horizontal dashed line. A green square (placed outside the log scale) represents the control with guanosine (10 or 20 nM) only. (b) Ratio of kinase activation over binding affinity (EC50/KD) for different purine nucleosides and individual binding sites A and B. Unavailable binding sites in mutants 6 and 7 are indicated by red crosses. Data are taken from Table 2 and .
-
Figure 5—source data 1
In vitro kinase activation assays of T. brucei PKAR-PKAC1 holoenzyme by adenosine in presence of 10 nM or 20 nM guanosine.
- https://cdn.elifesciences.org/articles/91040/elife-91040-fig5-data1-v1.xlsx
Figure 6 with 1 supplement
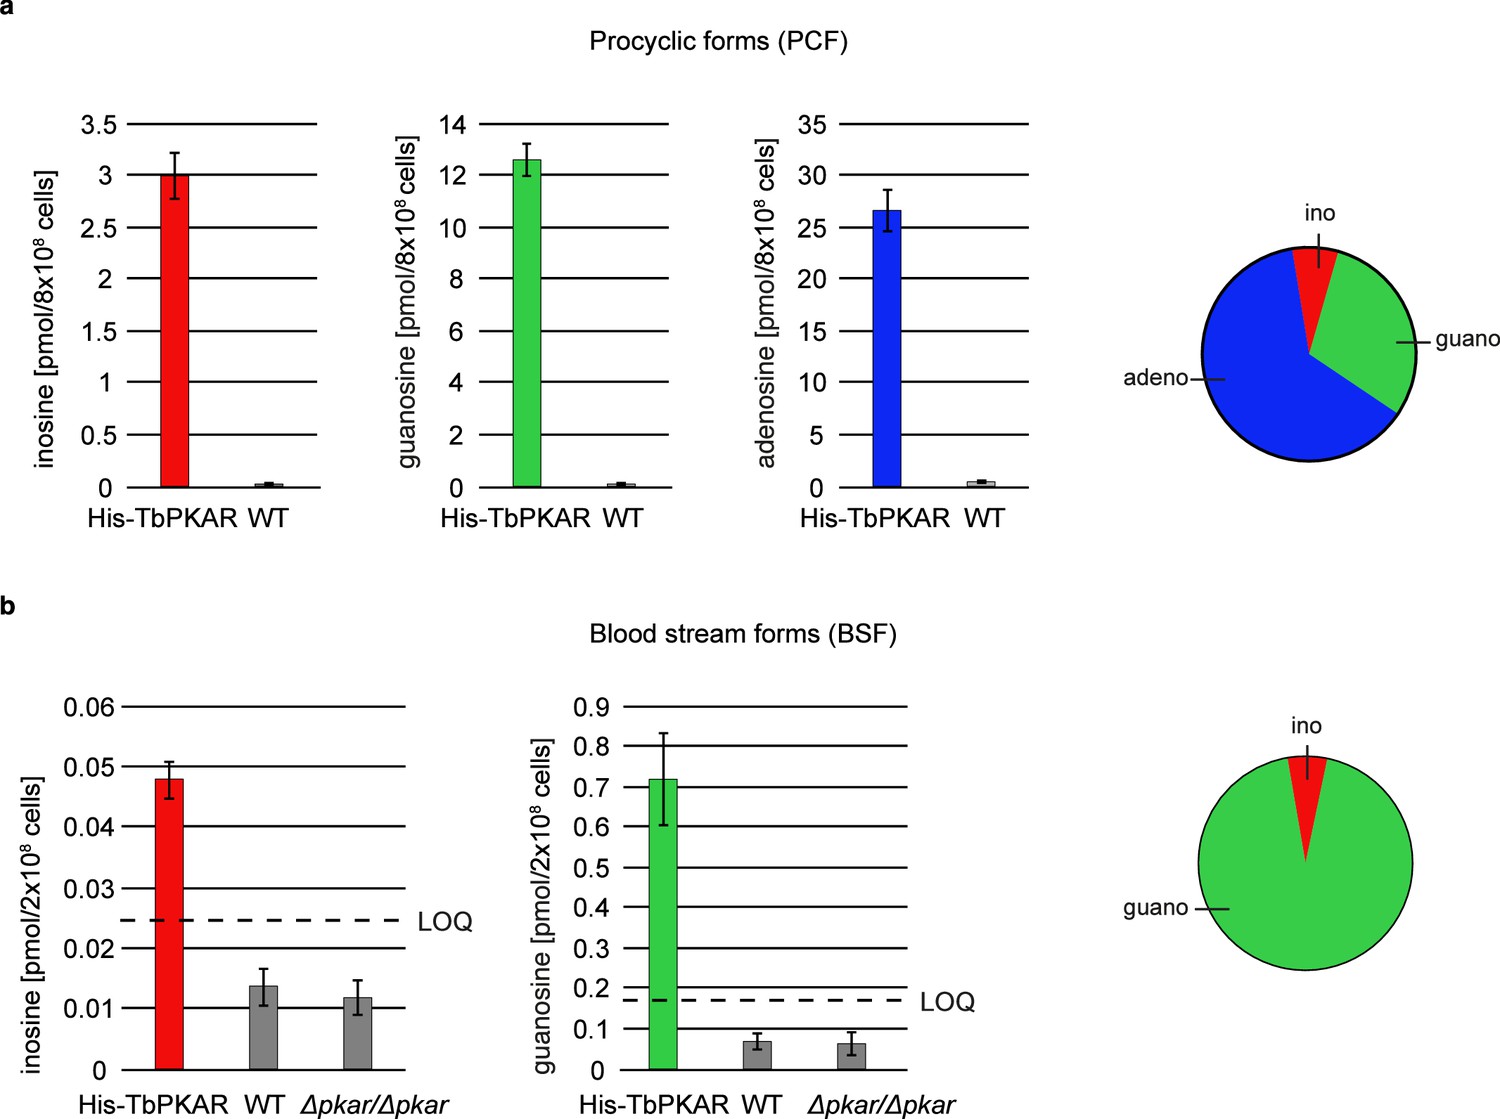
Quantification of ligands bound to TbPKAR in lysed cells HPLC-MS-based quantification of nucleoside amounts released from boiled His-tagged TbPKAR pulled down from lysed T. brucei (see Figure 6—figure supplement 1).
Inosine (red), guanosine (green), and adenosine (blue) were quantified using stable isotope-labeled internal standards. Error bars indicate SD from three biological replicates. Note the different Y-axis scales. Pie charts on the right show the relative amounts of nucleosides detected and quantified. (a) Procyclic stage T. brucei strain EATRO1125 expressing His-TbPKAR and parental control cells. Pulled down nucleosides from the control cell line were in the range of water blanks. (b) Bloodstream stage T. brucei MITat 1.2 single marker line expressing His-TbPKAR, parental control cells and isogenic Δtbpkar/Δtbpkar cells devoid of endogenous PKAR. The limit of quantification (LOQ), defined by the linear part of the standard curves for stable isotope-labeled nucleoside references, is given by a dashed line. Adenosine was below the LOQ.
Figure 6—figure supplement 1
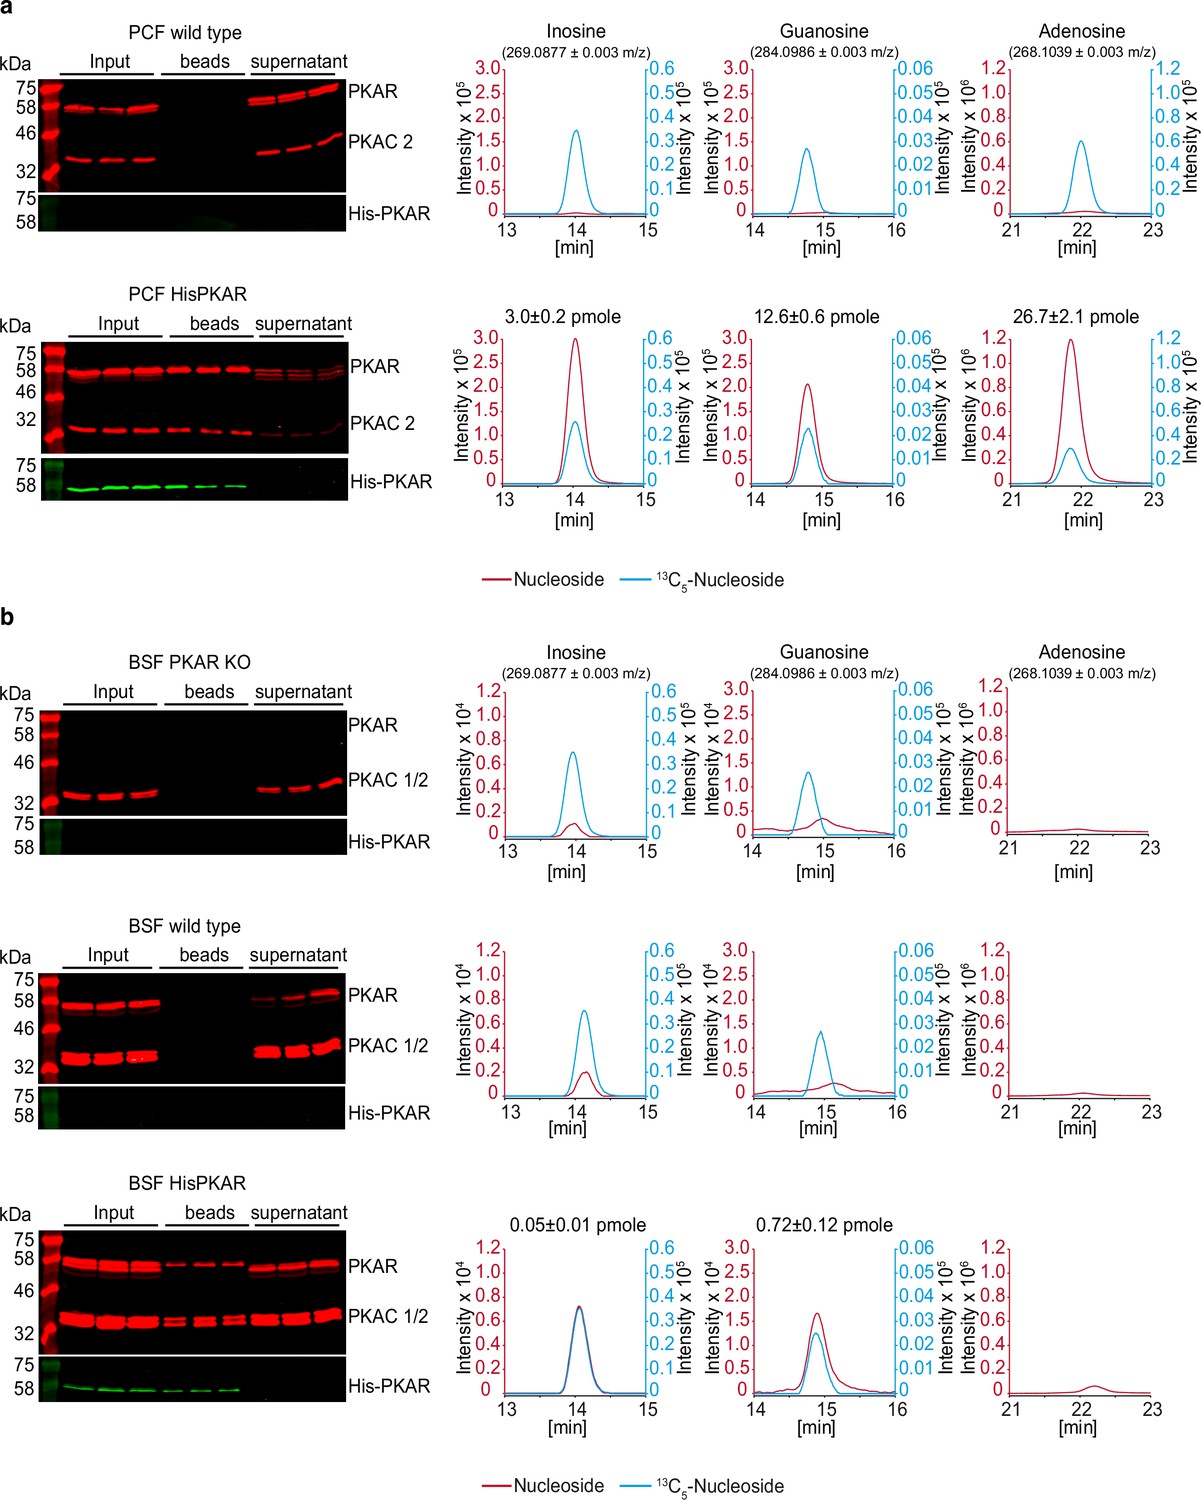
HPLC-MS quantification of ligands bound to TbPKAR in parasite lysates.
The left panels show western analysis of soluble fraction from lysed parasites expressing tagged TbPKAR or of control parasites (input), pulled down beads and supernatants (all in triplicate). Anti-PKAR, anti-PKAC1/2 and anti-His antibodies were used. Bound ligands were released by boiling of Ni-NTA beads in water and the aqueous fraction subjected to HPLC-MS analysis. Graphs on the right show chromatograms for the selected mass [M+H+]±0.003 m/z (given in parenthesis) for inosine, guanosine and adenosine (all red colored), and the matched stable isotope-labeled internal standards (all blue colored). Where peak quantification was in the linear range of the standard curves, m ± SD pmole of nucleoside per biological replicate of 8x10⁸ or 2x10⁸ cells is given for PCF or BSF, respectively (same values in Figure 6). For graphical reasons, the MS-signals were smoothened by Boxcar algorithm. (a) Procyclic stage (PCF) T. brucei strain EATRO1125 wild type cells and cells expressing His-TbPKAR, as indicated. Nucleoside amounts pulled down from wild type PCF were in the range of blanks. (b) Same as A for bloodstream stage T. brucei MITat 1.2 single marker Δtbpkar/Δtbpkar cells, wild type cells and cells expressing His-TbPKAR, as indicated. Only trace amounts of adenosine were detected.
-
Figure 6—figure supplement 1—source data 1
Original file for the western blot analysis in Figure 6—figure supplement 1.
- https://cdn.elifesciences.org/articles/91040/elife-91040-fig6-figsupp1-data1-v1.zip
-
Figure 6—figure supplement 1—source data 2
Original file for the western blot analysis in Figure 6—figure supplement 1 with highlighted bands and sample labels.
BSF – blood stream stage, PCF – procyclic stage.
- https://cdn.elifesciences.org/articles/91040/elife-91040-fig6-figsupp1-data2-v1.pdf
Videos
Video 1
Description: Alignment between TcPKAR (PDB: 6HYI, light blue) and TbPKAR (PDB:6FLO, chain B, light gray) displaying an RMSD of 0.909 Å calculated by PyMOL.
Inosine is displayed in green and magenta in TbPKAR and TcPKAR, respectively.
Video 2
Description: Alignment between A-site of PKARIα (PDB: 1RGS, gray, aa: 152–225) and A-site from mutant 6 (PDB: 6H4G, light green, aa: 259–332).
In mammalian PKAR, cAMP binds in the syn-conformation, while in Mutant 6 it binds in the anti-conformation. Of particular note is Cys278 in TbPKAR mutant 6, which is significantly displaced to the newly inserted R318. Hydrogen bonds <3 Å are shown as black dashes.
Video 3
Description: Sphere representation of the B-site from TbPKAR (PDB:6FLO, chain B, aa: 378–490) showing residues Y484, Y485, and K488 in the αD helix in purple, V443 in green, inosine in blue and the rest of the protein in yellow.
V443 is sandwiched between the alpha-D helix and the beta barrel, taking part in hydrophobic contacts to both sides.
Video 4
Description: Surface representation of the B-site from TbPKAR (PDB:6FLO, chain B, aa: 378–490) showing an inosine molecule (blue spheres) locked inside the protein with no access to solvent.
The αD helix (N481 to end) is depicted in dark purple.
Tables
Table 1
Structure activity relation (SAR) analysis for PKA holoenzyme activation.
| PKA holoenzyme complex | Ligand | EC50 (95% Cl)* |
|---|---|---|
| T. brucei PKAR/PKAC1 | Inosine | 14 (13–15) nM |
| Guanosine | 152 (132–172) nM | |
| Adenosine | 7.0 (6.9–8.4) µM | |
| cAMP | -† | |
| cGMP | 0.36 (0.33–0.41) mM | |
| cIMP | -† | |
| AMP | -† | |
| GMP | 1.1 (0.9–1.3) mM | |
| IMP | 108 (83–135) µM | |
| 2'-deoxyadenosine | -† | |
| 3'-deoxyadenosine | -† | |
| 5'-deoxyadenosine | -† | |
| Nebularine | 2.6 (2.2–3.2) µM | |
| Allopurinol riboside | 1.7 (1.5–1.9) µM | |
| Xanthosine | 62 (51–72) µM | |
| Uridine | 40 (35–47) µM | |
| Cytidine | ≥350 µM | |
| Leishmania PKAR1/PKAC1 | Inosine | 47 (33–63) nM |
| Guanosine | 1.7 (1.4–2.1) µM | |
| Adenosine | 6.5 (5.7–7.6) µM | |
| cAMP | -† | |
| T. cruzi PKAR/PKAC2 | Inosine | 150 (110–200) nM |
| Guanosine | 3.5 (2.8–4.5) µM | |
| Adenosine | 8.3 (5.2–12.4) µM | |
| cAMP | -† | |
| human RIα/mouse Cα | Inosine | -† |
| Guanosine | -† | |
| Adenosine | -† | |
| cAMP | 75 (59–93) nM |
-
*
Mean half activation constants (EC50) and 95% confidence interval (95% CI) determined from Figure 1—figure supplement 1 using Graphpad prism 7.0 for technical triplicates.
-
†
No activation was detected up to a maximum concentration of 5 mM.
Table 2
Activation of mutant TbPKA holoenzymes by different ligands.
| TbPKA holoenzyme | EC50 (95% Cl) | |||||
|---|---|---|---|---|---|---|
| Inosine | cIMP | Adenosine | Guanosine | cAMP | ||
| WT | RBC-A -GELELMYQTPTVA- RBC-B -GELEFLNNHANVA- | 18 (13–22) nM* | - ‡ | 5 (3-7) µM* | 0.14 (0.08–0.19) µM* | - ‡ |
| Mut ¶ | ||||||
| RBC-A -GELALMYQTPRAA- RBC-B -GELAFLNNHARAA- | 300 (160–600) µM† | 0.34 (0.2–0.7) µM† | - ‡ | 370 (130–1000) µM† | 33 (26–45) µM† | |
| RBC-A -GELALMYQTPTVA- RBC-B -GELAFLNNHANVA- | 28 (23–35) µM† | nd** | nd | nd | - § | |
| 3 | RBC-A -GELELMYQTPVVA- RBC-B -GELEFLNNHAVVA- | 28 (15–37) nM† | nd | nd | nd | nd |
| 4 | RBC-A -GELELMYQTPRVA- RBC-B -GELEFLNNHARVA- | 36 (29–44) nM† | 24 (22–26) µM† | nd | nd | - § |
| 5 | RBC-A -GELALMYQTPRVA- RBC-B -GELAFLNNHARVA- | 18 (15–20) µM† | 0.5 (0.3–0.6) µM† | nd | nd | 90 (71–115) µM† |
| 6 | RBC-A -GELALMYQTPRAA- RBC-B -GELEFLNNHANVA- | 0.2 (0.16–0.25) µM† | 14 (10–25) µM† | - ‡ | 1.2 (0.6–2.6) µM† | 25 (19–38) µM† |
| 7 | RBC-A -GELELMYQTPTVA- RBC-B -GELAFLNNHARAA- | 1.1 (0.9–1.4) µM† | 7 (5-11) µM† | 21 (13–30) µM† | 23 (17–32) µM† | - § |
-
*
mean half activation constants (EC50) and 95% confidence interval (95% Cl) for ≥ 3 biological replicates.
-
†
mean half activation constants (EC50) and 95% confidence interval (95% Cl) for technical triplicate of a single biological experiments.
-
‡
no activation was detected up to a maximum concentration of 5 mM.
-
§
no activation was detected up to a maximum concentration of 2 mM.
-
¶
number given to the respective mutant; site-directed mutations indicated in red.
-
**
not determined.
Key resources table
| Reagent type (species) or resource | Designation | Source or reference | Identifiers | Additional information |
|---|---|---|---|---|
| Gene (T. brucei) | TbPKAR | TriTrypDB | Tb927.11.4610 | |
| Gene (T. brucei) | TbPKAC1 | TriTrypDB | Tb927.9.11100 | |
| Gene (T. cruzi) | TcPKAR1 | TriTrypDB | TcCLB.506227.150 | |
| Gene (T. cruzi) | TcPKAC2 | TriTrypDB | TcCLB.508461.280 | |
| Gene (L. donovani) | LdPKAR1 | TriTrypDB | LdBPK_130160.1 | |
| Gene (L. donovani) | LdPKAC1 | TriTrypDB | LINF_350045600 | |
| strain, strain background (E. coli) | Rosetta (DE3) | Novagen | SKU: 70954–3 | Electrocompetent cells |
| Cell line (L. tarentolae) | LEXSY T7-TR | Jena Bioscience | Cat.No.: LT-110 | |
| Cell line (T. brucei) | T. brucei brucei stock Lister 427 clone MiTat 1.2 | 10.1017/S0031182000046540 | All T. brucei brucei cell lines are derived in the laboratory from T. brucei brucei stock Lister 427 clone MiTat 1.2, originally obtained from G. Cross, NY | |
| Cell line (T. brucei) | T. brucei EATRO 1125 AnTat1.1 90:13 | 10.1101/gad.323404 | ||
| Cell line (T. brucei) | MITat1.2SM 6HIS TbPKAR | This paper | MITat1.2_SM blood stream forms (BSF) of T. brucei with expression of TbPKAR fused to a 6xHis tag | |
| Cell line (T. brucei) | EATRO11252T7 6HIS TbPKAR | This paper | EATRO11252T7 procyclic forms (PCF) of T. brucei with expression of TbPKAR fused to a 6xHis tag | |
| Cell line (T. brucei) | MITat1.2SM PKAR-KO | 10.1038/s41467-019-09338-z | MITat1.2_SM BSF PKAR knock out | |
| Transfected construct (T. brucei) | pLEW100v5b1d-BSD_6His-Tev TbPKAR | This paper | Construct cloned and transfected into MITat1.2SM (BSF) | |
| Transfected construct (T. brucei) | pHD1146-puro_6xHis-Tev TbPKAR | This paper | Construct cloned and transfected into EATRO11252T7 (PCF) | |
| Antibody | anti-PKAR (rabbit polyclonal) | 10.1038/s41467-019-09338-z | 1:500 | |
| Antibody | Anti-PKAC1/2 (rabbit polyclonal) | 10.1038/s41467-019-09338-z | 1:500-1:1000 | |
| Antibody | Anti-6x His tag (mouse monoclonal) | Thermofisher scientific | 1:1000 | |
| Antibody | IRDye 800CW anti-mouse IgG (goat polyclonal) | LICOR | Cat# 925–32210 | 1:5000 |
| Antibody | IRDye 680LT anti-rabbit IgG (goat polyclonal) | LICOR | Cat# 925–69021 | 1:5000 |
| Antibody | Alexa Fluor 680 anti-rabbit IgG (goat Superclonal Recombinant) | ThermoFisher | Cat# A27042 | 1:5000 |
| Recombinant DNA reagent | pLEXSY_I-ble3 (vector) | Jena Bioscience | Cat# EGE-244 | |
| Recombinant DNA reagent | pLEXY_I-neo3 (vector) | Jena Bioscience | Cat# EGE-245 | |
| Recombinant DNA reagent | pLEXSY_I-ble3_TbPKAR (plasmid) | 10.1038/s41467-019-09338-z | Transfected in LEXSY expression system | |
| Recombinant DNA reagent | pLEXSY_I-ble3_TbPKAR_mutant 1–7 (plasmids) | This Paper | Transfected in LEXSY expression system; for specific mutation inserted see Table 2 | |
| Recombinant DNA reagent | pLEXSY_I-ble3_TcPKAR1 (plasmid) | This paper | Transfected in LEXSY expression system | |
| Recombinant DNA reagent | pLEXSY_I-ble3_LdPKAR1 (plasmid) | This paper | Transfected in LEXSY expression system | |
| Recombinant DNA reagent | pLEXY_I-neo3_TbPKAC (plasmid) | 10.1038/s41467-019-09338-z | Transfected in LEXSY expression system | |
| Recombinant DNA reagent | pLEXY_I-neo3_TcPKAC2 (plasmid) | This paper | Transfected in LEXSY expression system | |
| Recombinant DNA reagent | pLEXY_I-neo3_LdPKAC1 (plasmid) | This paper | Transfected in LEXSY expression system | |
| Recombinant DNA reagent | pETDuet-1 DNA-Novagen (vector) | Sigma-Aldrich Novagen | SKU 71146 | |
| Recombinant DNA reagent | pET_SUMO Expression system | ThermoFisher Scientific | K30001 | |
| Recombinant DNA reagent | pETDuet-1_TbPKAR(199-499) | 10.1038/s41467-019-09338-z | Recombinant expression of TbPKAR(199-499) in E. coli | |
| Recombinant DNA reagent | pETDuet-1_TbPKAR(199-499)_mutant 6 | This paper | Recombinant expression of TbPKAR(199-499) mutant 6 in E. coli | |
| Recombinant DNA reagent | pETDuet-1_TbPKAR(199-499)_mutant 7 | This paper | Recombinant expression of TbPKAR(199-499) in E. coli | |
| Recombinant DNA reagent | pETDuet-1_TbPKAR(199-499)_mutant 8 | This paper | Recombinant expression of TbPKAR(199-499) in E. coli | |
| Recombinant DNA reagent | pETDuet-1_TcPKAR1(200–503) | 10.1038/s41467-019-09338-z | Recombinant expression of TcPKAR(200–5003) in E. coli | |
| Recombinant DNA reagent | pETDuet-1_HsPKAR1α | PMID:8393867 | Recombinant expression of HsPKAR1α in E. coli | |
| Recombinant DNA reagent | pET-11_Sumo3_LdPKAR1(200–502) | This paper | Recombinant expression of LdPKAR1(200–502) in E. coli | |
| Peptide, recombinant protein | TEV Protease | NEB | Cat# 8112 S | Cleavage of HIS-Tag in recombinant protein |
| Peptide, recombinant protein | Sumo Protease | Sigma-Aldrich | SKUSAE0067-2500UN | Cleavage of SUMO Tag in recombinant protein |
| Commercial assay or kit | Hi Yield Plasmid Mini DNA Isolationkit | Süd-Laborbedarf GmBH, Germany | Art-Nr.: 30 HYPD100 | |
| Chemical compound, drug | Inosine | Sigma Aldrich | Cat# 200-390-4 | |
| Chemical compound, drug | Guanosine | Sigma Aldrich | Cat# 204-227-8 | |
| Chemical compound, drug | Adenosine | Sigma Aldrich | Cat# 93029 | |
| Chemical compound, drug | cAMP | Biolog Life Science Institute | Cat# A 001 H | |
| Chemical compound, drug | cGMP | Biolog Life Science Institute | Cat# G 001 | |
| Chemical compound, drug | cIMP | Biolog Life Science Institute | Cat# I 001 | |
| Chemical compound, drug | AMP | Sigma Aldrich | Cat# 54612 | |
| Chemical compound, drug | GMP | Santa Cruz Biotechnology | Cat# 226-914-1 | |
| Chemical compound, drug | IMP | Sigma Aldrich | Cat# 57510 | |
| Chemical compound, drug | 2'-deoxyadenosine | Sigma Aldrich | Cat# D7400-250MG | |
| Chemical compound, drug | 3'-deoxyadenosine | Sigma Aldrich | Cat# C3394 | |
| Chemical compound, drug | 5'-deoxyadenosine | Sigma Aldrich | D1771 | |
| Chemical compound, drug | Nebularine | Santa Cruz Biotechnology | Cat# sc-208087 | |
| Chemical compound, drug | Allopurinol riboside | Santa Cruz Biotechnology | Cat# sc-217610 | |
| Chemical compound, drug | Xanthosine | Sigma Aldrich | Cat# X0750 | |
| Chemical compound, drug | Uridin | Sigma Aldrich | Cat# U3750 | |
| Chemical compound, drug | Cytidin | Sigma Aldrich | Cat# C122106 | |
| Chemical compound, drug | 13C5-labeled Inosin | Omicron Biochemicals Inc | 10.1038/s41596-018-0094-6 | |
| Chemical compound, drug | 13C5-labeled Guanosin | Omicron Biochemicals Inc | 10.1038/s41596-018-0094-6 | |
| Chemical compound, drug | 13C5-labeled Adenosin | Omicron Biochemicals Inc | 10.1038/s41596-018-0094-6 | |
| Software, algorithm | GraphPad Prism 7.0 | GraphPad | Statistical testing | |
| Software, algorithm | Phenix | 10.1107/S0907444909052925 | Model refinement | |
| Software, algorithm | Coot | 10.1107/S0907444909052925 | Manual model building of protein structure | |
| Software, algorithm | Glide (Maestro) | Schroedinger LLC, New York, NY, 2023 | Molecular docking | |
| Software, algorithm | The PyMOL Molecular Graphics System (Version 2.0) | Schrödinger, LLC | Illustration of structural figures |
Additional files
-
Supplementary file 1
Binding parameters from ITC measurements.
- https://cdn.elifesciences.org/articles/91040/elife-91040-supp1-v1.docx
-
Supplementary file 2
Data collection and refinement statistics for the crystal structures.
- https://cdn.elifesciences.org/articles/91040/elife-91040-supp2-v1.docx
-
Supplementary file 3
Results of searching the mass spectrometry data set (Figure 6—figure supplement 1) for nucleosides matches in the MODOMICS (https://iimcb.genesilico.pl/modomics/) RNA modifications database.
Red cross: peak/mass not detected. Red: peak Rf/mass: detected but not significant over background. Green mass: peak Rf/mass: detected but not confirmed.
- https://cdn.elifesciences.org/articles/91040/elife-91040-supp3-v1.xlsx
-
Supplementary file 4
List of primers used in this study.
- https://cdn.elifesciences.org/articles/91040/elife-91040-supp4-v1.docx
-
MDAR checklist
- https://cdn.elifesciences.org/articles/91040/elife-91040-mdarchecklist1-v1.pdf
Download links
A two-part list of links to download the article, or parts of the article, in various formats.
Downloads (link to download the article as PDF)
Open citations (links to open the citations from this article in various online reference manager services)
Cite this article (links to download the citations from this article in formats compatible with various reference manager tools)
Purine nucleosides replace cAMP in allosteric regulation of PKA in trypanosomatid pathogens
eLife 12:RP91040.
https://doi.org/10.7554/eLife.91040.3


