Caenorhabditis elegans SEL-5/AAK1 regulates cell migration and cell outgrowth independently of its kinase activity
- Department of Cell Biology, Faculty of Science, Charles University, Czech Republic
- Institute of Molecular Genetics, Czech Academy of Sciences, Czech Republic
Figures
Figure 1 with 2 supplements
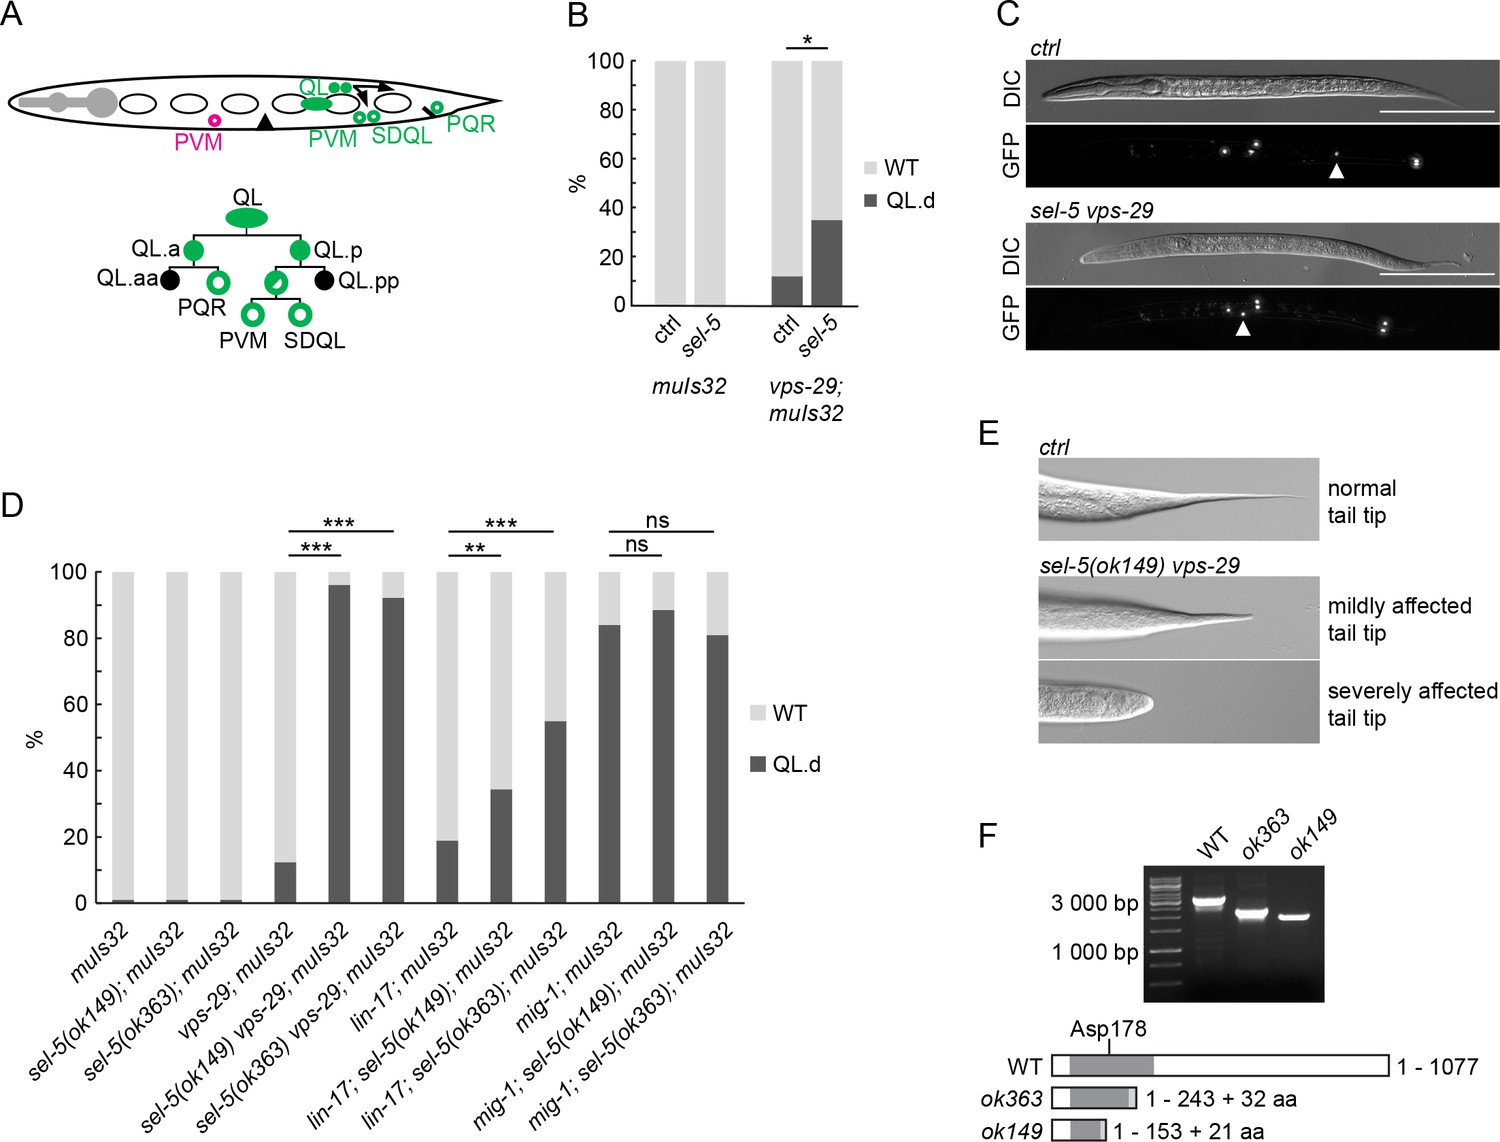
Loss of sel-5 potentiates QL migration defect in retromer and Wnt pathway mutants.
(A) QL neuroblast lineage and a cartoon indicating the position of terminally differentiated neurons (depicted with empty circles). (A has been adapted from Figure 1 of Rella et al., 2016.) The aberrant position of PVM neuron, as observed in QL.d migration defect, is highlighted in magenta. (B) RNAi against sel-5 increases the penetrance of vps-29 QL.d migration defect compared to the control (L4440) RNAi. No defect is observed in wild type background. (C) PVM position in L2 larvae of control (transgene only) and sel-5 vps-29 double mutant animals. PVM position indicated with white arrowhead, neurons visualized by expression of Pmec-7::gfp transgene muIs32, scale bar represents 100 μm. (D) Mutation in sel-5 results in increased penetrance of QL.d migration defect of vps-29 and lin-17, but not mig-1 mutants. (E) Examples of mild and severe alteration of tail tip morphology in sel-5 vps-29 double mutants. (F) Shortened transcripts are produced from the sel-5 locus in both ok363 and ok149 alleles. Potential protein products resulting from these transcripts are depicted, showing the impact of the truncation on the kinase domain (dark grey box). Extra amino acids resulting from a frameshift and thus not present in the wild type protein are also depicted (light grey box). The position of the active site is indicated. For (B) and (D), results are shown as % of WT and QL.d animals. Fisher’s exact test was performed to assess the difference between the samples. Bonferroni correction for multiple testing was applied. For (B), a representative RNAi experiment is shown, n > 55 per condition, *p-value<0.02, additional experiments provided in Figure 1—figure supplement 1. For (D), data combined from three independent experiments are shown, n > 150 animals in total for each strain, **p-value<0.002, ***p-value<0.0002, ns, not significant.
-
Figure 1—source data 1
Source gel for Figure 1.
- https://cdn.elifesciences.org/articles/91054/elife-91054-fig1-data1-v2.zip
Figure 1—figure supplement 1

Additional examples of RNAi against sel-5 in wild type and vps-29 background.
Results are shown as % of WT and QL.d animals. Fisher’s exact test was performed to assess the difference between the samples. Bonferroni correction for multiple testing was applied, n > 55 per condition, ***p-value<0.0002, ns, not significant.
Figure 1—figure supplement 2
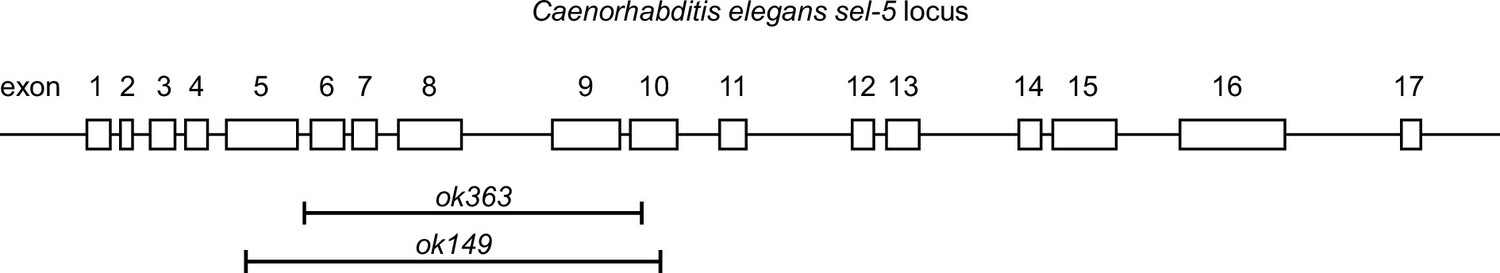
Schematic structure of the sel-5 genomic locus.
The exons of sel-5 are represented by white rectangles and are numbered. Deletions found in the ok149 and ok363 alleles are shown.
Figure 2 with 1 supplement
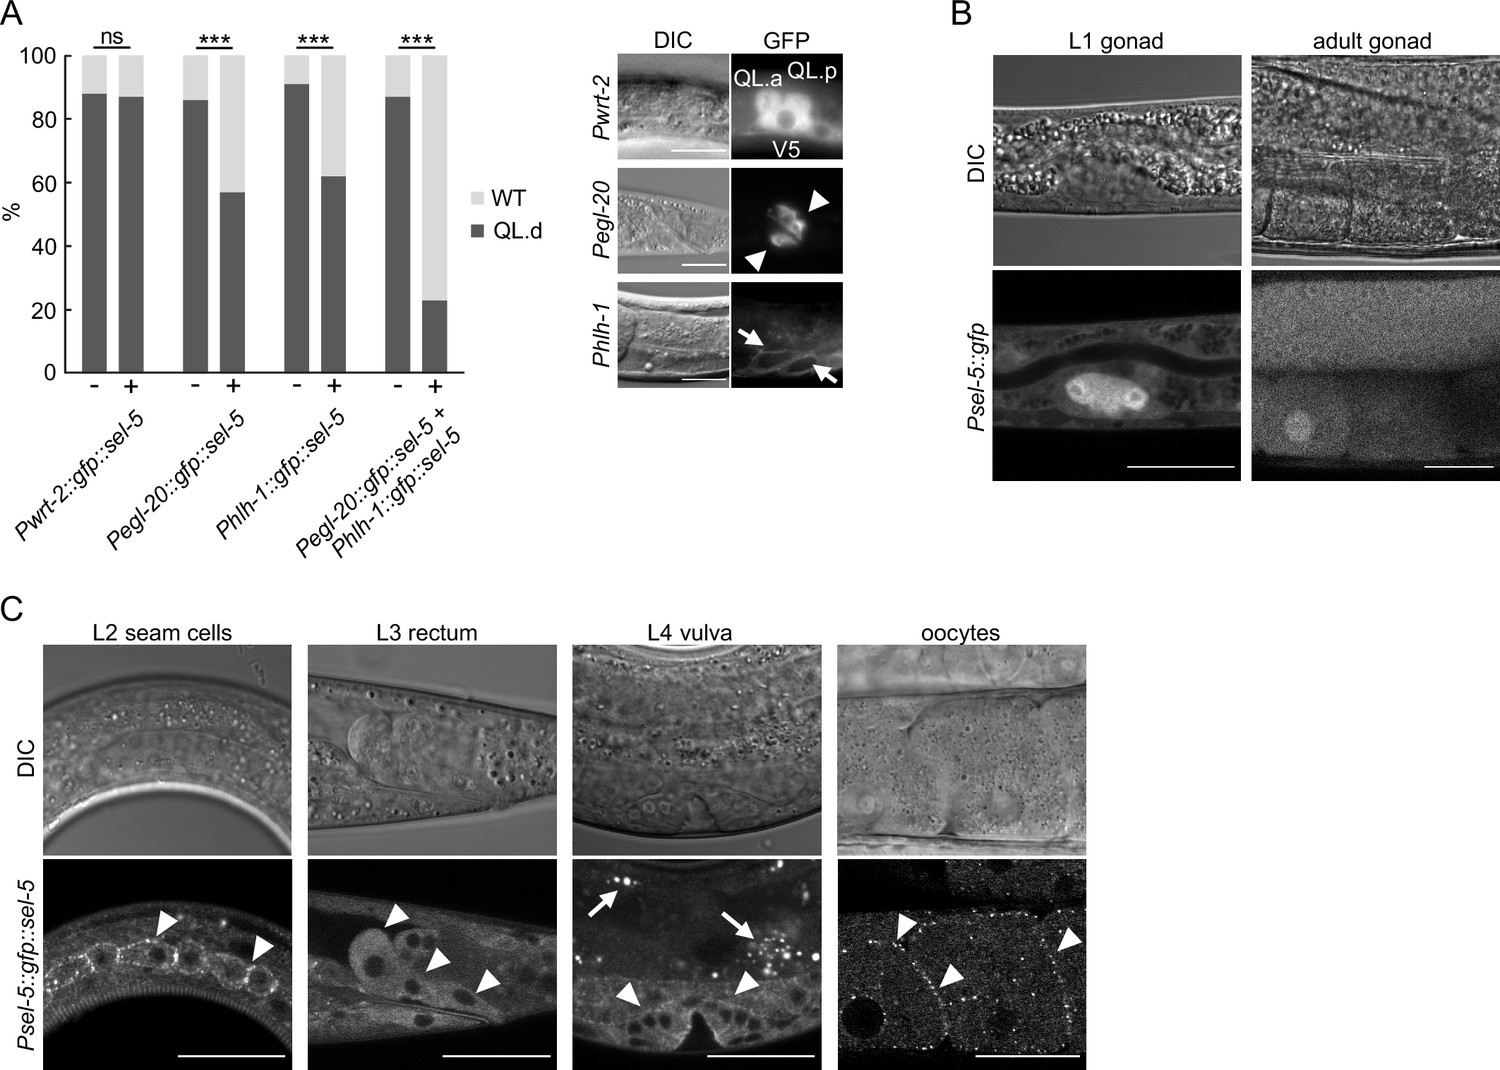
SEL-5 is expressed in multiple tissues and is required cell non-autonomously for QL.d migration.
(A) Transgenic rescue of the QL.d migration defect. sel-5 was expressed under the control of various promoters from an extrachromosomal array in sel-5 vps-29; muIs32 background and the effect of such expression on QL.d migration was quantified. Comparison was made between animals carrying the transgene and their siblings which have lost the transgenic array. The expression of each transgene in the expected tissue is shown on the right. Results are shown as % of WT and QL.d animals, data are combined from three independent experiments, n > 100 animals in total for each condition. Fisher’s exact test was performed to assess the difference between the samples. Bonferroni correction for multiple testing was applied, ***p-value<0.0001, ns, not significant. Results from additional independent transgenic strains are provided in Figure 2—figure supplement 1. (B) GFP expression driven by an endogenous sel-5 promoter in the gonad of L1 and adult animals. (C) Expression of GFP::SEL-5 fusion protein driven by endogenous sel-5 promoter in various larval and adult tissues. Localized GFP::SEL-5 expression is indicated by white arrowheads, white arrows point to autofluorescent signal from gut granules. The scale bar represents 20 μm in (A–C).
Figure 2—figure supplement 1
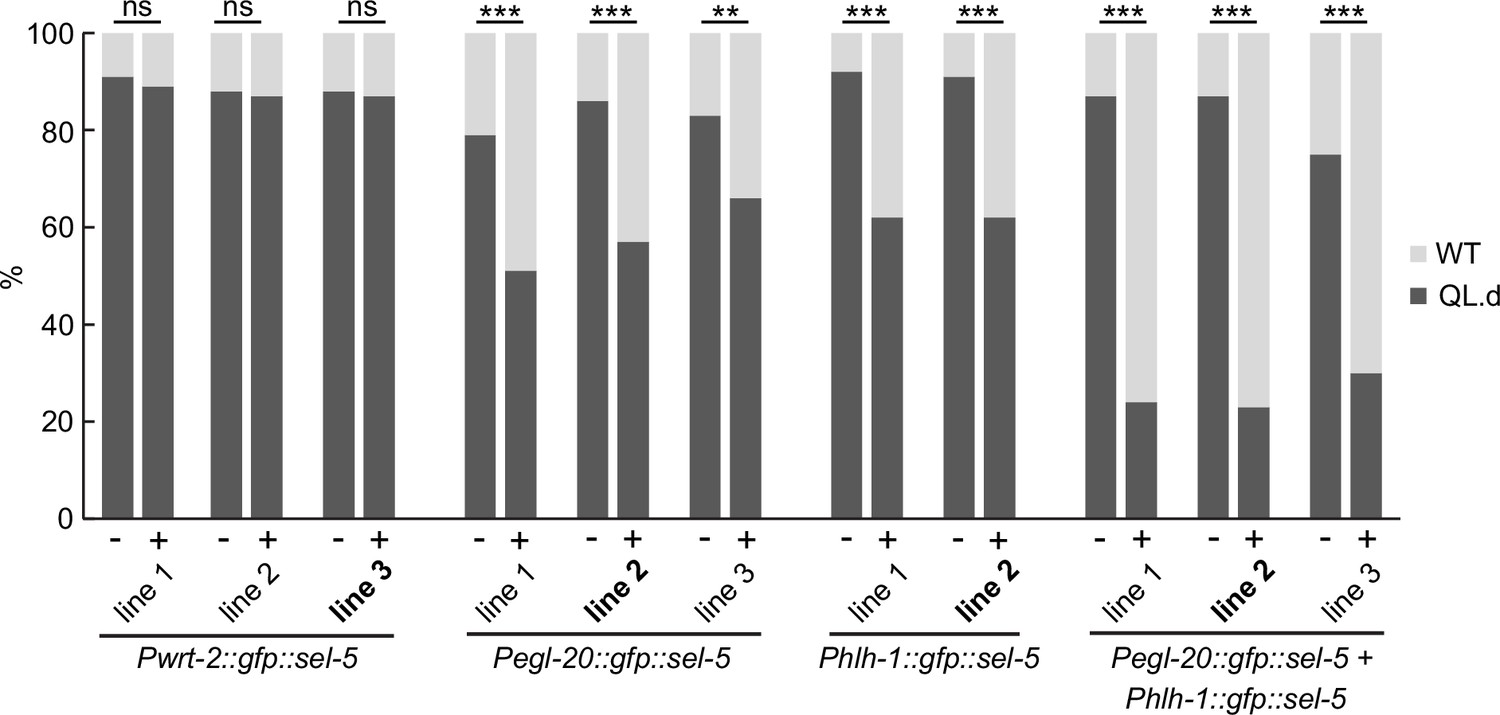
Transgenic rescue of the QL.d migration defect.
Several independent transgenic strains for each rescue construct were tested in sel-5 vps-29; muIs32 background and the effect of such expression on QL.d migration was quantified. Comparison was made between animals carrying the transgene and their siblings which have lost the transgenic array. Results are shown as % of WT and QL.d animals, data are combined from three independent experiments, n > 100 animals in total for each condition. Fisher’s exact test was performed to assess the difference between the samples. Bonferroni correction for multiple testing was applied, **p-value<0.001, ***p-value<0.0001, ns, not significant. The lines used in Figure 2A are labelled in bold.
Figure 3 with 1 supplement
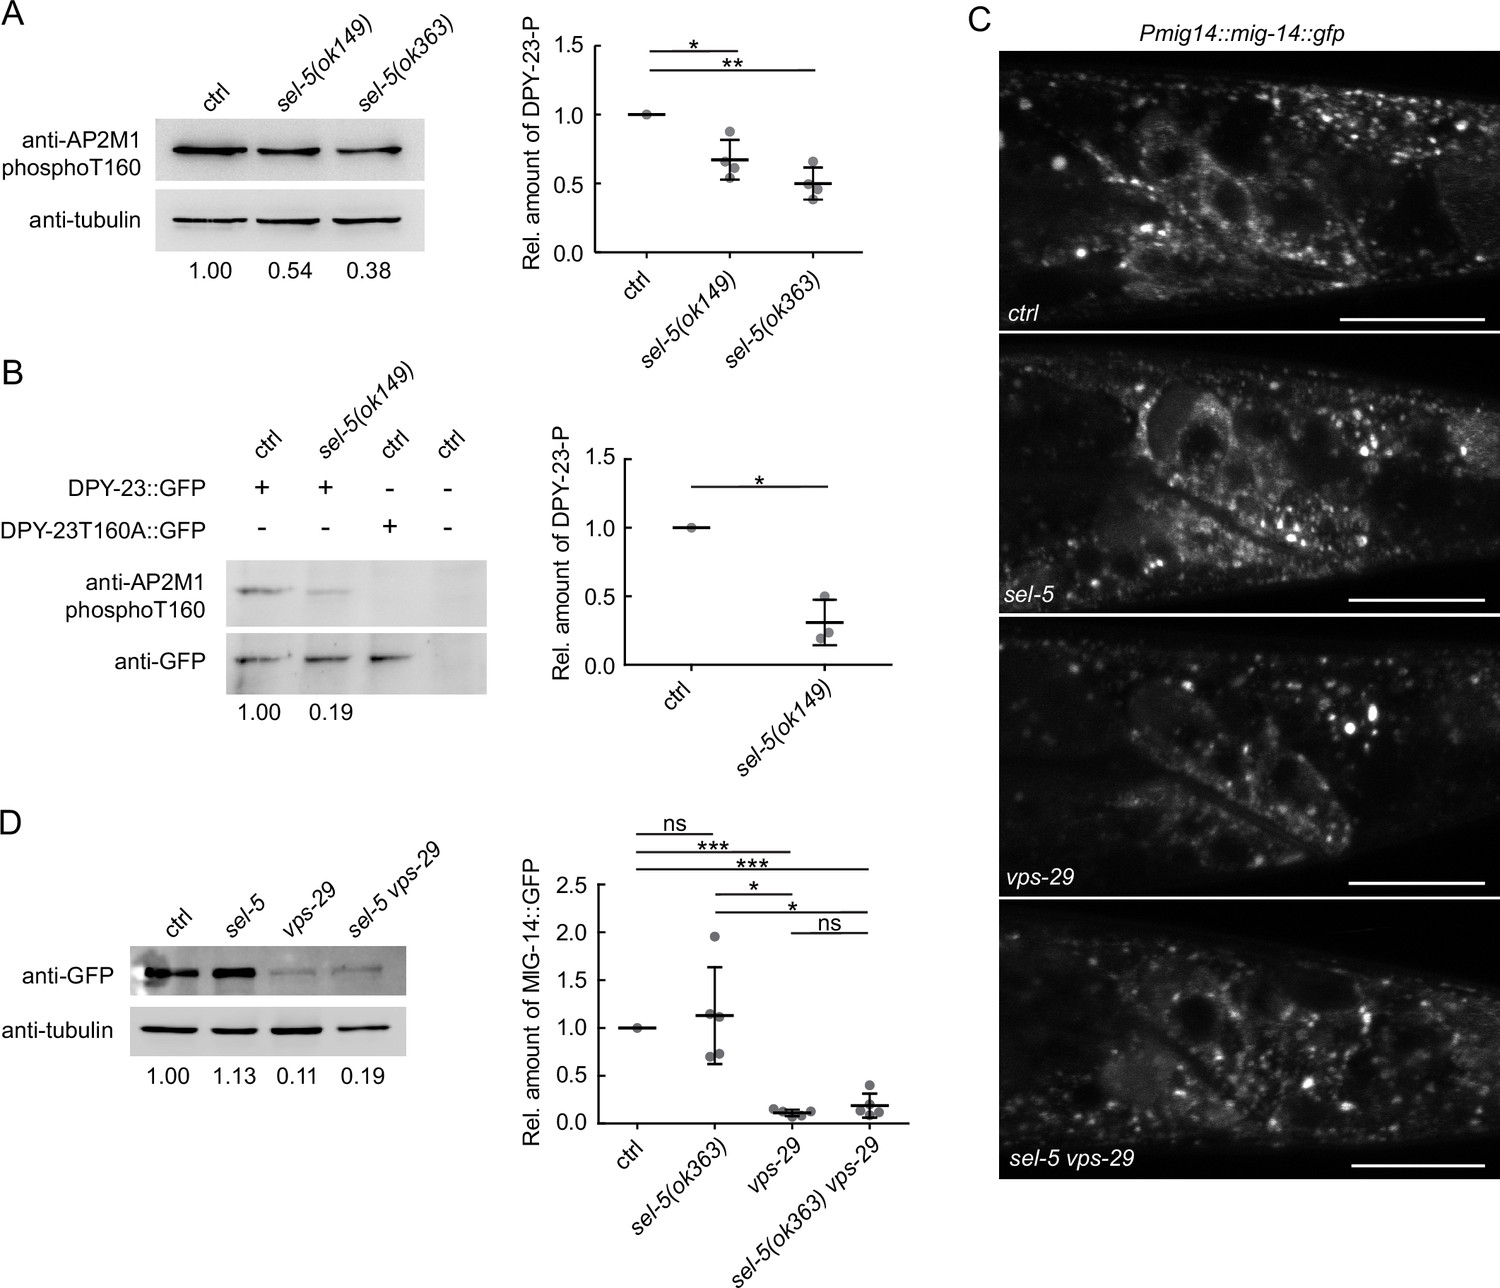
SEL-5 alters the phosphorylation status of DPY-23 but does not affect MIG-14 levels.
(A) The level of DPY-23 phosphorylation at position T160 is reduced in sel-5 mutant animals. Phosphorylation was detected by western blot analysis in lysates from a population of L4/young adults of indicated strains using phospho-specific antibody against human AP2M1. Band intensities were normalized to an alpha tubulin loading control and compared to the control sample (sample/control ratio indicated below each lane). A representative Western blot example is shown on the left, relative quantification of four independent experiments is shown on the right. (B) Level of DPY-23::GFP phosphorylation is reduced in sel-5 mutants. Phosphorylation at T160 of GFP-tagged DPY-23 was detected by western blot analysis in lysates from a population of L4/young adults using phospho-specific antibody against human AP2M1. Strains expressing either no GFP fusion protein or a GFP-tagged DPY-23T160A mutant protein were included as controls. Band intensities were normalized to a GFP signal intensity and compared to the control sample (DPY-23::GFP in wild type background), sample/control ratio is indicated below each lane. A representative western blot example is shown on the left, relative quantification of three independent experiments is shown on the right. (C) L2/L3 animals expressing MIG-14::GFP from the huSi2 transgene were imaged using a confocal microscope. The posterior part of the body with Wnt-expressing cells is shown. Images are maximum projections of four consecutive z-sections taken at 0.3 μm interval. Anterior to the left, dorsal up, scale bar represents 20 μm. (D) Western blot analysis of MIG-14::GFP levels expressed from a huSi2 transgene in various mutant backgrounds. MIG-14::GFP was detected in lysates from synchronized populations of L1 larvae of the indicated strains. Band intensities were normalized to an alpha tubulin loading control and compared to the control sample (sample/control ratio indicated below each lane). A representative western blot example is shown on the left, relative quantification of five independent experiments is shown on the right. In (A, B, D), error bars represent mean ± s.d., statistical significance was assessed by unpaired two-tailed Student’s t-test for samples with unequal variance, *p-value<0.05, **p-value<0.01, ***p-value<0.001, ns, not significant. Source data for (A, B, D) provided in Figure 3—source data 1.
-
Figure 3—source data 1
Source blots for Figure 3.
- https://cdn.elifesciences.org/articles/91054/elife-91054-fig3-data1-v2.zip
Figure 3—figure supplement 1
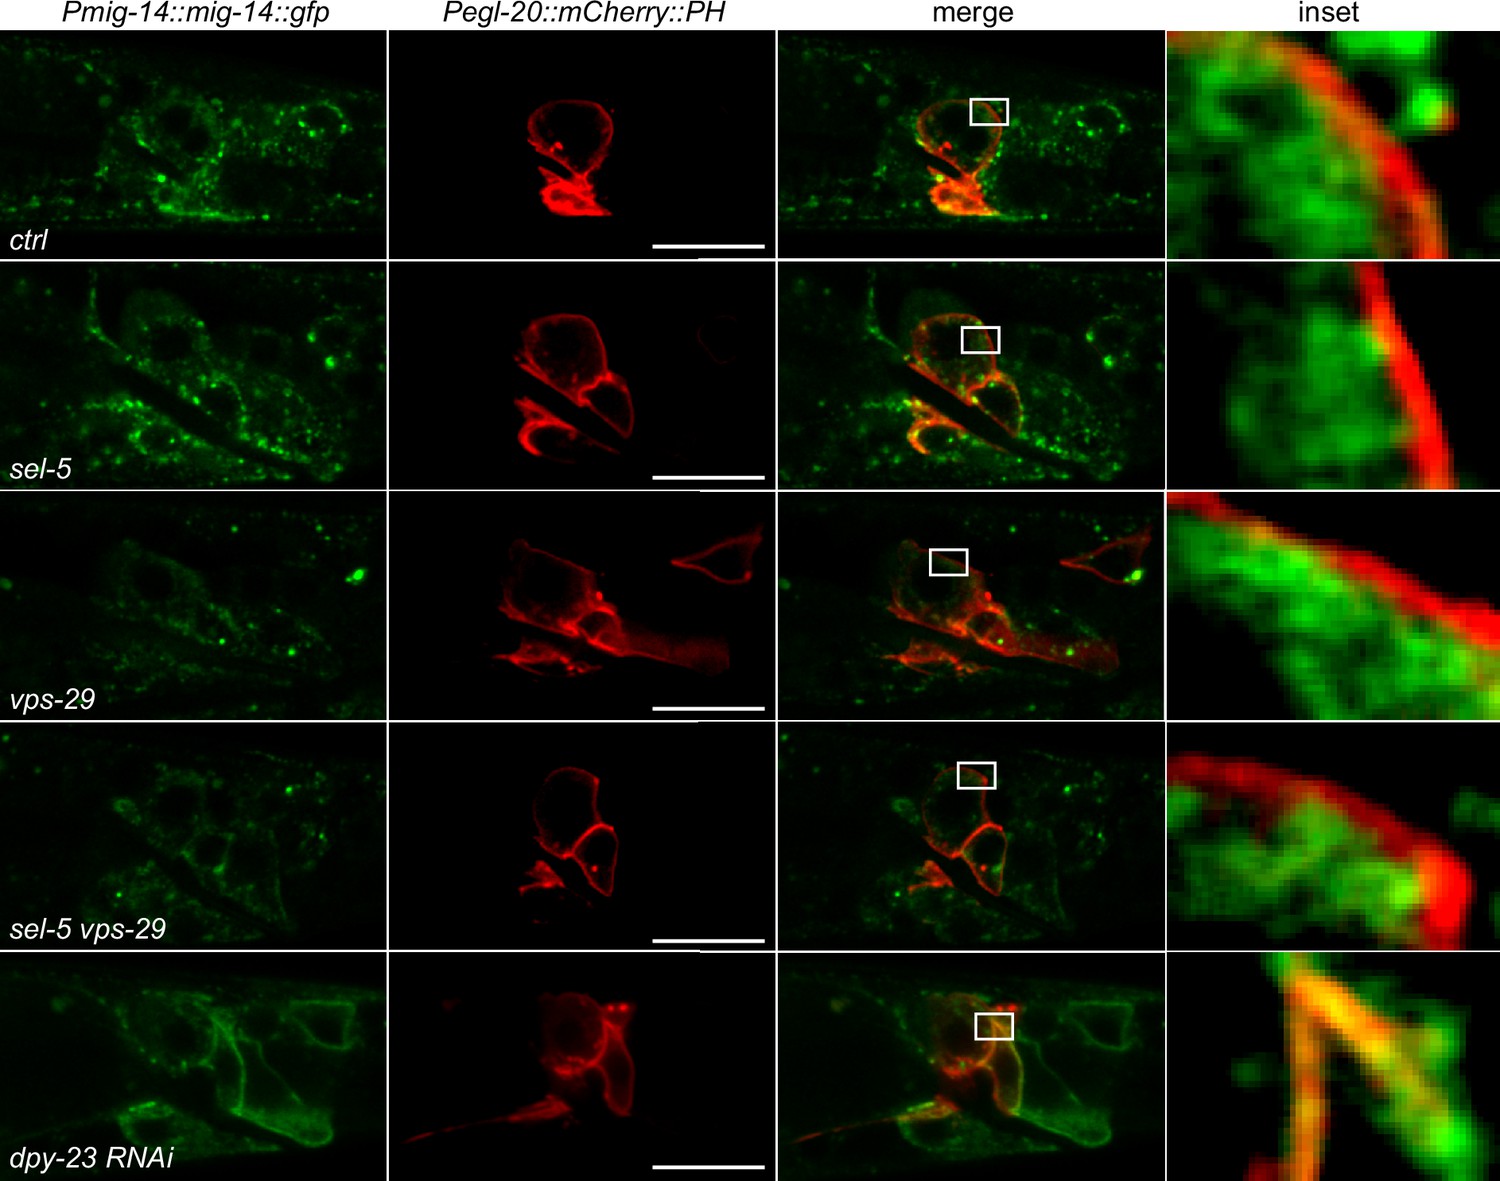
MIG-14 does not re-localize to the plasma membrane in sel-5 or sel-5 vps-29 mutants.
L2/L3 animals expressing MIG-14::GFP from the huSi2 transgene together with mCherry::PH driven by egl-20 promoter were imaged using confocal microscope. The posterior part of the body with Wnt-expressing cells is shown. Images are single z-sections. Anterior to the left, dorsal up, scale bar represents 20 μm.
Figure 4
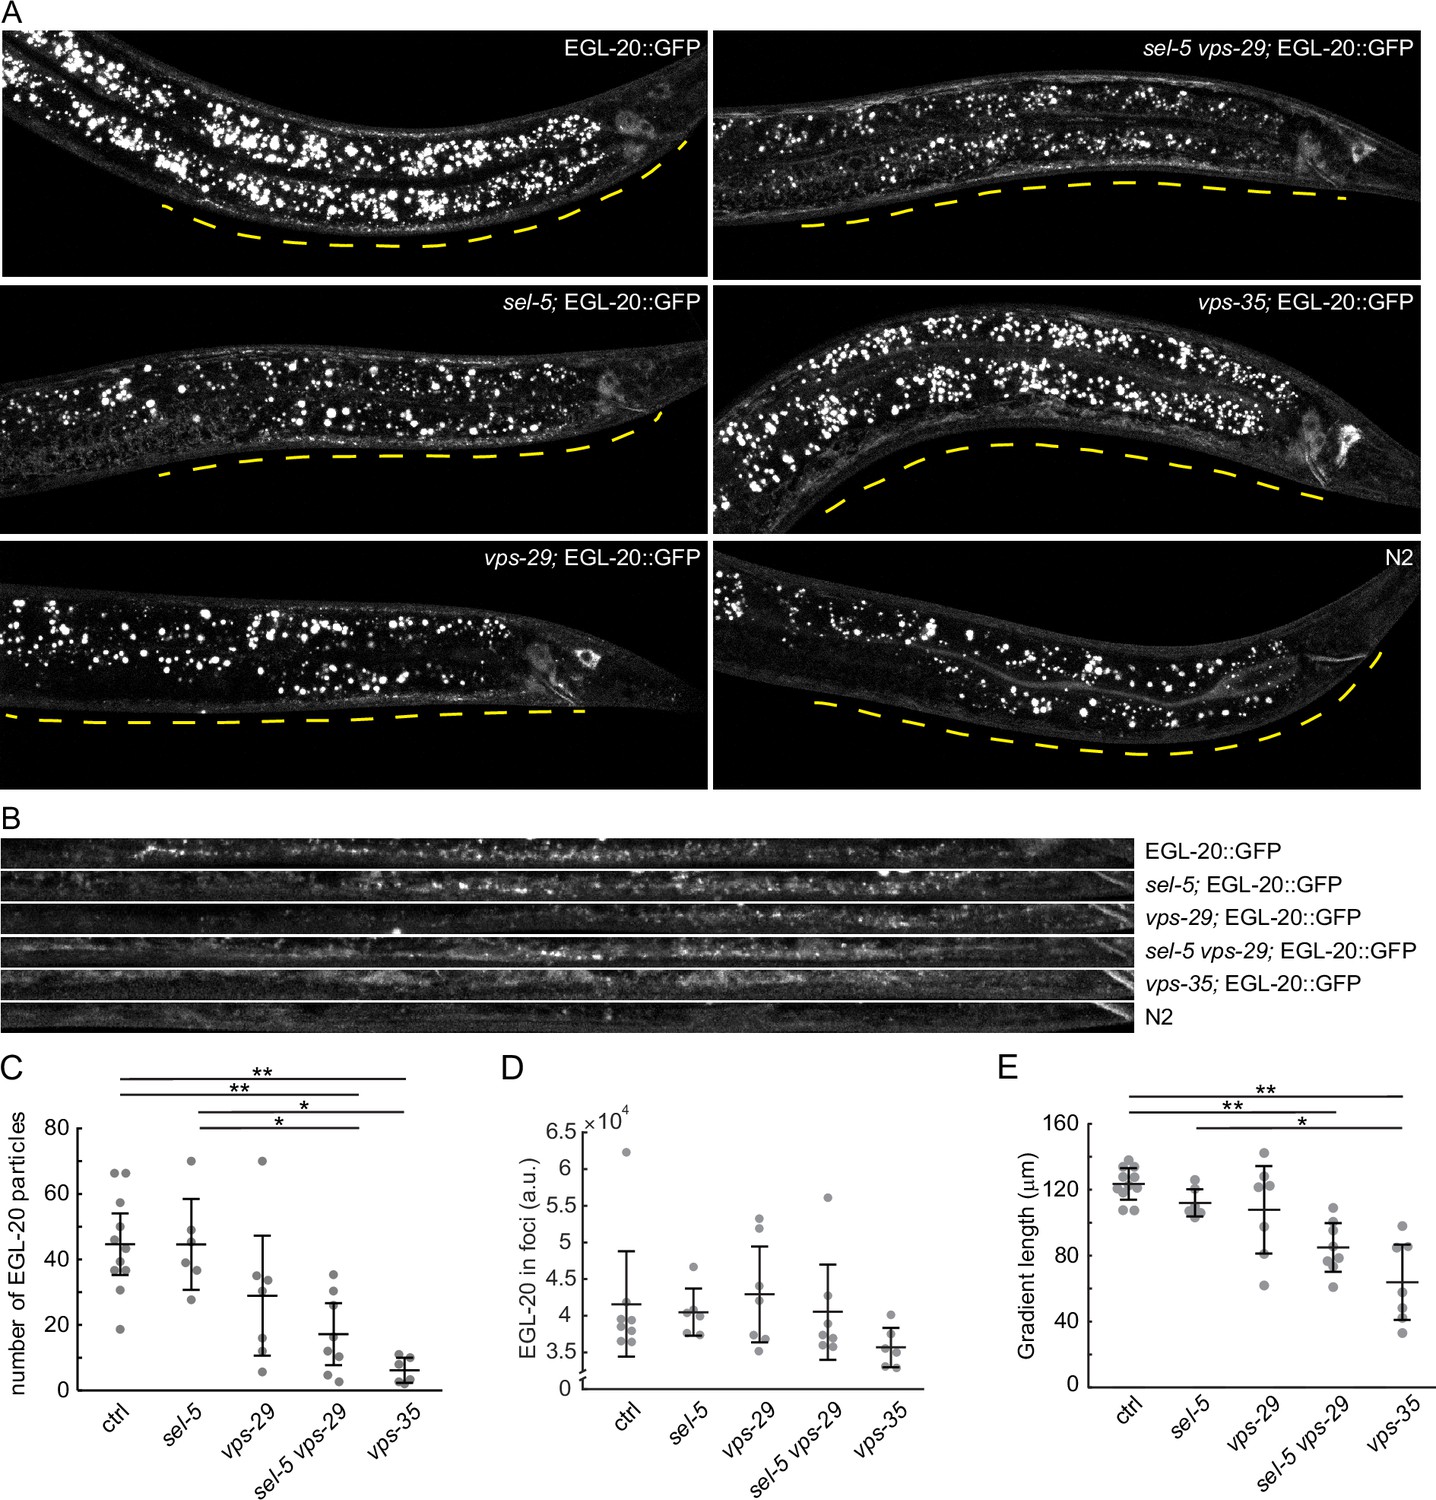
EGL-20 gradient formation.
(A) Endogenously tagged EGL-20::GFP was visualized in various backgrounds. Images were acquired with spinning disc microscopy using L2/L3 animals and represent maximum projections of seven consecutive z-sections captured at 1 μm interval. A distance of 150 μm from the rectum of each animal is indicated by a yellow line. sel-5(ok149) allele was used in sel-5 single and double mutants. (B) A curved line of 150 μm length (measured from the rectum) and 3.9 μm width was fitted with the ventral side of each animal presented in (A) and the selected region was straightened using the ‘Straighten’ function in Fiji for easier comparison. (C) Number of EGL-20 particles in various mutant backgrounds. Identical selection as in (B) was applied to all samples and the number of clearly visible puncta was manually counted in blinded images. Counting was repeated three times for each sample and the number of puncta was averaged and plotted as a single data point. (D) Mean signal intensity in EGL-20 particles was measured in the same selections as in (C). (E) The length of the EGL-20 gradient was assessed in the same images as in (C). The distance from the rectum to the most distant clearly recognizable EGL-20 particle was measured in blinded images. Measurement was repeated three times; the values were averaged and plotted as a single data point. For (C, D, E), Wilcoxon rank sum test was performed to assess statistical significance. Bonferroni correction for multiple testing was applied. *p-value<0.005, **p-value<0.001, error bars represent 95% confidence interval, only statistically significant differences shown in (C) and (E), and no statistically significant differences revealed in (D).
Figure 5 with 2 supplements
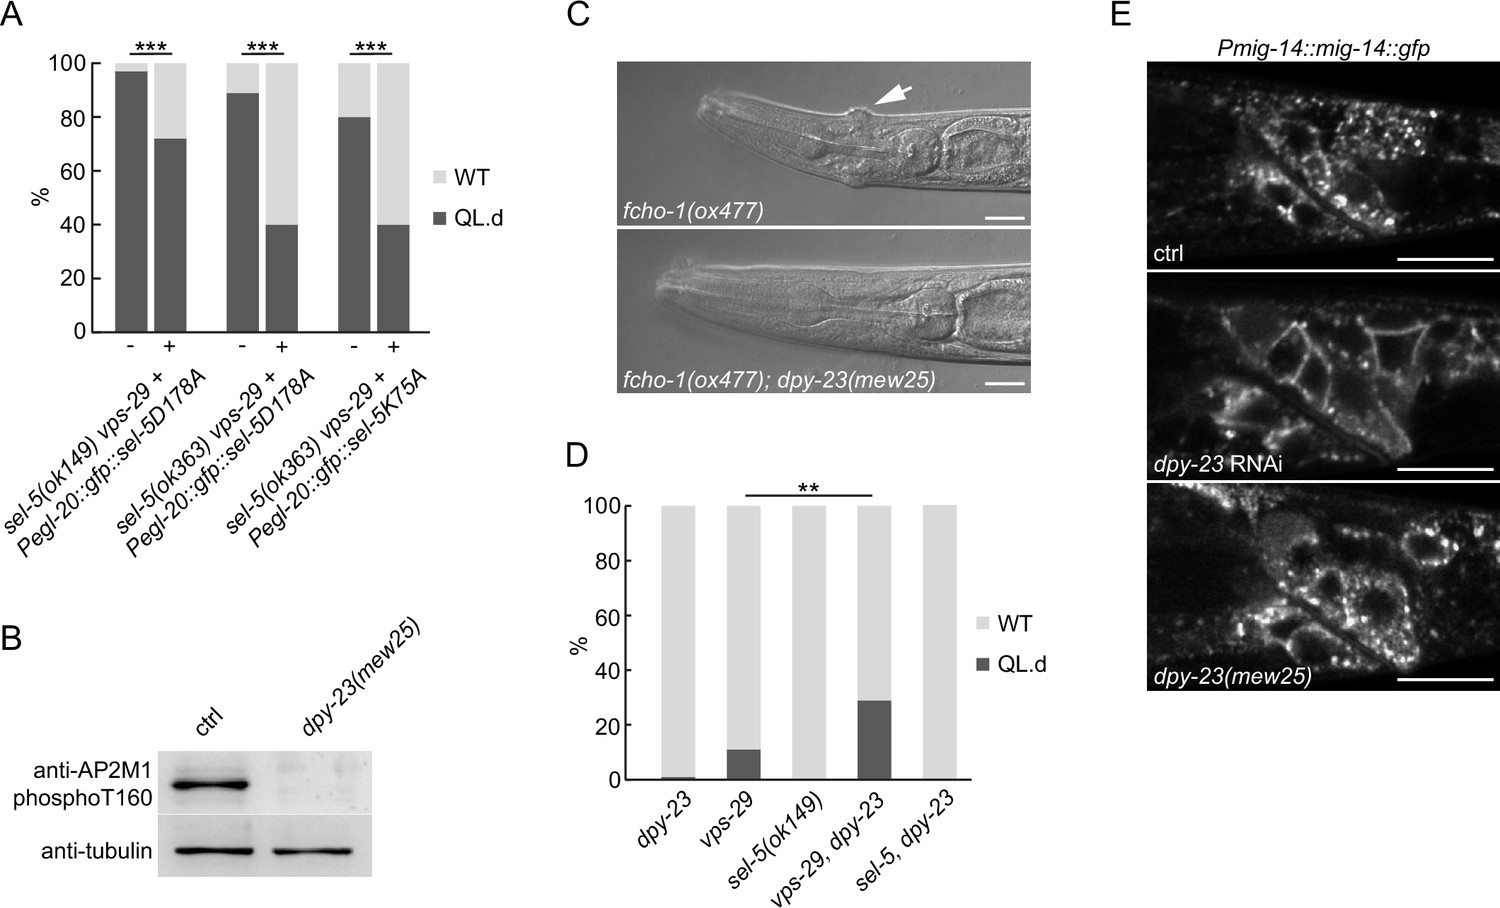
SEL-5 kinase activity and DPY-23 phosphorylation are not required for QL.d migration.
(A) Transgenic rescue of the QL.d migration defect with kinase-inactive SEL-5. D178A or K75A SEL-5 mutant protein was expressed from egl-20 promoter in sel-5 vps-29; muIs32 mutant background from an extrachromosomal array and the QL.d migration defect was quantified in animals carrying the transgene and their siblings which have lost the transgenic array. Results are shown as % of WT and QL.d animals, data are combined from three independent experiments, n > 100 animals in total for each condition. Fisher’s exact test was performed to assess the difference between the samples. Bonferroni correction for multiple testing was applied, ***p-value<0.0001. Results from additional independent transgenic strains are provided in Figure 5—figure supplement 2. (B) DPY-23 phosphorylation at position T160 is absent in dpy-23(mew25) mutant animals. Phosphorylation was detected by western blot analysis in lysates from a population of L4/young adults of indicated strains using phospho-specific antibody against human AP2M1. Band intensities were normalized to an alpha tubulin loading control. (C) dpy-23(mew25) rescues the ‘jowls’ phenotype (white arrow) of fcho-1(ox477) animals. Heads of adult animals are shown, anterior to the left, the scale bar represents 10 μm. (D) The absence of DPY-23 T160 phosphorylation does not result in QL.d migration defect. The presence of dpy-23(mew25) allele carrying T160A substitution either alone or in combination with sel-5 does not significantly contribute to the QL.d migration defect. Results are shown as % of WT and QL.d animals, data combined from at least three independent experiments are shown, n > 180 animals in total for each strain. Fisher’s exact test was performed to assess the difference between the samples, **p-value<0.01. (E) MIG-14::GFP does not relocalize to the plasma membrane in dpy-23(mew25) animals. L3 animals expressing MIG-14::GFP from the huSi2 transgene were imaged using a confocal microscope. The posterior part of the body with Wnt-expressing cells is shown. Images are maximum projections of five consecutive z-sections taken at 0.3 μm interval. Anterior to the left, dorsal up, the scale bar represents 20 μm. Source data for (B) provided in Figure 5—source data 1.
-
Figure 5—source data 1
Source blots for Figure 5.
- https://cdn.elifesciences.org/articles/91054/elife-91054-fig5-data1-v2.zip
Figure 5—figure supplement 1
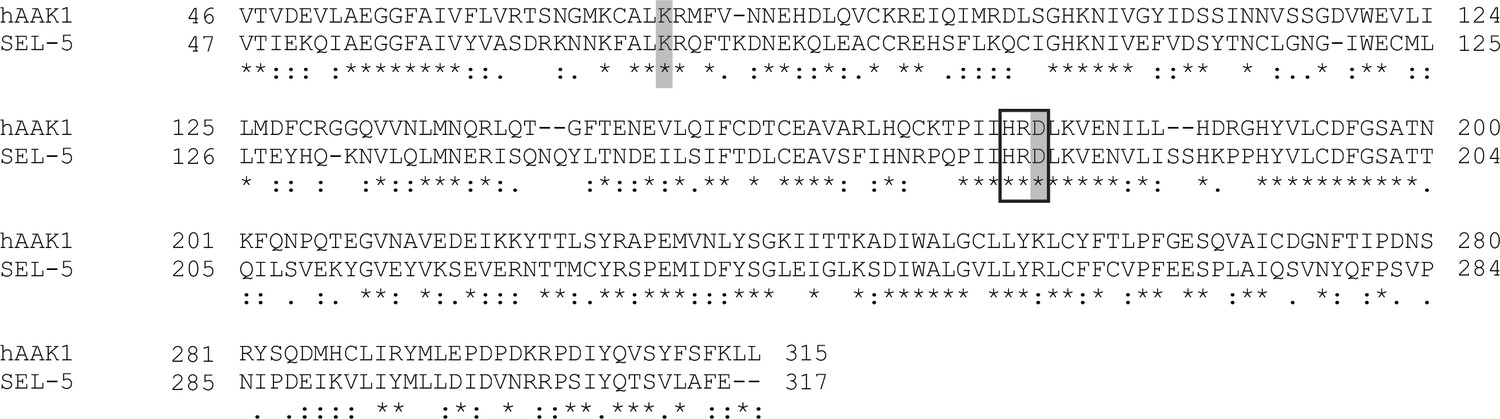
Sequence alignment of the kinase domain of SEL-5 and human AAK1.
Residues mutated in C. elegans rescue constructs are highlighted in grey. The black rectangle marks the conserved HRD motif.
Figure 5—figure supplement 2
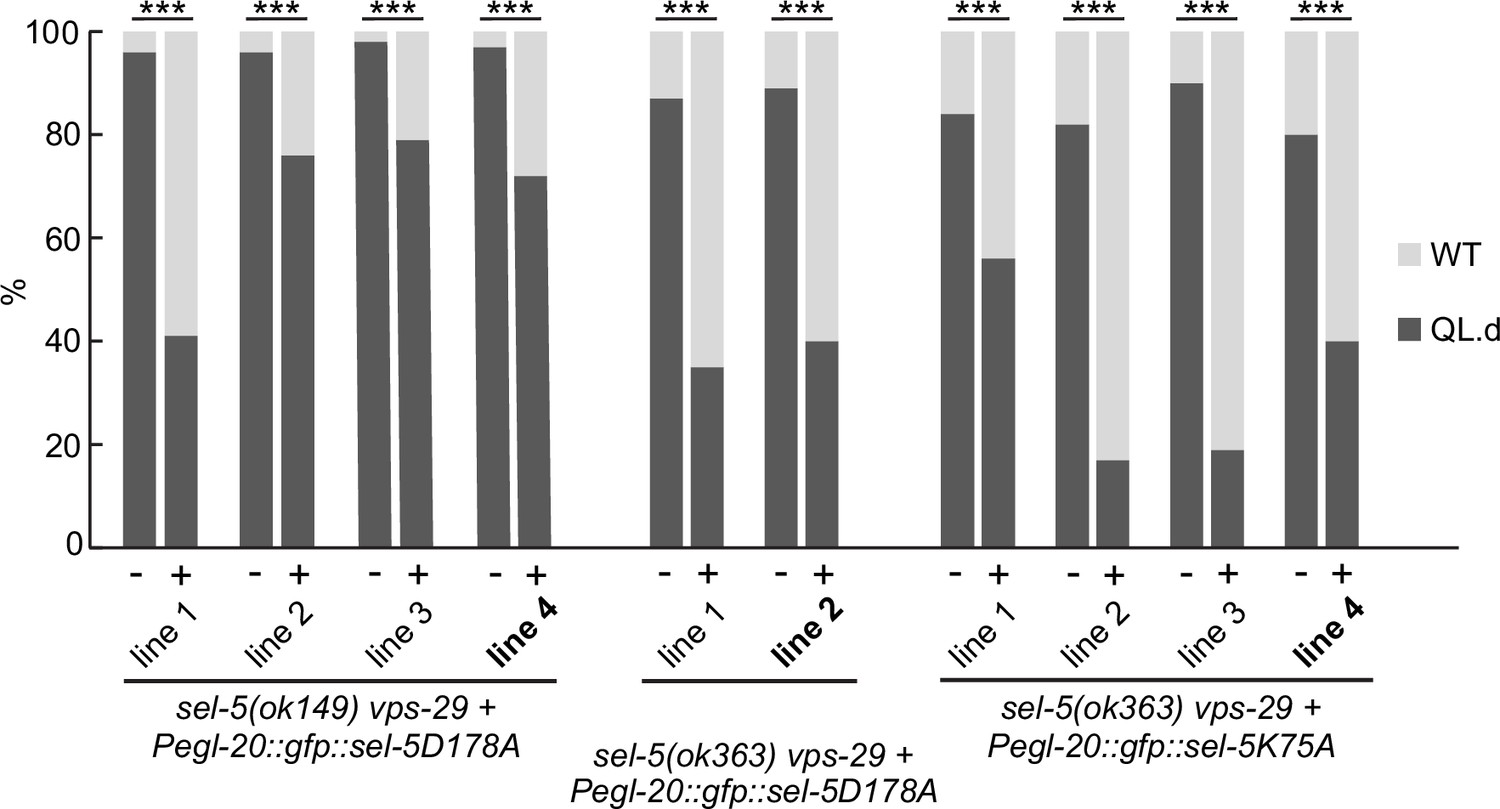
Transgenic rescue of QL.d migration defect by kinase-inactive SEL-5.
Additional independent transgenic strains for each rescue construct were tested in sel-5 vps-29; muIs32 background and the effect of such expression on QL.d migration was quantified. Comparison was made between animals carrying the transgene and their siblings which have lost the transgenic array. Results are shown as % of WT and QL.d animals, data are combined from three independent experiments, n > 170 animals in total for each condition. Fisher’s exact test was performed to assess the difference between the samples. Bonferroni correction for multiple testing was applied, ***p-value<0.0001. The lines used in Figure 5A are labelled in bold.
Figure 6
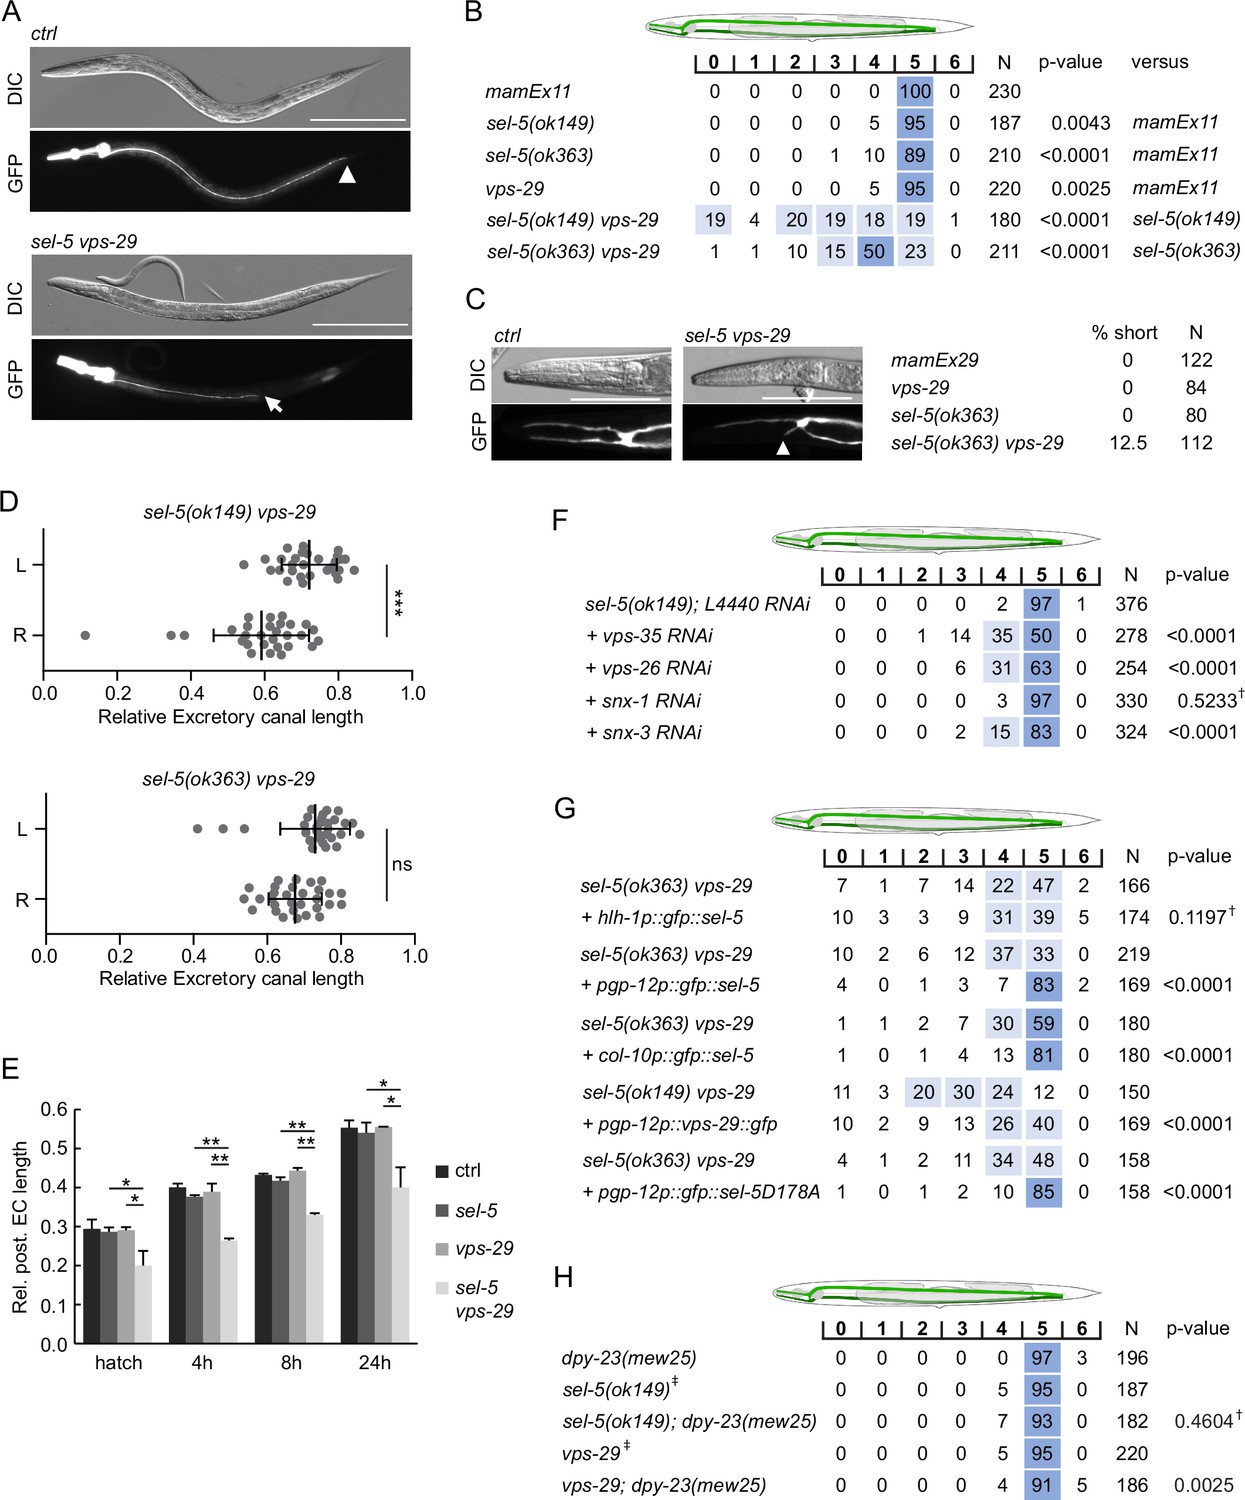
sel-5 cooperates with the retromer complex to regulate the length of excretory cell canals.
(A) Posterior canals of the excretory cell are significantly shortened in sel-5 vps-29 mutants. The excretory cell was visualized by Ppgp-12::gfp expression from a mamEx11 transgene. The scale bar represents 200 μm. (B) Quantification of posterior canal outgrowth defects. The outgrowth of the posterior canal of the excretory cell was quantified by dividing the region between the posterior bulb of the pharynx to the tip of the tail into seven segments. The percentage of canal arms terminating in each segment is indicated. Segment scoring 50% or higher was highlighted in dark blue, segment scoring 15–49% was highlighted in light blue for easier orientation. All strains contained the mamEx11 transgene to visualize the excretory cell. The statistical significance of differences between the strains was analysed using Fisher’s exact test for a 2 × 3 table. For the test, data from segments 0–4 were pooled into one category (‘shorter’) and data from segments 5 and 6 were used as the two other categories (‘normal’ and ‘longer’, respectively). The comparison was made either to the control strain or to the more severe single mutant in the case of double mutant strains. Bonferroni correction for multiple testing was applied. (C) Anterior canals of the excretory cell are shortened in sel-5 vps-29 double mutants. The excretory cell was visualized by Ppgp-12::gfp expression from a mamEx29 transgene. The scale bar represents 100 μm. (D) Posterior canals on the right side of the animals are more severely affected compared to their left counterparts. The length of the posterior canal on each side of the animal was measured and normalized to the length of the whole body of the animal. Paired Student’s t-test was used to assess the significance of the difference between the two sides, ***p-value<0.001, ns, not significant. (E) Posterior excretory canals are shorter already at the time of hatching in sel-5 vps-29 mutants. The dynamics of posterior canal outgrowth was assessed by measuring the canal length and normalizing it to the total body length at hatching and at three time points during early larval development. Results are presented as mean + s.d. of at least 30 canals for each condition. Unpaired two-tailed Student’s t-test was performed to assess the difference between the samples, *p-value<0.05, **p-value<0.01. (F) Loss of either vps-35, vps-26, or snx-3 retromer component expression induces posterior canal shortening in sel-5 mutants. Canal outgrowth was scored as in (B). (G) Both cell-autonomous and non-autonomous expression of sel-5 rescues excretory canal shortening in sel-5 vps-29 mutants. SEL-5 was expressed from an extrachromosomal array under the control of pgp-12, hlh-1 or col-10 promoters. Canal outgrowth was scored as in (B) and a comparison was made between animals carrying the array and their siblings which have lost the transgenic array. All strains contained also the mamEx29 extrachromosomal array to visualize the excretory canal. (H) T160 phosphorylation of DPY-23 is not required for posterior excretory canal outgrowth. Canal outgrowth was scored as in (B) in strains containing dpy-23(mew25) allele carrying T160A substitution. Comparison was made between the double mutants and either sel-5 or vps-29 single mutant. For (F–H) †differences not significant, ‡same data as in (B).
Figure 7
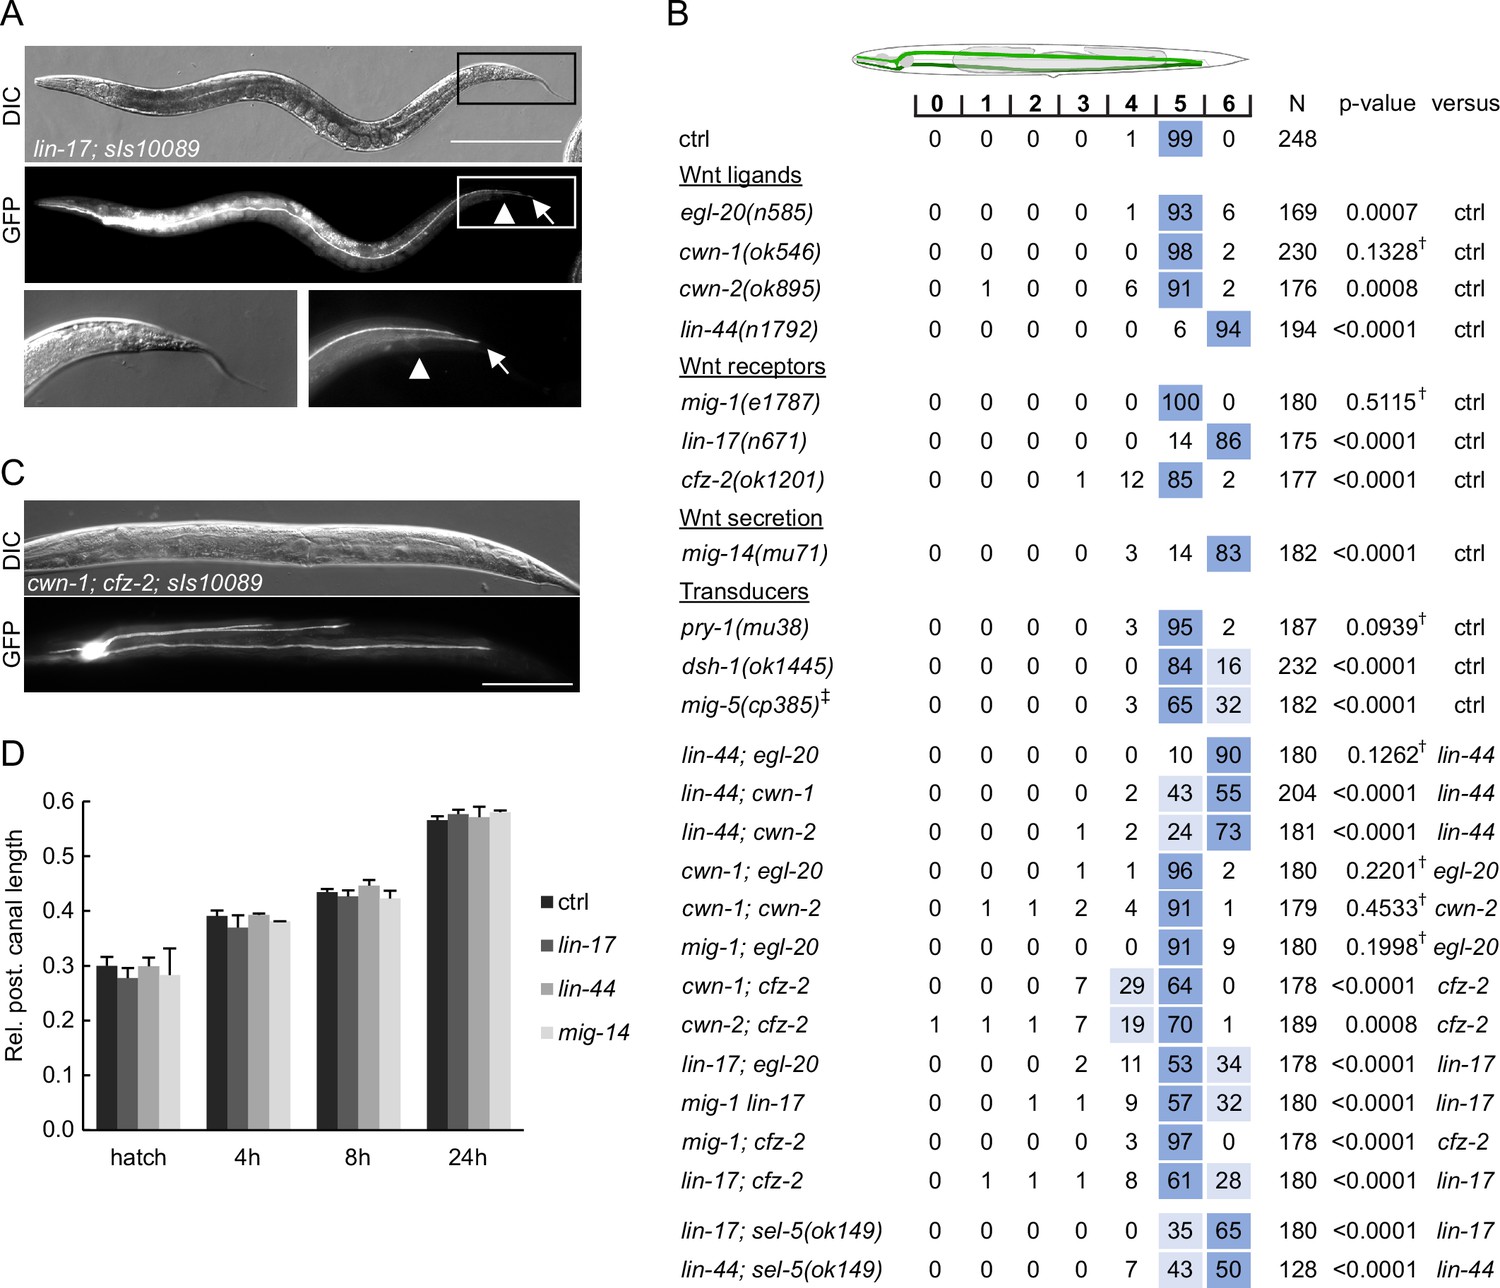
Wnt pathway components determine the length of the posterior excretory canal.
(A) Posterior canals of the excretory cell overgrow into the tip of the tail in lin-17 mutants. The excretory cell was visualized by Ppgp-12::gfp expression from the sIs10089 transgene. Boxed areas are magnified in the bottom row, scale bare represents 200 μm. (B) Quantification of posterior canal outgrowth in Wnt pathway mutants. Canal outgrowth was scored and statistically evaluated as in Figure 6B and a comparison was made either to the control strain (sIs10089 only) or to the more severe single mutant in the case of double mutant strains. All strains contained the sIs10089 transgene to visualize excretory canals except for lin-17; sel-5 and lin-44; sel-5 which contained mamEx11, and mig-5, which contained mamEx29. †Differences not significant. ‡ Full genotype was mig-5(cp385[mNG-GLO^AID::mig-5]); mamEx29; mamEx34[eft-3p::TIR::mRuby; myo2p::tdTomato] and animals were grown on NGM plates with 1 mM auxin from L1 till L4/young adult stage. Only animals containing the mamEx34 array were used for analysis. (C) Three branches of the posterior canal were detected in cwn-1; cfz-2 animals. The excretory canal was visualized by the sIs10089 transgene, the scale bar represents 200 μm. (D) Posterior excretory canals display normal length during early larval development. The dynamics of posterior canal outgrowth in lin-44, lin-17, and mig-14 mutants was assessed by measuring the canal length and normalizing it to the total body length at hatching and at three time points during early larval development. Results are presented as mean + s.d. of at least 30 measured canals. Comparison between samples assessed by unpaired two-tailed Student’s t-test did not reveal any significant differences.
Figure 8
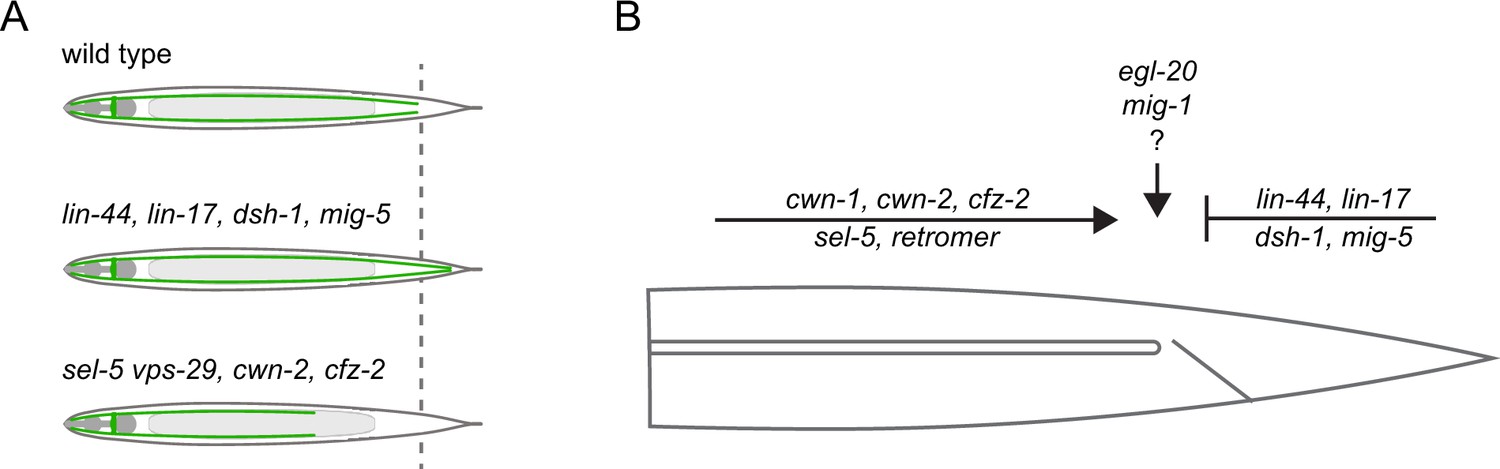
Model summarizing the inputs acting in the excretory cell outgrowth.
(A) Three possible outcomes of the canal outgrowth depending on the genetic background. (B) Model summarizing the role of Wnt pathway components, sel-5, and the retromer in the outgrowth of the excretory cell posterior canals. Only players discussed in this work are depicted. First, the active outgrowth of the posterior canals is controlled by sel-5, retromer, and the Wnt pathway consisting of cwn-1, cwn-2, and cfz-2. It remains to be determined whether these players act sequentially, in parallel or as components of a single pathway. After reaching the proper length, further canal extension is inhibited by a second Wnt signalling pathway governed by lin-44, lin-17, dsh-1, and mig-5. Lastly, egl-20 and mig-1 might fine-tune the precise stopping position of the growing canal.
Tables
Table 1
Phenotypes of sel-5 and vps-29 single and double mutants.
| Genotype | ALM (%)* | PLM (%)† | CAN (%) ‡ | Dye filling (%) § | Fecundity (n) ¶ |
|---|---|---|---|---|---|
| Wild type | 0.0 | 0.0 | 0.6 | 0.5 | 280 ± 41 |
| sel-5(ok149) | 0.0 | 0.0 | 8.9 | 4.7 | 236 ± 24 |
| sel-5(ok363) | 0.0 | 0,0 | 10.9 | 1.0 | 249 ± 37 |
| vps-29(tm1320) | 0.0 | 0.0 | 2.9 | 4.3 | 221 ± 28 |
| sel-5(ok149) vps-29 | 29.9 | 9.1 | 17.7 | 17.4 | 132 ± 40 |
| sel-5(ok363) vps-29 | 7.2 | 2.8 | 16.3 | 7.1 | 159 ± 23 |
-
*
% of animals with axons of one or both ALM reversed/bipolar, n > 60.
-
†
% of animals with axons of one or both PLM neurons reversed, n > 60.
-
‡
% of CAN neurons located anteriorly of V3 seam cell, n > 40.
-
§
% of animals with one or both phasmid sensilla not dyed with DiI, n > 40.
-
¶
Average number of progeny from five hermaphrodites,± s.d.
Key resources table
| Reagent type (species) or resource | Designation | Source or reference | Identifiers | Additional information |
|---|---|---|---|---|
| Strain, strain background (Caenorhabditis elegans) | Wild type | Caenorhabditis Genetics Center | N2 | Strain can be obtained from CGC |
| Strain, strain background (C. elegans) | lin-17(n671) I | CGC, Brenner, 1974 | MT1306 | Strain can be obtained from CGC |
| Strain, strain background (C. elegans) | lin-44(n1792) I | CGC, Herman and Horvitz, 1994 | MT5383 | Strain can be obtained from CGC |
| Strain, strain background (C. elegans) | mig-1(e1787) I | CGC, Brenner, 1974 | CB3303 | Strain can be obtained from CGC |
| Strain, strain background (C. elegans) | pry-1(mu38) I; him-5(e1490) V | CGC, Maloof et al., 1999 | CF491 | Strain can be obtained from CGC |
| Strain, strain background (C. elegans) | cwn-1(ok546) II | CGC | RB763 | Strain can be obtained from CGC |
| Strain, strain background (C. elegans) | dsh-1(ok1445) II | CGC | RB1328 | Strain can be obtained from CGC |
| Strain, strain background (C. elegans) | mig-14(mu71) II | CGC, Harris et al., 1996 | CF367 | Strain can be obtained from CGC |
| Strain, strain background (C. elegans) | mig-5(cp385[mNG-GLO^AID::mig-5]) II | CGC, Heppert et al., 2018 | LP728 | Strain can be obtained from CGC |
| Strain, strain background (C. elegans) | vps-35(hu68) II | CGC, Coudreuse et al., 2006 | KN555 | Strain can be obtained from CGC |
| Strain, strain background (C. elegans) | sel-5(ok149) III | CGC | GS2381 | Strain can be obtained from CGC |
| Strain, strain background (C. elegans) | sel-5(ok363) III | CGC | RB638 | Strain can be obtained from CGC |
| Strain, strain background (C. elegans) | egl-20(n585) IV | CGC, Harris et al., 1996 | MT1215 | Strain can be obtained from CGC |
| Strain, strain background (C. elegans) | cwn-2(ok895) IV | CGC | VC636 | Strain can be obtained from CGC |
| Strain, strain background (C. elegans) | cfz-2(ok1201) V | CGC | RB1162 | Strain can be obtained from CGC |
| Strain, strain background (C. elegans) | muIs32[Pmec-7::gfp; lin-15(+)] II | CGC, Ch’ng et al., 2003 | CF702 | Strain can be obtained from CGC |
| Strain, strain background (C. elegans) | huSi2[Pmig-14::mig-14::gfp] II | Lorenowicz et al., 2014 | KN1312 | Korswagen lab |
| Strain, strain background (C. elegans) | dpy-5(e907) X; sIs10089 III | CGC, McKay et al., 2003 | BC10210 | Strain can be obtained from CGC |
| Strain, strain background (C. elegans) | lin-15AB(n765) kyIs4 [Pceh-23::unc-76::gfp+lin-15(+)] X | CGC, Zallen et al., 1999 | CX2565 | Strain can be obtained from CGC |
| Strain, strain background (C. elegans) | fcho-1(ox477) II; dpy-23(mew25) X | Gunther Hollopeter | GUN27 | Hollopeter lab |
| Strain, strain background (C. elegans) | vps-29(tm1320)III; muIs32 [Pmec-7::gfp] II | Yang et al., 2008 | Korswagen lab | |
| Antibody | Anti-α-tubulin antibody (mouse monoclonal) | Sigma-Aldrich | RRID:AB_477593 | WB (1:10,000) |
| Antibody | Anti-GFP antibody (mouse monoclonal) | Roche | RRID:AB_390913 | WB (1:4000) |
| Antibody | Anti-phosphoAP2M1 (rabbit monoclonal) | Abcam | RRID:AB_10866362 | WB (1:2500) |
| Antibody | Goat anti-mouse HRP-conjugated antibody (goat polyclonal) | Jackson ImmunoResearch Laboratories | RRID:AB_2307392 | WB (1:10,000) |
| Antibody | Goat anti-rabbit HRP-conjugated antibody (goat polyclonal) | Jackson ImmunoResearch Laboratories | RRID:AB_2337938 | WB (1:10,000) |
| Recombinant DNA reagent | pDD282 (plasmid) | Dickinson et al., 2013 | RRID:Addgene_66823 | |
| Recombinant DNA reagent | pDD162 (plasmid) | Dickinson et al., 2013 | RRID:Addgene_47549 | |
| Recombinant DNA reagent | pCFJ104 (plasmid) | Frøkjaer-Jensen et al., 2008 | RRID:Addgene_19328 | |
| Recombinant DNA reagent | pPD95.81 (plasmid) | Addgene (Andrew Fire) | RRID:Addgene_1497 | |
| Software, algorithm | Fiji image processing package | Schindelin et al., 2012 | ||
| Software, algorithm | Real Statistics Resource Pack, release 7.6 | Zaiontz, 2021, https://www.real-statistics.com | ||
| Software, algorithm | MATLAB | https://www.mathworks.com/ |
Additional files
-
Supplementary file 1
List of all C. elegans strains generated.
- https://cdn.elifesciences.org/articles/91054/elife-91054-supp1-v2.xlsx
-
Supplementary file 2
List of primers used to construct plasmid vectors.
- https://cdn.elifesciences.org/articles/91054/elife-91054-supp2-v2.xlsx
-
MDAR checklist
- https://cdn.elifesciences.org/articles/91054/elife-91054-mdarchecklist1-v2.docx
Download links
A two-part list of links to download the article, or parts of the article, in various formats.
Downloads (link to download the article as PDF)
Open citations (links to open the citations from this article in various online reference manager services)
Cite this article (links to download the citations from this article in formats compatible with various reference manager tools)
Caenorhabditis elegans SEL-5/AAK1 regulates cell migration and cell outgrowth independently of its kinase activity
eLife 13:e91054.
https://doi.org/10.7554/eLife.91054


