Asymmetric framework motion of TCRαβ controls load-dependent peptide discrimination
- Department of Biomedical Engineering, Texas A&M University, United States
- Department of Dermatology, Harvard Medical School, United States
- Laboratory of Immunobiology, Dana-Farber Cancer Institute, United States
- Department of Medicine, Oncology, Dana-Farber Cancer Institute, United States
- Department of Chemistry and Biomolecular Engineering, Vanderbilt University, United States
- Department of Molecular Physiology and Biophysics, Vanderbilt University, United States
- Department of Medicine, Harvard Medical School, United States
- Department of Materials Science & Engineering, Texas A&M University, United States
- Department of Physics & Astronomy, Texas A&M University, United States
Figures
Figure 1
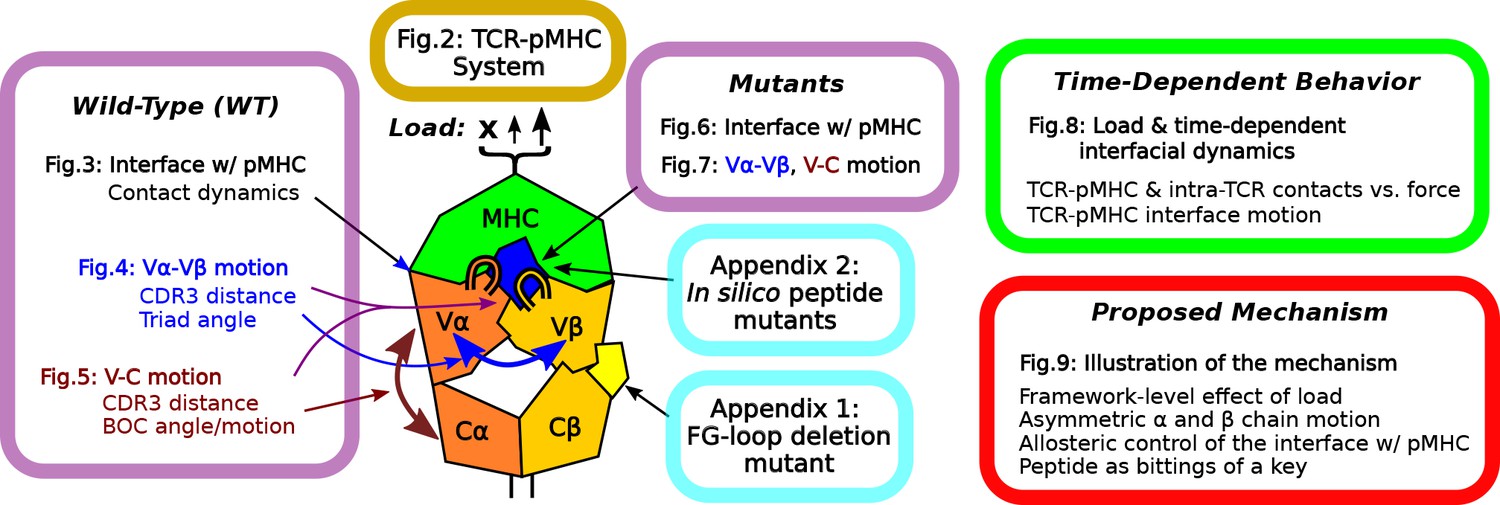
Overview of figures and analyses in this work.
Figure 2 introduces the systems studied. WT systems were studied in three structural aspects (Figures 3—5). Similar analyses were done for the mutant systems (Figures 6 and 7). Appendix 1 and 2 provide simulations of additional mutants that we tested. We further examined the load- and time-dependent changes of the interfacial fit (Figure 8). All of the results collectively lead to the proposed mechanism of catch bond formation and ligand discrimination (Figure 9).
Figure 2
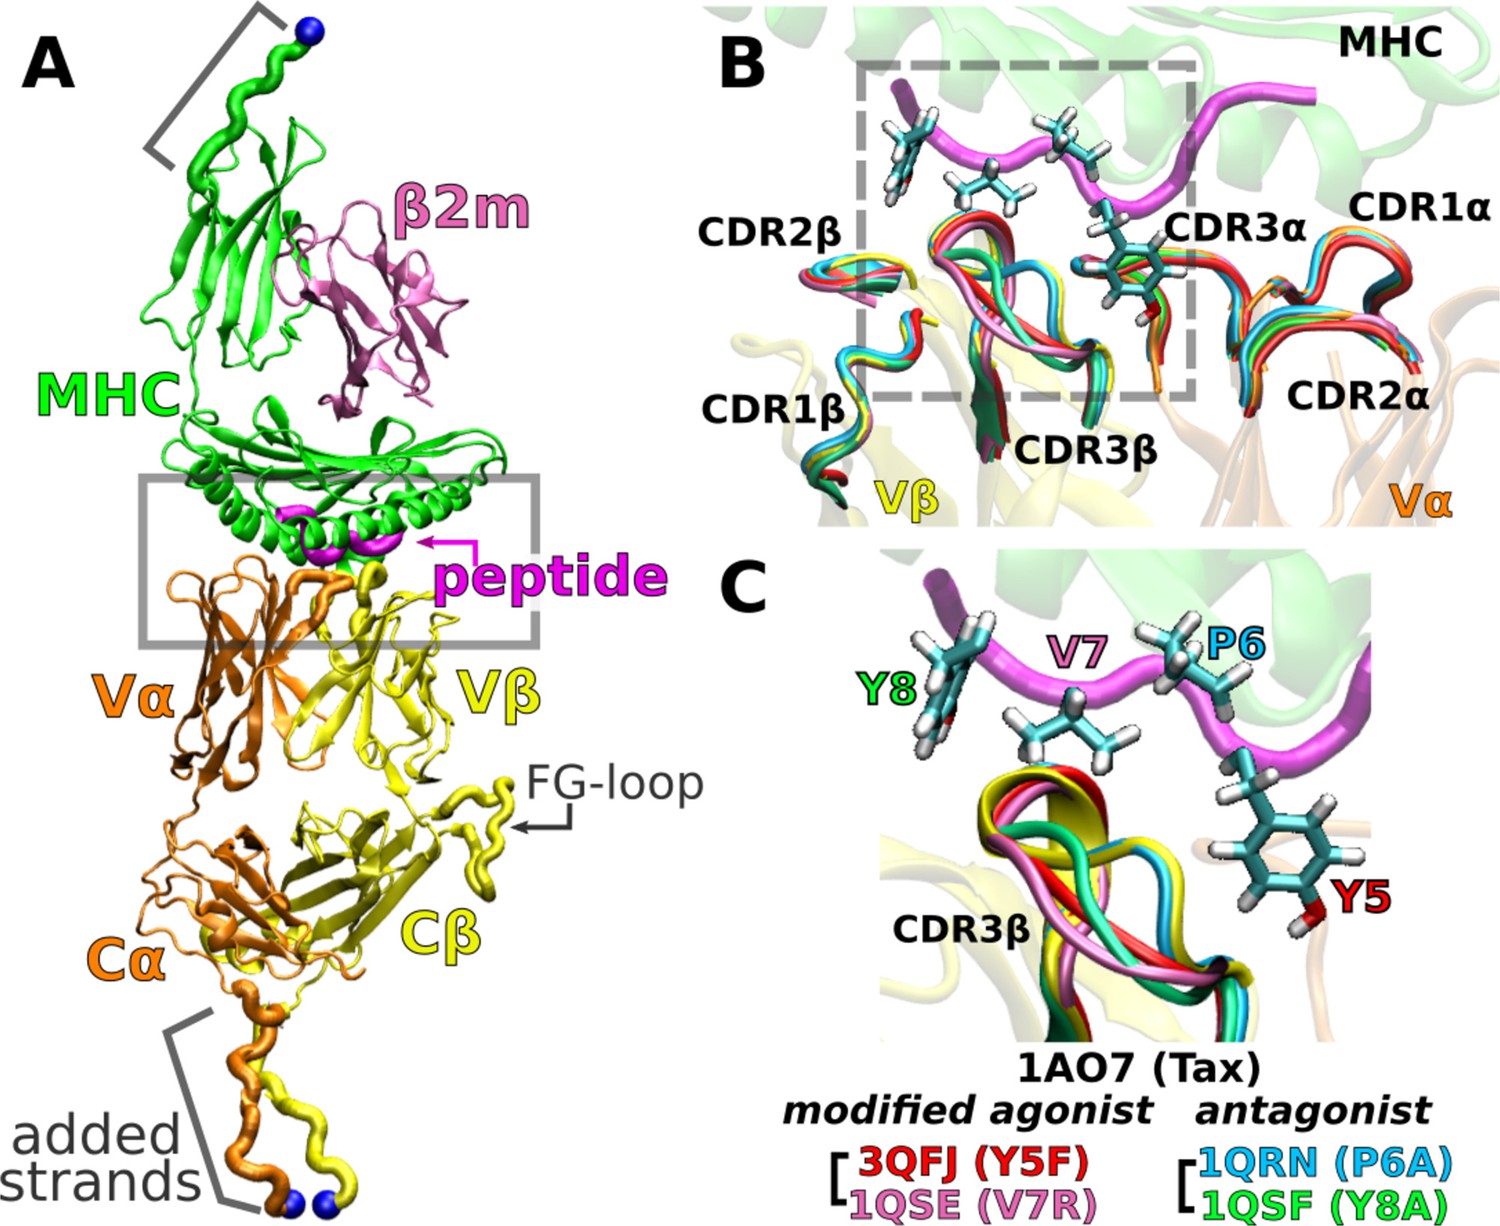
A6 TCRαβ-pMHC complex.
(A) WT (Protein Data Bank, PDB 1AO7). The missing Cα domain was added based on PDB 1QSE (Structure preparation). Blue spheres: terminal Cα atoms held at set extensions during the simulation (Table 1). β2m: β2 microglobulin. (B) Overlay of the X-ray structures of the WT and four point mutants of the Tax peptide at the boxed region of panel A. The CDR loops take nearly identical conformations in different structures. (C) Magnified view of the dashed box in panel B, focusing on the conformation of CDR3β. PDB names for A6 TCRαβ-pMHC complexes containing mutant peptides are listed.
Figure 3 with 1 supplement

Load dependence of the WT TCRαβ-pMHC interface.
(A) Number of high-occupancy contacts (Contact analysis). Bars: std. (B) Hamming distance over time. Histograms are for the interval after 500 ns. Dashed arrows mark increase in , corresponding to contacts lost. (C–E) Contact occupancy heat maps for the interface with pMHC. H-bond/hb: hydrogen bonds, including salt bridges, and np: nonpolar (Contact analysis). (F) Location of Cα atoms of the residues whose contacts with pMHC have greater than 80% average occupancy. Cyan spheres: last frame of simulation. Transparent blue: locations rendered every 0.2 ns showing positional variability. (G) Total (pink) and per-residue (blue) BSA for interfacial residues with greater than 80% maximum instantaneous occupancy (BSA). Bars: std. (H) RMSF of backbone Cα atoms of the peptide after 500 ns. For calculation, the Cα atoms were aligned to those at the beginning of the production run.
Figure 3—figure supplement 1
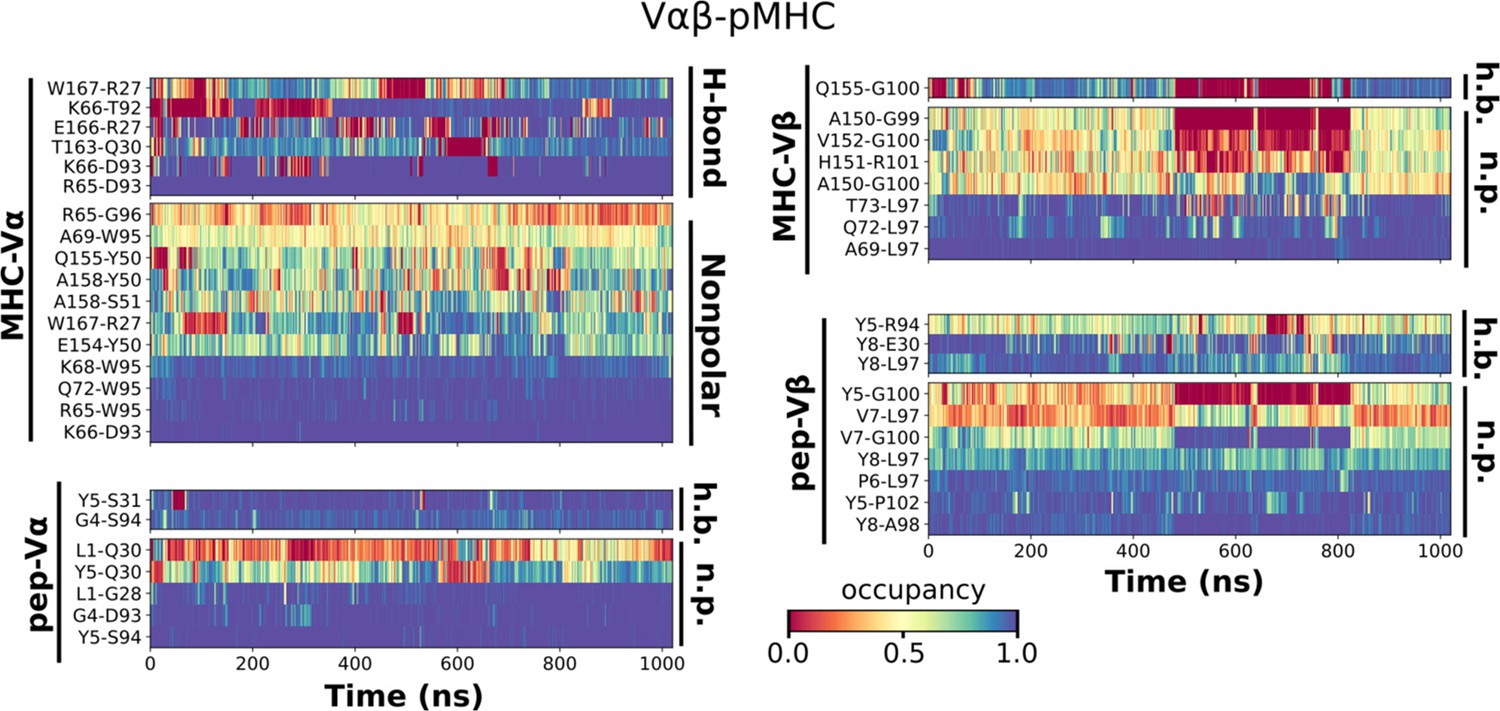
Contact occupancy heat maps for Vαβ-pMHC.
The same occupancy cutoffs as in Figure 3C–E were used.
Figure 4 with 2 supplements
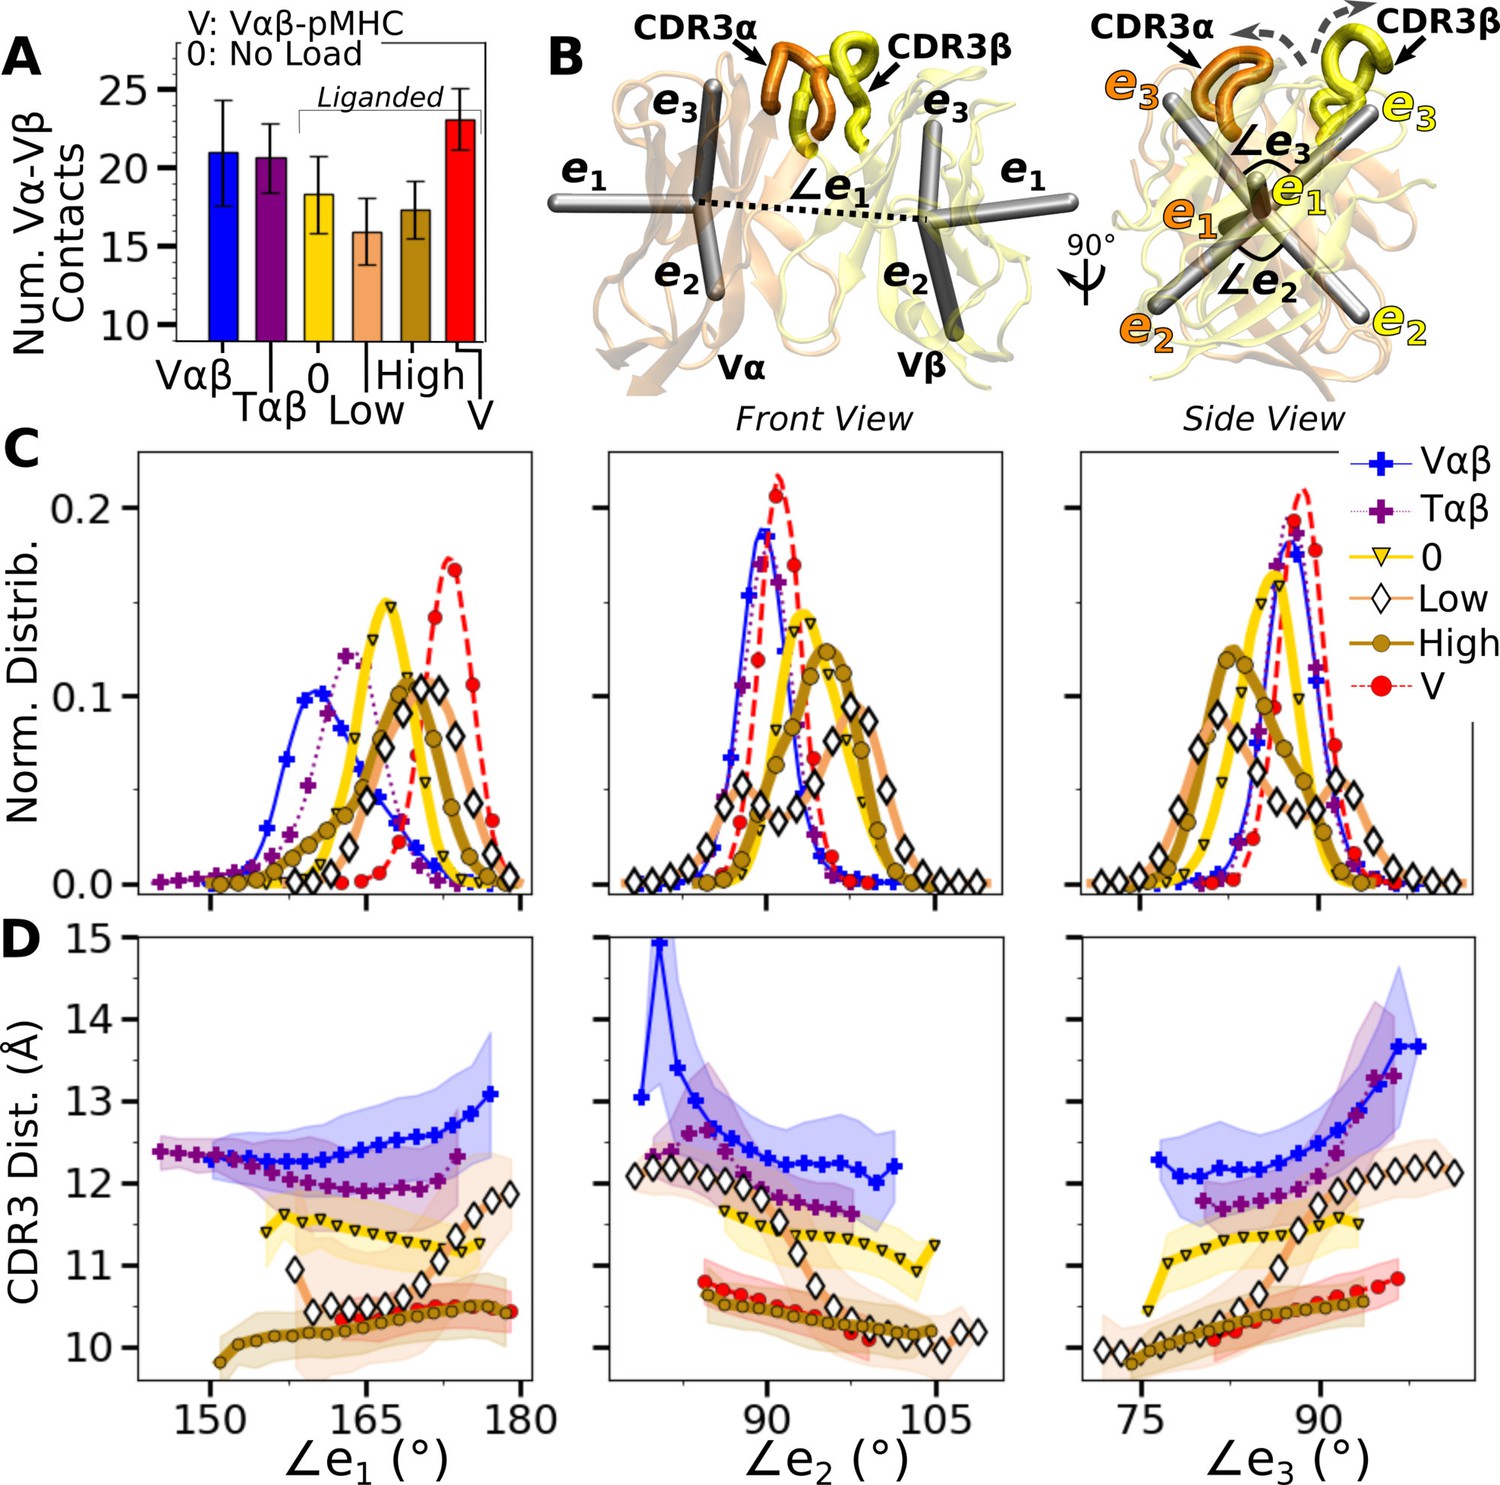
Vα-Vβ motion.
(A) Number of high-occupancy contacts (Contact analysis). Bars: std. (B) Triads assigned to each domain. Angles between triad arms (, , and ) are marked. CDR3 loops are represented as thick tubes. Dashed arrows indicate directions where the CDR3 distance increases via the scissor motion. (C) Histograms of the 3 angles between the triad arms. For WTlow, the smaller peaks in distributions of and arise from simulation trajectories after 1 µs. (D) CDR3 distance vs. the 3 angles. Transparent band: std of the CDR3 distance in each bin. Statistics for bins deteriorate in large- or small-angle tails that contain very few frames.
Figure 4—figure supplement 1
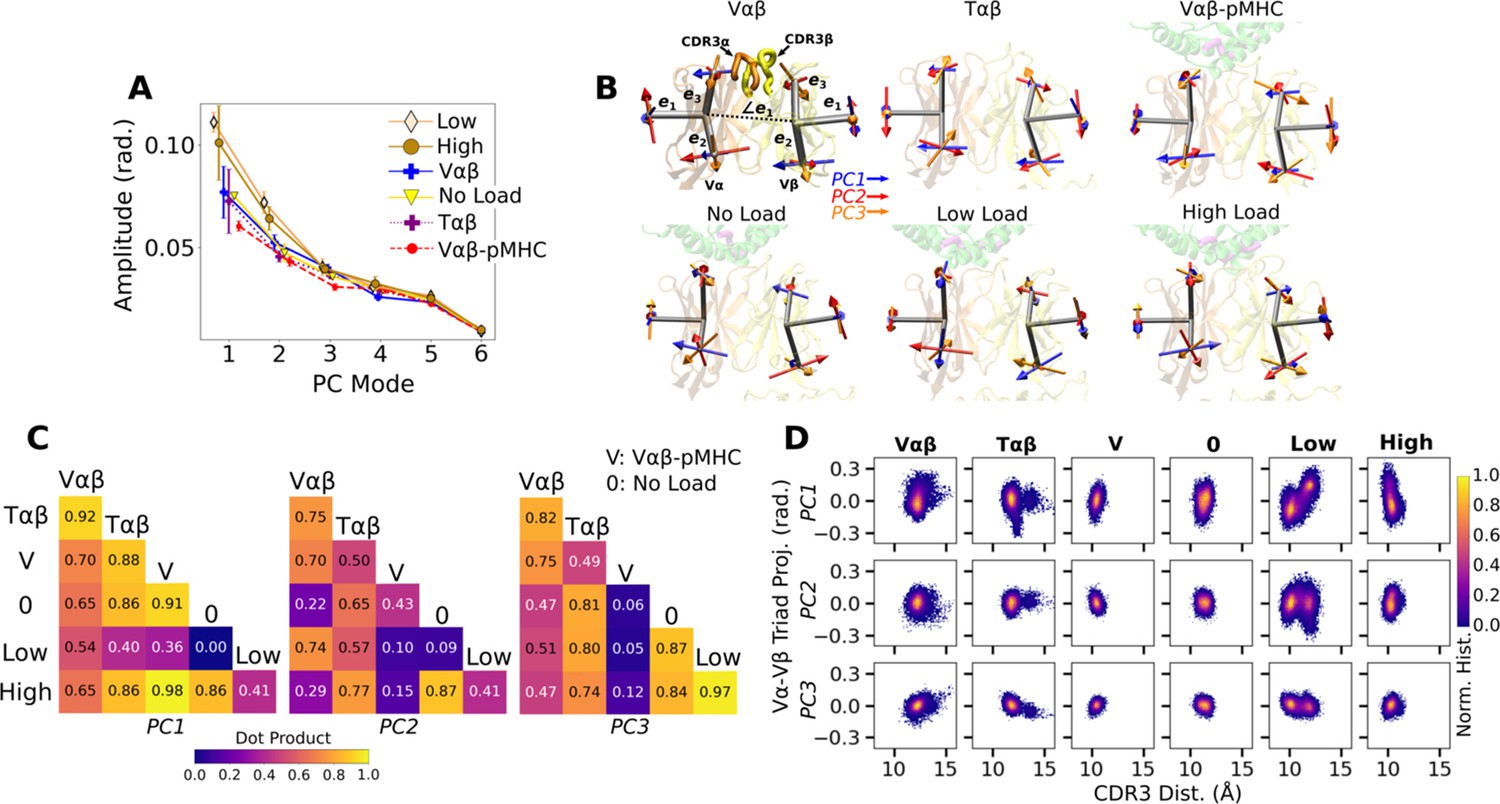
PCA of Vα-Vβ motion.
(A) PC amplitudes. Bars: std for PCA performed in three overlapping intervals from 500 ns to the end of simulation. (B) Direction of motion for the first three PC modes. (C) Absolute values of dot products between the unit PC vectors in listed systems. Values range from 0 (orthogonal PC directions) to 1.0 (identical PC directions). (D) 2-dimensional histograms of the projections of the Vα-Vβ triads in each frame onto the first three PC directions versus the CDR3 distance.
Figure 4—figure supplement 2
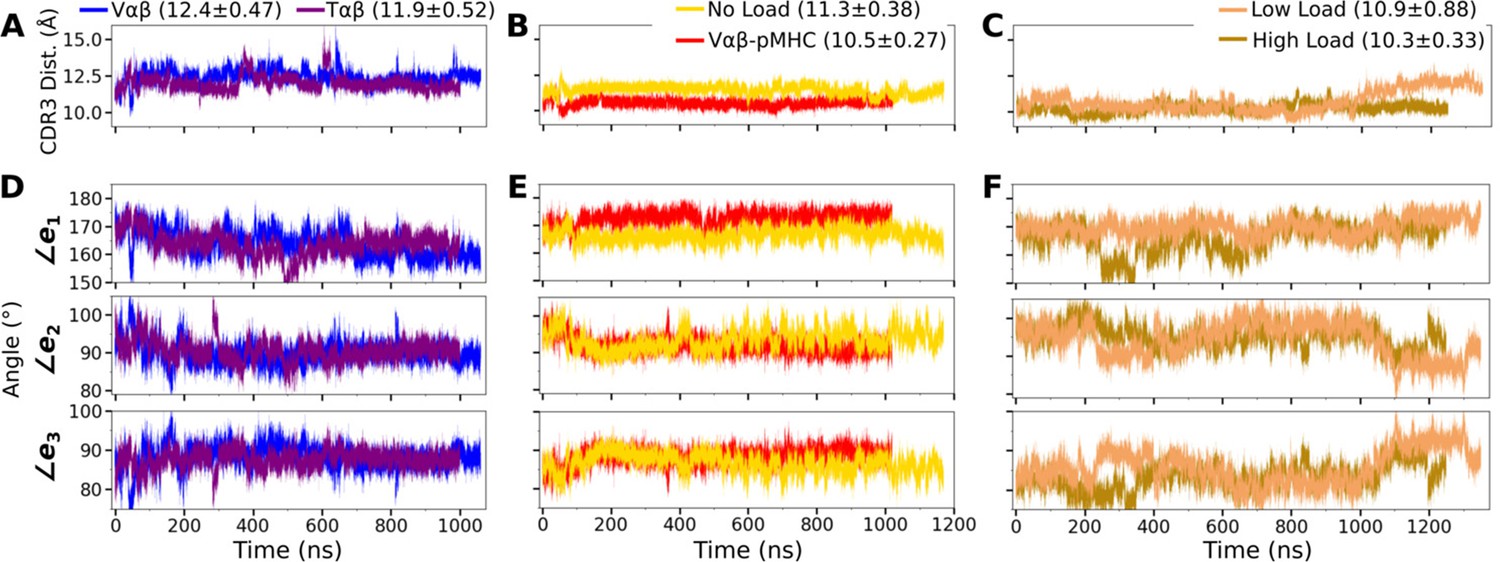
Trajectories of the V-module motion.
(A–C) CDR3 distances and (D–F) triad angles. (A, D) Vαβ and Tαβ, (B, E) Vαβ-pMHC and WT0, and (C, F) WTlow and WThigh. Labels include average and standard deviation of the CDR3 distance after 500 ns.
Figure 5 with 1 supplement
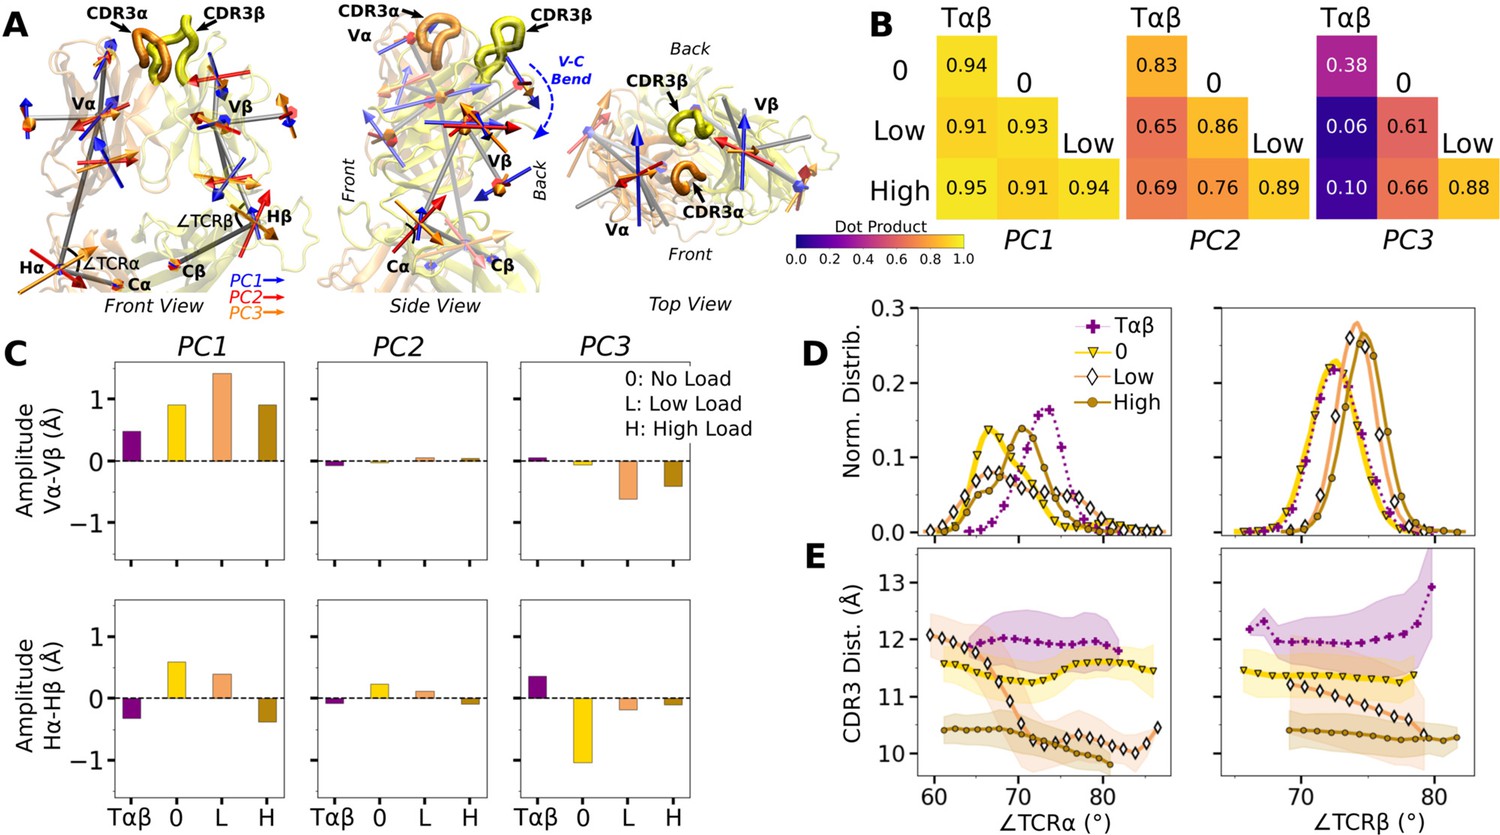
WT V-C dynamics.
(A) Average BOC built from the unliganded Tαβ. The C-module is used as orientational reference, hence PC arrows are visible only for the V-module and hinges. (B) Dot products computed between the BOC PCs in listed systems. Values closer to 1.0 denote similar V-C BOC direction of motion. (C) Difference in amplitude between the α and β chain motion measured between Vα and Vβ (top), and Hα and Hβ (bottom). PC amplitudes are proportional to the lengths of the arrows in panel A. (D) Histograms of hinge angles (defined in panel A) for each chain. (E) CDR3 distance vs. hinge angles.
Figure 5—figure supplement 1
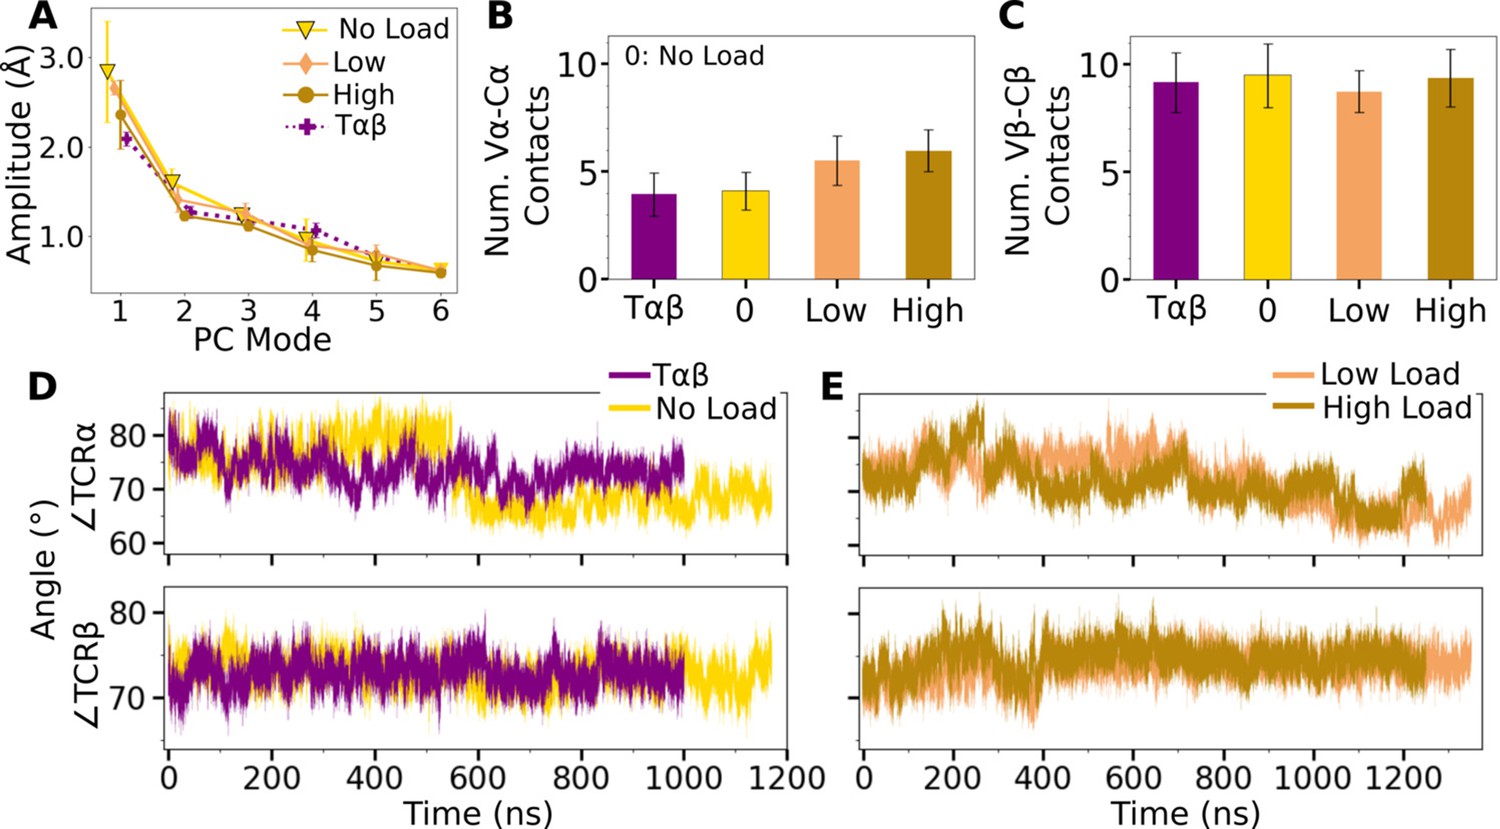
V-C PC amplitude and contacts.
(A) Amplitude of the first six PCs. Bars: std for PCA performed in 3 overlapping intervals from 500 ns to the end of simulation. (B, C) Number of contacts with greater than 50% average occupancy and 80% maximum instantaneous occupancy for (B) Vα-Cα and (C) Vβ-Cβ. Bars: std. (D, E) Trajectories of hinge angles versus time.
Figure 6 with 3 supplements

Interface with pMHC containing mutant peptides.
The same occupancy cutoffs were used as in Figure 3. (A) Number of contacts with pMHC. Dashed line: count for WThigh in Figure 3A, for reference. (B) Total (pink) and per-residue (blue) BSA. Dashed and dotted lines: values for WThigh (Figure 3G). (C–F) Contact heat maps for peptide residues 5–8. (C) WThigh (included in Figure 3C), and (D) P6A0, (E) P6Alow, and (F) P6Ahigh.
Figure 6—figure supplement 1
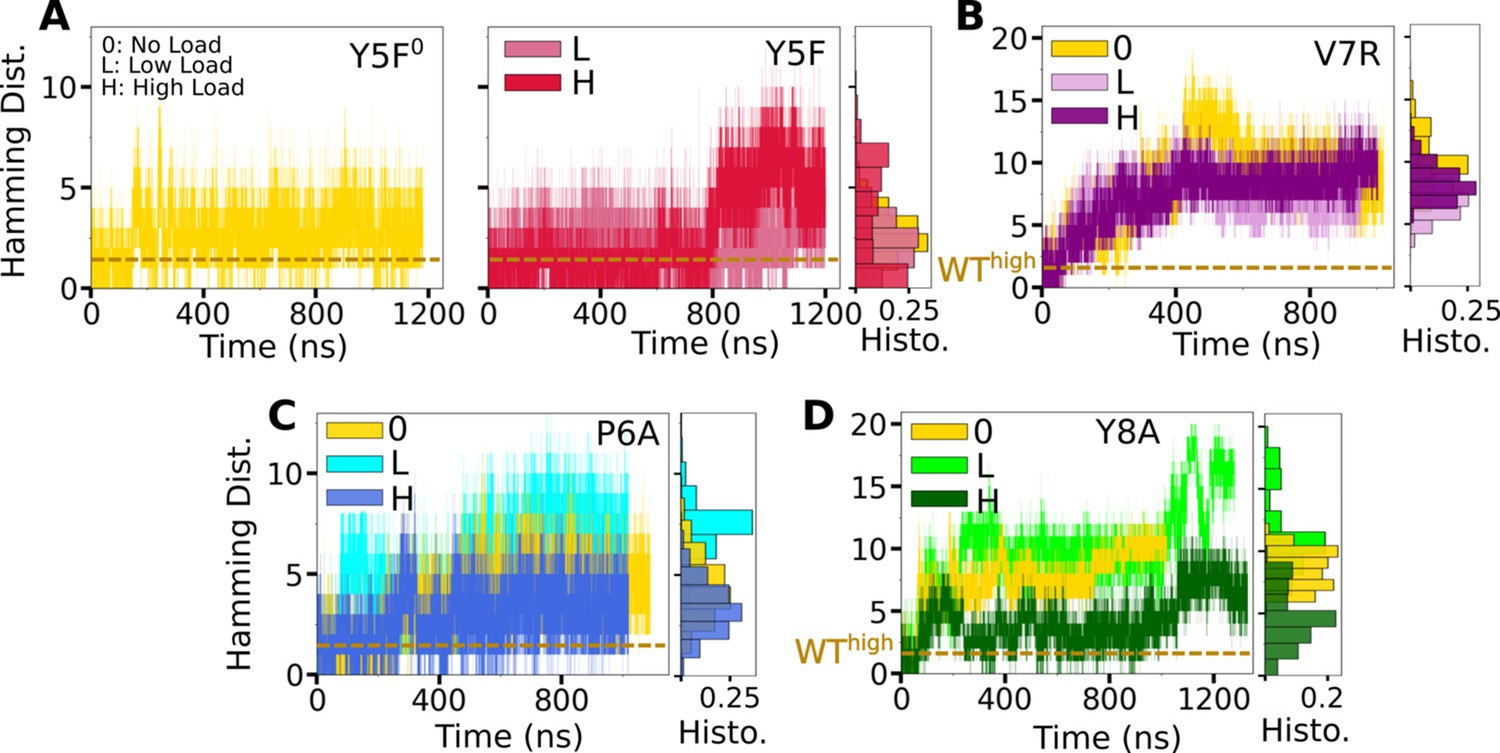
Trajectories of for mutant complexes.
(A, B) Modified agonists. (C, D) Antagonists. The same cutoff criteria were used to calculate initial contacts as in Figure 3B. Data after 500 ns were used for histograms on the right of each panel.
Figure 6—figure supplement 2
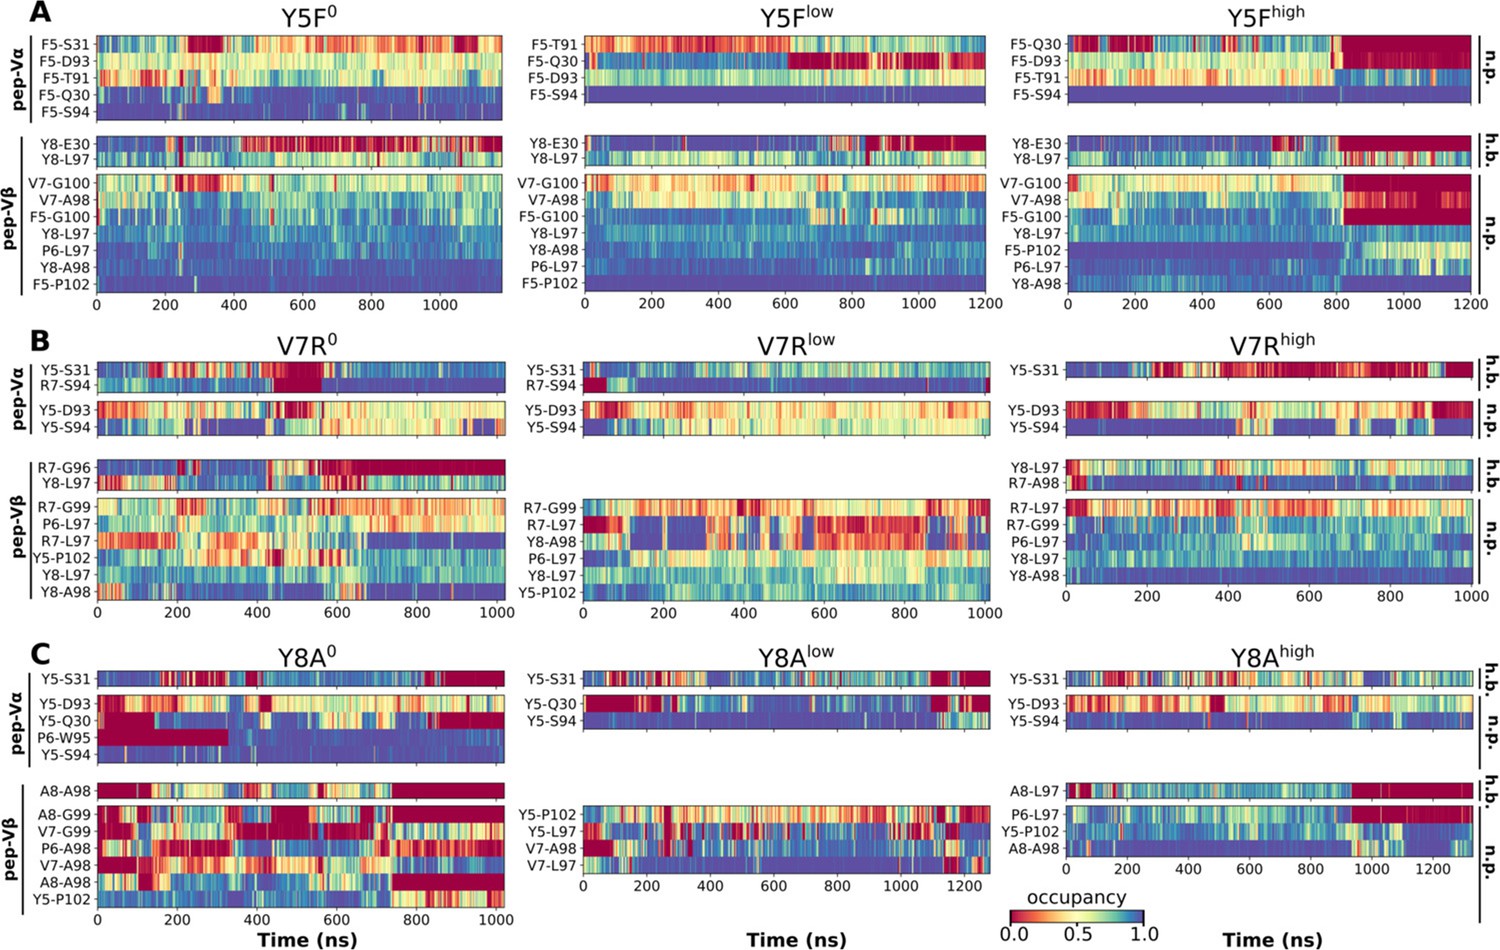
Contact occupancy heat maps for residues 5–8 of the mutant peptides.
(A) Y5F, (B) V7R, and (C) Y8A. Corresponding heat maps for WThigh and P6A are in Figure 6C–F.
Figure 6—figure supplement 3
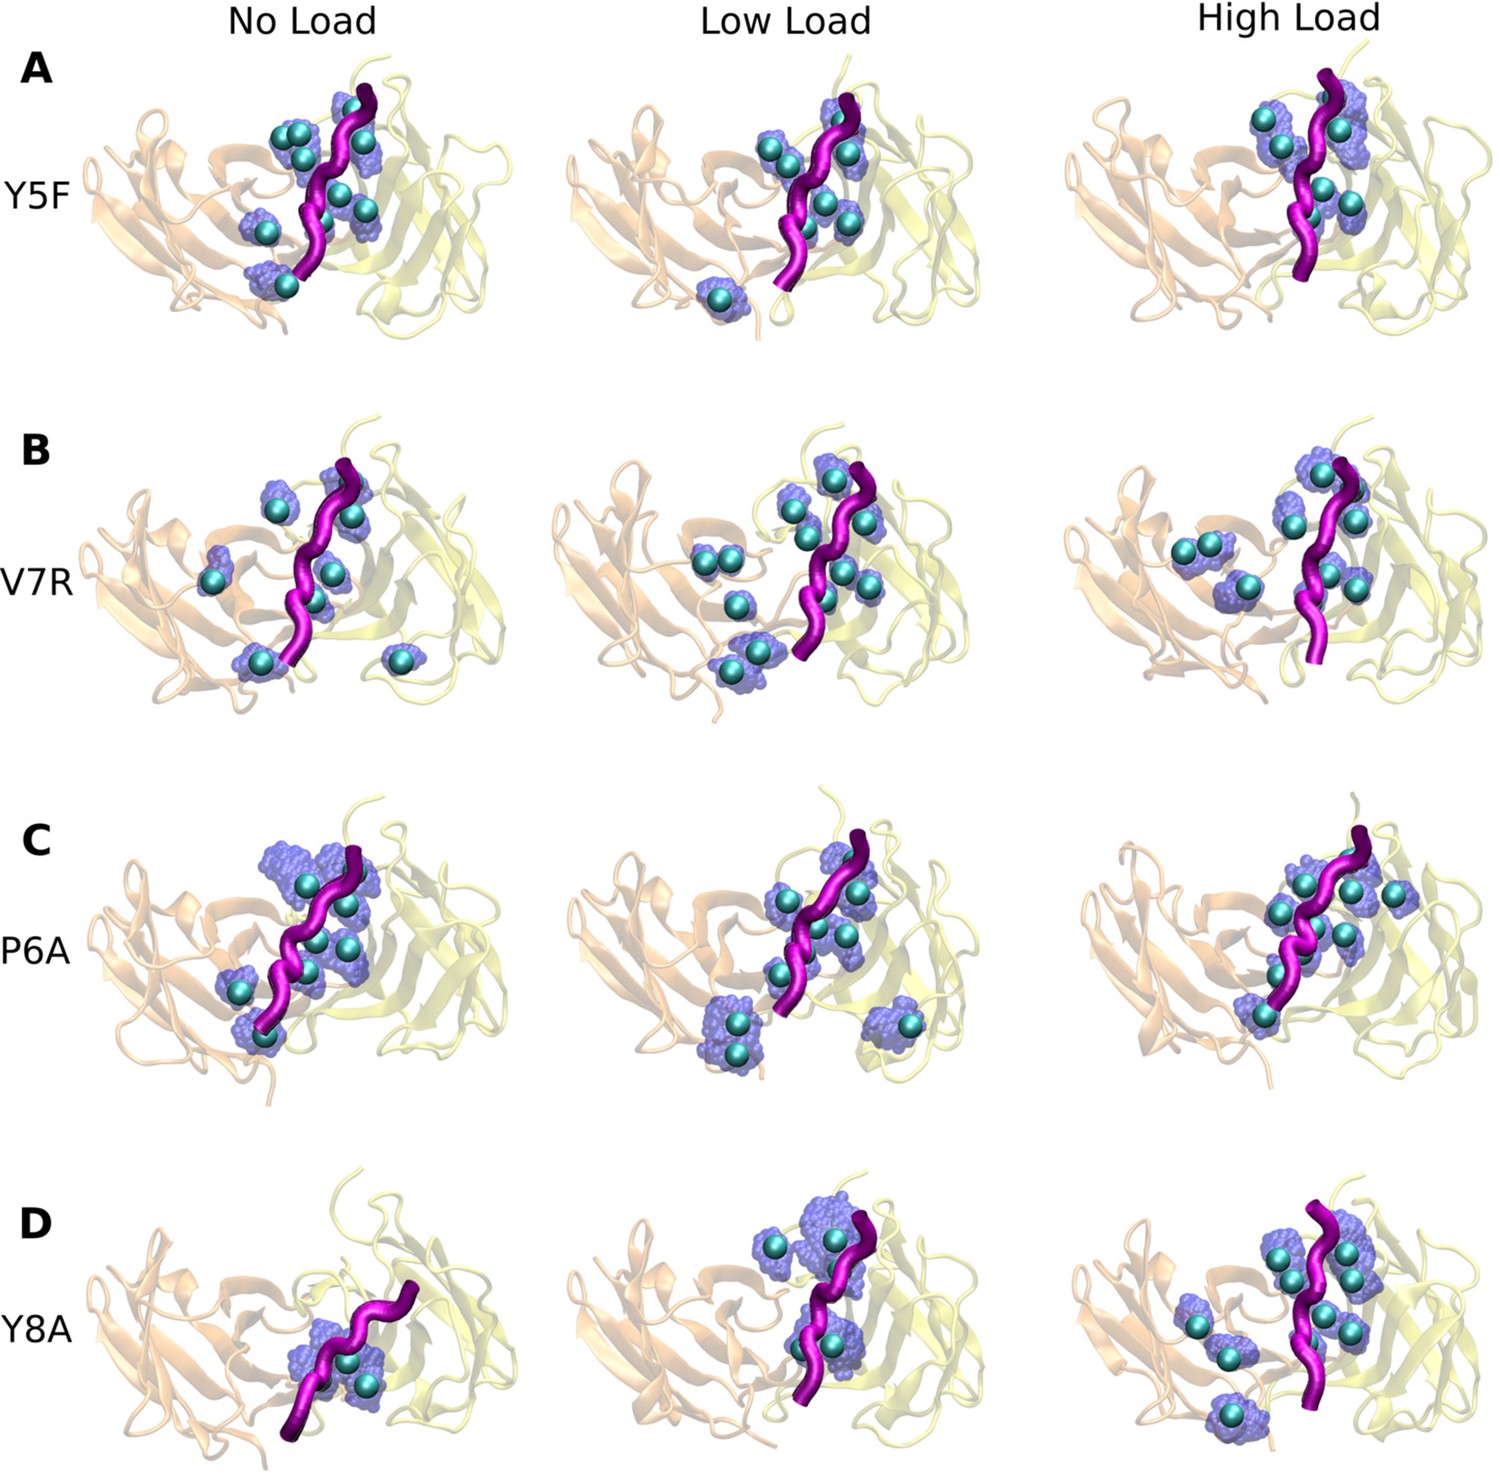
Locations of high-occupancy contacts with pMHC in mutant systems.
Figure 7 with 4 supplements

Mutant effects on the conformational dynamics of TCRαβ.
(A, B) CDR3 distance versus triad arm angles for (A) modified agonists and (B) antagonists. Plot for WThigh in Figure 4D is reproduced for comparison. (C, D) Average BOCs of labeled complexes oriented to the constant domains of WThigh (V-C BOC and PCA) for (C) modified agonists and (D) antagonists. Average BOCs for WT0 and WThigh are displayed for comparison (marked by angular brackets).
Figure 7—figure supplement 1
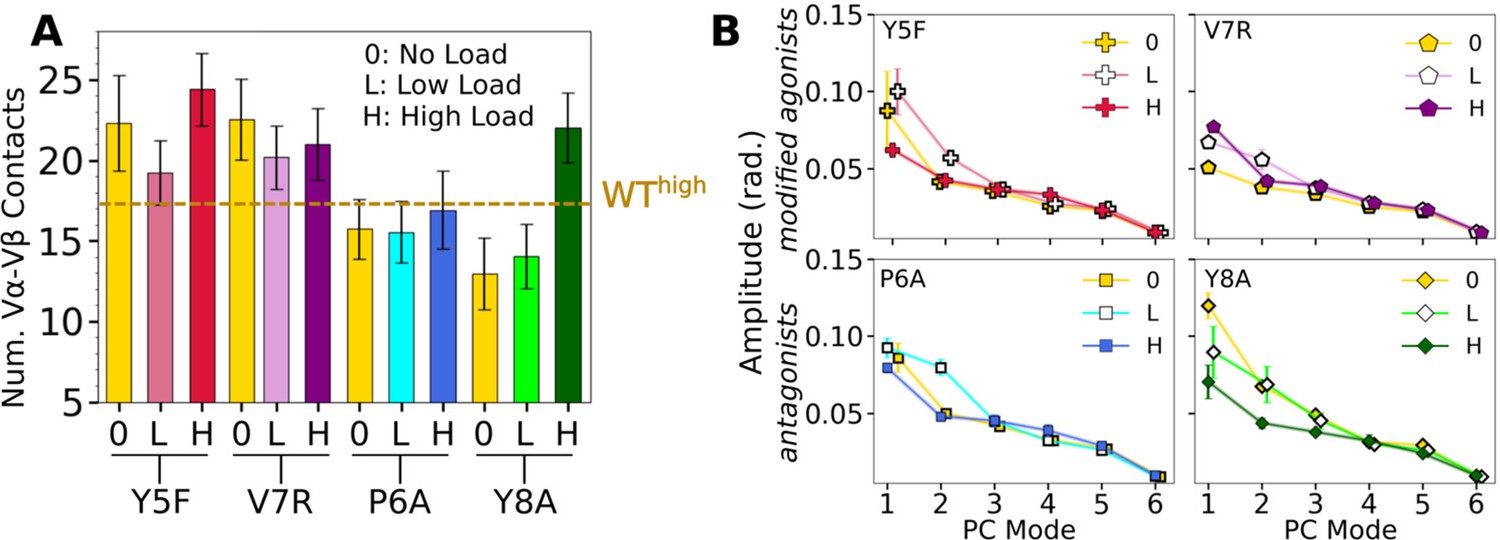
Vα-Vβ motion of mutant systems.
(A) Number of Vα-Vβ contacts, counted in the same way as in Figure 4A. Dashed line is the average for WThigh. (B) Vα-Vβ PC amplitudes. Calculated the same way as in Figure 4—figure supplement 1A.
Figure 7—figure supplement 2
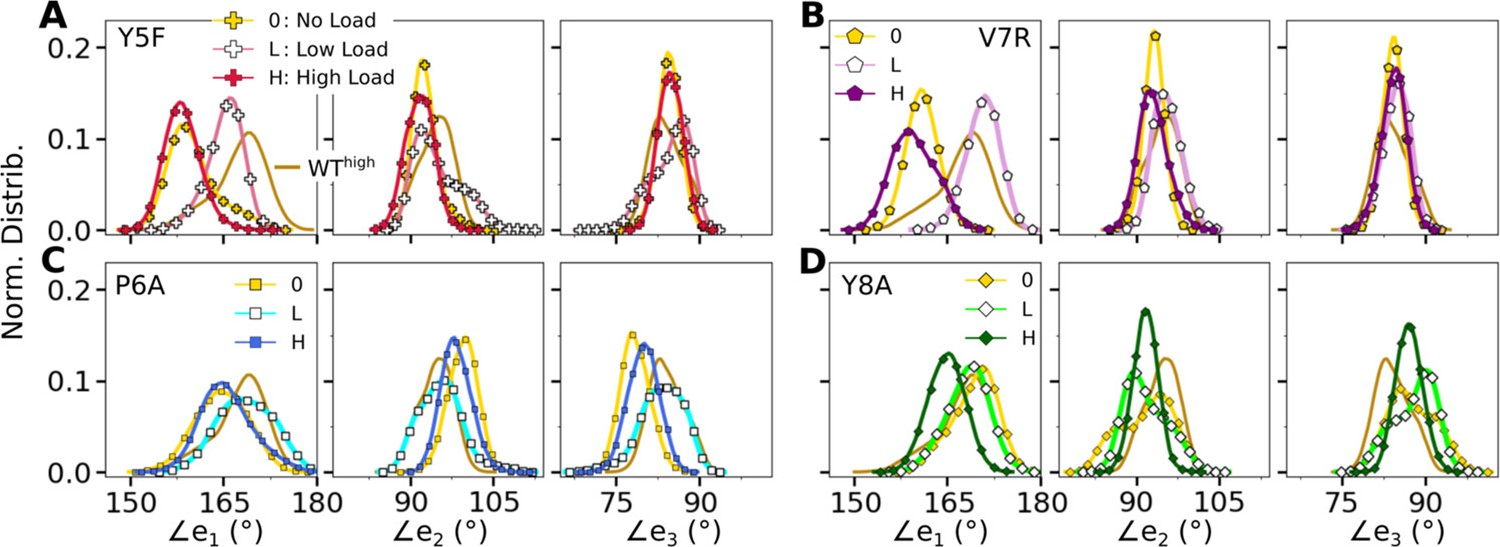
Distribution of triad arm angles in mutant systems.
(A, B) Modified agonists and (C, D) antagonists. Respective plot for WThigh in Figure 4C is included in all panels (without markers) for comparison.
Figure 7—figure supplement 3
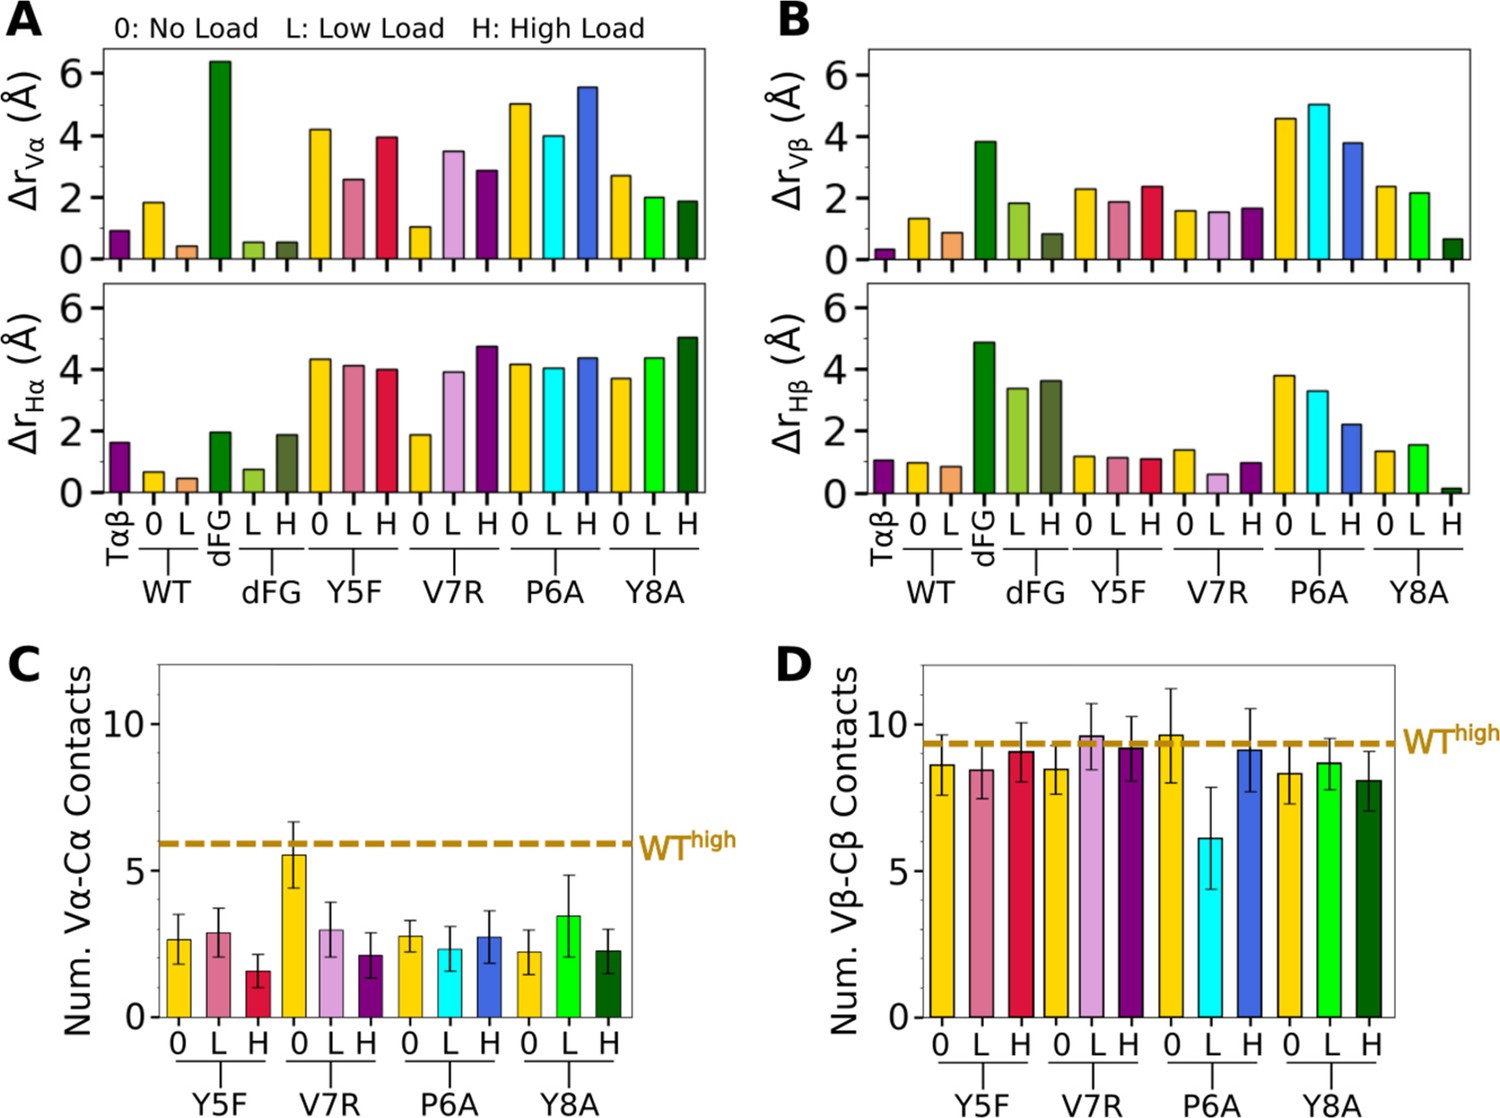
Comparison of mutant average V-C BOCs and interfaces with those of WThigh.
All BOCs are aligned to the C-module of WThigh. (A, B) Distances of beads for (A) Vα and Hα, and (B) Vβ and Hβ from those of WThigh, revealing the extent of deformation. (C, D) Number of V-C contacts for each chain. Dashed line denotes respective value for WThigh in Figure 5—figure supplement 1B, C.
Figure 7—figure supplement 4
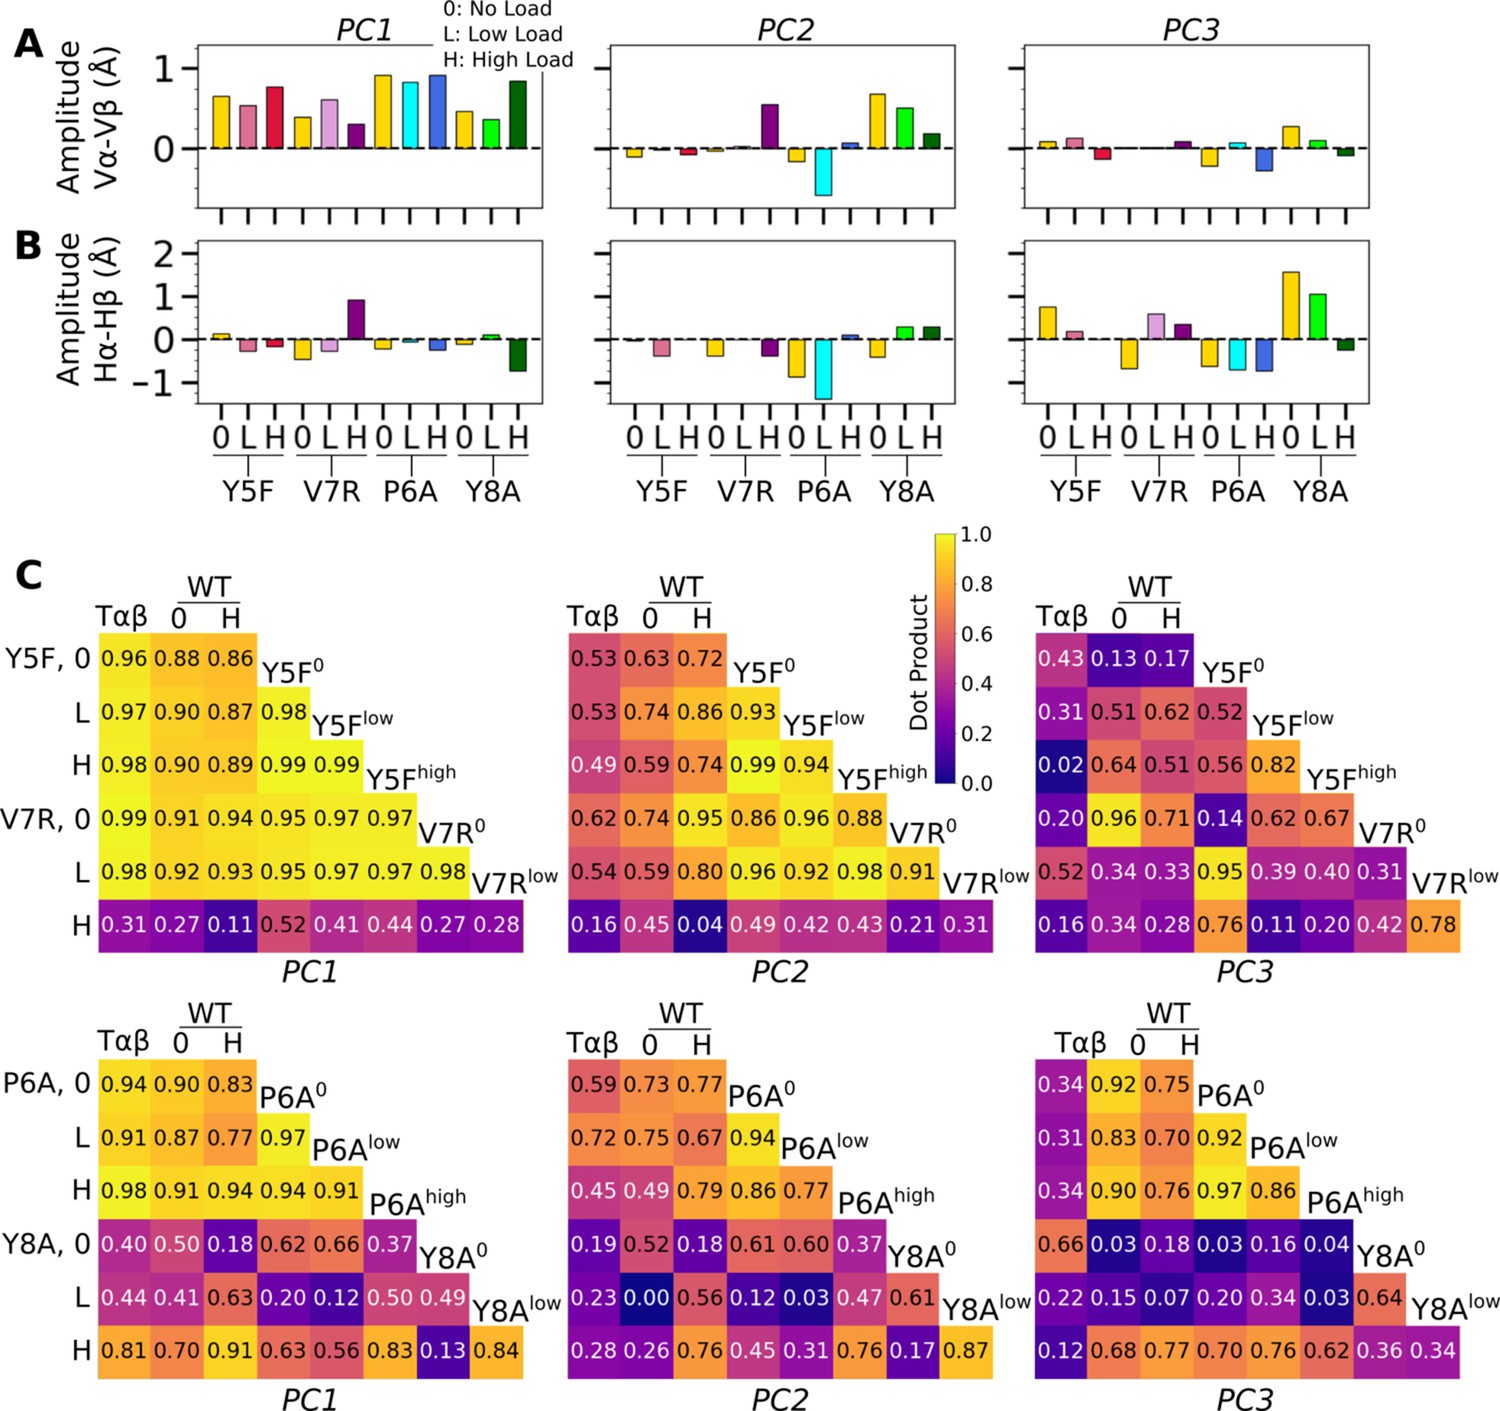
V-C motion of mutants.
(A, B) Differences in PC amplitude between BOC PC of (A) Vα vs. Vβ and (B) Hα vs. Hβ. Compare with Figure 5C for WT systems. (C) Dot products between BOC PC vectors for the listed systems.
Figure 8 with 1 supplement
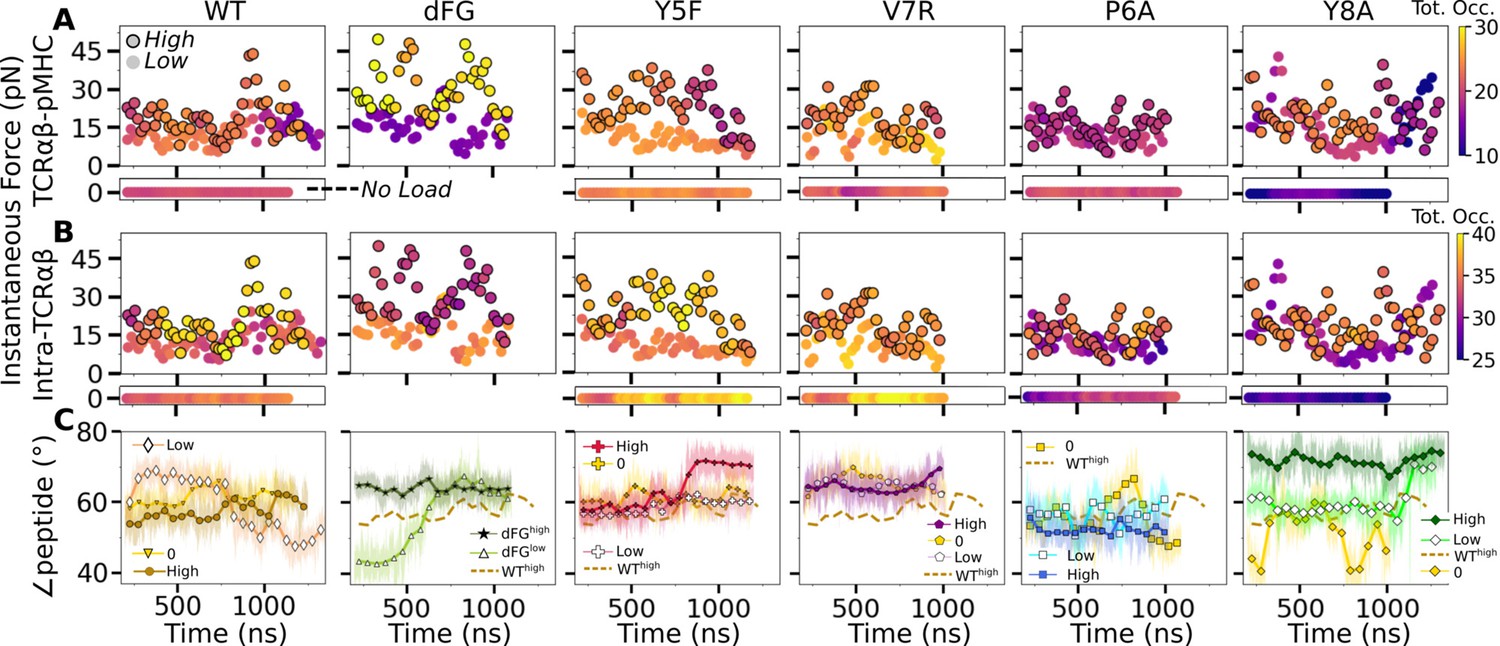
Relationship between force and interfacial behavior.
(A, B) The total contact occupancy measured in 40-ns overlapping intervals starting from 200 ns (see Time-dependent behavior in Computational methods). (A) TCRαβ-pMHC (intermolecular) and (B) intra-TCRαβ (intramolecular) contacts excluding Cα-Cβ. Cases without load are shown as horizontal bars below each panel. Plots for low load systems (Table 1) do not have outlines. (C) Angle between antigenic peptide and the line between centroids of the triads for Vα and Vβ (Peptide and V-module angle). Thin lines: values at individual frames. Symbol: 50-ns running average.
Figure 8—figure supplement 1
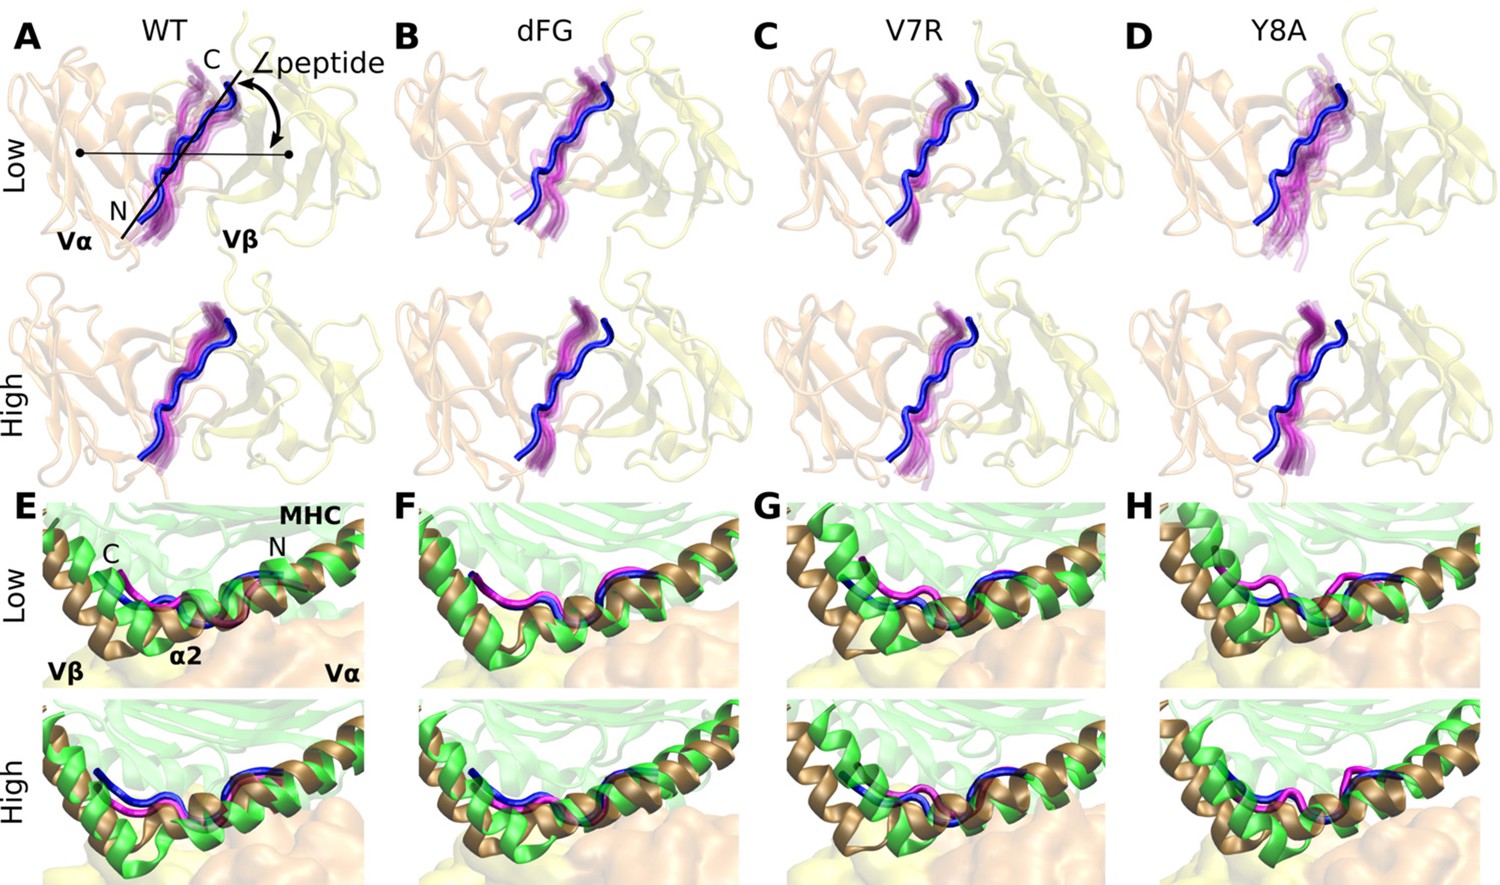
Motion at the interface related to ∠peptide.
(A–D) View of interface from the top of the V-module. The peptide from the crystal structure (blue) of each respective system is overlaid on frames of the peptide during simulation (magenta) rendered every 50-ns from 500 ns to the end. (E–H) Positional shift of pMHC. Side view showing MHC α2 helix (brown) and peptide (blue) from the crystal structure overlaid with MHC α2 helix (green) and peptide (magenta) of the last rendered frame from panels (A–D).
Figure 9
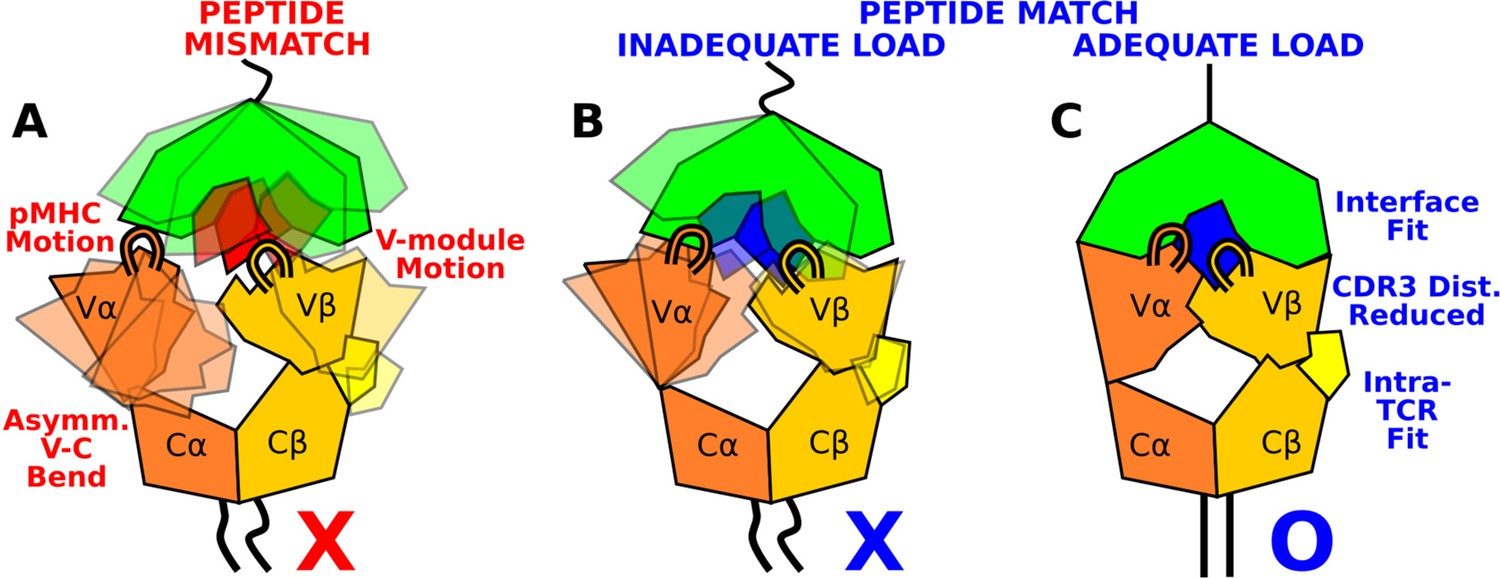
Model for peptide screening.
(A) Non-matching pMHC or (B) matching pMHC but without adequate load do not stabilize the asymmetric V-C framework motion that affects the interfacial stability as measured by the CDR3 distance (CDR3 loops are shown above the V-module). (C) Matching pMHC with adequate load results in an overall tighter fit.
Appendix 1—figure 1
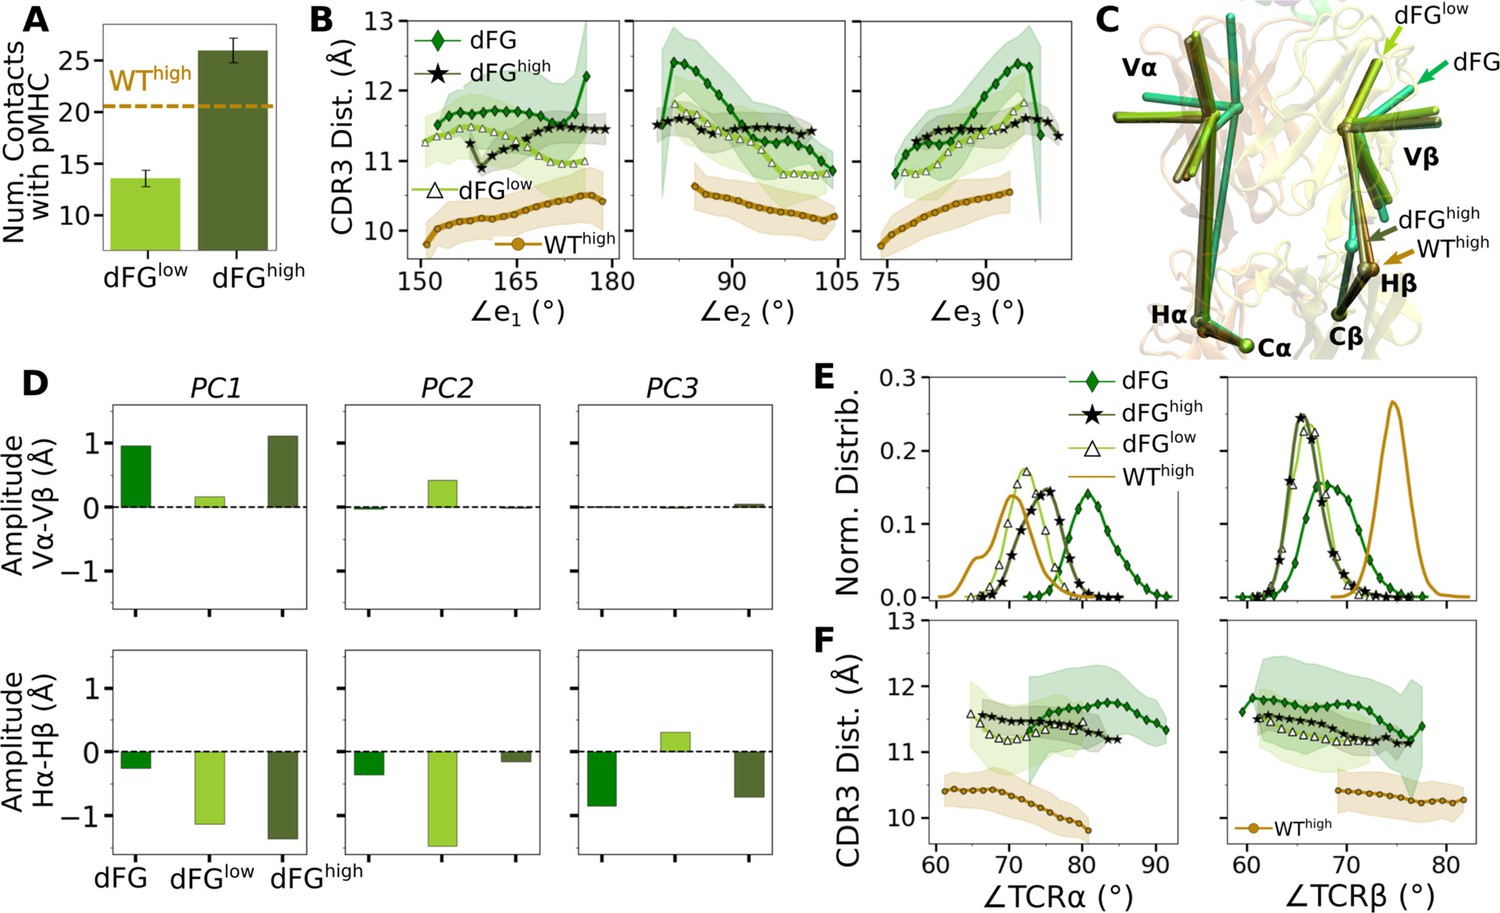
Effects of the Cβ FG-loop deletion.
In all panels, the same criteria were used to measure values as for the WT systems in the corresponding figures. For comparison, respective data for WThigh are shown. (A) Number of contacts with pMHC (Figure 3A). (B) CDR3 distance vs. the three Vα-Vβ triad arm angles (Figure 4D). (C) Average BOC of labeled complexes oriented to the C-module of WThigh. The unliganded dFG has notably different average BOC (Figure 7C and D). (D) Differences in amplitudes between respective PC components of the α and β chains (Figure 5C). (E) Histogram of hinge angles and (F) CDR3 distance vs. hinge angles (Figure 5D and E).
Appendix 1—figure 2
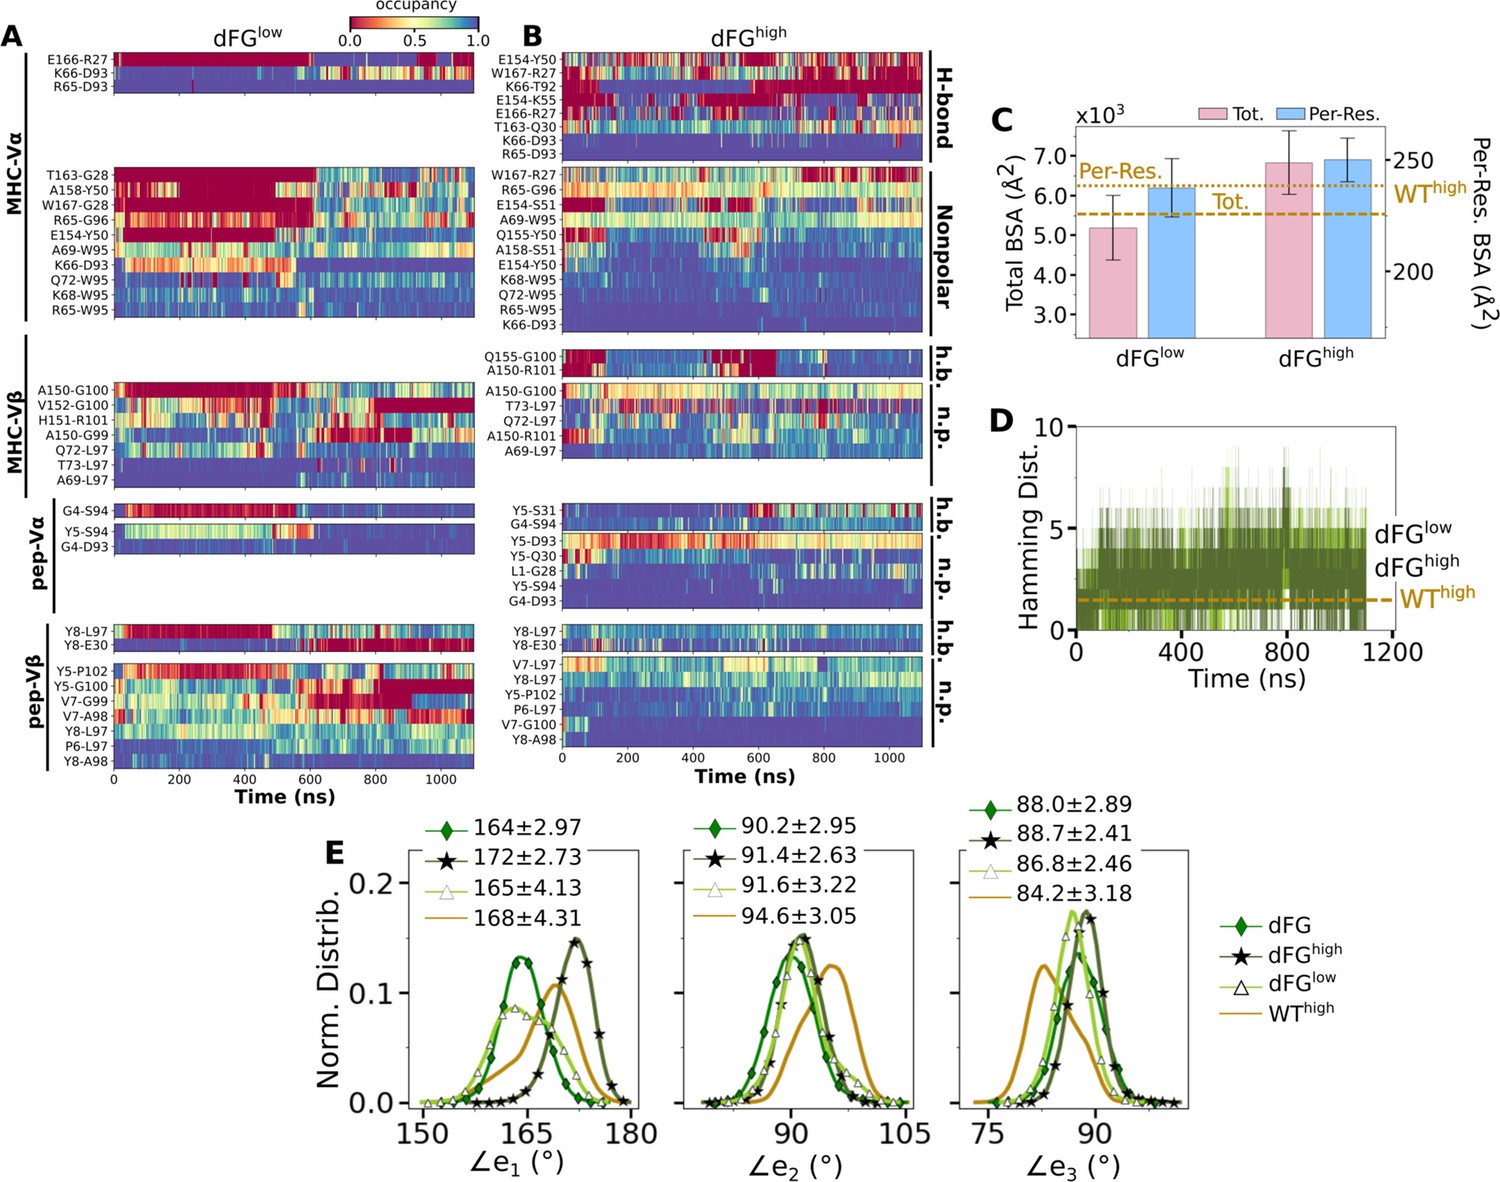
Effects of the Cβ FG-loop deletion on the interface with pMHC.
The same criteria were used to plot as for the WT systems in the corresponding figures. (A–B) Contact occupancy heat maps (Figure 3C and D). (C) BSA (Figure 3G). (D) Hamming distance (Figure 3B). (E) Distribution of Vα-Vβ angles. Numbers are avg±std in respective cases (Figure 4C). In (C–E), data for WThigh are shown as reference.
Appendix 2—figure 1
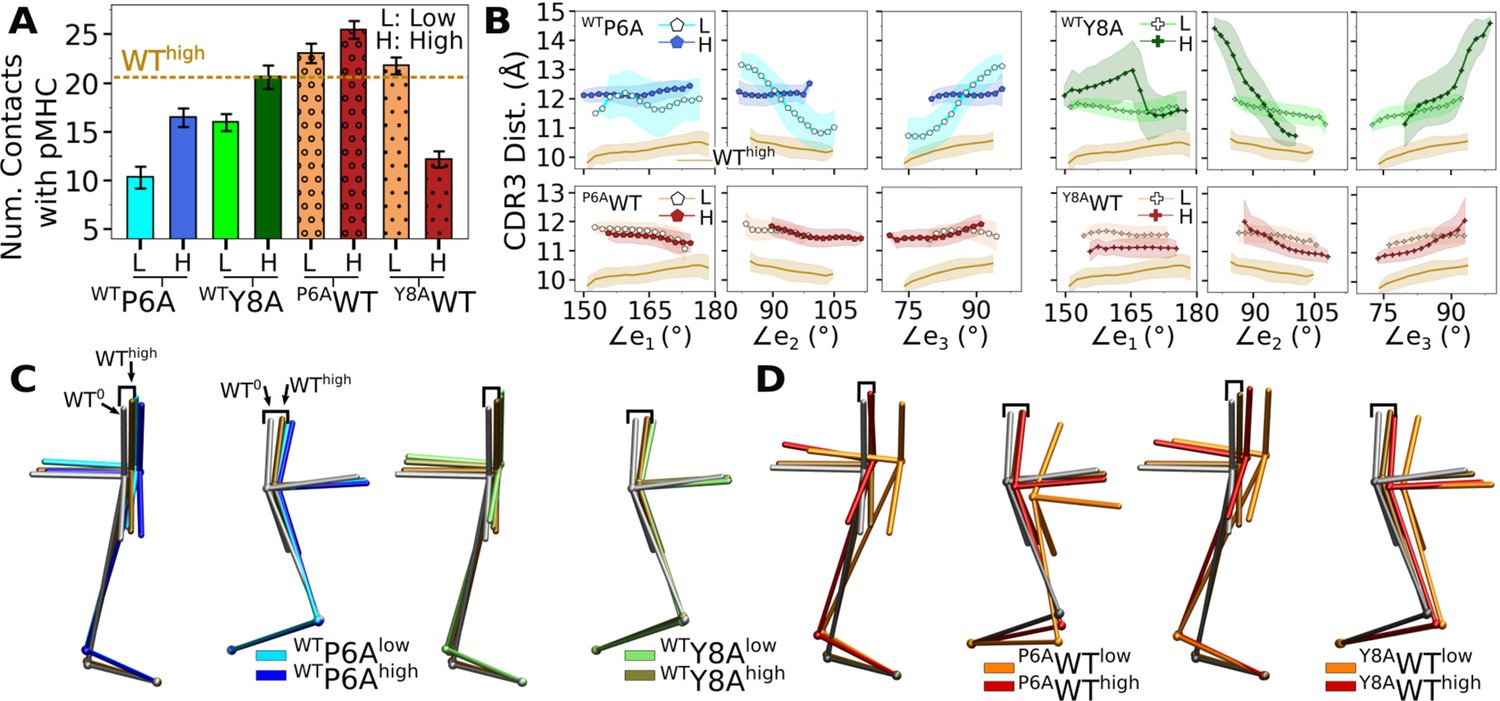
Simulations of in silico peptide mutants bound to A6.
(A) Number of contacts with pMHC. Counts were made in the same way as in Figure 3A. Dashed line: average value for WThigh. Bars: std. (B) CDR3 distance vs. triad arm angles (Figure 4D and Figure 7A and B). (C, D) Average BOCs of (C) in silico antagonists, and (D) in silico WT. Average BOCs of WT0 and WThigh are shown as reference, marked by angular brackets (Figure 7C and D).
Appendix 2—figure 2

Behaviors of in silico mutants.
(A) BSA (Figure 3G). (B) Positions of backbone Cα atoms of high contact occupancy residues (Figure 3F). (C) Vα-Vβ contact count (Figure 4A). (D) CDR3 distance trajectory (Figure 4—figure supplement 2A–C). (E) Vα-Cα and Vβ-Cβ contact counts (Figure 5—figure supplement 1).
Appendix 3—figure 1

Standard deviation vs. average force in Table 1.
Two major outliers are marked, that have the lowest number of TCRαβ-pMHC interfacial contacts among all loaded systems.
Tables
Table 1
Simulations of TCRαβ-pMHC complexes.
Load is average after 500 ns (See Selecting extensions in Computational methods). Parentheses after the average load show standard deviation (std) in forces measured in 40-ns intervals after 500 ns. The std is approximately proportional to the average force, which is a consequence of the positional restraints for applying load being in thermal equilibrium at constant temperature. Exceptions were dFGlow and Y8Alow. They had larger std relative to the average force due to the extra motion caused by the unstable TCRαβ-pMHC interface (see Appendix 3).
| Peptide | PDB | Extension (Å) | Time (ns) | Load (pN) | Label | Description |
|---|---|---|---|---|---|---|
| Tax (WT) | 1AO7 | – | 1170 | – | WT0 | wild-type |
| 182.6 | 1350 | 13.2 (5.65) | WTlow | |||
| 187.7 | 1250 | 18.2 (9.17) | WThigh | |||
| Tax (dFG-pMHC) | 1AO7 | 180.5 | 1100 | 14.9 (11.2) | dFGlow | dFG (Table 2) with pMHC |
| 188.9 | 1100 | 29.0 (11.8) | dFGhigh | |||
| Y5F | 3QFJ | – | 1180 | – | Y5F0 | modified agonists |
| 181.4 | 1200 | 8.24 (2.46) | Y5Flow | |||
| 186.2 | 1200 | 23.7 (9.16) | Y5Fhigh | |||
| V7R | 1QSE | – | 1020 | – | V7R0 | |
| 177.5 | 1012 | 10.3 (3.79) | V7Rlow | |||
| 186.2 | 1003 | 17.8 (7.55) | V7Rhigh | |||
| P6A | 1QRN | – | 1090 | – | P6A0 | weak antagonists |
| 175.2 | 1018 | 8.81 (2.77) | P6Alow | |||
| 186.0 | 1020 | 13.5 (6.20) | P6Ahigh | |||
| Y8A | 1QSF | – | 1020 | – | Y8A0 | |
| 176.5 | 1280 | 12.0 (9.79) | Y8Alow | |||
| 187.4 | 1330 | 18.1 (6.79) | Y8Ahigh |
Table 2
Simulations of truncated structures from PDB 1AO7.
| Label | Modification | Time (ns) |
|---|---|---|
| Vαβ | Vα-Vβ only (no pMHC) | 1060 |
| Tαβ | TCRαβ only (no pMHC) | 1000 |
| Vαβ-pMHC | Vαβ with pMHC (no C-module) | 1020 |
| dFG | Tαβ without the Cβ FG-loop (no pMHC) | 1000 |
Appendix 2—table 1
Simulations of TCRαβ with in silico mutations on the peptide.
Load reported is average after 500 ns. Parentheses after the average load show standard deviation in forces measured in 40-ns intervals after 500 ns.
| PDB ID | Mutation | Extension (Å) | Time (ns) | Load (pN) | Label |
|---|---|---|---|---|---|
| 1AO7 | P6A | 182.9 | 1140 | 24.7 (13.9) | WTP6Alow |
| 187.5 | 1040 | 19.5 (5.67) | WTP6Ahigh | ||
| Y8A | 182.3 | 1000 | 16.5 (5.02) | WTY8Alow | |
| 187.1 | 1000 | 28.6 (7.87) | WTY8Ahigh | ||
| 1QRN | A6P | 175.2 | 1000 | 10.9 (6.09) | P6AWTlow |
| 186.2 | 1060 | 31.8 (7.57) | P6AWThigh | ||
| 1QSF | A8Y | 176.7 | 1000 | 10.0 (5.89) | Y8AWTlow |
| 187.4 | 1040 | 11.5 (5.85) | Y8AWThigh |
Additional files
Download links
A two-part list of links to download the article, or parts of the article, in various formats.
Downloads (link to download the article as PDF)
Open citations (links to open the citations from this article in various online reference manager services)
Cite this article (links to download the citations from this article in formats compatible with various reference manager tools)
Asymmetric framework motion of TCRαβ controls load-dependent peptide discrimination
eLife 13:e91881.
https://doi.org/10.7554/eLife.91881


