Effect of α-tubulin acetylation on the doublet microtubule structure
- Department of Anatomy and Cell Biology, McGill University, Canada
- Department of Cellular Biology, University of Georgia, United States
- Centre de Recherche en Biologie Structurale, McGill University, Canada
Figures
Figure 1 with 2 supplements
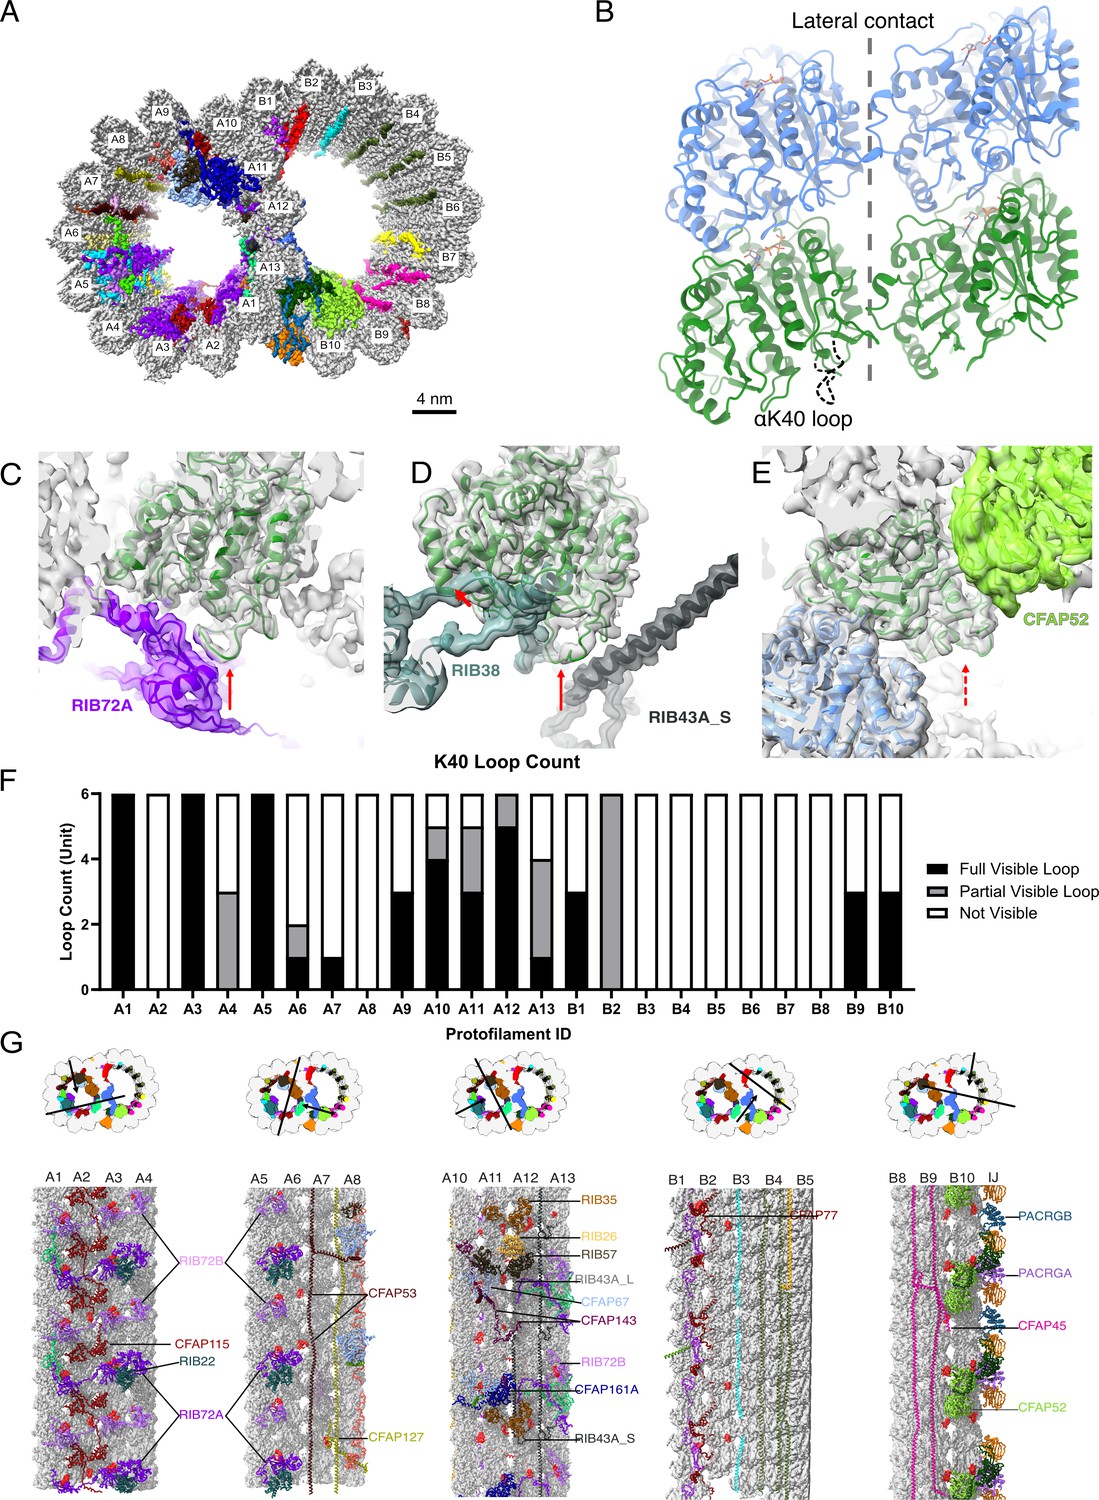
The presence of the structure αK40 loops in Tetrahymena thermophila doublet microtubule (DMT).
(A) Surface rendering of the DMT viewed from the tip of the cilia, with microtubule inner proteins (MIPs) colored in the 48nm repeat cryo-EM electron density map of Tetrahymena. (B) Relative location of the αK40 loop (dashed black line) and the lateral contacts of tubulins. Color: α-tubulin, green; β-tubulin, blue. Cryo-EM map and models of the fully structured αK40 loops in protofilament (PF) A3 (C, D) and the fully structured (E) and partially structured αK40 loops in PF B10. The full red arrows point to the location of the αK40 loops, and dashed red arrow points to the location of the partial αK40 loops. (F) Bar graph showing the composition of visible full (missing no more than two residues from residues 37 to 48) and partial loops (missing 3–5 residues) in both the A- and B-tubules. (G) 48nm repeat surface renderings of selected PFs with MIPs that interact with visible full and partial αK40 loops colored in red, indicating that αK40 loops are structured in regions with many MIPs.
Figure 1—figure supplement 1
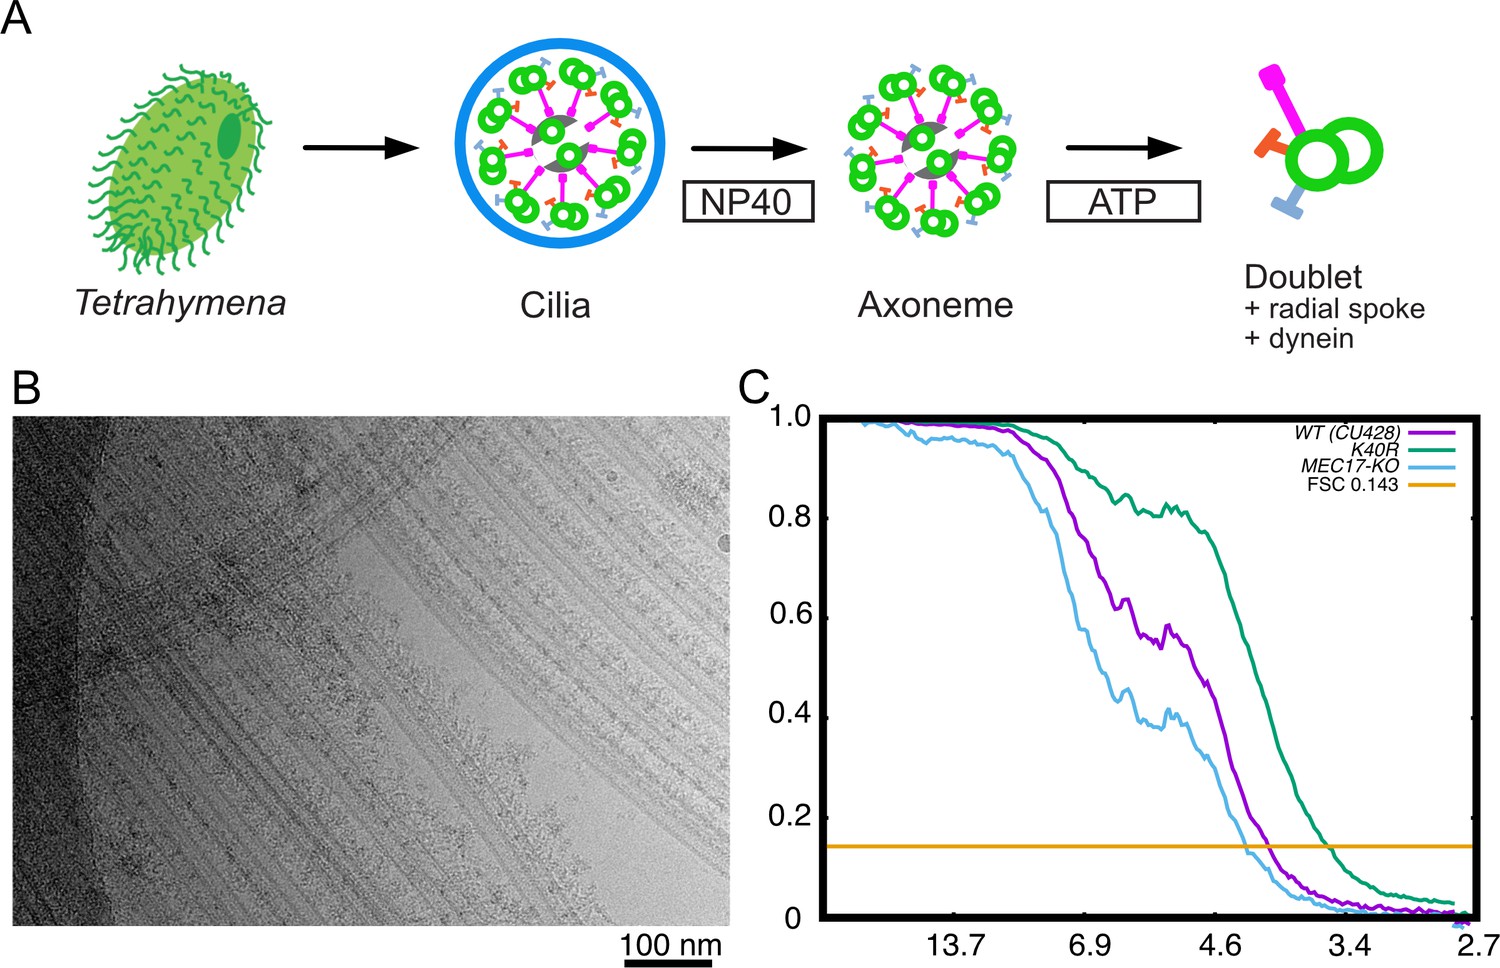
Purification and structure determination of doublet microtubule (DMT).
(A) Purification scheme of the axoneme in this study. (B) A typical cryo-EM image of the Tetrahymena DMT. (C) Gold-standard Fourier shell correlation of the 48 nm repeat cryo-EM maps of the WT, K40R, and MEC17-KO Tetrahymena strains.
Figure 1—figure supplement 2
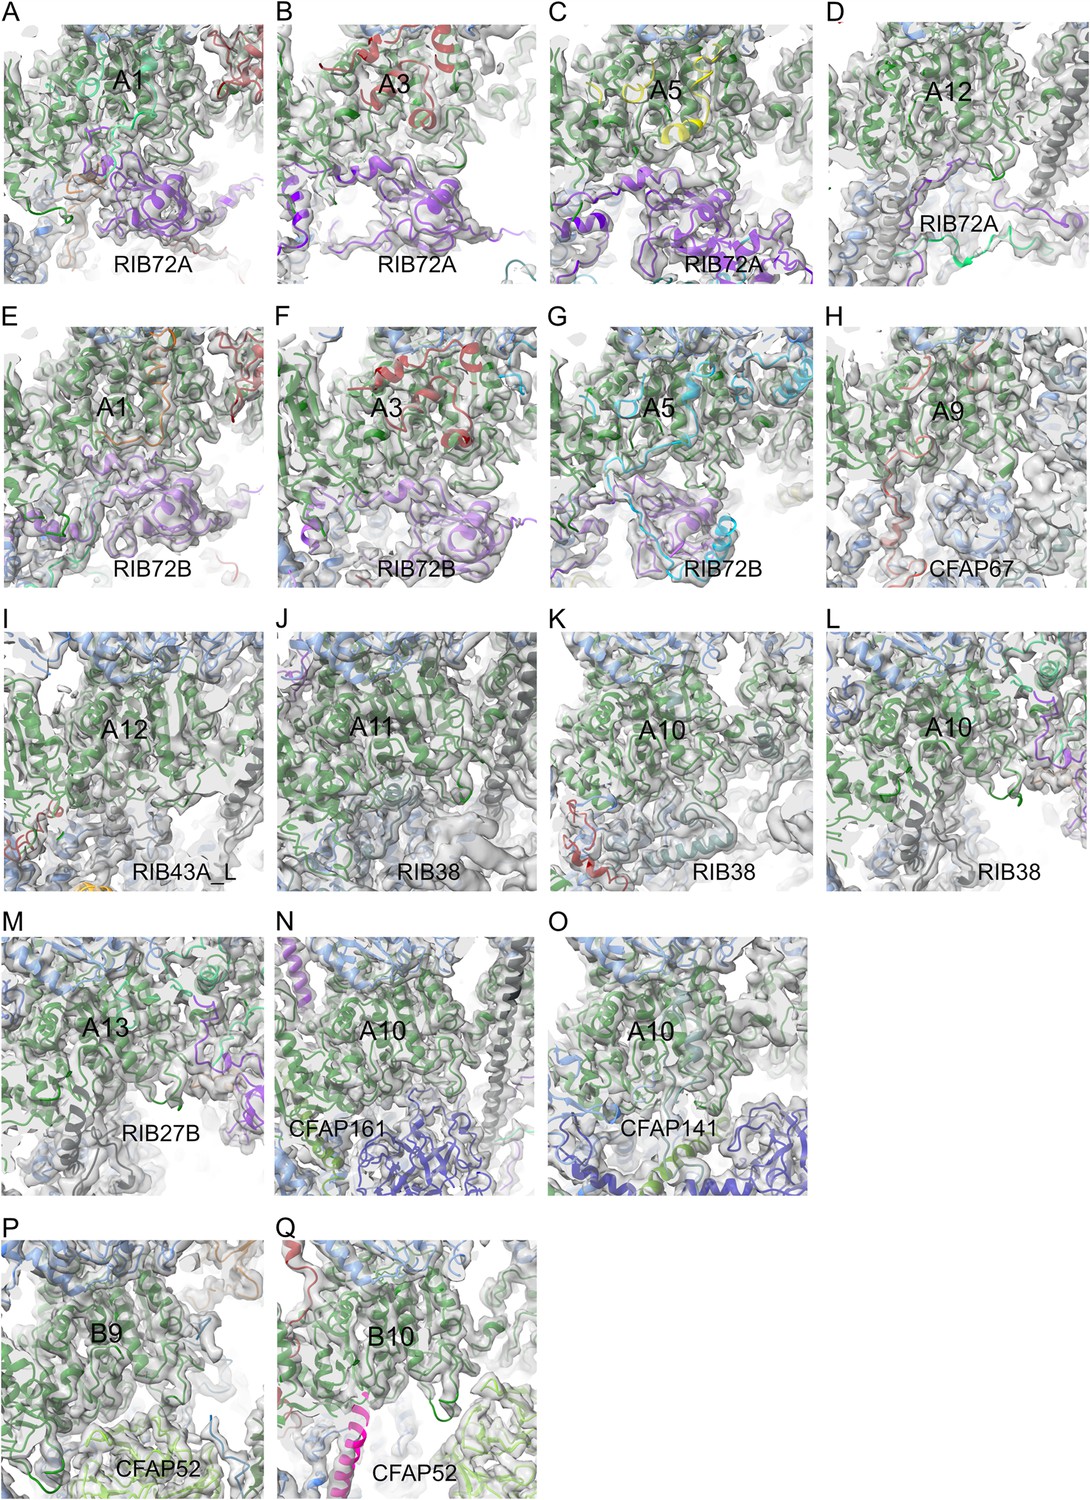
Diverse structures of the αK40 loops.
(A–Q) Cryo-EM maps and models of partial and full αK40 loops interacting with different microtubule inner proteins (MIPs).
Figure 2
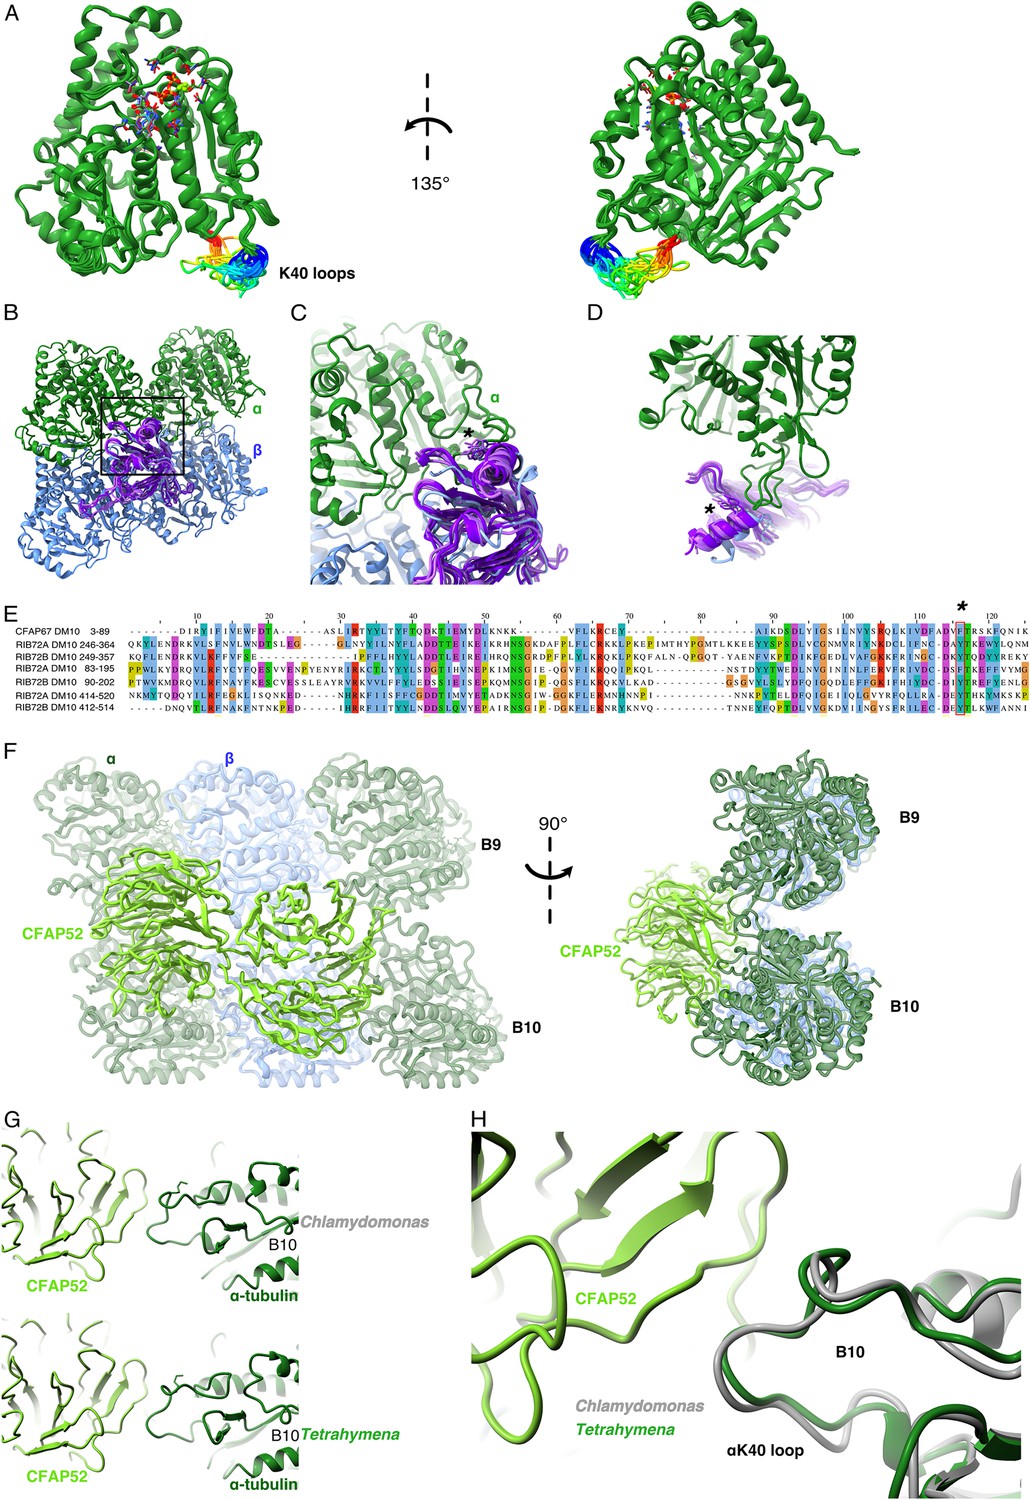
Comparison of αK40 loop conformation.
(A) Superimposed view of all the orientations of all the visible full and partial αK40 loops, showing their orientation. (B) Interaction of αK40 loop and DM10 domains from RIB72A (three domains, blue), RIB72B (three domains, purple), and CFAP67 (one domain, cyan). Black box represents the view in (C). (C) Zoom in view of DM10 domains and αK40 loop interaction. Asterisk (*) denotes the conserved aromatic residue potentially interact with the αK40 loop. (D) Alternative view of DM10 domains interacting with αK40 loop. (E) Multiple sequence alignment of DM10 domains from RIB72A, RIB72B, and CFAP67. (F) Cryo-EM map (left) and model (right) of the inner junction region of Tetrahymena to show the interaction of the full αK40 loop with CFAP52. (G) Cryo-EM map (left) and model (right) of the inner junction region of Chlamydomonas to show the interaction of the full αK40 loop with CFAP52. (H) Superimposed view of the Chlamydomonas αK40 loop (gray) onto the Tetrahymena αK40 loop of B10.
Figure 3 with 1 supplement
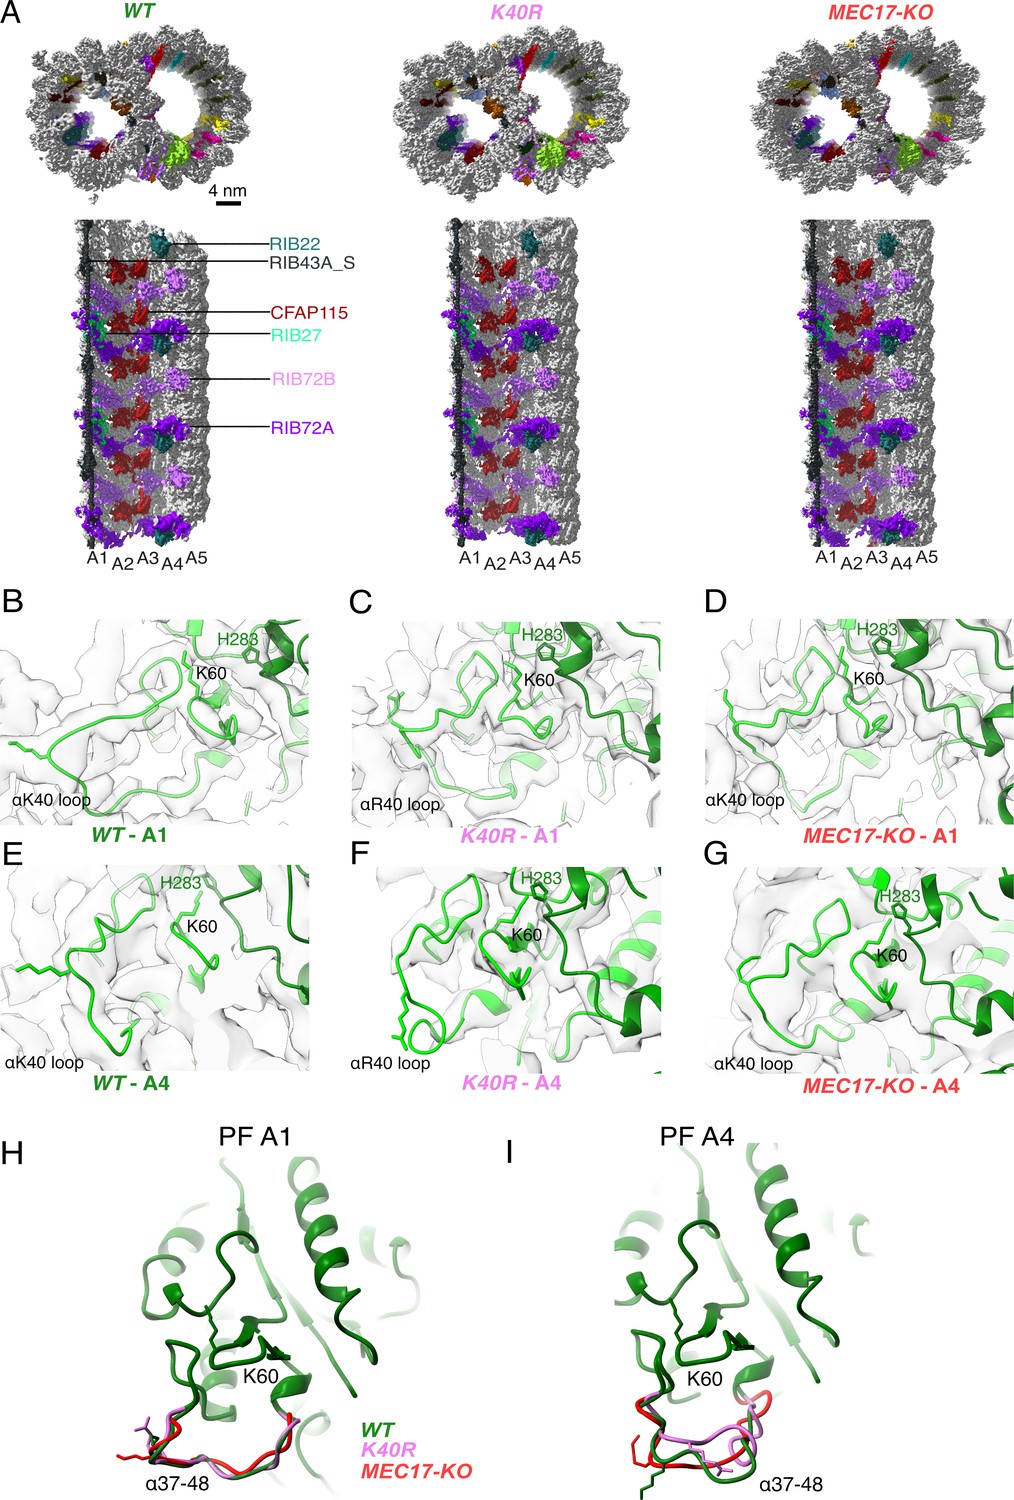
Comparison of doublet microtubule (DMT) structures from WT, MEC17-KO, and K40R mutants.
(A) Comparison of the cryo-EM density maps of the DMT from WT, K40R, and MEC17-KO strains of Tetrahymena to show that the microtubule inner proteins (MIPs) are intact in all three species. Models of the full αK40 loops in protofilament (PF) A1 (B–D) and PF A4 (E–G) from WT, K40R, and MEC17-KO strains. Models of the αK40 loops from A1 (H) and A4 (I) superimposed from WT, K40R, and MEC17-KO species.
Figure 3—figure supplement 1

Decoration of microtubule inner proteins (MIPs) are similar in 48 nm cryo-EM maps of the doublet microtubule (DMT) from WT, K40R, and MEC17-KO.
(A) View from inside the A-tubule. (B) View from inside the B-tubule.
Figure 4 with 2 supplements
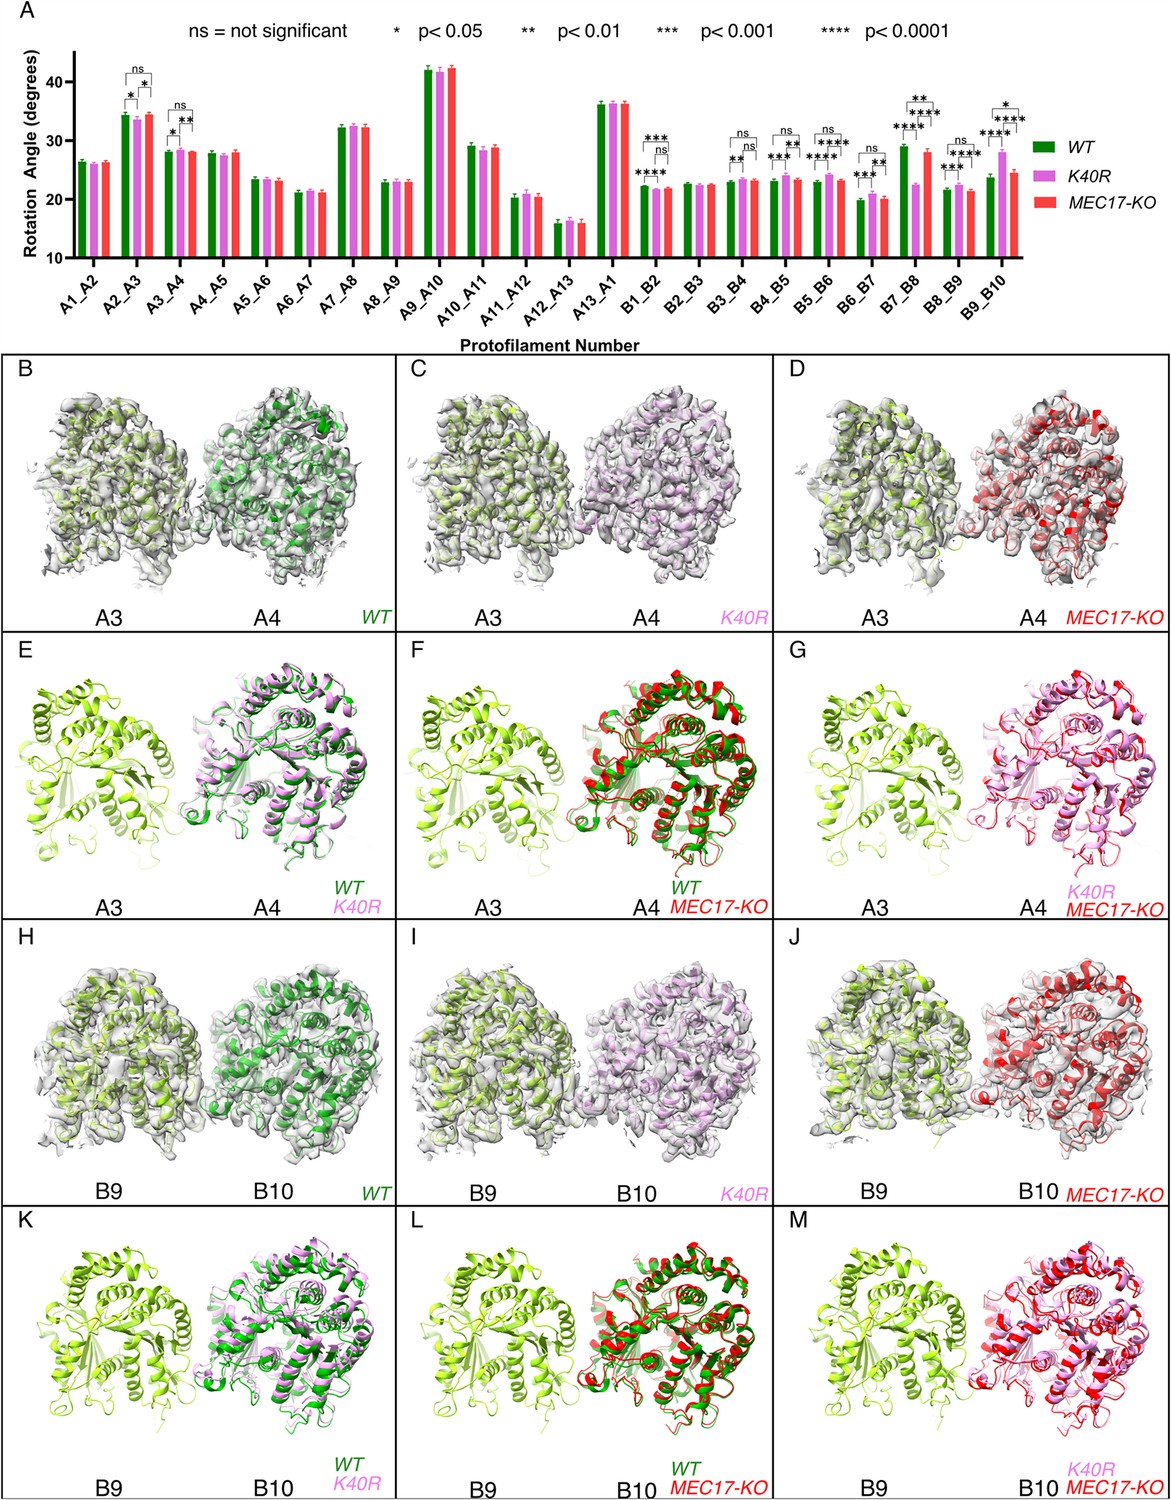
Deacetylation affects the inter-protofilament (PF) angles in the doublet microtubule (DMT).
(A) Inter-PF rotation angles for each PF across all three strains (WT, K40R, and MEC17-KO) measured from six different pairs of tubulin dimers along the 48 nm repeat of the DMT. (B–G) Comparison of inter-PF rotation angle change between A3 and A4, showing minor changes. (H–M) Comparison of inter-PF rotation angle change between B9 and B10, showing significant changes.
Figure 4—figure supplement 1

Tubulin lattice measurement from the doublet microtubule (DMT) from WT, K40R, and MEC17-KO Tetrahymena species.
(A) Inter-protofilament (PF) rotation angle between A-tubule PF pairs measured from 6 different pairs of tubulin dimers along the 48 nm repeat of the DMT. (B) Inter-PF rotation angle between B-tubule PF pairs measured from six different pairs of tubulin dimers along the 48 nm repeat of the DMT. For (A) and (B), normality was assessed with a Shapiro–Wilk test. Unpaired t tests or Mann–Whitney tests were carried out for each angle between both WT and K40R groups separately. One-way analysis of variance (ANOVA) or Kruskal–Wallis tests were carried out for each angle between combined WT points, combined K40R points, and MEC17-KO points. ns: not significant, *p-value <0.05, **<0.01, ***<0.001, and ****<0.0001. (C) Interdimer distance within the same PF measured from six different pairs of tubulin dimers along the 48 nm repeat of the six different pairs of tubulin dimers along the 48 nm repeat of the cryo-EM maps of the DMT from WT, K40R, and MEC17-KO Tetrahymena species.
Figure 4—figure supplement 2
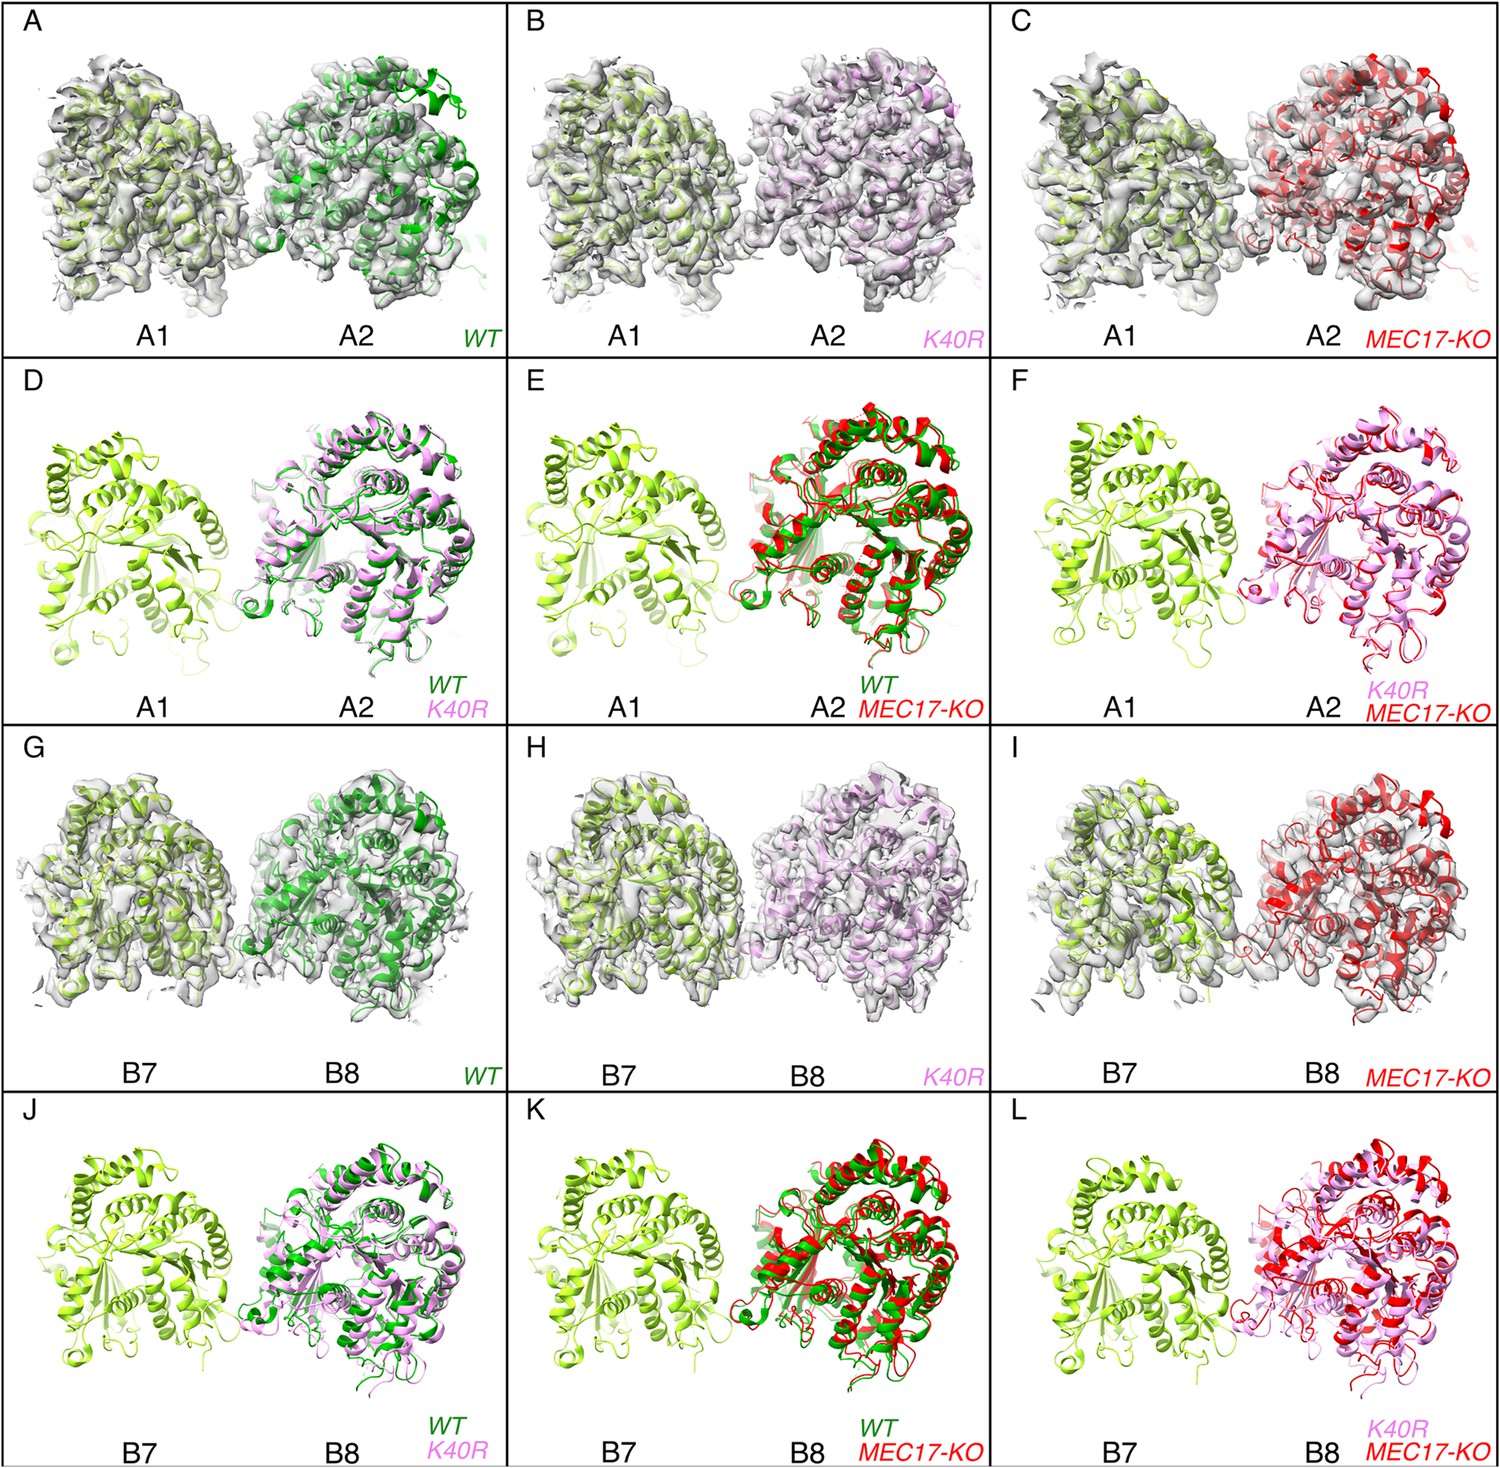
Deacetylation affects the inter-protofilament (PF) angles in the doublet microtubule (DMT).
(A–F) Comparison of inter-PF rotation angle change between A1 and A2, showing statistically non-significant changes. (G–L) Comparison of inter-PF rotation angle change between B7 and B8, showing significant changes.
Figure 5
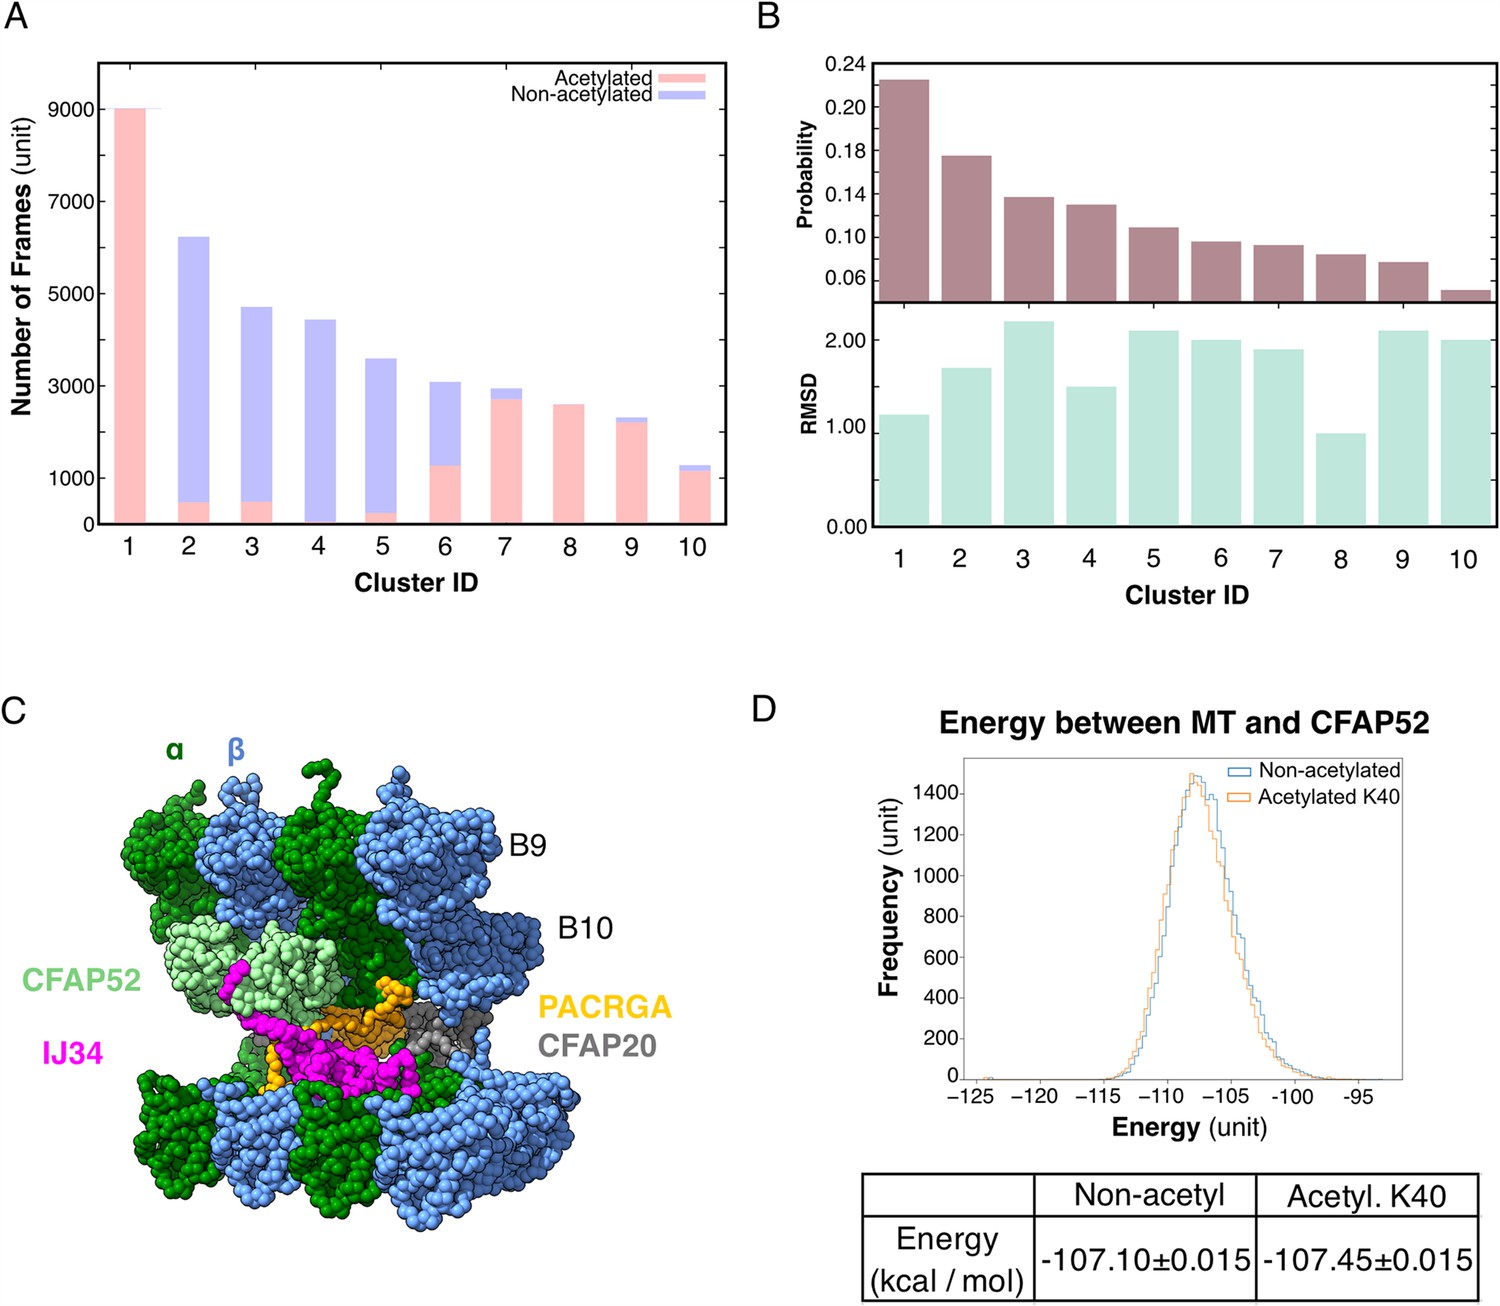
Molecular dynamic simulations of the acetylated and non-acetylated αK40 loops.
(A) All-atom simulations of αK40 loop clusters in different conformations of acetylated (pink) and base/non-acetylated (blue) indicate that acetylated conformations adopt higher frames and are less flexible. (B) Root Mean Square Deviation (RMSD) and probability of each cluster simulated in A. (C) Molecular dynamics coarse grain model of the inner junction region of Tetrahymena; each amino acid is 1 bead. (D) Graph showing the energy difference (in kcal/mol) between base (non-acetylated) and acetylated αK40 to show that each acetylated αK40 has slightly lower energy than the non-acetylated αK40.
Figure 6 with 1 supplement
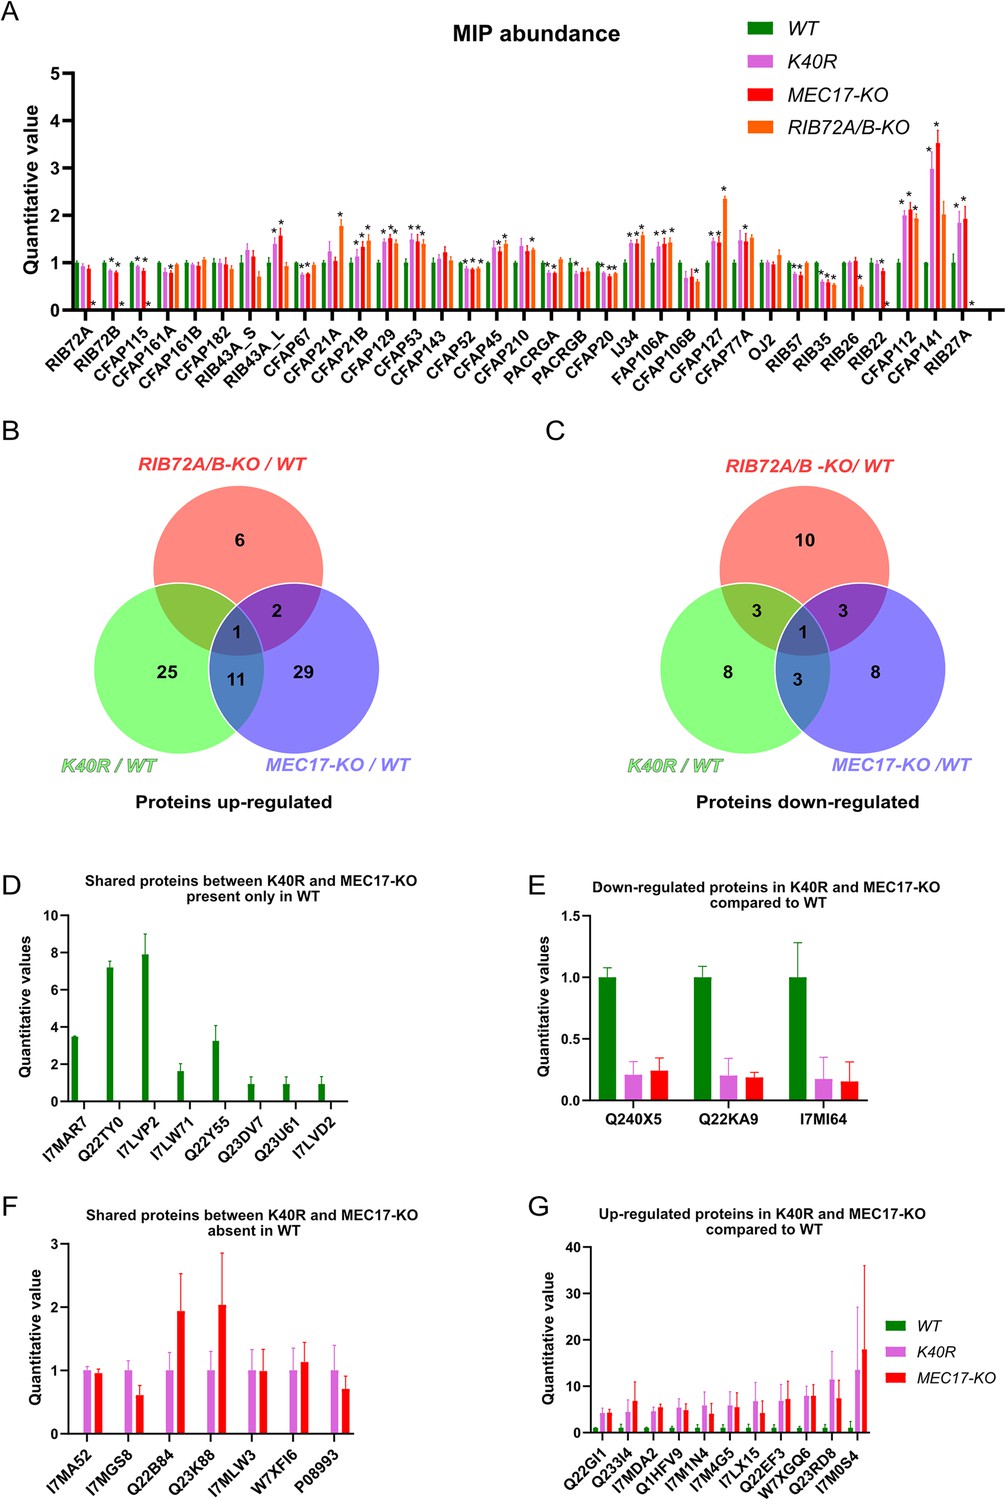
Mass spectrometry of WT, K40R, and MEC17-KO mutants.
(A) Bar graph showing the abundance of microtubule inner proteins (MIPs) based upon quantitative values (normalized total spectra) from mass spectrometry (n = 3 biological replicates). Asterisk (*) indicates a significant difference with p < 0.05. (B) Proteins upregulated in RIB72A/B, K40R, and MEC17-KO mutants compared with the WT. (C) Proteins downregulated in RIB72A/B, K40R, and MEC17-KO mutants compared to the WT. (D) Proteins only found in the mass spectrometry of WT when compared with K40R and MEC17-KO mutants. (E) Downregulated proteins in both K40R and MEC17-KO mutants compared to WT. (F) Proteins in both K40R and MEC17-KO mutants but are absent in WT. (G) Upregulated proteins in both K40R and MEC17-KO mutants compared to WT.
Figure 6—figure supplement 1
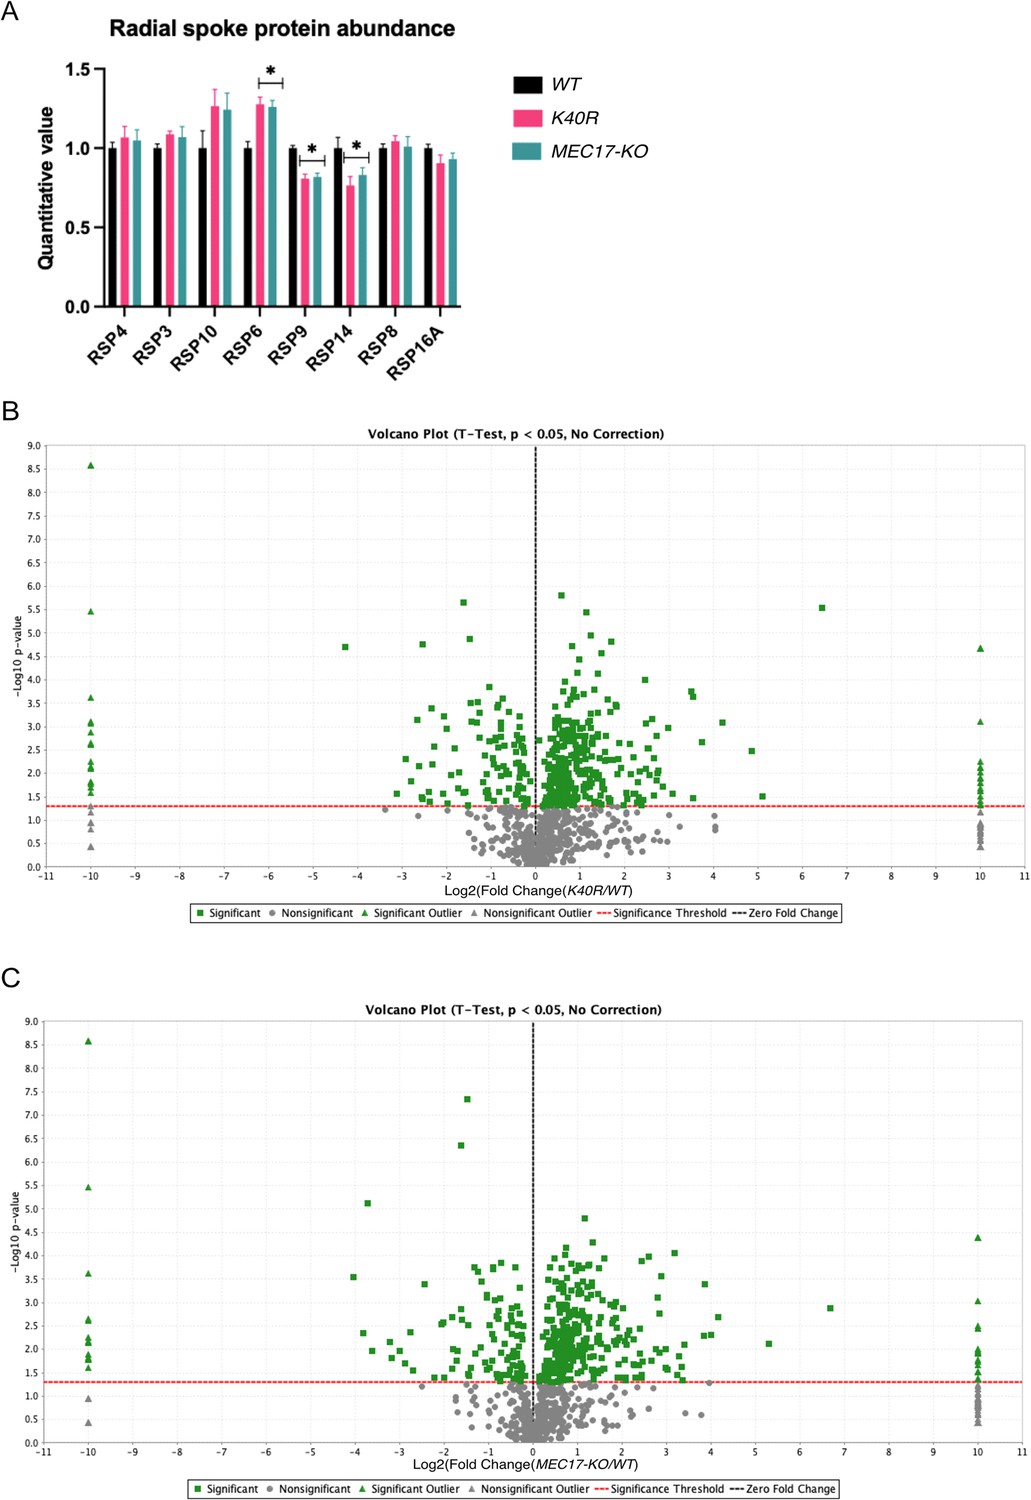
Mass spectrometry analysis of WT, K40R, and MEC17-KO (A) Radial spoke protein abundance in mass spectrometry triplicates of WT, K40R, and MEC17-KO Tetrahymena species (n = 3 biological replicates).
Asterisk (*) indicates a significant difference with p < 0.05. (B) Volcano plot showing up- and downregulated proteins in K40R mutants compared against WT, y-axis showing the −log10 p values, and x-axis showing the log2-fold change where negative and positive values suggest potential downregulation and upregulation, respectively. (C) Volcano plot showing up- and downregulated proteins in MEC17-KO mutants compared to WT.
Figure 7
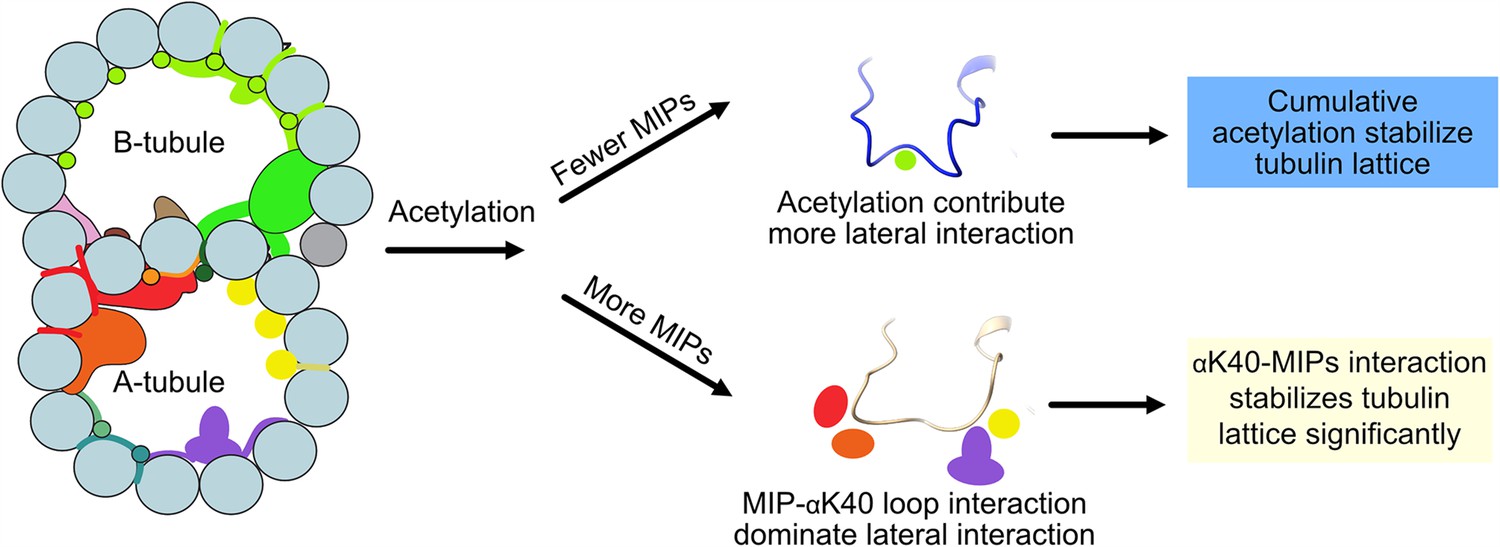
Models of acetylation contribution in the DMT In the case of more microtubule inner proteins (MIPs), such as in the A-tubule, the MIP–αK40 interaction dominates the contribution to the lateral interaction; therefore, deacetylation does not affect the structures significantly.
With fewer MIPs, such as in the B-tubule, acetylation contribution to the lateral interaction becomes significant and therefore can contribute to the stabilization of the tubulin lattice.
Tables
Table 1
Cryo-EM data collection and processing parameters for all datasets used in this study.
| WT (CU428) | K40R | MEC17-KO | |||
|---|---|---|---|---|---|
| Dataset | Dataset 1 | Dataset 2 | Dataset 1 | Dataset 2 | Dataset 1 |
| Microscope | Titan Krios | Titan Krios | Titan Krios | Titan Krios | Titan Krios |
| Electron detector | Gatan K3 | Gatan K3 | Gatan K3 | Gatan K3 | Gatan K3 |
| Zero-loss filter (eV) | 30 | 30 | 30 | 30 | 30 |
| Magnification | 64,000 | 64,000 | 64,000 | 64,000 | 64,000 |
| Voltage | 300 | 300 | 300 | 300 | 300 |
| Electron exposure | 45 e/A2 | 45 e/A2 | 73 e/A2 | 45 e/A2 | 45 e/A2 |
| Defocus range | 1.0–3.0 μm | 1.0–3.0 μm | 1.0–3.0 μm | 1.0–3.0 μm | 1.0–3.0 μm |
| Pixel size | 1.37 | 1.37 | 1.37 | 1.37 | 1.37 |
| Symmetry imposed | C1 | C1 | C1 | C1 | C1 |
| Movies acquired | 4080 | 14,304 | 4400 | 21,210 | 4283 |
| Particles number | 40,945 | 125,306 | 30,352 | 152,303 | 39,417 |
| Global resolution (Å) | 4.51 | 4.26 | 4.0 | 3.6 | 4.5 |
| Local resolution (Å) | 3.6–4.0 | 3.3–3.5 | 4.0–4.5 | ||
Table 2
Refinement statistics of WT, K40R, and MEC17-KO 48 nm models.
| WT (CU428) | K40R | MEC17-KO | |
|---|---|---|---|
| Model-to-map fit, CCmask | 0.8009 | 0.7961 | 0.6070 |
| All-atom clashscore | 16.61 | 13.21 | 57.06 |
| Ramachandran plot Outliers [%] Allowed [%] Favored [%] | 0.14 3.70 96.16 | 0.14 3.60 96.26 | 0.14 6.13 93.73 |
| Rotamer outliers [%] | 0.03 | 0.04 | 0.02 |
| Cbeta deviations [%] | 0.00 | 0.00 | 0.01 |
| Cis-proline [%] | 4.56 | 4.56 | 4.54 |
| Cis-general [%] | 0.01 | 0.01 | 0.03 |
| Twisted proline [%] | 0.17 | 0.18 | 0.13 |
| Twisted general [%] | 0.02 | 0.01 | 0.02 |
-
Supplementary data for cryo-EM observation and mass spectrometry.
Additional files
-
Supplementary file 1
Counts of K40 loops from the wildtype structure, measurement of the tubulin lattices in wildtype and acetylation mutant cells and the proteins downregulated and upregulated in acetylation mutant cells.
(a) Count of full, partial, and missing αK40 loops based upon the K40R cryo-EM density maps, along with possible microtubule inner protein (MIP) interactions for αK40 loops in each protofilament (PF). (b) Inter-PF angles between subsequent PF obtained from cryo-EM maps of WT, K40R, and MEC17-KO Tetrahymena cilia. (c) Analysis of variance (ANOVA) test p values and significance of the interdimer distances of tubulin subunits within each PF in WT, K40R, and MEC17-KO Tetrahymena cilia. (d) Proteins upregulated at least twofold in the K40R mutant compared to WT. (e) Proteins upregulated least twofold in the MEC17-KO mutant compared to the WT. (f) Proteins downregulated at least twofold in the K40R mutant compared to the WT. (g) Proteins downregulated at least twofold in the MEC17-KO mutant compared to the WT.
- https://cdn.elifesciences.org/articles/92219/elife-92219-supp1-v1.docx
-
MDAR checklist
- https://cdn.elifesciences.org/articles/92219/elife-92219-mdarchecklist1-v1.pdf
Download links
A two-part list of links to download the article, or parts of the article, in various formats.
Downloads (link to download the article as PDF)
Open citations (links to open the citations from this article in various online reference manager services)
Cite this article (links to download the citations from this article in formats compatible with various reference manager tools)
Effect of α-tubulin acetylation on the doublet microtubule structure
eLife 12:RP92219.
https://doi.org/10.7554/eLife.92219.3


