PCBP2 as an intrinsic agi ng factor regulates the senescence of hBMSCs through the ROS-FGF2 signaling axis
- Spine Center, Xinhua Hospital, Shanghai Jiaotong University School of Medicine, China
Figures
Figure 1
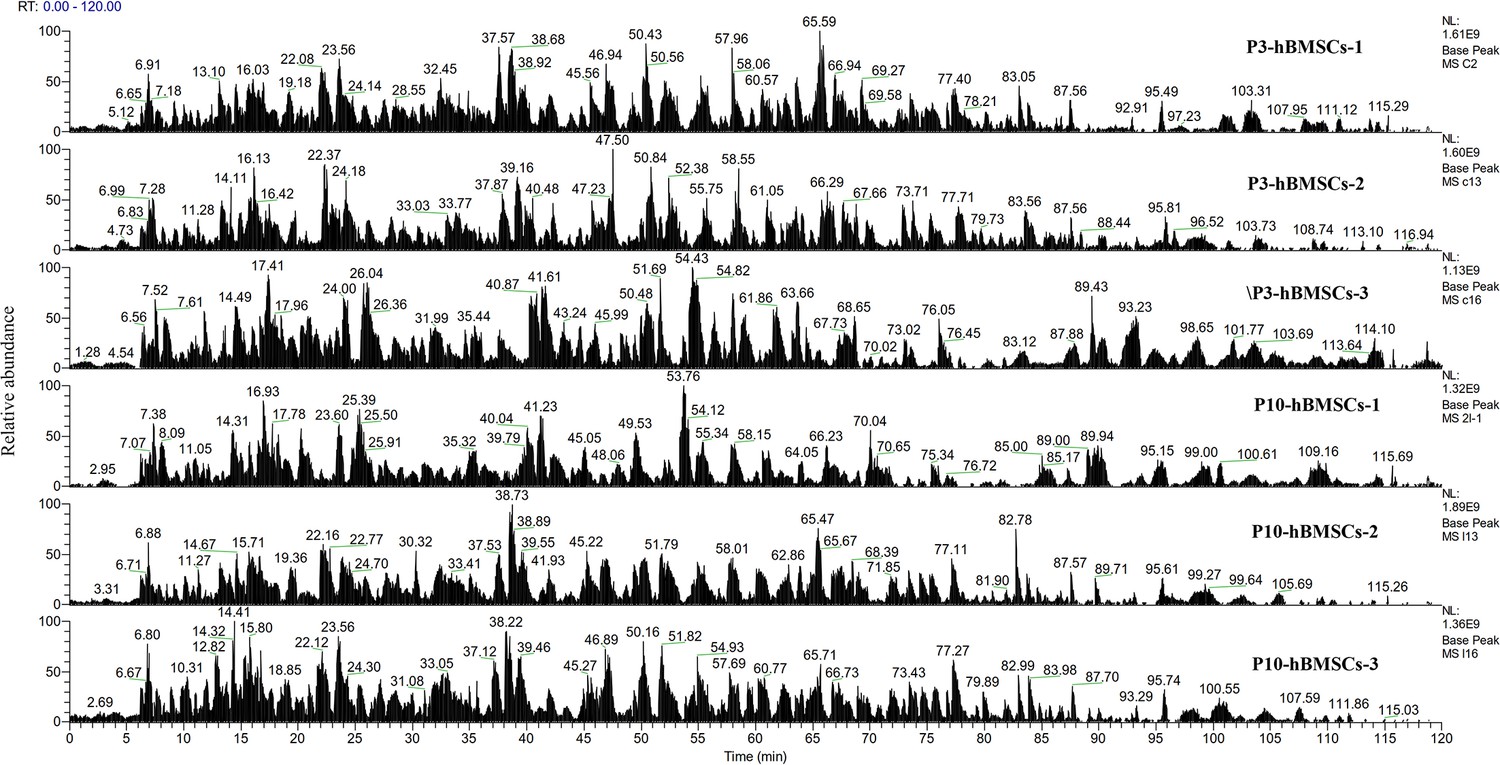
Unlabeled quantitative proteomics for the differentially expressed proteins (DEPs) between P3-human bone marrow mesenchymal stromal cells (hBMSCs) and P10-hBMSCs.
The enzymolysis products were separated by capillary high-performance liquid chromatography and then analyzed by Thermo Fisher Fusion Mass Spectrometer (Thermo Fisher). The content of each peptide was expressed by detecting the intensity of positive ions, and protein analysis was performed using MaxQuant software (version number 1.6.0.1).
Figure 2
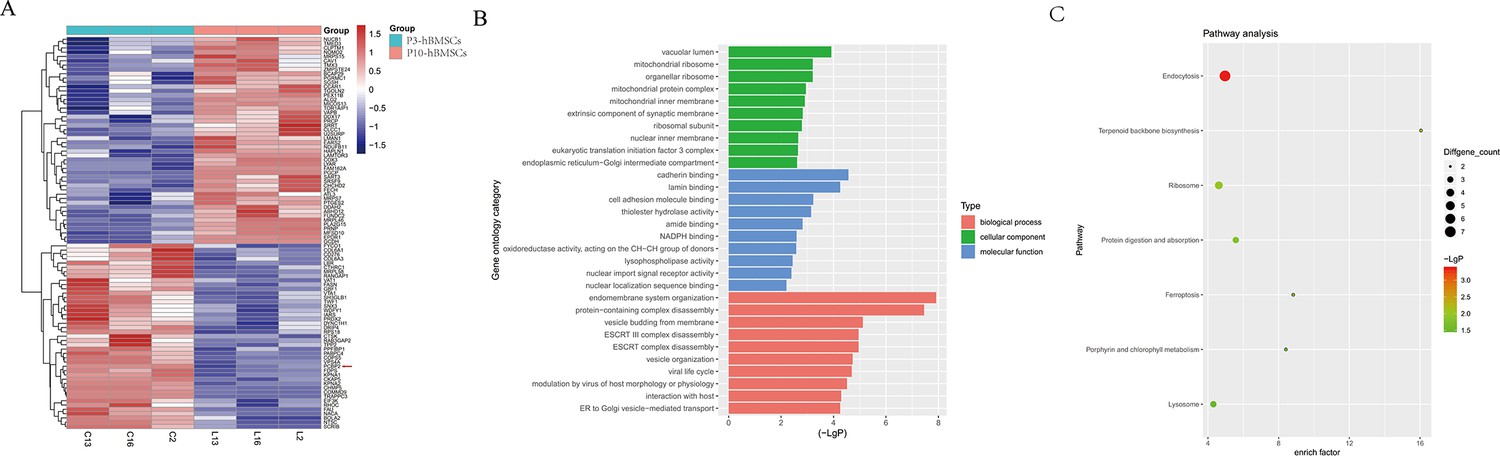
Differentially expressed proteins (DEPs) in replication senescent human bone marrow mesenchymal stromal cells (hBMSCs) and their biological functions.
(A) A hub of 50 significantly DEPs induced by replication aging were shown as a heatmap. Gene Ontology (GO) functions (B) and Kyoto Encyclopedia of Genes and Genomes (KEGG) pathways (C) affected by these 50 DEPs. Notes: p<0.05 and logFC≥2 was regarded as indicating significance.
Figure 3
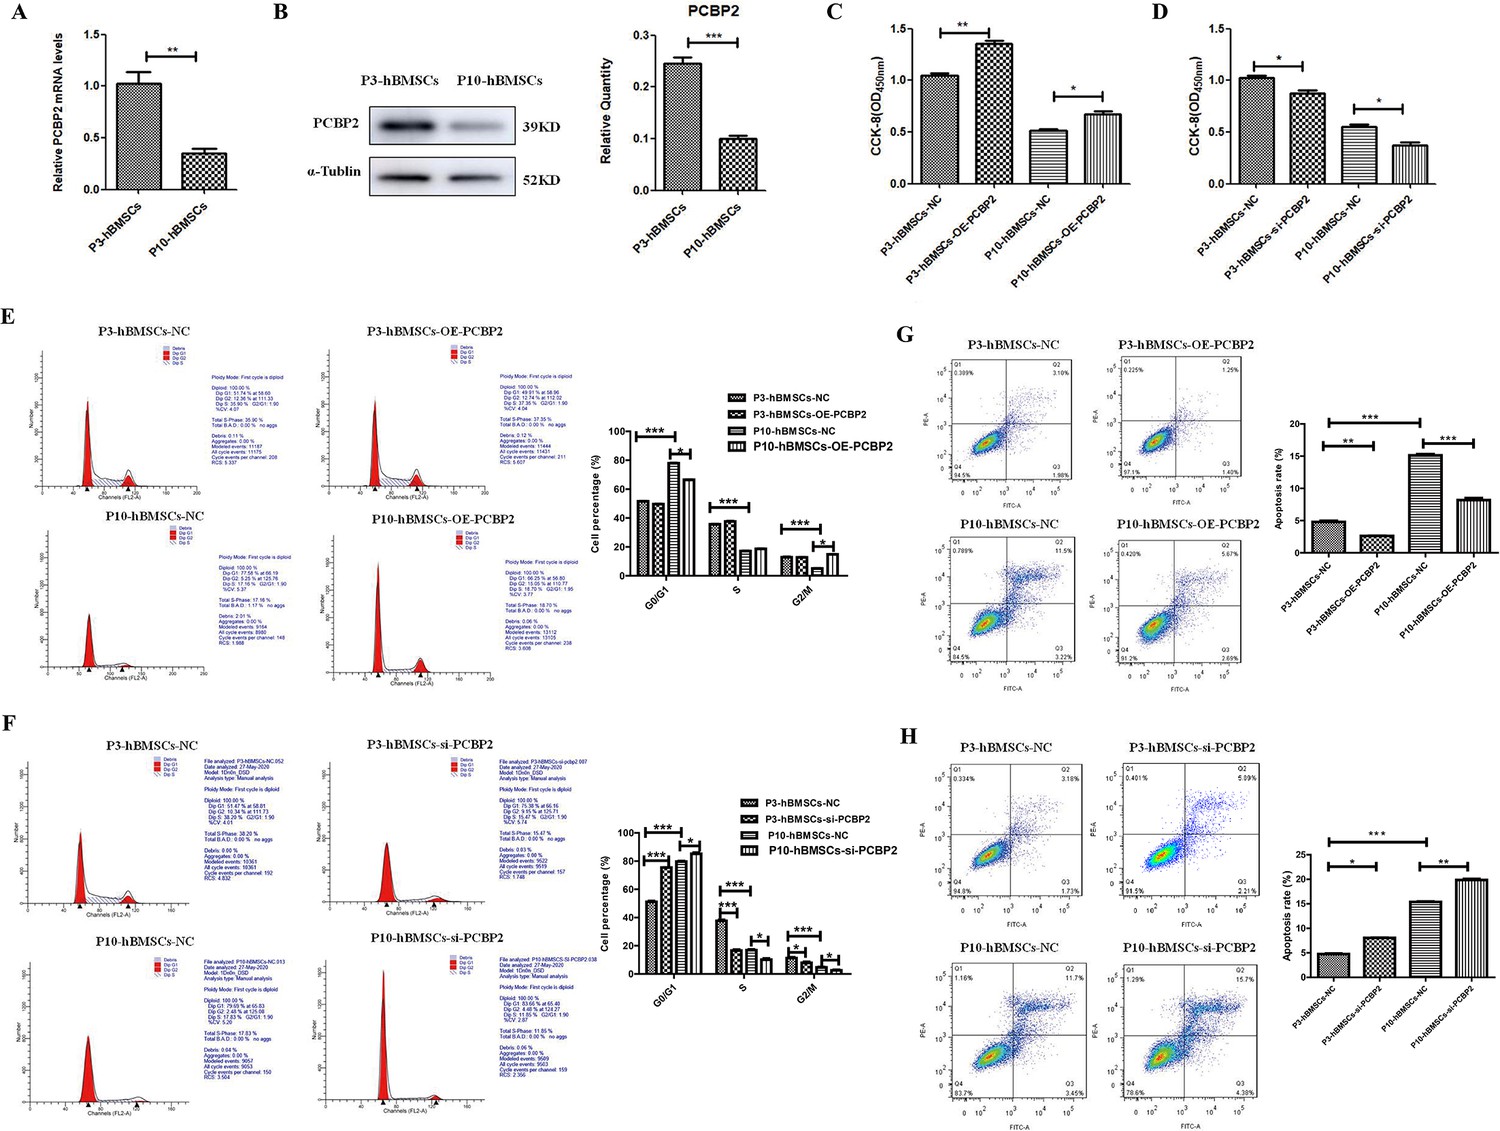
Low expression of PCBP2 accentuated the characteristics of cell senescence in human bone marrow mesenchymal stromal cells (hBMSCs).
(A) Real-time PCR (RT-PCR) and (B) western blotting (WB) detection for the expression of PCBP2 in P3-hBMSCs and P10-hBMSCs. Cell Counting Kit-8 (CCK-8) assay for the effects of PCBP2 overexpression (C) and PCBP2 silencing (D) on the proliferation of P3-hBMSCs and P10-hBMSCs. Flow cytometry detection for the effects of PCBP2 overexpression (E) and PCBP2 silencing (F) on the cell cycle of P3-hBMSCs and P10-hBMSCs. The effects of PCBP2 overexpression (G) and PCBP2 silencing (H) on apoptosis of P3-hBMSCs and P10-hBMSCs were also detected by flow cytometry. Data were presented as mean ± SD (n=3). *p<0.05, **p<0.01, and ***p<0.001; β-actin and α-tubulin were used as the internal references for mRNA and protein detection.
-
Figure 3—source data 1
Original files for western blot analysis displayed in Figure 3B.
- https://cdn.elifesciences.org/articles/92419/elife-92419-fig3-data1-v1.zip
-
Figure 3—source data 2
File containing original western blots for Figure 3B, indicating the relevant bands.
- https://cdn.elifesciences.org/articles/92419/elife-92419-fig3-data2-v1.zip
Figure 4
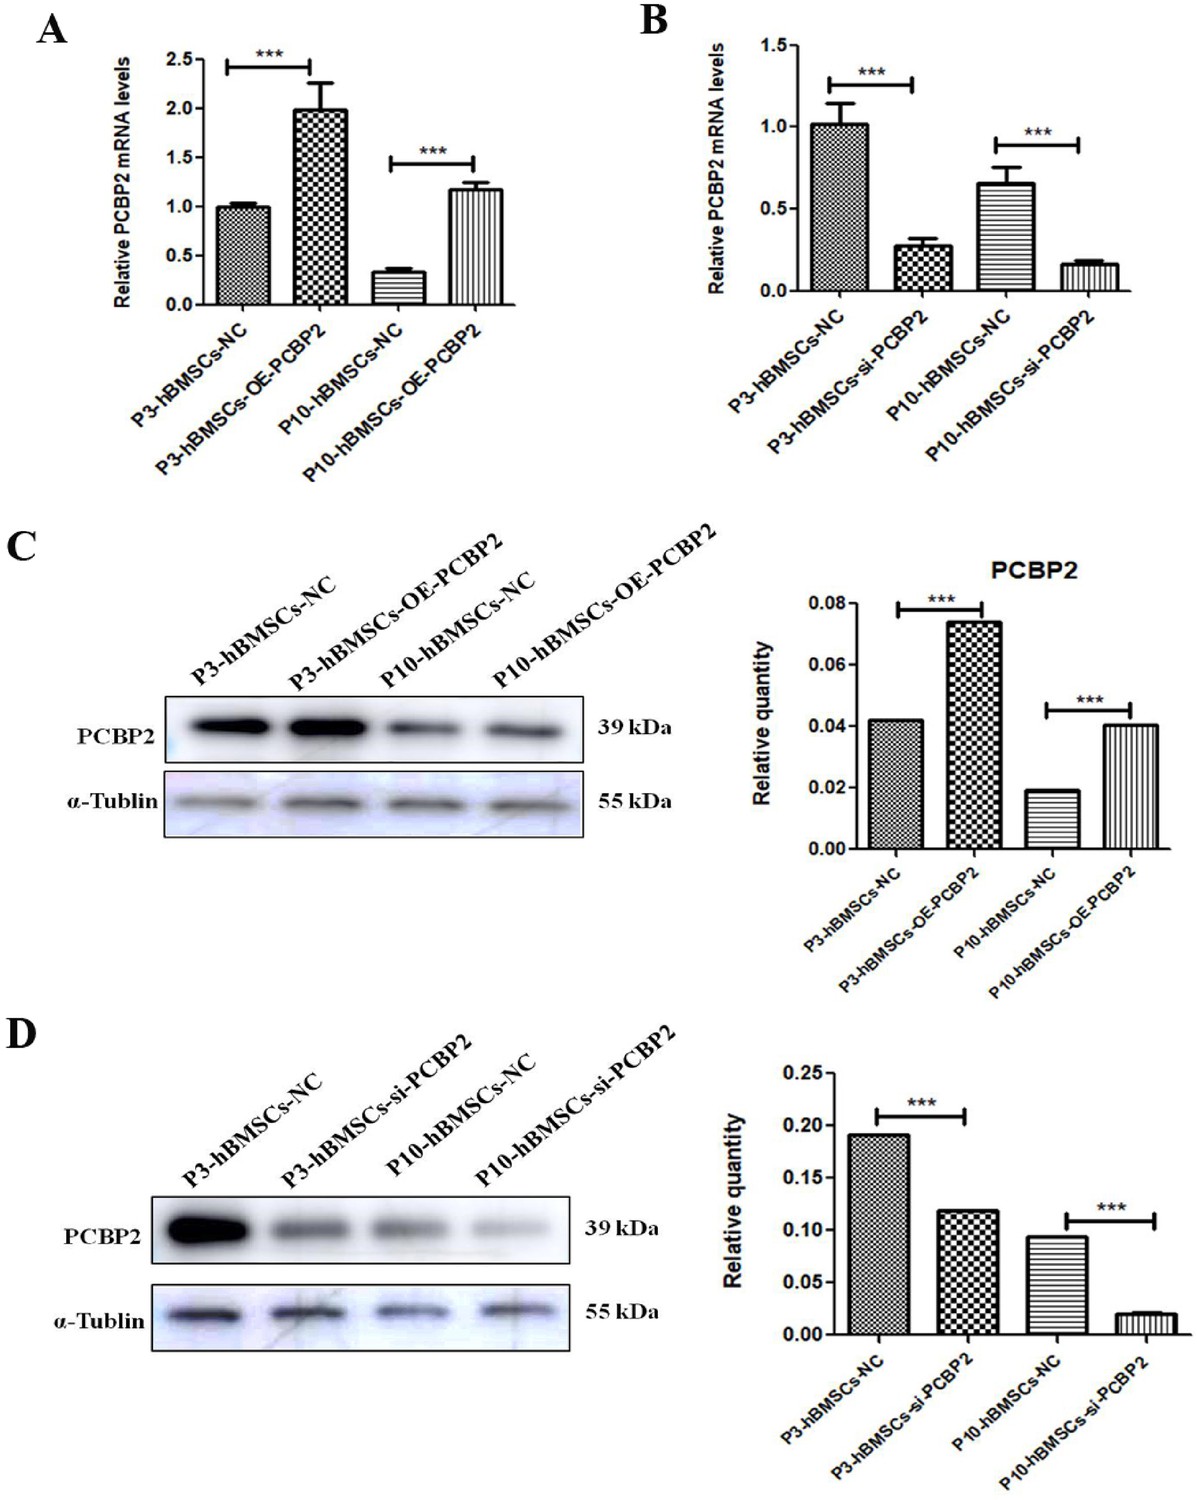
Validation of transfection effect of PCBP2.
The mRNA expression of PCBP2 after transfection with plasmids that overexpressed PCBP2 (A) and small interfering RNA (siRNA) that knocked down PCBP2 (B). The effect of overexpressing PCBP2 (C) and knocking-down PCBP2 (D) as detected by western blotting (WB). Notes: Data were presented as mean ± SD (n=3). *p<0.05, **p<0.01, and ***p<0.001; β-actin and α-tubulin were used as the internal references for mRNA and proteins detection.
-
Figure 4—source data 1
Original files for western blot analysis displayed in Figure 4C.
- https://cdn.elifesciences.org/articles/92419/elife-92419-fig4-data1-v1.zip
-
Figure 4—source data 2
File containing original western blots for Figure 4C, indicating the relevant bands.
- https://cdn.elifesciences.org/articles/92419/elife-92419-fig4-data2-v1.zip
-
Figure 4—source data 3
Original files for western blot analysis displayed in Figure 4D.
- https://cdn.elifesciences.org/articles/92419/elife-92419-fig4-data3-v1.zip
-
Figure 4—source data 4
File containing original western blots for Figure 4D, indicating the relevant bands.
- https://cdn.elifesciences.org/articles/92419/elife-92419-fig4-data4-v1.zip
Figure 5
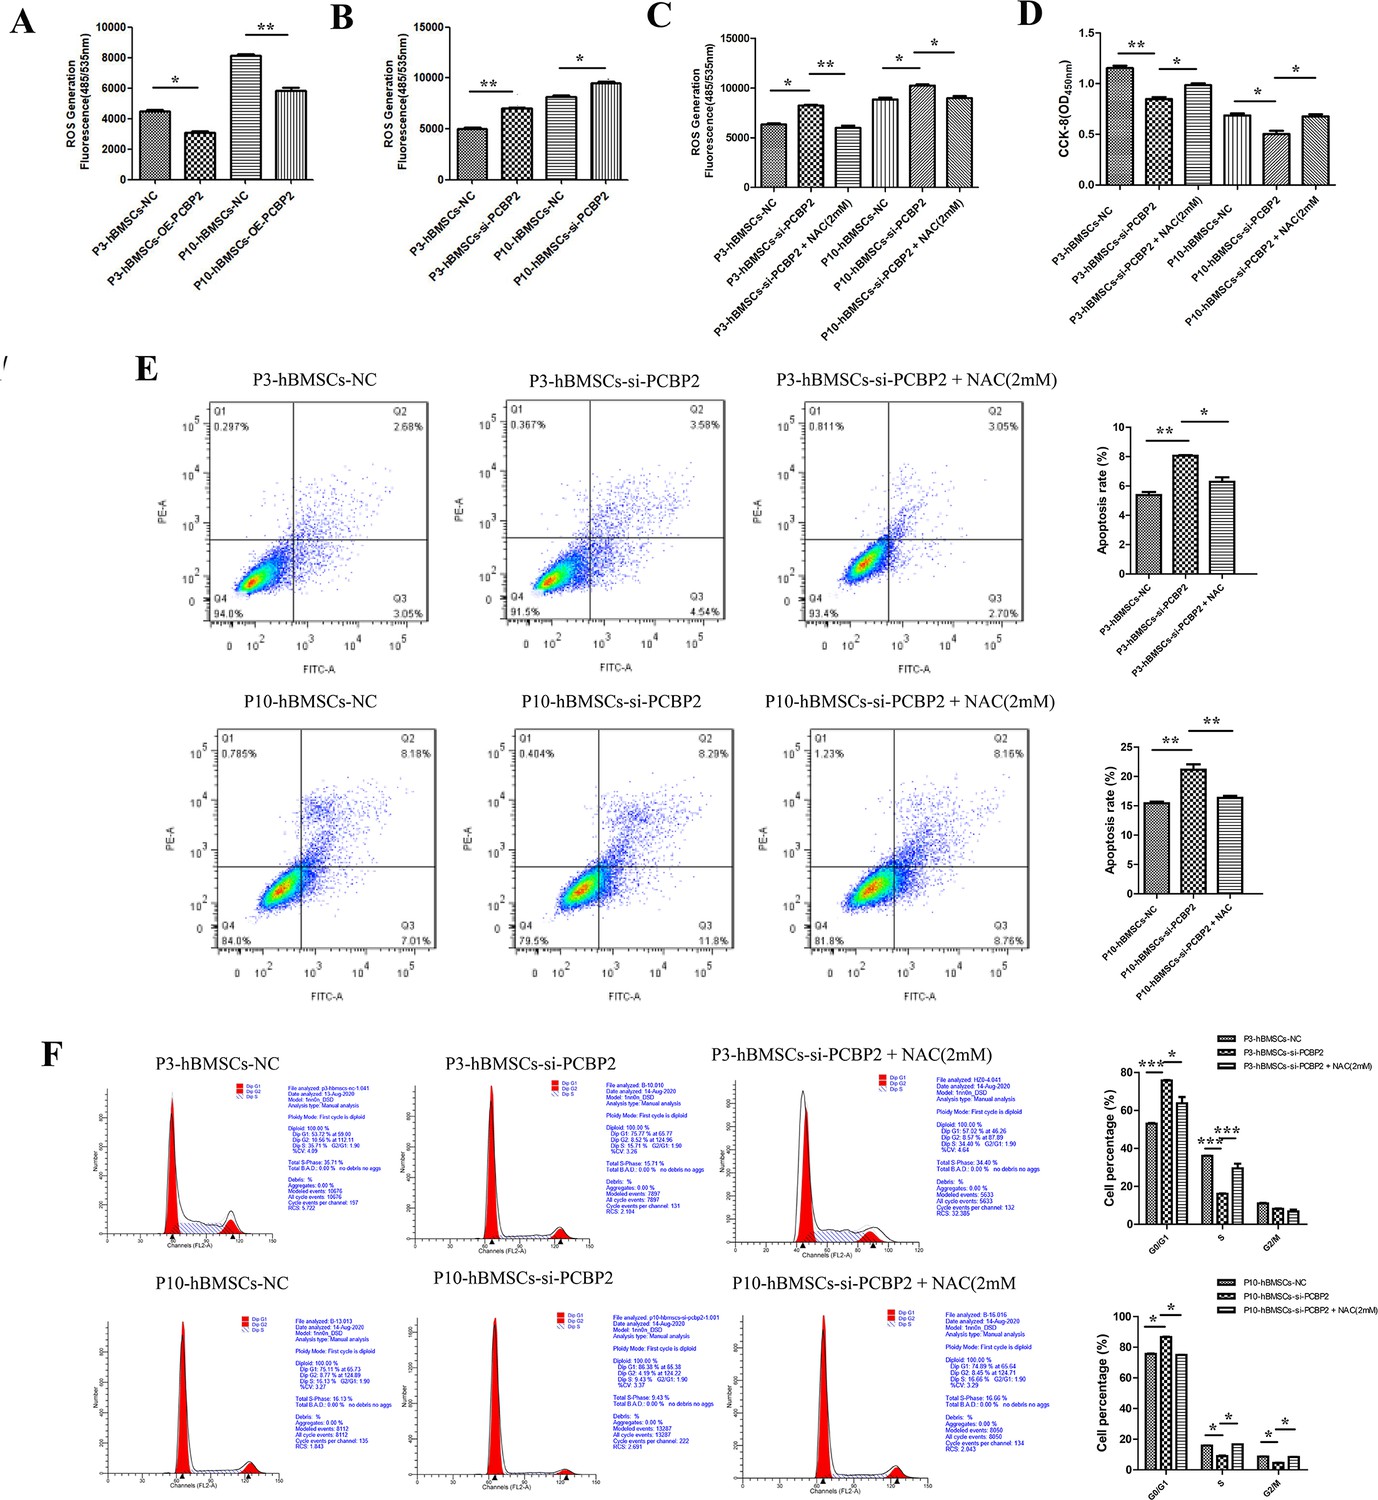
Low expression of PCBP2 inhibits cell proliferation, and promotes cell apoptosis and cell arrest in a reactive oxygen species (ROS)-dependent way.
(A) Overexpression and (B) silencing of PCBP2 on ROS production in P3-human bone marrow mesenchymal stromal cells (hBMSCs) and P10-hBMSCs. (C) The inhibitory effect of 2 mM NAC on ROS production in P3-hBMSCs and P10-hBMSCs with silenced PCBP2. (D) Cell Counting Kit-8 (CCK-8) test showed that the antioxidant NAC significantly recovered the suppressed cell proliferation in P3-hBMSCs with silenced PCBP2. Flow cytometry was used to detect the effects of 2 mM NAC on the apoptosis (E) and cycle (F) of PBCP2 silenced P3-hBMSCs and P10-hBMSCs. Notes: Data were presented as mean ± SD (n=3). *p<0.05, **p<0.01, and ***p<0.001.
Figure 6
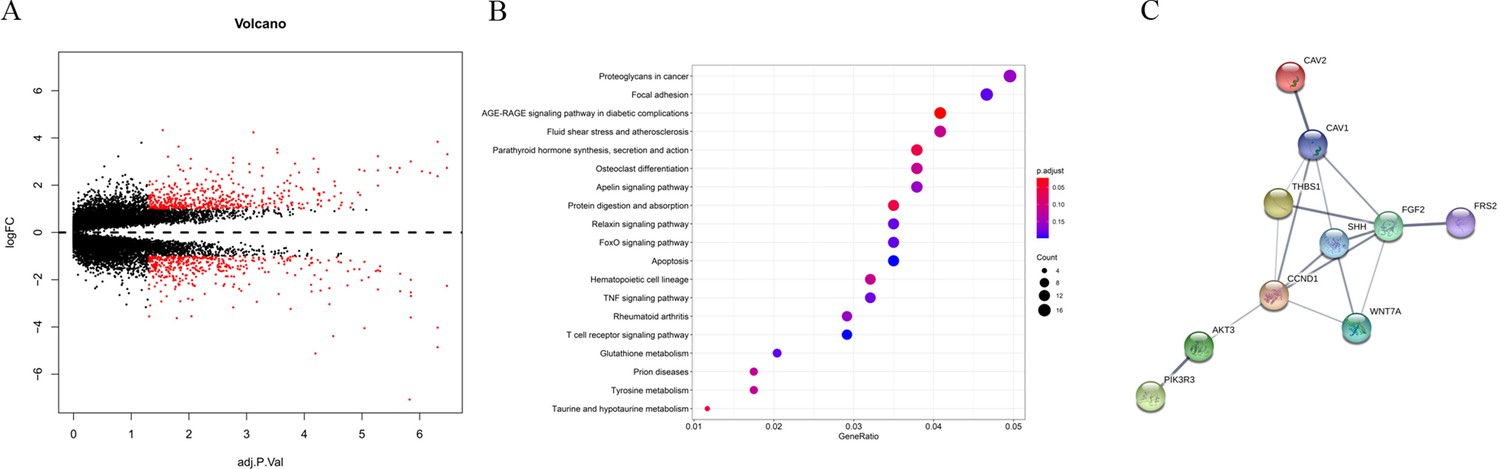
Identification of the downstream genes of PCBP2.
Volcano gram of differentially expressed genes caused by PCBP2 silencing (A). Bubble diagram of Kyoto Encyclopedia of Genes and Genomes (KEGG) pathway analysis of differentially expressed genes (B). The interaction of differentially expressed proteins was predicted by STRING website.
Figure 7
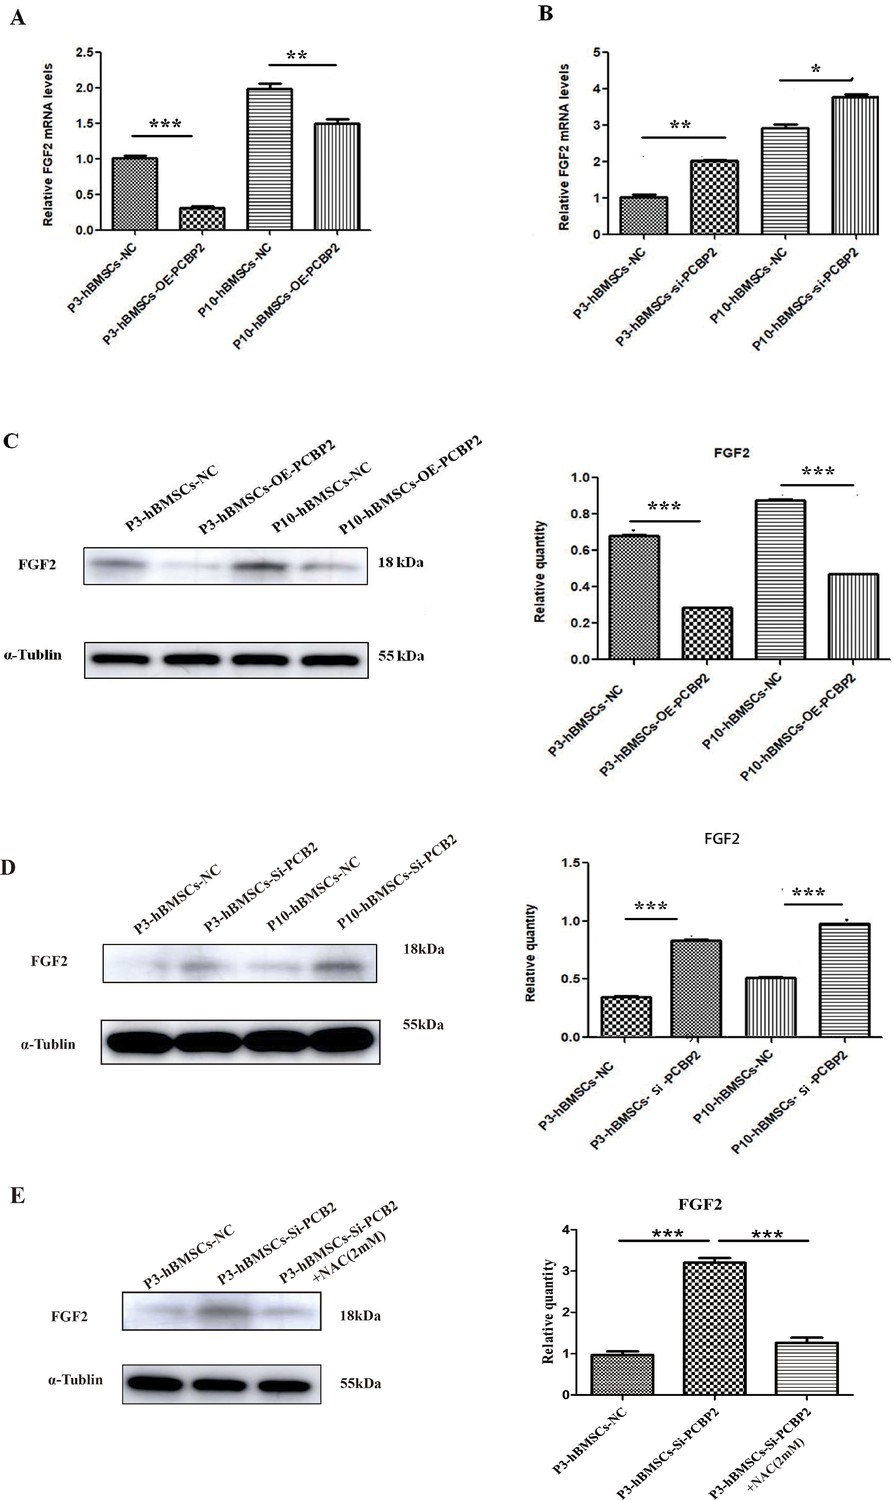
PCBP2 inhibits the expression of fibroblast growth factor 2 (FGF2) in P3-human bone marrow mesenchymal stromal cells (hBMSCs) and P10-hBMSCs.
The regulation of FGF2 mRNA levels by overexpression (A) and silencing (B) of PCBP2 was detected by real-time PCR (RT-PCR) and was confirmed in protein levels via western blotting (WB) assay (C, D). (E) Upregulation of FGF2 protein level in P3-hBMSCs with silenced PCBP2 was stopped by 2 mM NAC. Notes: Data were presented as mean ± SD (n=3). *p<0.05, **p<0.01, and ***p<0.001; β-actin and α-tubulin were used as the internal references for mRNA and proteins detection.
-
Figure 7—source data 1
Original files for western blot analysis displayed in Figure 7C.
- https://cdn.elifesciences.org/articles/92419/elife-92419-fig7-data1-v1.zip
-
Figure 7—source data 2
File containing original western blots for Figure 7C, indicating the relevant bands.
- https://cdn.elifesciences.org/articles/92419/elife-92419-fig7-data2-v1.zip
-
Figure 7—source data 3
Original files for western blot analysis displayed in Figure 7D.
- https://cdn.elifesciences.org/articles/92419/elife-92419-fig7-data3-v1.zip
-
Figure 7—source data 4
File containing original western blots for Figure 7D, indicating the relevant bands.
- https://cdn.elifesciences.org/articles/92419/elife-92419-fig7-data4-v1.zip
-
Figure 7—source data 5
Original files for western blot analysis displayed in Figure 7E.
- https://cdn.elifesciences.org/articles/92419/elife-92419-fig7-data5-v1.zip
-
Figure 7—source data 6
File containing original western blots for Figure 7E, indicating the relevant bands.
- https://cdn.elifesciences.org/articles/92419/elife-92419-fig7-data6-v1.zip
Figure 8
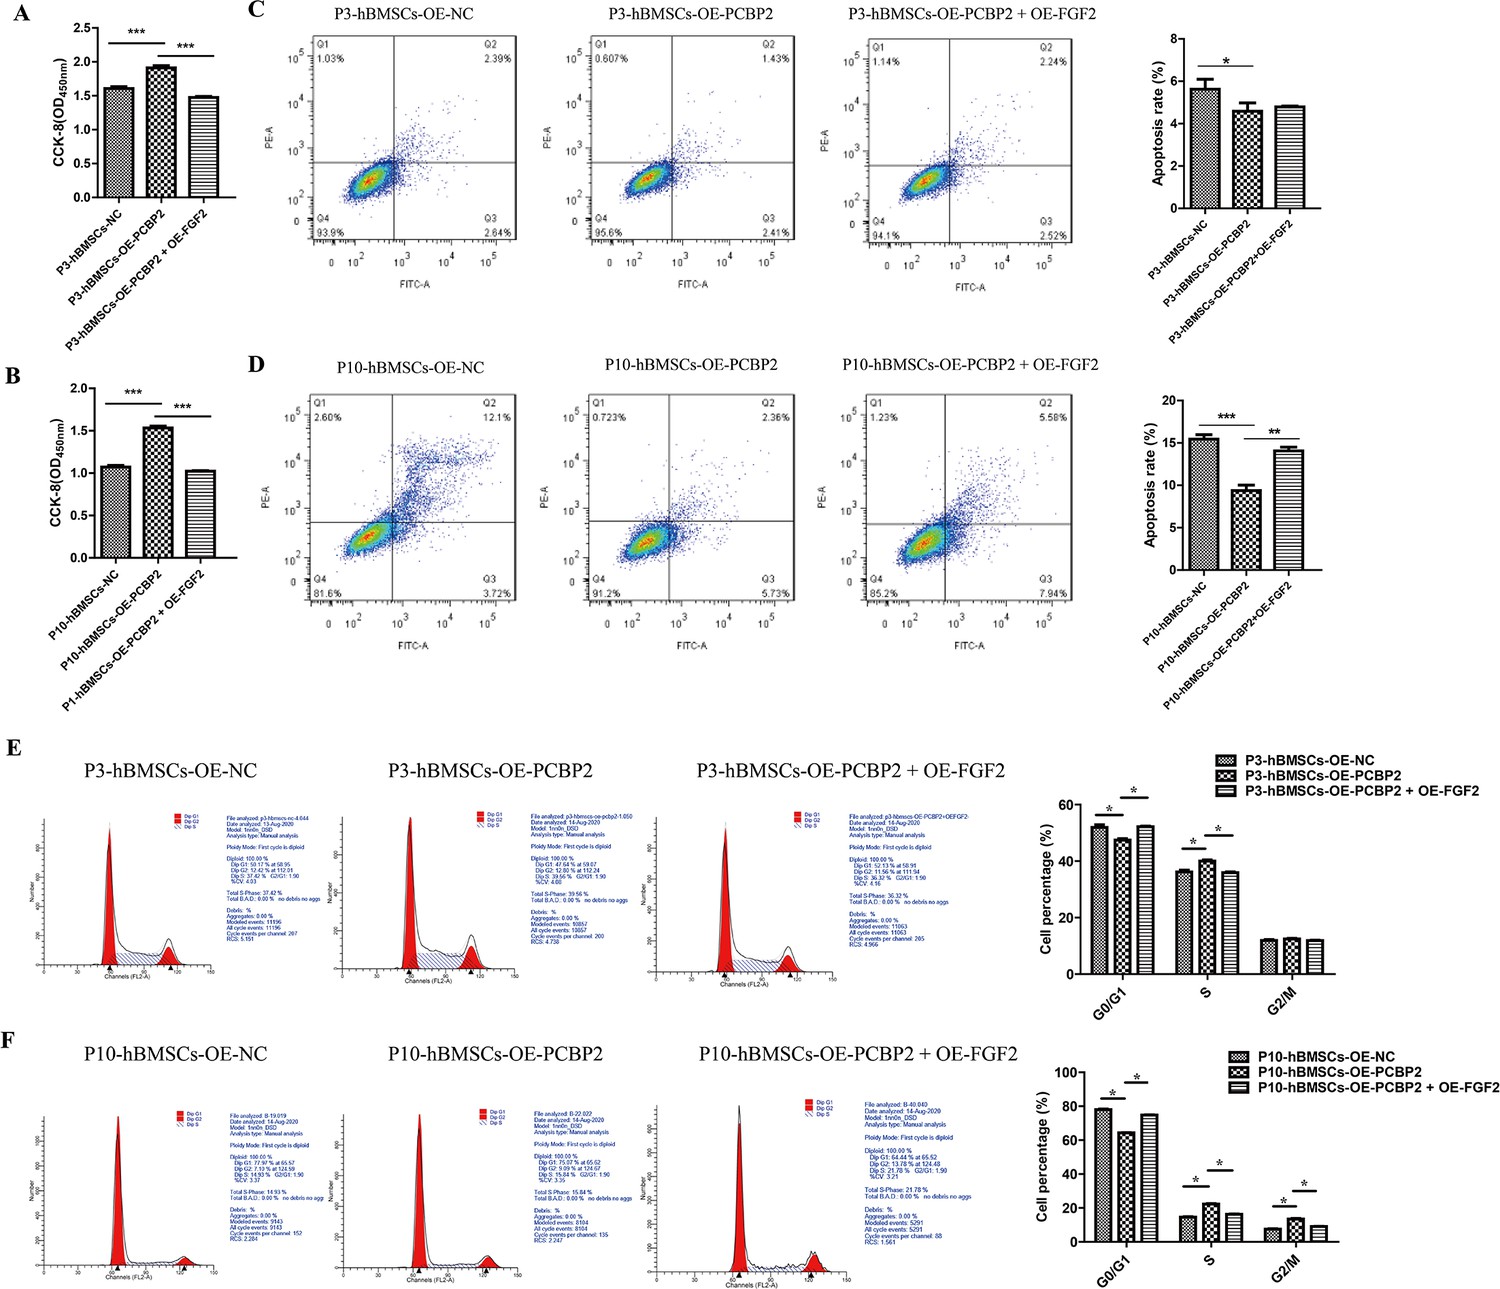
Overexpression of PCBP2 promotes cell proliferation, and inhibits cell apoptosis and cell arrest in a fibroblast growth factor 2 (FGF2)-dependent way.
Cell Counting Kit-8 (CCK-8) detects the effect of overexpression of PCBP2 and FGF2 on the cell proliferation of P3-human bone marrow mesenchymal stromal cells (hBMSCs) (A) and P10-hBMSCs (B). Flow cytometry was used to detect the apoptosis of P3-hBMSCs (C) and P10-hBMSCs (D) in NC, OE-PCBP2, and OE-PCBP2+OE-FGF2 groups. In addition, in NC group, OE-PCBP2 group and OE-PCBP2+OE-PCBP2 group, the cell cycle of P3-hBMSCs (E) and P10-hBMSCs (F) were detected by flow cytometry. Notes: Data were presented as mean ± SD (n=3). *p<0.05, **p<0.01, and ***p<0.001.
Tables
Table 1
The primers used in real-time quantitative PCR (qRT-PCR).
| Gene name | Primer sequences |
|---|---|
| PCBP2 | Forward: 5'-ATFGTCATTTTAGCTGGATC-3' |
| Reverse: 5'-GATAGATCGTGAAATGCT-3' | |
| FGF2 | Forward: 5'-AGAAGAGCGACCCTCACATCA-3' |
| Reverse: 5'-CGGTLAGCACACACTCCTTTG-3' | |
| β-Actin | Forward: 5’-GCTCTAGGCGGACTGTAC-3' |
| Reverse: 5'-CCATGCCAATGTTGTCTCTT-3' |
-
Three separate experiments were performed for each sample, and the 2-△△Ct value was used to calculate the relative expression.
Additional files
-
MDAR checklist
- https://cdn.elifesciences.org/articles/92419/elife-92419-mdarchecklist1-v1.docx
-
Source data 1
Protein identification quantitative summary of Figure 1 and Figure 2.
- https://cdn.elifesciences.org/articles/92419/elife-92419-data1-v1.zip
Download links
A two-part list of links to download the article, or parts of the article, in various formats.
Downloads (link to download the article as PDF)
Open citations (links to open the citations from this article in various online reference manager services)
Cite this article (links to download the citations from this article in formats compatible with various reference manager tools)
PCBP2 as an intrinsic agi ng factor regulates the senescence of hBMSCs through the ROS-FGF2 signaling axis
eLife 13:RP92419.
https://doi.org/10.7554/eLife.92419.2


