Genetic associations between circulating immune cells and periodontitis highlight the prospect of systemic immunoregulation in periodontal care
- Stomatology Hospital, School of Stomatology, Zhejiang University School of Medicine, Zhejiang Provincial Clinical Research Centre for Oral Diseases, Key Laboratory of Oral Biomedical Research of Zhejiang Province, Cancer Centre of Zhejiang University, China
- The First School of Clinical Medicine, Zhejiang Chinese Medical University, China
- School of Stomatology, Zhejiang Chinese Medical University, China
- Department of Epidemiology, School of Public Health Zhejiang Chinese Medical University, China
Figures
Figure 1
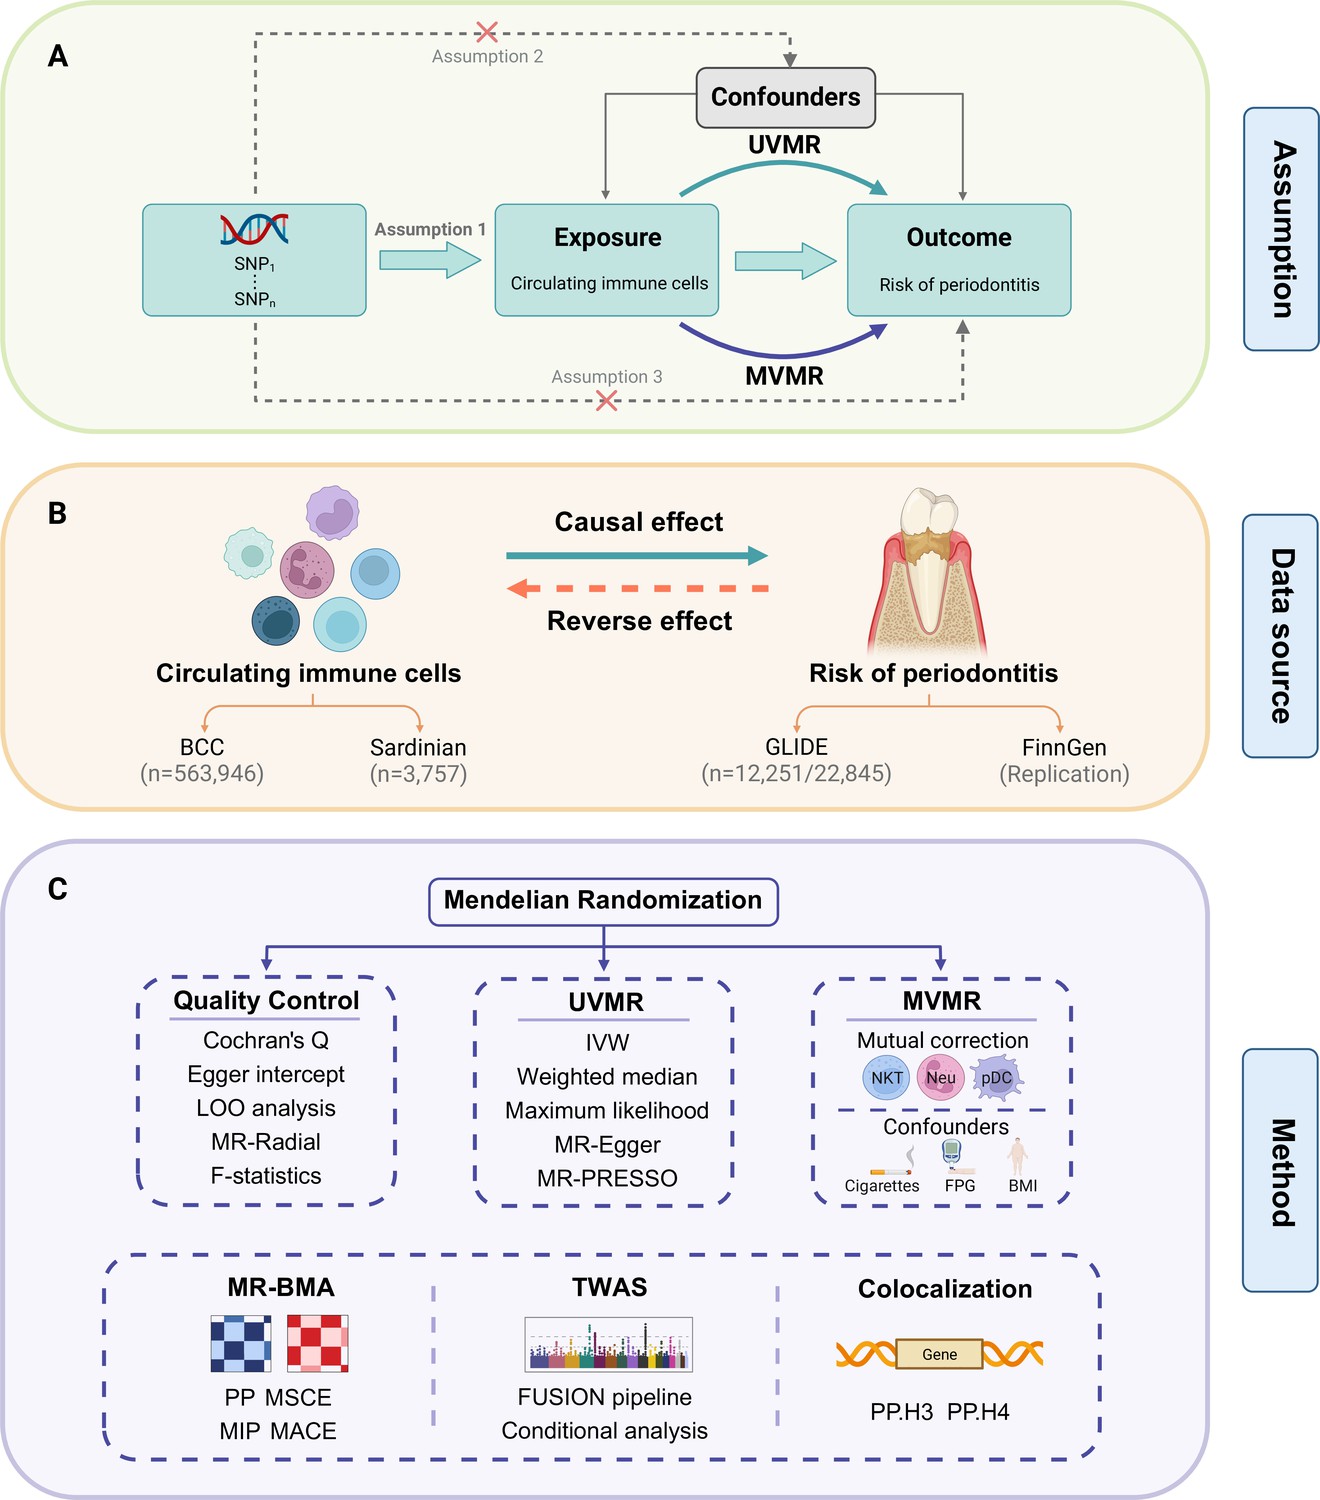
Study design.
(A) Overview of the process and principal assumptions of MR. (B) Data sources of the GWASs. (C) Methods performed in the present study. Abbreviations and Notes: BCC, Blood Cell Consortium; BMA, Bayesian model averaging, a high-throughput method based on nonlinear regression; BMI, body mass index; FPG, fasting plasma glucose; FUSION, functional summary-based imputation; GLIDE, Gene-Lifestyle Interactions in Dental Endpoints collaboration consortium; GWAS, genome-wide association study; IVW, inverse variance weighted, the primary method in MR to explore the association between exposure and outcome; LOO, leave-one-out, a method for detecting potential influential SNPs; SNP, single-nucleotide polymorphism, as genetic instrumental variables for the exposure and outcome; MACE, model-averaged causal estimate; MIP, marginal probability of inclusion; MR, Mendelian randomization; MR-PRESSO, Mendelian Randomization Pleiotropy RESidual Sum and Outlier, a method for assessing and rectifying pleiotropic SNPs; MSCE, model-specific causal estimate; MVMR, multivariable Mendelian randomization, an MR model for adjusting confounding and mutual correction; Neu, neutrophil; NKT, natural killer T cell; pDC, plasmacytoid dendritic cell; PP, posterior probability; TWAS, transcriptome-wide association study; UVMR, univariable Mendelian randomization.
© 2024, BioRender Inc. Figure 1 was created using BioRender, and is published under a CC BY-NC-ND license. Further reproductions must adhere to the terms of this license.
Figure 2 with 2 supplements
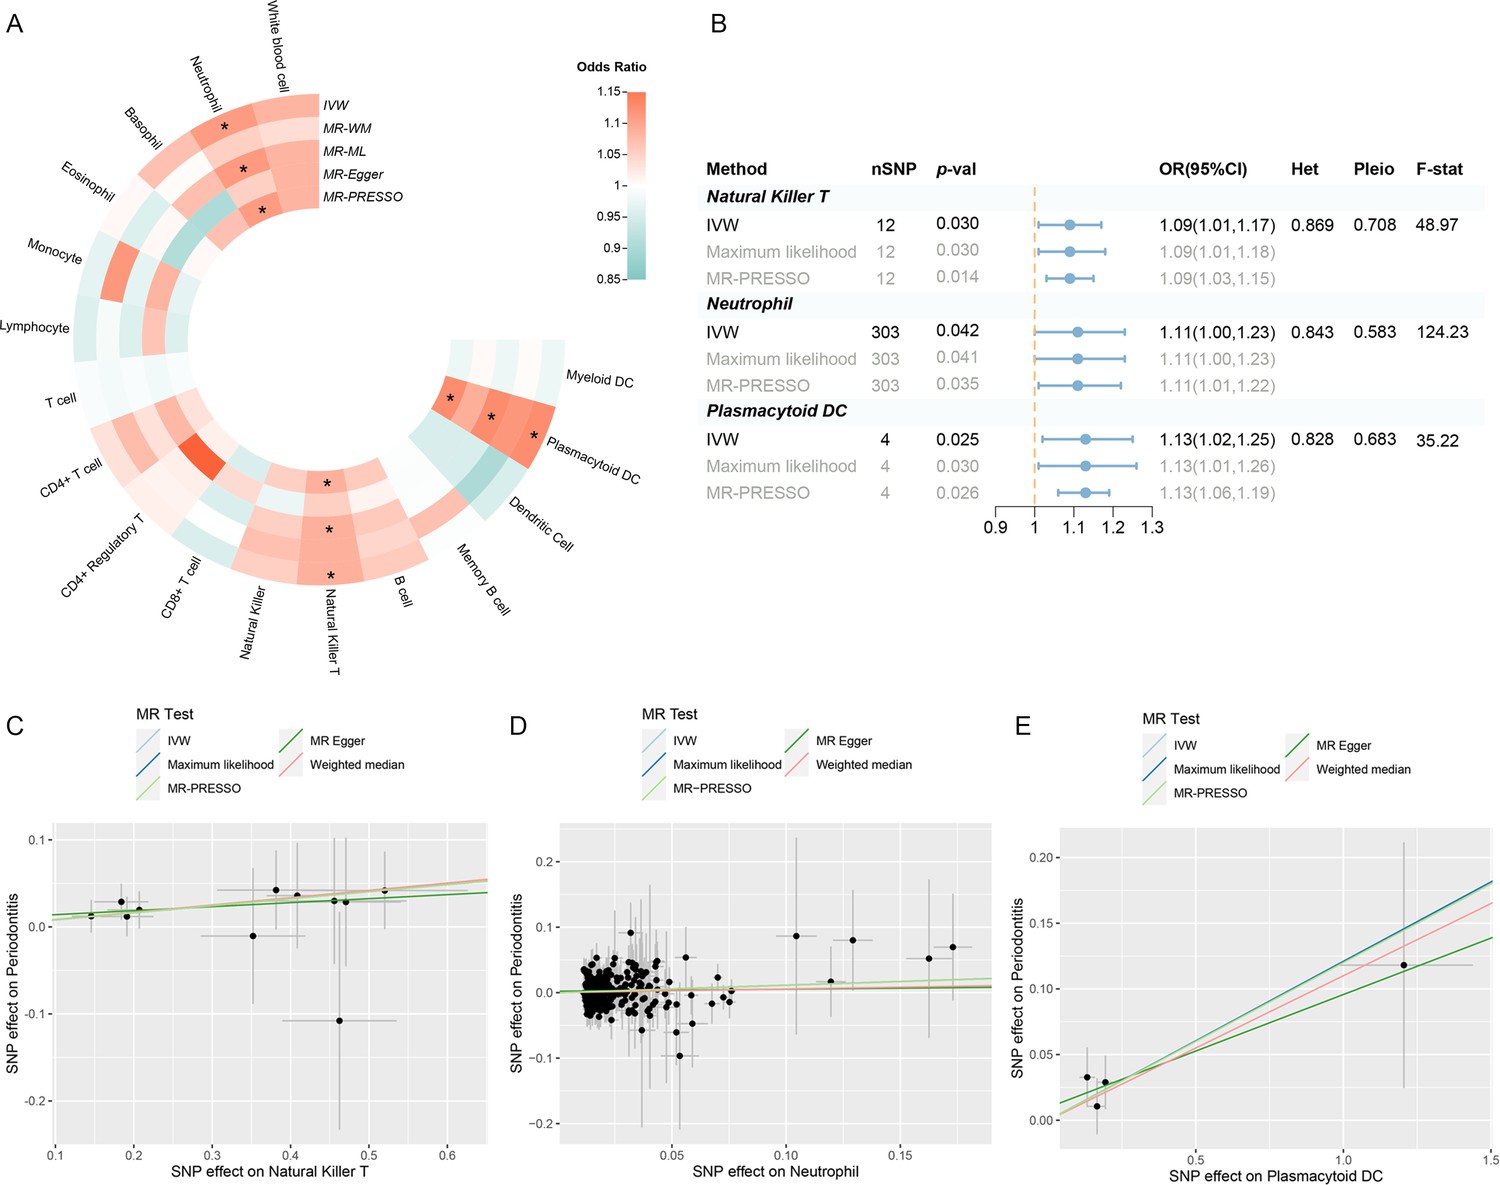
Results of the UVMR.
(A) A circular heatmap representing the MR analyses for the associations between circulating immune cells and the risk of periodontitis. Lines, from outermost to innermost, represent IVW, MR-WM, MR-ML, MR‐Egger, and MR-PRESSO, respectively. The color scale of the heatmap is based on the OR. *p < 0.05. (B) A forest plot of the MR analyses for significant results in (A) (p < 0.05). The effects are quantified using OR with 95% CI. (C–E) The effect estimates for each variant in natural killer T cell (C), neutrophil (D), and plasmacytoid DC (E) are provided by plotting SNP–outcome associations against SNP–exposure associations. Lines with different colors represent the regression slope fitted by different MR methods. Abbreviations: CI, confidence interval; DC, dendritic cell; F-stat, F-statistic; IVW, inverse variance weighted; Het, heterogeneity; MR, Mendelian randomization; MR-ML, Mendelian randomization weighted median; MR-WM, Mendelian randomization maximum likelihood; MR-PRESSO, Mendelian Randomization Pleiotropy RESidual Sum and Outlier; OR, odds ratio; Pleio, pleiotropy; SNP, single-nucleotide polymorphism; UVMR, univariable Mendelian randomization.
Figure 2—figure supplement 1
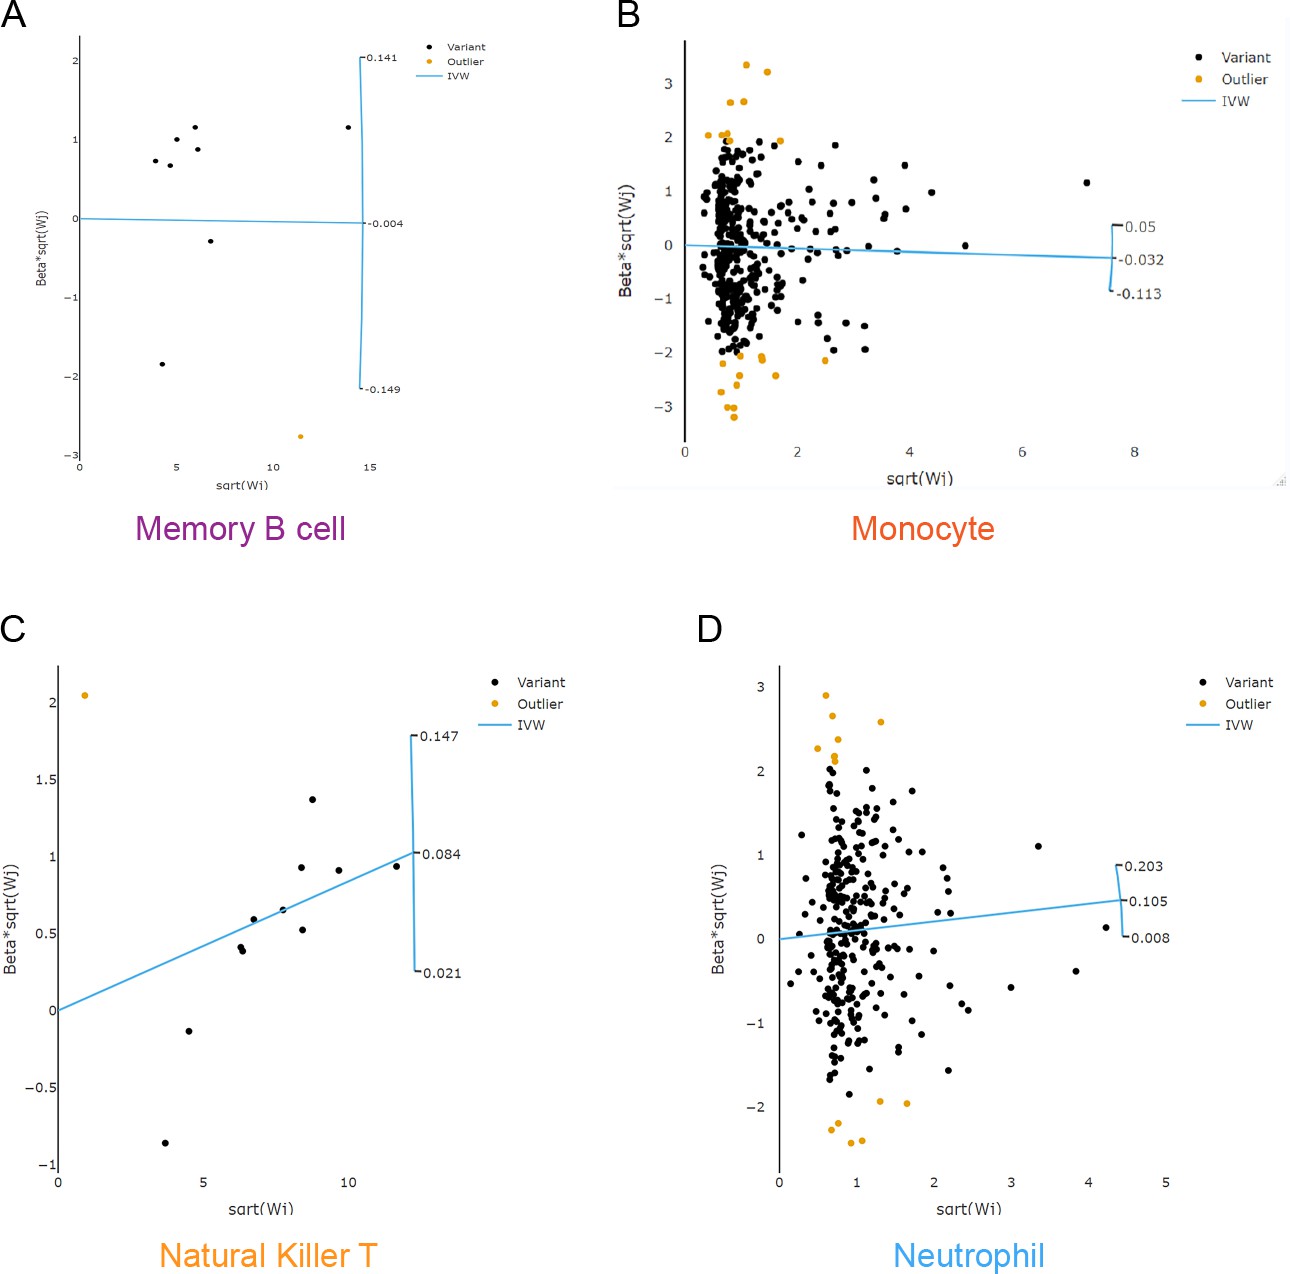
Scatter plots to explore outliers for two features with considerable heterogeneity.
Based on the RadialMR method, we detected 1, 21, 1, and 14 outlier SNPs from the memory B cell (A), the monocyte (B), the natural killer T cell (C), and the neutrophil (D), respectively. Abbreviations: IVW, inverse variance weighted; MR, Mendelian randomization; SNP, single-nucleotide polymorphism.
Figure 2—figure supplement 2
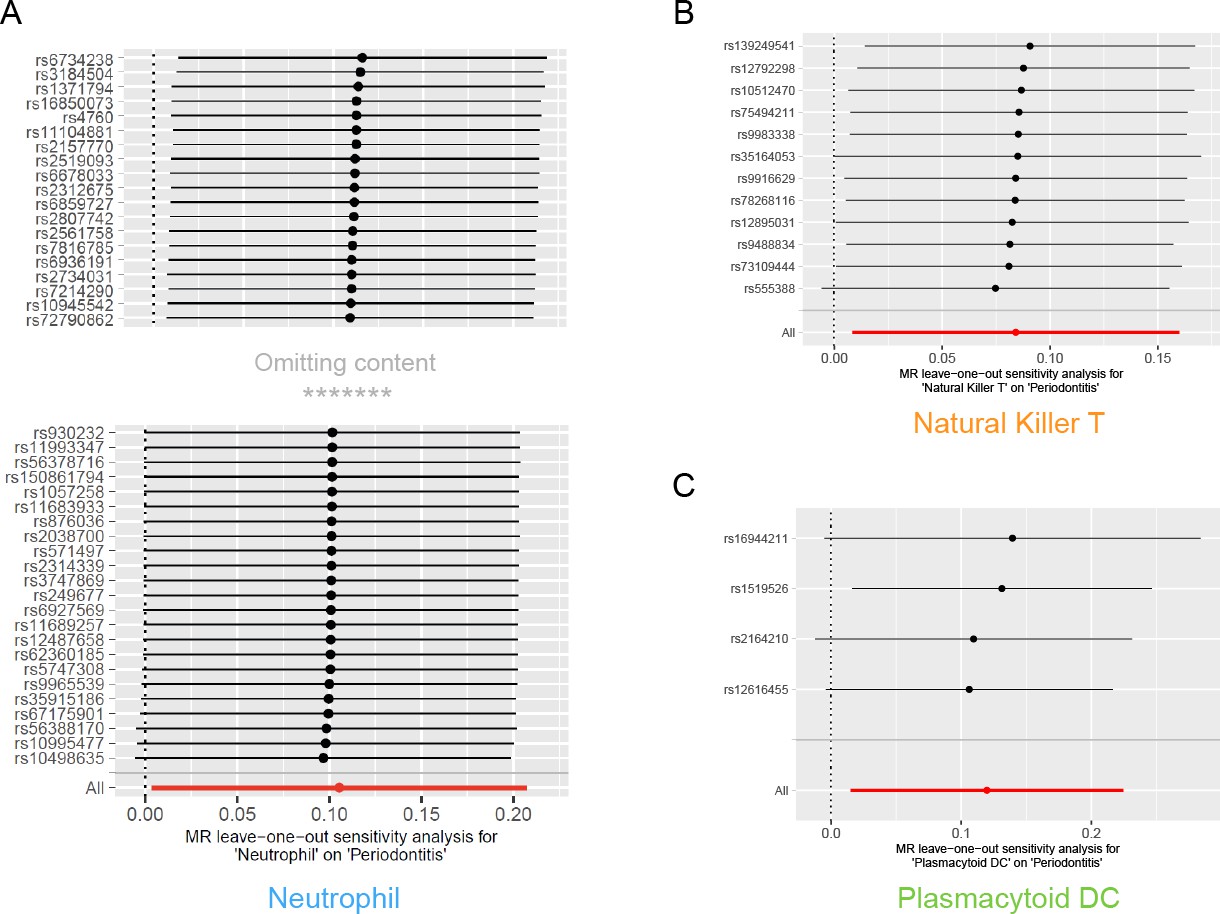
Results of leave-one-out sensitivity analysis.
No influential SNPs were detected for either the neutrophil (A), the natural killer T cell (B), or the plasmacytoid DC (C). Abbreviations: DC, dendritic cell; MR, Mendelian randomization; SNP, single-nucleotide polymorphism.
Figure 3 with 1 supplement
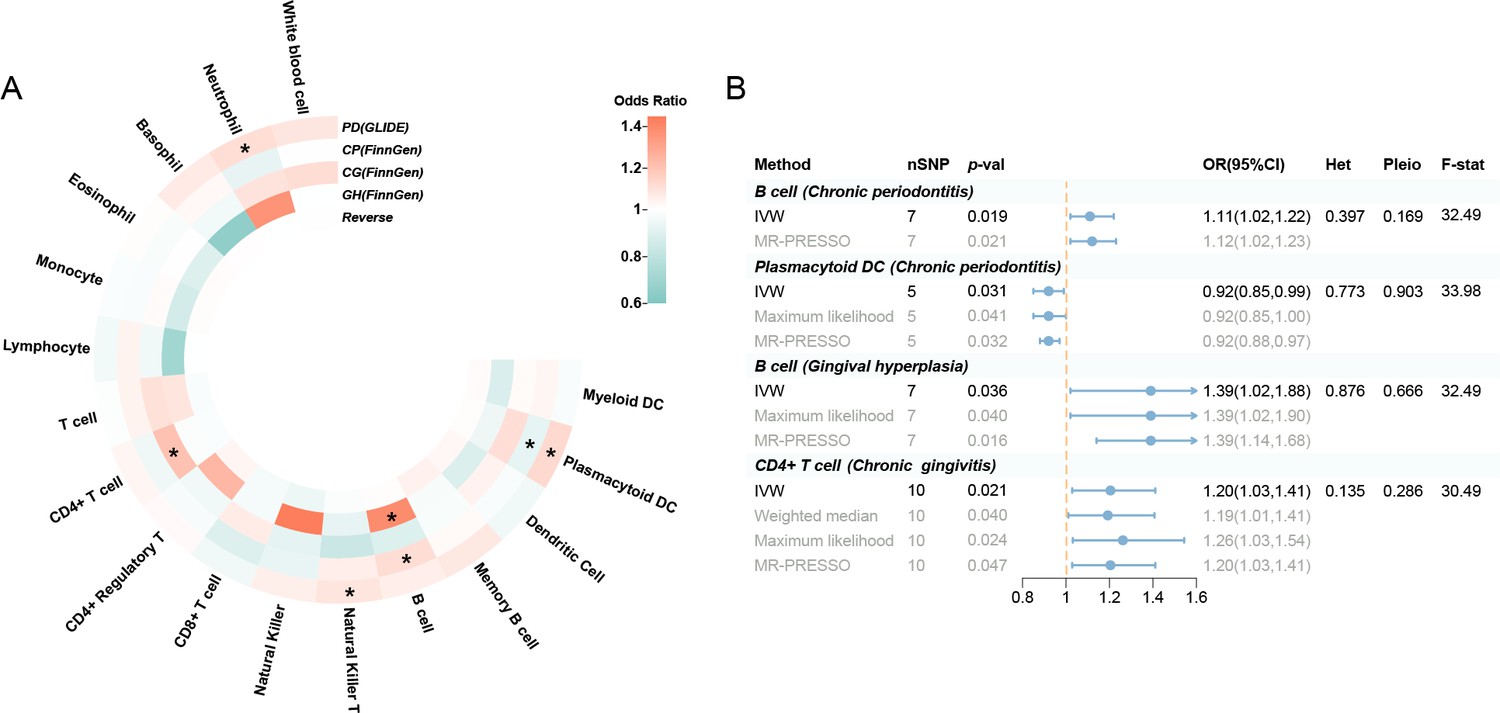
Results of the subgroup and reverse MR.
(A) A circular heatmap illustrates the results of the subgroup analysis and reverse MR. Lines in the heatmap represent periodontitis (GLIDE), chronic periodontitis (FinnGen), chronic gingivitis (FinnGen), gingival hyperplasia (FinnGen), and reverse MR analysis, progressing from outside to inside. The color scale of the heatmap is determined by the odds ratio (OR). *p < 0.05. (B) A forest plot of the MR analyses for significant results in Figure 4A (p < 0.05). The effects are quantified using OR with 95% CI. Abbreviations: CG, chronic gingivitis; CI, confidence interval; CP, chronic periodontitis; DC, dendritic cell; F-stat, F-statistic; GH, gingival hyperplasia; GLIDE, Gene-Lifestyle Interactions in Dental Endpoints collaboration consortium; Het, heterogeneity; IVW, inverse variance weighted; MR-PRESSO, Mendelian Randomization Pleiotropy RESidual Sum and Outlier; PD, periodontitis; Pleio, pleiotropy; SNP, single-nucleotide polymorphism; MR, Mendelian randomization.
Figure 3—figure supplement 1
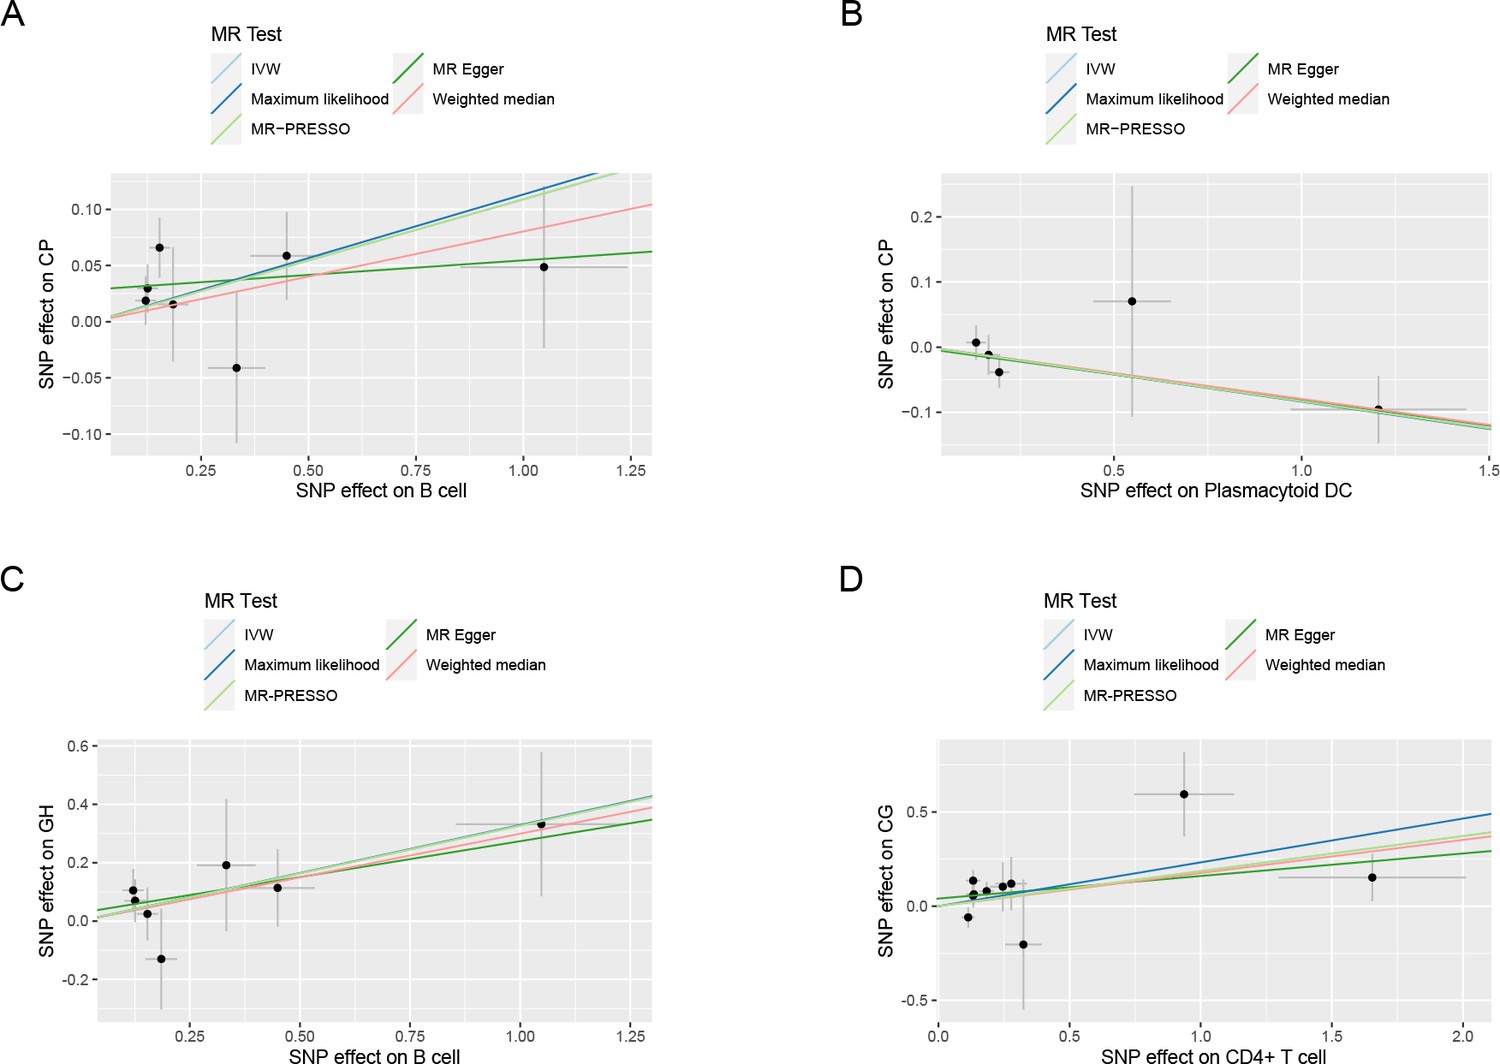
Scatter plots of the estimated effects in the subgroup MR.
The effect estimates for each variant in B cell (CP) (A), plasmacytoid DC (CP) (B), B cell (GH) (C), and CD4+ T cell (CG) (D) are provided by plotting SNP–outcome associations against SNP–exposure associations. Lines with different colors represent the regression slope fitted by different MR methods. Abbreviations: CG, chronic gingivitis; CP, chronic periodontitis; DC, dendritic cell; GH, gingival hyperplasia; IVW, inverse variance weighted; MR-PRESSO, Mendelian Randomization Pleiotropy RESidual Sum and Outlier; SNP, single-nucleotide polymorphism; MR, Mendelian randomization.
Figure 4
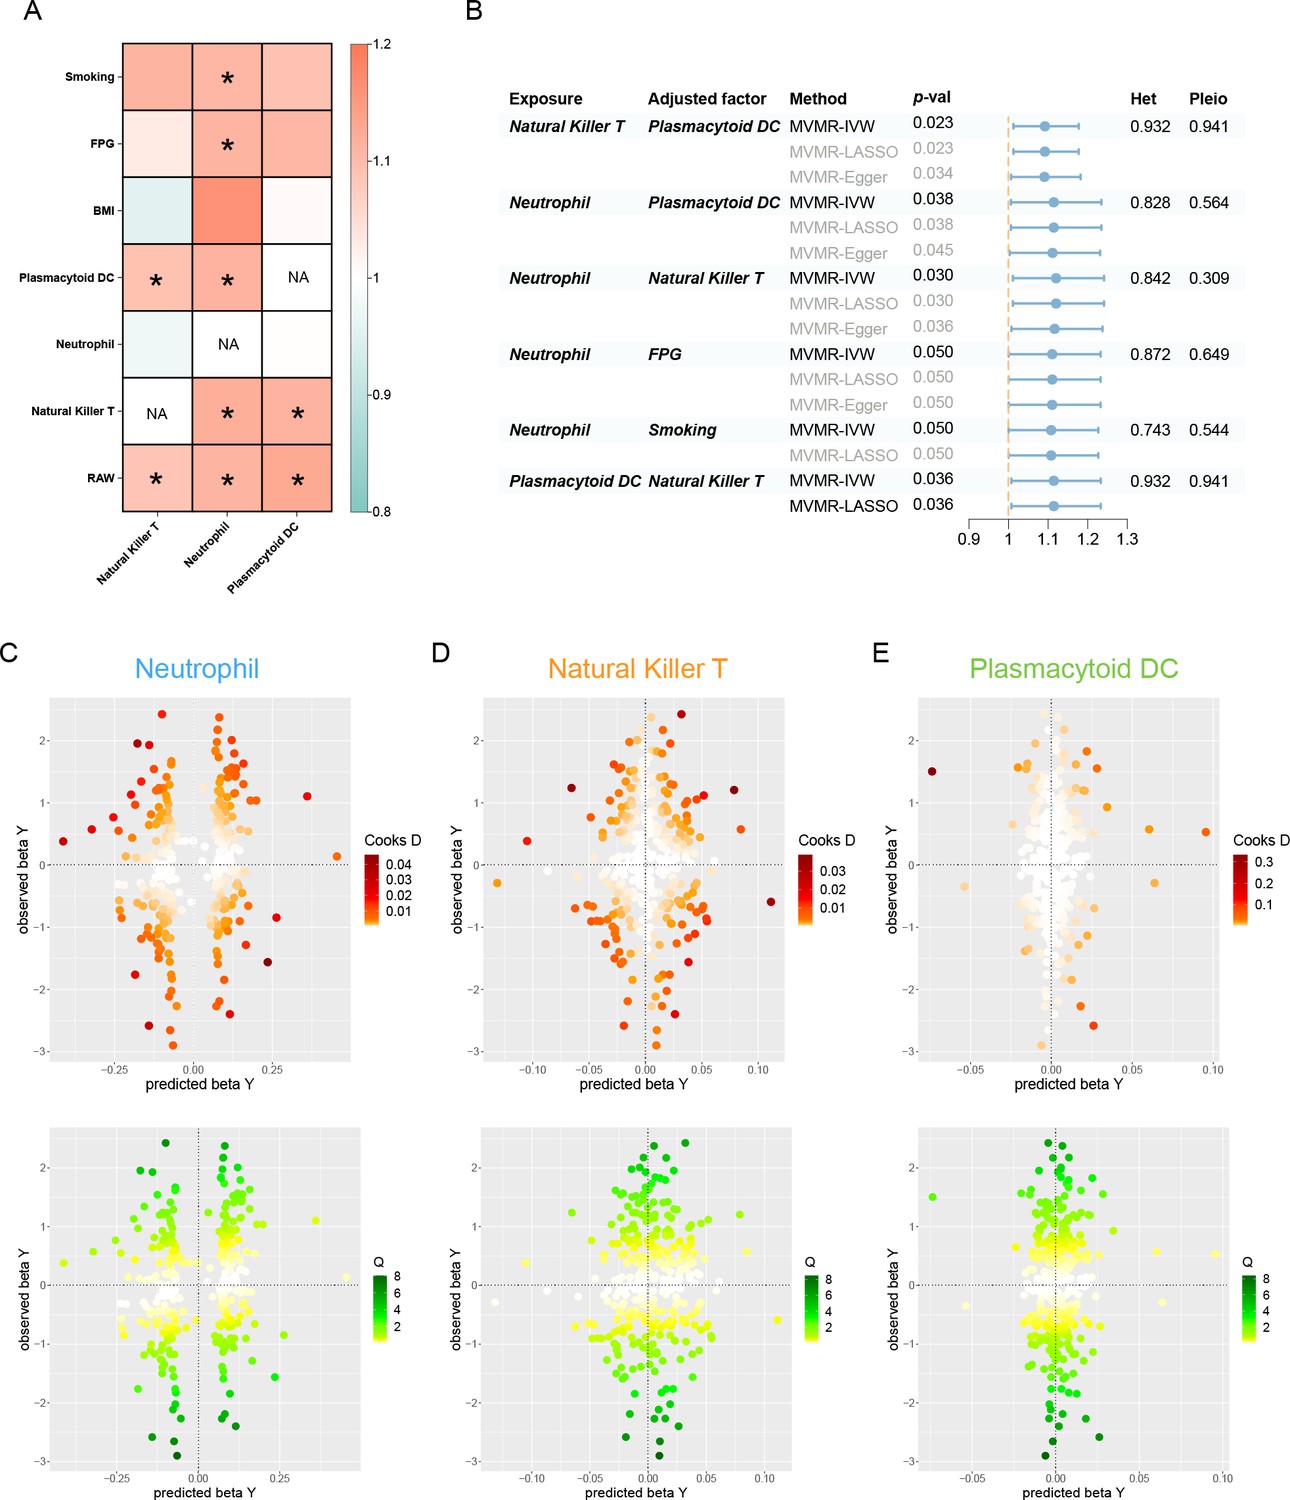
Results of the MVMR.
(A) A heatmap represents the results of the MVMR. Rows and columns correspond to exposures and adjustment factors, respectively. The color scale of the heatmap is determined by the odds ratio (OR). *p < 0.05. (B) Forest plot analysis of the MVMR of significant results following mutual adjustment and confounder correction. The effects are quantified using OR with 95% CI. Scatter plots of the Cochran’s Q test and Cook’s distance to explore outlier or influential variations in Mendelian randomization-Bayesian model averaging (MR-BMA) for neutrophil (C), natural killer T (D), and plasmacytoid DC (E), respectively. Abbreviations: BMA, Bayesian model averaging; BMI, body mass index; CI, confidence interval; DC, dendritic cell; FPG, fasting plasma glucose; IVW, inverse variance weighted; Het, heterogeneity; LASSO, least absolute shrinkage and selection operator; MVMR, multivariable Mendelian randomization; Pleio, pleiotropy; SNP, single-nucleotide polymorphism.
Figure 5 with 1 supplement
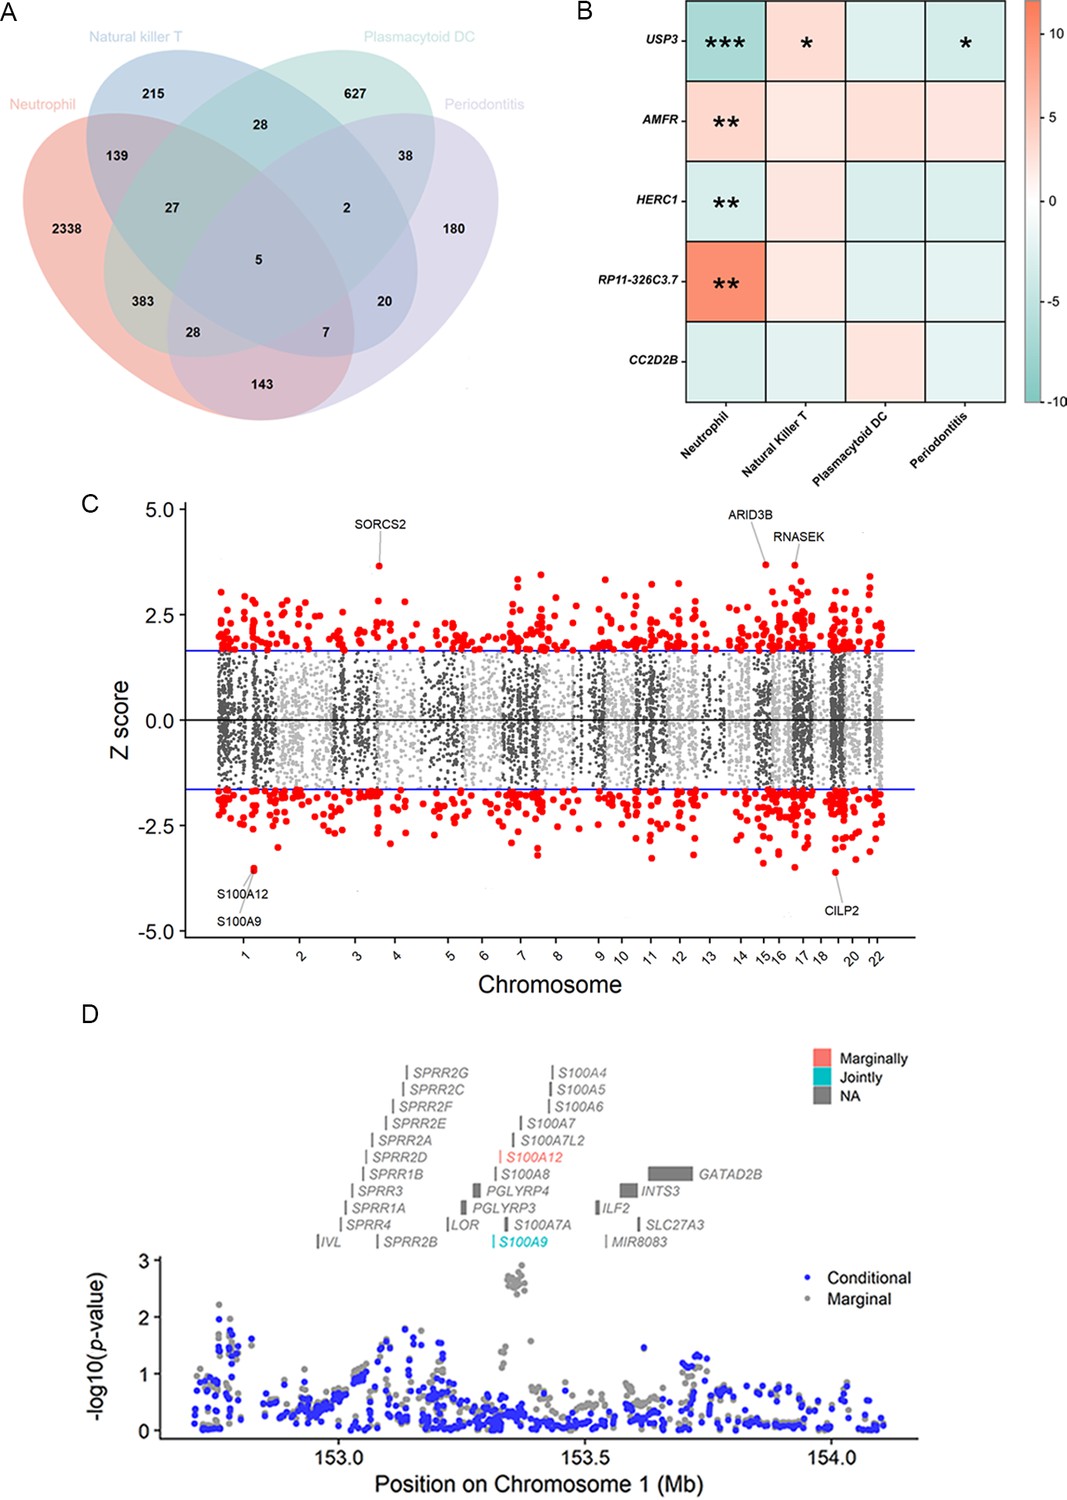
Results of the TWAS and colocalization analysis.
(A) A Venn diagram illustrates the intersecting genes shared by multiple traits (p < 0.05). (B) A heatmap representing the TWAS and colocalization analysis for five genes interacting among neutrophil, natural killer T cell, plasmacytoid DC, and periodontitis. The TWAS Z-score is used as the color scale for the heatmap. *PP.H3 + PP.H4 > 0.5; **PP.H3 + PP.H4 > 0.8; ***PP.H4 > 0.8. (C) Manhattan plot of gene–traits associations for periodontitis. The x-axis represents genomic positions. Blue lines indicate a Z-score of 1.96. Red circles represent significant gene–trait associations (p < 0.05). Six genes satisfy a multiple corrected threshold of p < 5 × 10⁻⁴. (D) Regional Manhattan plot of conditional analysis for S100A9, S100A12 in periodontitis. Gray bars indicate the location of genes on chromosome 1. Genes colored in orange and green on the graph indicate the marginally and jointly significant genes that best explain the GWAS signals. Gray and blue dots indicate the GWAS p-values before and after conditioning on the jointly significant gene. Abbreviations: DC, dendritic cell; GWAS, genome-wide association study; PP, posterior probability; TWAS, transcriptome-wide association study.
Figure 5—figure supplement 1
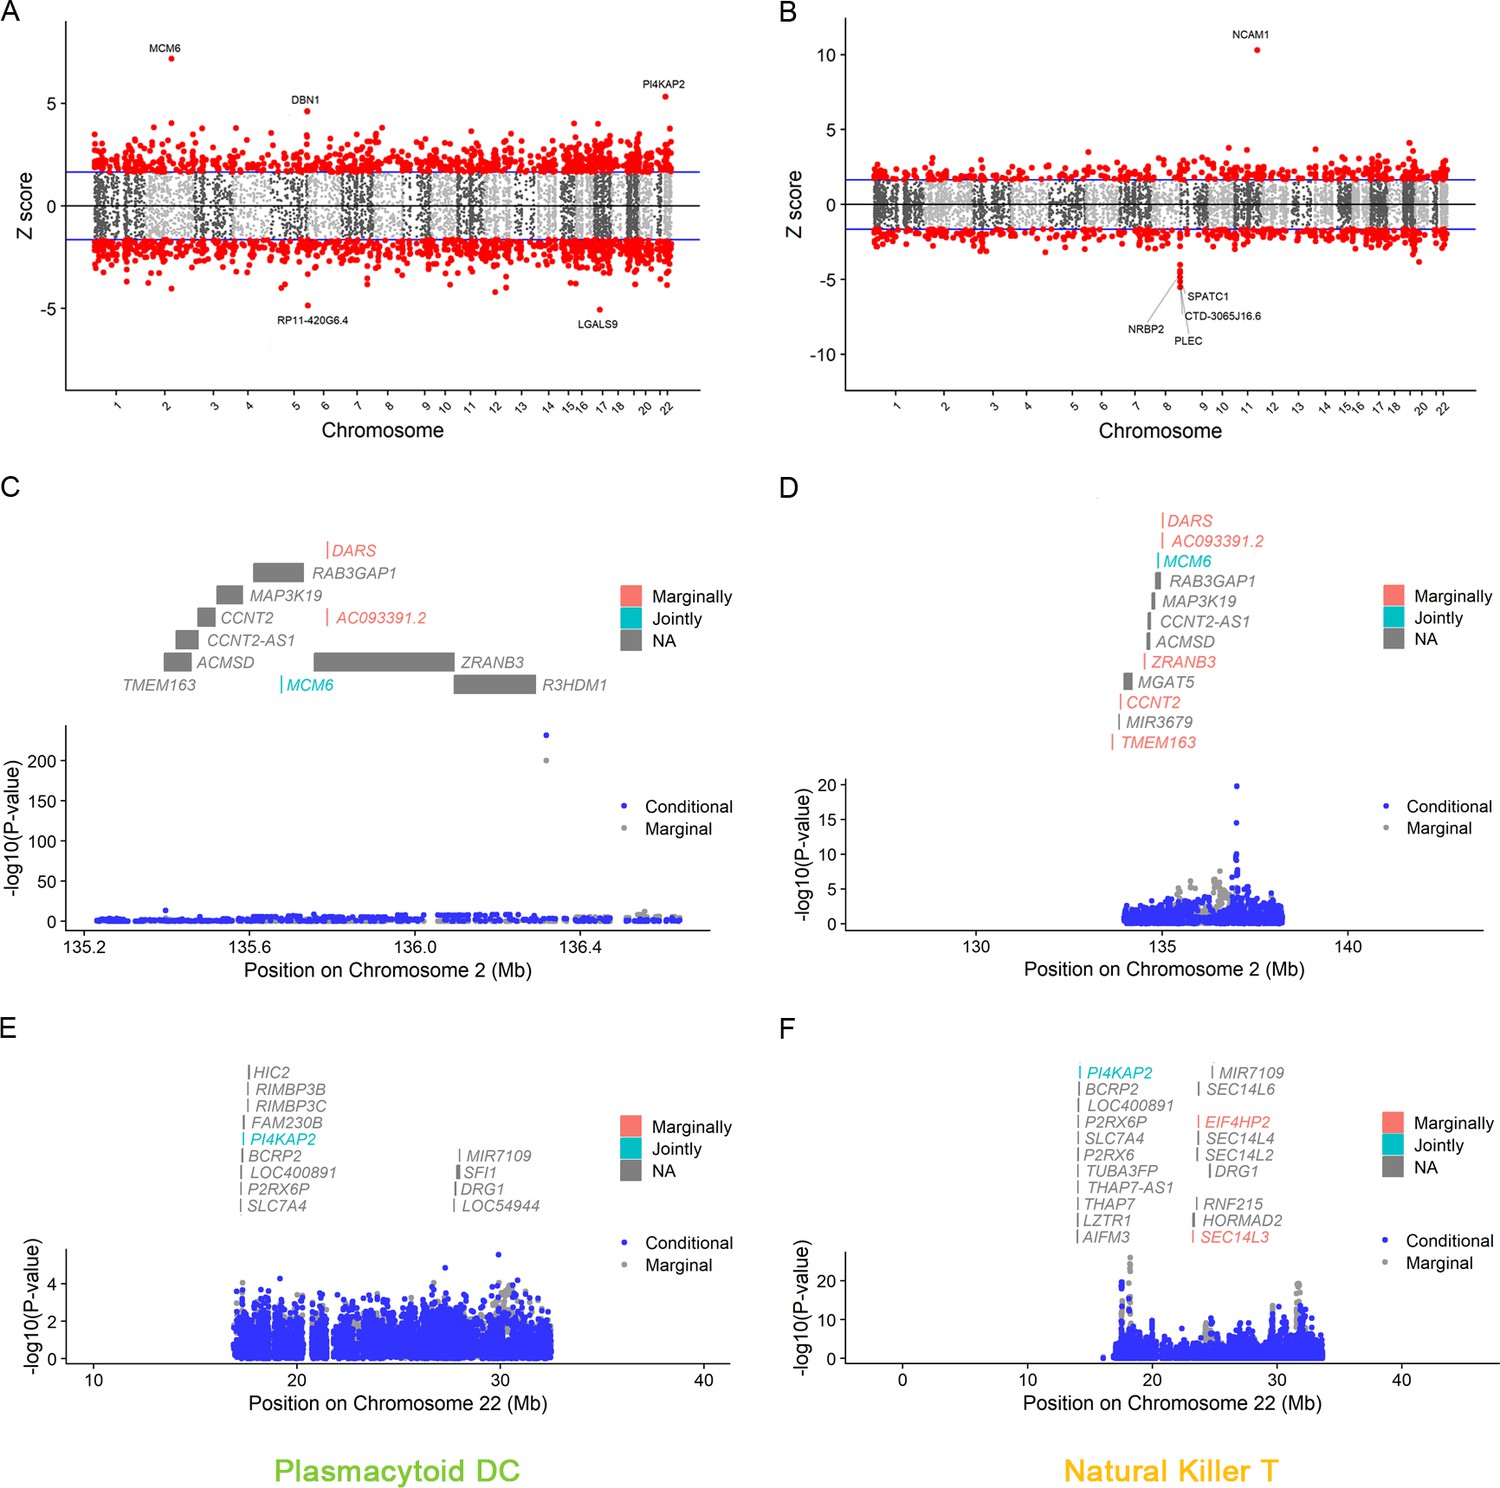
Manhattan plots for natural killer T and plasmacytoid DC.
The Manhattan plot illustrates gene–trait associations for plasmacytoid DC (A) and natural killer T (B). The x-axis represents the genomic position. The blue lines indicate a Z-score of 1.96. The red circles denote significant gene–trait associations (p < 0.05). Ten genes satisfy a multiple corrected threshold of p < 6.27 × 10⁻⁶. The regional Manhattan plot demonstrates the conditional analysis for MCM6 in plasmacytoid DC (C), natural killer T (D), and P14KAP2 in plasmacytoid DC (E), natural killer T (F). The gray bars mark the location of genes on the chromosome. The genes highlighted in orange and green on the graph represent the marginally and jointly significant genes that best explain the GWAS signals. The gray and blue dots indicate the GWAS p-value before and after conditioning on the jointly significant gene. Abbreviations: DC, dendritic cell; GWAS, genome-wide association study; PP, posterior probability; TWAS, transcriptome-wide association study.
Tables
Table 1
Characteristics of the GWAS data for MR.
| Phenotype | Year | Sample size (n case/n control) | n SNP (million) | Ancestry | Unit | Consortium/cohort | PMID |
|---|---|---|---|---|---|---|---|
| Exposure | |||||||
| Circulating immune cells | 2020 | 563,946 | 15 | European | nl | BCC | 32888494 |
| Lymphocyte subsets | 2020 | 3757 | 15.2 | European | µg | Sardinian cohort | 32929287 |
| Outcome | |||||||
| Periodontitis | 2019 | 35,096 (12,251/22,845) | 10.8 | European | Event | GLIDE | 31235808 |
| Chronic periodontitis (FinnGen) | 2023 | 263,668 (4434/259,234) | 20.2 | European | Event | FinnGen (R9K11) | 36653562 |
| Chronic gingivitis (FinnGen) | 2021 | 196,245 (850/195,395) | 16.4 | European | Event | FinnGen (R5K11) | |
| Gingival hyperplasia (FinnGen) | 2023 | 259,613 (379/259,234) | 20.2 | European | Event | FinnGen (R9K11) | |
| Covariate | |||||||
| Cigarettes smoked per day | 2019 | 249,752 | 12 | European | 1/SD | GSCAN | 30643251 |
| Fasting plasma glucose | 2021 | 200,622 | 31 | European | mmol/l | MAGIC | 34059833 |
| Body mass index | 2018 | 681,275 | 2.3 | European | kg/m2 | GIANT | 30124842 |
Table 2
Ranking of risk factors and models for periodontitis in MR-BMA analysis.
| Trait | Ranking by MIP | MIP | MACE | Ranking by PP | PP | MSCE |
|---|---|---|---|---|---|---|
| Neutrophil | 1 | 0.895 | 0.097 | 1 | 0.771 | 0.108 |
| Natural killer T cell | 2 | 0.135 | −0.003 | 2 | 0.056 | −0.017 |
| Plasmacytoid DC | 3 | 0.102 | 0 | 3 | 0.045 | 0.007 |
-
DC, dendritic cell; MACE, average causal effect of risk factor model; MIP, marginal inclusion probability; MR-BMA, Mendelian randomization-Bayesian model averaging; MSCE, model-specific causal estimates; PP, poster probability.
Table 3
TWAS and colocalization analysis identified genes involved in multiple phenotypes.
| Gene name | Position | Phenotype | TWAS Z-score | TWAS p val | Perm p val | Model p val | PP.H3 | PP.H4 |
|---|---|---|---|---|---|---|---|---|
| S100A9 | 1q21.3 | Neutrophil | 7.225 | 5.0 × 10⁻¹³ | 0 | 1.7 × 10⁻¹⁷ | 0.035 | 0.962 |
| Periodontitis | −3.564 | 3.7 × 10⁻⁴ | 1.3 × 10⁻³ | 1.7 × 10⁻¹⁷ | 0.008 | 0.259 | ||
| S100A12 | 1q21.3 | Neutrophil | 7.310 | 2.7 × 10⁻¹³ | 1.7 × 10⁻⁴ | 4.1 × 10−43 | 0.027 | 0.970 |
| Periodontitis | −3.513 | 4.4 × 10⁻⁴ | 8.1 × 10⁻⁴ | 4.1 × 10−43 | 0.008 | 0.244 | ||
| MCM6 | 2q21.3 | Neutrophil | −5.549 | 2.9 × 10⁻⁸ | 0 | 3.5 × 10⁻¹³ | 0 | 0.999 |
| Plasmacytoid DC | 7.172 | 7.4 × 10⁻¹³ | 2.7 × 10⁻³ | 3.5 × 10⁻¹³ | 1.000 | 0 | ||
| PI4KAP2 | 22q11.21 | Neutrophil | 5.345 | 9.0 × 10⁻⁸ | 3.3 × 10⁻³ | 3.7 × 10−39 | 0.003 | 0.016 |
| Plasmacytoid DC | 5.322 | 1.0 × 10⁻⁷ | 3.2 × 10⁻³ | 3.7 × 10−39 | 0.009 | 0.045 |
-
DC, dendritic cell; Perm, permutation test; PP, posterior probability; TWAS, transcriptome-wide association study.
Author response table 1
Organizations and Samplesize in the GTEx database.
| ID | Tissue | N | ID | Tissue | N |
|---|---|---|---|---|---|
| 1 | Muscle_Skeletal | 706 | 28 | Artery_Coronary | 213 |
| 2 | Whole_Blood | 670 | 29 | Brain_Cerebellum | 209 |
| 3 | Skin_Sun_Exposed_Lower_leg | 605 | 30 | Liver | 208 |
| 4 | Artery_Tibial | 584 | 31 | Brain_Cortex | 205 |
| 5 | Adipose_Subcutaneous | 581 | 32 | Brain_Nucleus_accumbens_basal_ganglia | 202 |
| 6 | Thyroid | 574 | 33 | Brain_Caudate_basal_ganglia | 194 |
| 7 | Nerve_Tibial | 532 | 34 | Brain_Cerebellar_Hemisphere | 175 |
| 8 | Skin_Not_Sun_Exposed_Suprapubic | 517 | 35 | Brain_Frontal_Cortex_BA9 | 175 |
| 9 | Lung | 515 | 36 | Small_Intestine_Terminal_Ileum | 174 |
| 10 | Esophagus_Mucosa | 497 | 37 | Brain_Hypothalamus | 170 |
| 11 | Cells_Cultured_fibroblasts | 483 | 38 | Brain_Putamen_basal_ganglia | 170 |
| 12 | Adipose_Visceral_Omentum | 469 | 39 | Ovary | 167 |
| 13 | Esophagus_Muscularis | 465 | 40 | Brain_Hippocampus | 165 |
| 14 | Breast_Mammary_Tissue | 396 | 41 | Brain_Anterior_cingulate_cortex_BA24 | 147 |
| 15 | Artery_Aorta | 387 | 42 | Cells_EBV-transformed_lymphocytes | 147 |
| 16 | Heart_Left_Ventricle | 386 | 43 | Minor_Salivary_Gland | 144 |
| 17 | Heart_Atrial_Appendage | 372 | 44 | Vagina | 141 |
| 18 | Colon_Transverse | 368 | 45 | Brain_Amygdala | 129 |
| 19 | Esophagus_Gastroesophageal_Junction | 330 | 46 | Uterus | 129 |
| 20 | Stomach | 324 | 47 | Brain_Spinal_cord_cervical_c-1 | 126 |
| 21 | Testis | 322 | 48 | Brain_Substantia_nigra | 114 |
| 22 | Colon_Sigmoid | 318 | 49 | Kidney_Cortex | 73 |
| 23 | Pancreas | 305 | 50 | Bladder | 21 |
| 24 | Pituitary | 237 | 51 | Cervix_Endocervix | 10 |
| 25 | Adrenal_Gland | 233 | 52 | Cervix_Ectocervix | 9 |
| 26 | Spleen | 227 | 53 | Fallopian_Tube | 8 |
| 27 | Prostate | 221 | 54 | Kidney_Medulla | 4 |
Additional files
-
Supplementary file 1
Case definition and exclusion criteria in included genome-wide association studies (GWASs).
Characteristics of the single-nucleotide polymorphisms (SNPs) used as instrumental variables (IVs) in the Mendelian randomization (MR). Effect estimates of causal associations between circulating immune cells and periodontitis risk. The heterogeneity and horizontal pleiotropy of the main results using Cochran’s Q-statistics and MR-Egger intercept. Effect estimates of causal associations after excluding outliers in RadialMR for two features with considerable heterogeneity. Effect estimates of causal associations after excluding influential or outlier SNPs for significant results. Effect estimates of causal associations between circulating immune cells and chronic periodontitis, chronic gingivitis, and gingival hyperplasia in subgroup analysis. Effect estimates of the reverse associations between periodontitis and circulating immune cells. Effect estimates of causal associations after mutual and covariate correction in multivariable Mendelian randomization (MVMR). Ranking of models according to their posterior probability (PP) using Mendelian randomization-Bayesian model averaging (MR-BMA) analysis. Results of transcriptome-wide association study (TWAS), conditional analysis, permutation testing, and colocalization analysis on neutrophil, natural killer T cell, plasmacytoid dendritic cell (DC), and periodontitis.
- https://cdn.elifesciences.org/articles/92895/elife-92895-supp1-v1.xlsx
-
Supplementary file 2
Strengthening the Reporting of Observational Studies in Epidemiology using the Mendelian Randomization (STROBE-MR) checklist.
- https://cdn.elifesciences.org/articles/92895/elife-92895-supp2-v1.doc
-
MDAR checklist
- https://cdn.elifesciences.org/articles/92895/elife-92895-mdarchecklist1-v1.pdf
Download links
A two-part list of links to download the article, or parts of the article, in various formats.
Downloads (link to download the article as PDF)
Open citations (links to open the citations from this article in various online reference manager services)
Cite this article (links to download the citations from this article in formats compatible with various reference manager tools)
Genetic associations between circulating immune cells and periodontitis highlight the prospect of systemic immunoregulation in periodontal care
eLife 12:RP92895.
https://doi.org/10.7554/eLife.92895.3


