Surprising features of nuclear receptor interaction networks revealed by live-cell single-molecule imaging
- Department of Molecular and Cell Biology, United States
- Howard Hughes Medical Institute, University of California, United States
- Eikon Therapeutics Inc, Hayward, California, United States
Figures
Figure 1 with 4 supplements
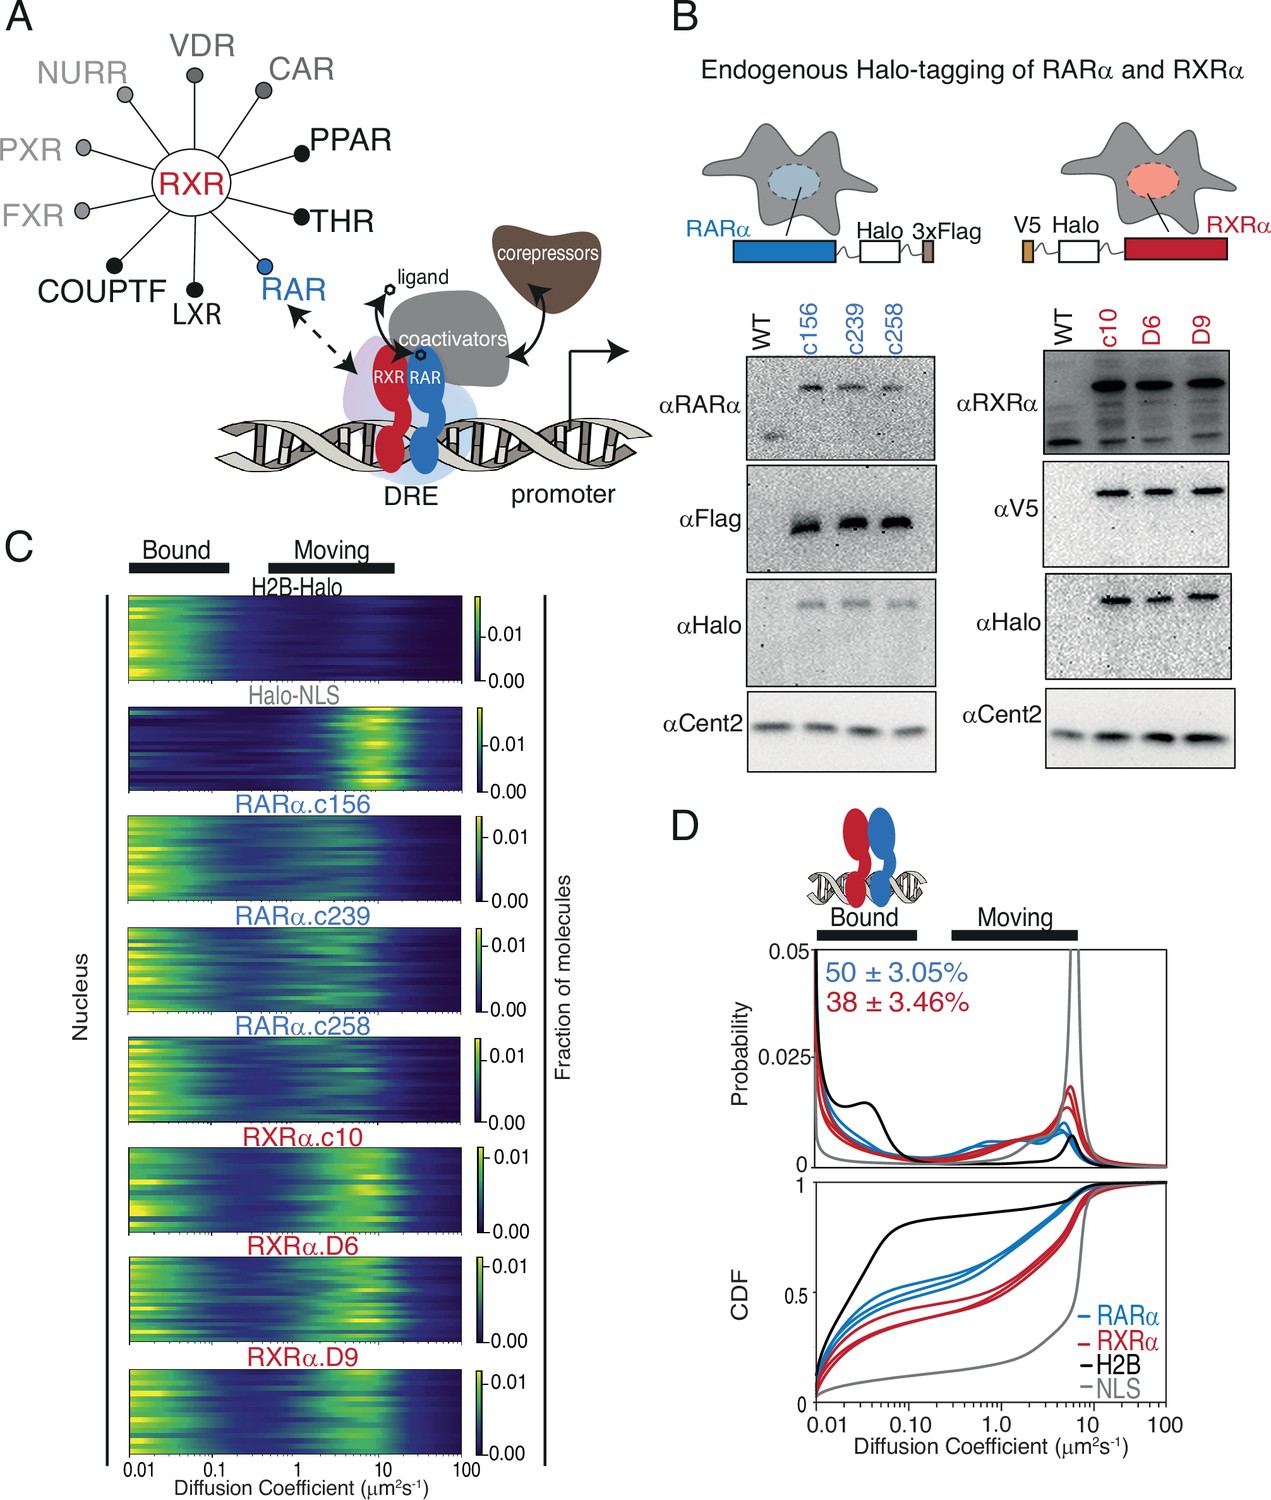
Endogenous Halo-tagging of RARa and RXRa to characterize their diffusive behavior.
(A) Schematic showing Type II nuclear receptors (T2NRs) like RXR-RAR bind direct response elements (DREs) as heterodimers to activate or repress transcription by recruiting co-activators (in presence of ligand) or co-repressors (in absence of ligand). A competitive interaction network between the obligate heterodimeric partner RXR with other T2NRs acts as a complex regulatory node for gene expression. Mechanistic features of protein-protein interaction within this regulatory node and its effect on chromatin binding in live cells are yet to be explored. (B) Cartoon showing Halo-tagging scheme of RARa and RXRa along with western blots of U2OS wild-type (WT) and knock-in (KI) RARa (left) and RXRa (right) homozygous clones. (C) Fast single-molecule tracking (fSMT). Likelihood of diffusion coefficients based on model of Brownian diffusion with normally distributed localization error for H2B-Halo (black), Halo-NLS (gray), RARa clones (blue), and RXRa clones (red) with black lines on top of the figure illustrating bound and moving populations. Each line represents a nucleus. (D) Diffusive spectra, probability density function (top), and cumulative distribution function (CDF) (bottom) - with drawing illustrating bound states as heterodimers of RARa and RXRa bound to chromatin.
-
Figure 1—source data 1
Includes one PDF file explaining original western blots probing RAR clones with anti-RAR and anti-Flag along with relevant loading controls for Figure 1B and Figure 1—figure supplement 2A, which are cropped and full-length versions respectively, of the same gels.
- https://cdn.elifesciences.org/articles/92979/elife-92979-fig1-data1-v1.pdf
-
Figure 1—source data 2
Includes one PDF file explaining original western blots probing RAR clones with anti-Halo along with relevant loading controls for Figure 1B and Figure 1—figure supplement 2A, which are cropped and full-length versions respectively, of the same gels.
- https://cdn.elifesciences.org/articles/92979/elife-92979-fig1-data2-v1.pdf
-
Figure 1—source data 3
Includes one PDF file explaining original western blots probing RXR clones with anti-RXR (C-term) and anti-RXR (N-term) along with relevant loading controls for Figure 1B and Figure 1—figure supplement 2B, which are cropped and full-length versions respectively, of the same gels.
- https://cdn.elifesciences.org/articles/92979/elife-92979-fig1-data3-v1.pdf
-
Figure 1—source data 4
Includes one PDF file explaining original western blots probing RXR clones with anti-Halo and anti-V5 along with relevant loading controls for Figure 1, Figure 1—figure supplement 2B, which are cropped and full-length versions respectively, of the same gels.
- https://cdn.elifesciences.org/articles/92979/elife-92979-fig1-data4-v1.pdf
-
Figure 1—source data 5
Includes six raw images (tif) of western blots probing RAR clones with anti-RAR and anti-Flag along with relevant loading controls, displayed in Figure 1B and Figure 1—figure supplement 2A.
- https://cdn.elifesciences.org/articles/92979/elife-92979-fig1-data5-v1.zip
-
Figure 1—source data 6
Includes four raw images (tif) of western blots probing RAR clones with anti-Halo along with relevant loading controls, displayed in Figure 1B and Figure 1—figure supplement 2A.
- https://cdn.elifesciences.org/articles/92979/elife-92979-fig1-data6-v1.zip
-
Figure 1—source data 7
Includes six raw images (tif) of western blots probing RXR clones with anti-RXR (C-term) and anti-RXR (N-term) along with relevant loading controls, displayed in Figure 1B and Figure 1—figure supplement 2B.
- https://cdn.elifesciences.org/articles/92979/elife-92979-fig1-data7-v1.zip
-
Figure 1—source data 8
Includes six raw images (tif) of western blots probing RXR clones with anti-Halo and anti-V5 along with relevant loading controls, displayed in Figure 1B and Figure 1—figure supplement 2B.
- https://cdn.elifesciences.org/articles/92979/elife-92979-fig1-data8-v1.zip
Figure 1—figure supplement 1
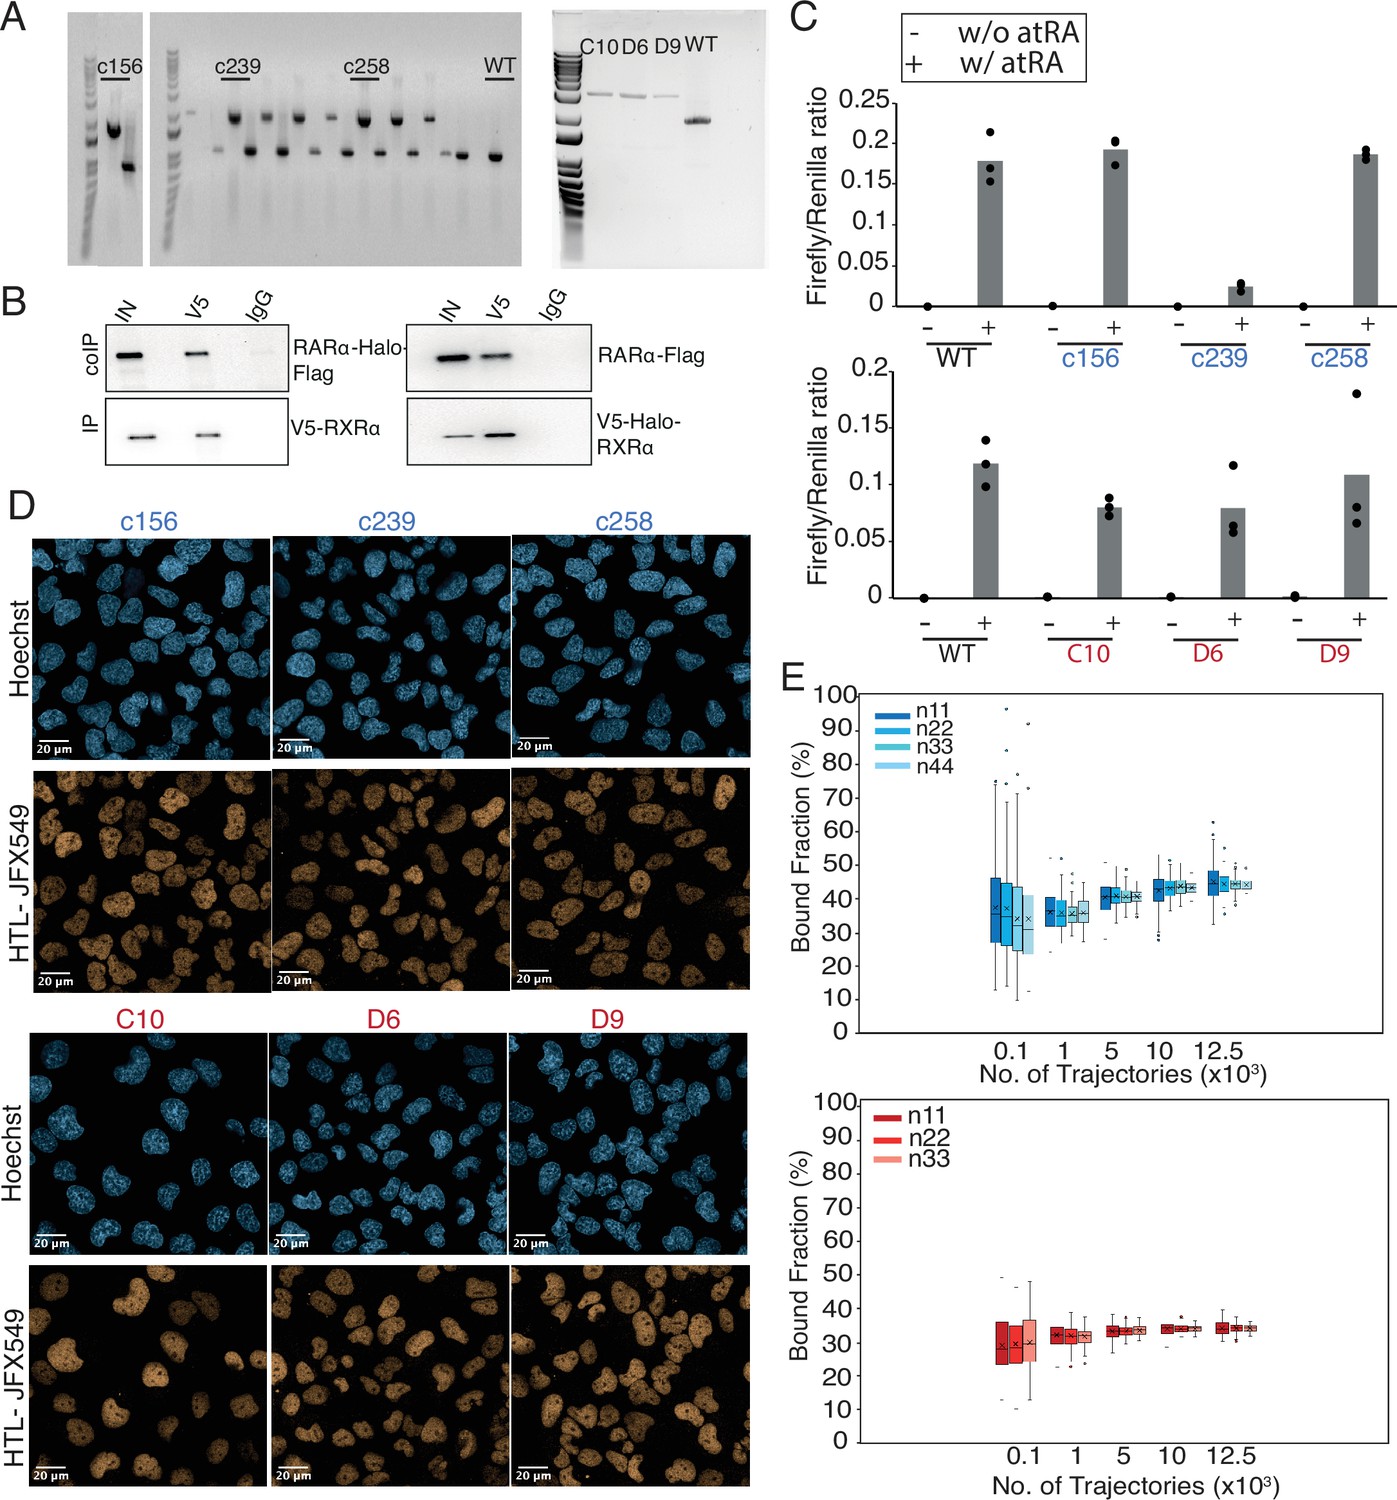
Verification of endogenous tagging and single-molecule tracking (SMT) analysis.
(A) Genotyping gels showing selected homozygously Halo-tagged (HT) RARα (c156, c239, and c258) and RXRα (C10, D6, and D9) clones. (B) Co-immunoprecipitation of overexpressed, HT RARα (left) and RXRα (right) in Cos7 cells. V5-tagged RXRα was immunoprecipitated and HT RARα was immunoblotted (left). HT RXRα was immunoprecipitated and Flag-tagged RARα was immunoblotted (right). (C) Luciferase assays showing retinoic acid responsive promoter activity of wild-type (WT) and HT RARα (top) and RXRα (bottom) clones in presence and absence of all-trans retinoic acid (atRA). (D) Confocal images of HT RARα (top) and RXRα (bottom) showing nuclear localization. (E) Subsampling knock-in (KI) RARα-Halo (blue, top) and Halo-RXRα (red, bottom) trajectories from fast SMT (fSMT) used to estimate fbound. Sampling (with replacement) was done by number of trajectories (100, 1000, 5000, 10,000, and 12,500) extracted from varying number of cells (11, 22, 33, and 44). For each sample size, 100 replicates were performed and plotted as box plot showing variation and cross (x) indicating the mean.
-
Figure 1—figure supplement 1—source data 1
Includes one file (pdf) containing and explaining each of the raw images shown in Figure 1—figure supplement 1B.
- https://cdn.elifesciences.org/articles/92979/elife-92979-fig1-figsupp1-data1-v1.zip
-
Figure 1—figure supplement 1—source data 2
Includes eight raw images (tif) for co-immunoprecipitation (co-IP) western blots displayed in Figure 1—figure supplement 1B.
- https://cdn.elifesciences.org/articles/92979/elife-92979-fig1-figsupp1-data2-v1.zip
Figure 1—figure supplement 2
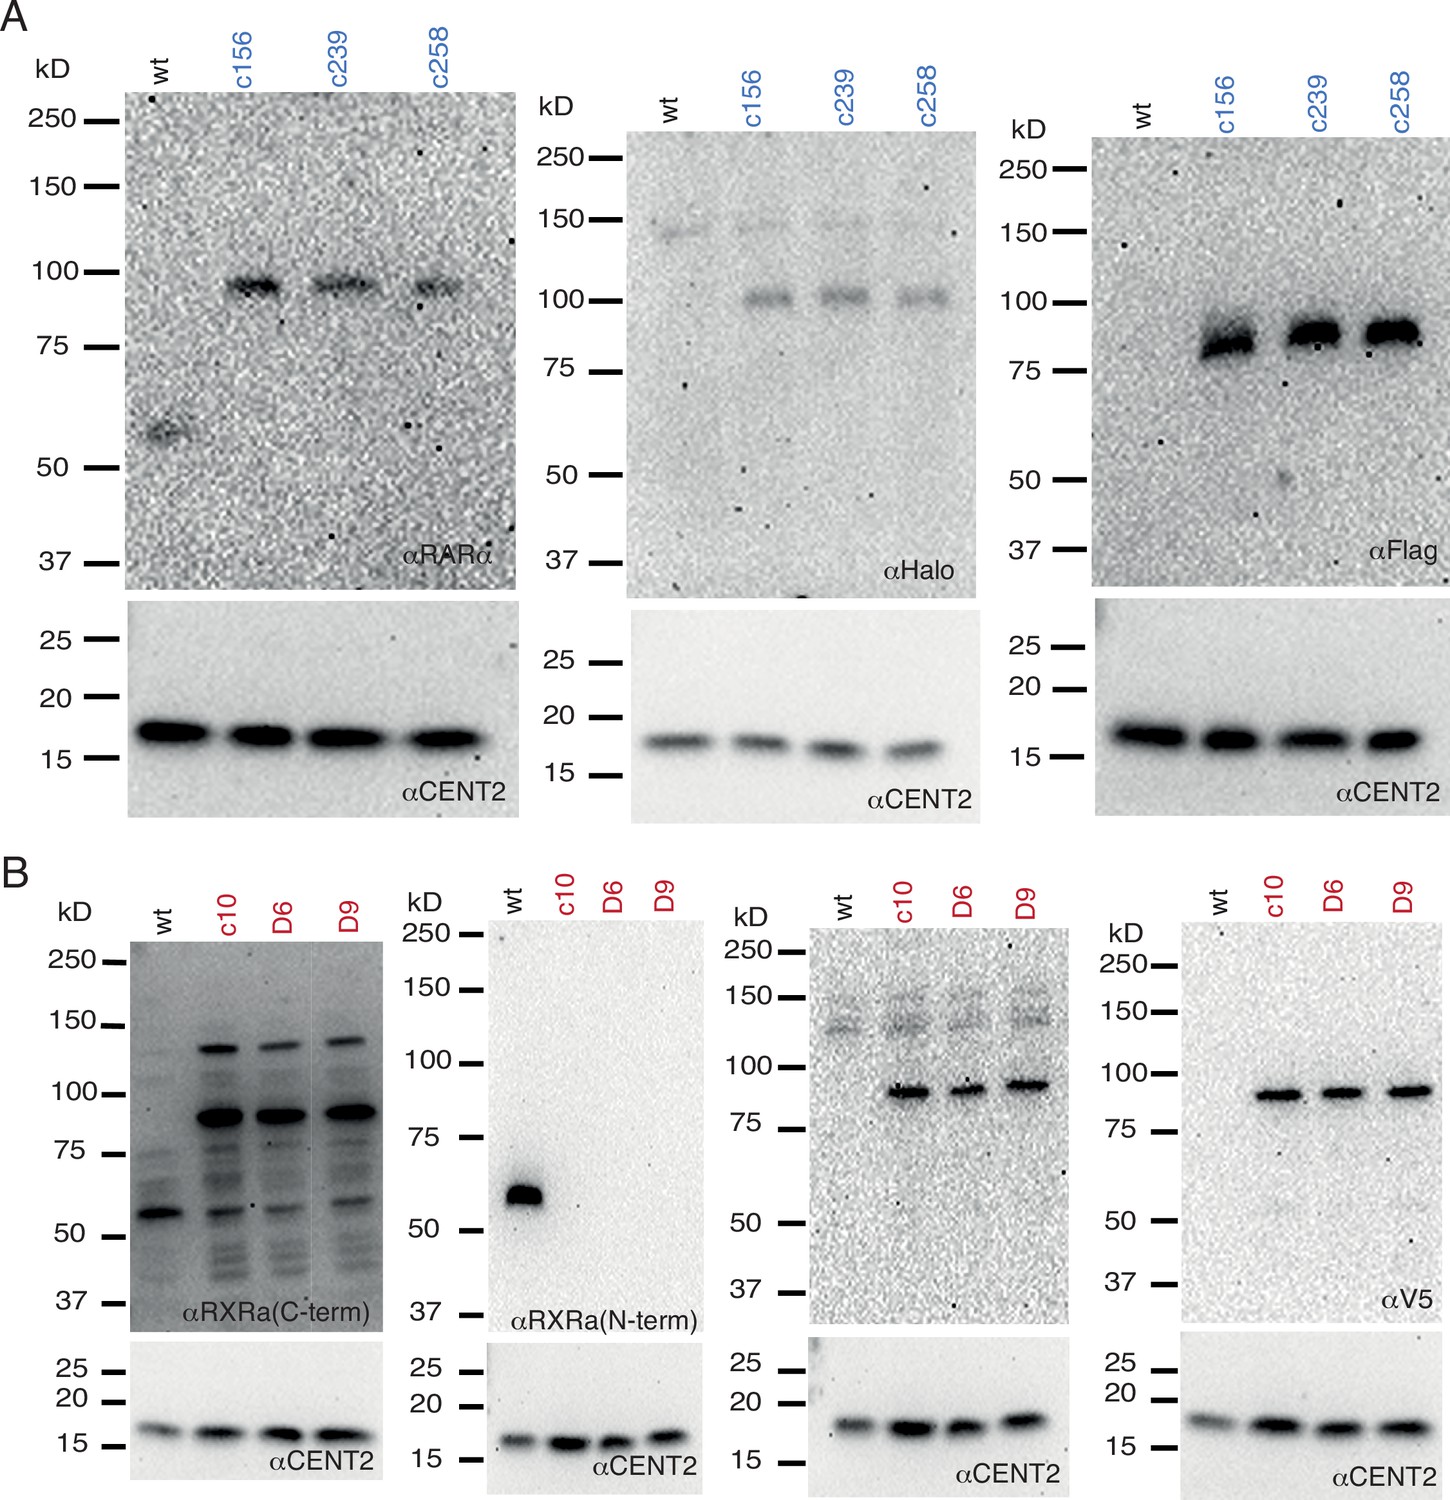
Full-length western blots of wild-type (WT) U2OS cells and homozygously Halo-tagged RARα and RXRα knock-in (KI) clones.
(A) RARα is detected in WT and KI clones using a specific antibody against RARα. RARα is also detected in KI clones using a specific antibody against Halo and Flag-tag. The lower part of the membrane was cut and blotted for Centrin2 as a loading control. (B) RXRα is detected in WT and KI clones using a specific antibody against a C-terminal epitope of RXRα. Since this antibody also recognizes other isoforms of RXR (~54 kDa), we validated RXRα expression by using an N-term epitope-specific antibody of RXRα. But this epitope sequence is disrupted by Halo-tagging at the N-terminal due to which it does not recognize HT-RXRα in KI clones. Our genotyping gels (Figure 1—figure supplement 1A) give a clean single band confirming homozygous tagging and Sanger sequencing confirmed correct tagging. RXRα is also detected in KI clones using a specific antibody against Halo and V5-tag which show a clean gel confirming correct Halo-tagged RXRα product. The lower part of the membrane was cut and blotted for Centrin2 as a loading control.
Figure 1—figure supplement 3
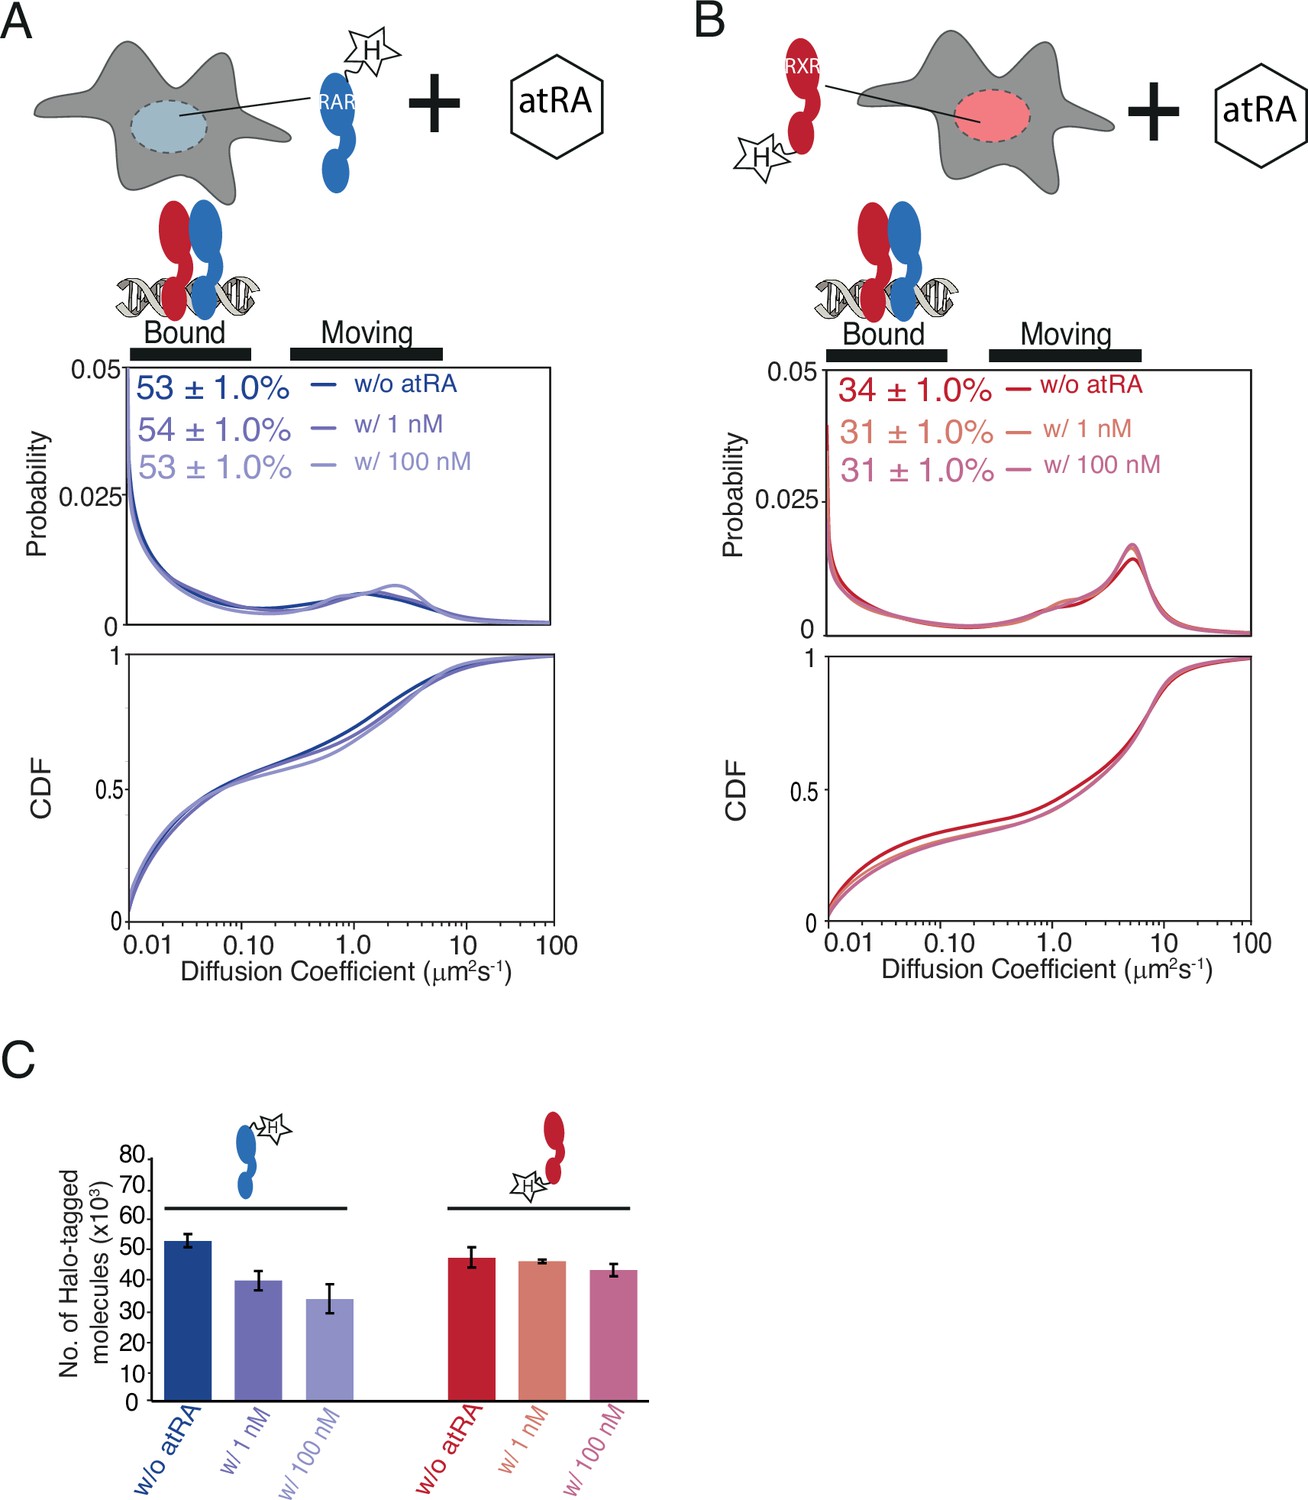
Diffusion behavior of endogenous RARα and RXRα with and without all-trans retinoic acid (atRA) treatment.
Diffusion spectra and cumulative distribution function of knock-in (KI) (Α) RARα-Halo and (B) Halo-RXRα in absence and presence of atRA. Cells were treated without or with 1 nm, and 100 nM atRA for 24 hr before single-molecule tracking (SMT) experiments. Dimethyl sulfoxide (DMSO) was added to cells without atRA treatment as a control. (C) Cellular abundance of KI RARα and RXRα with or without 24 hr treatment with atRA using flow cytometry analysis. Y-axis of bar plot shows number of Halo-tagged RARα and RXRα molecules. Error bars represent stdev of mean for three biological replicates.
Figure 1—figure supplement 4
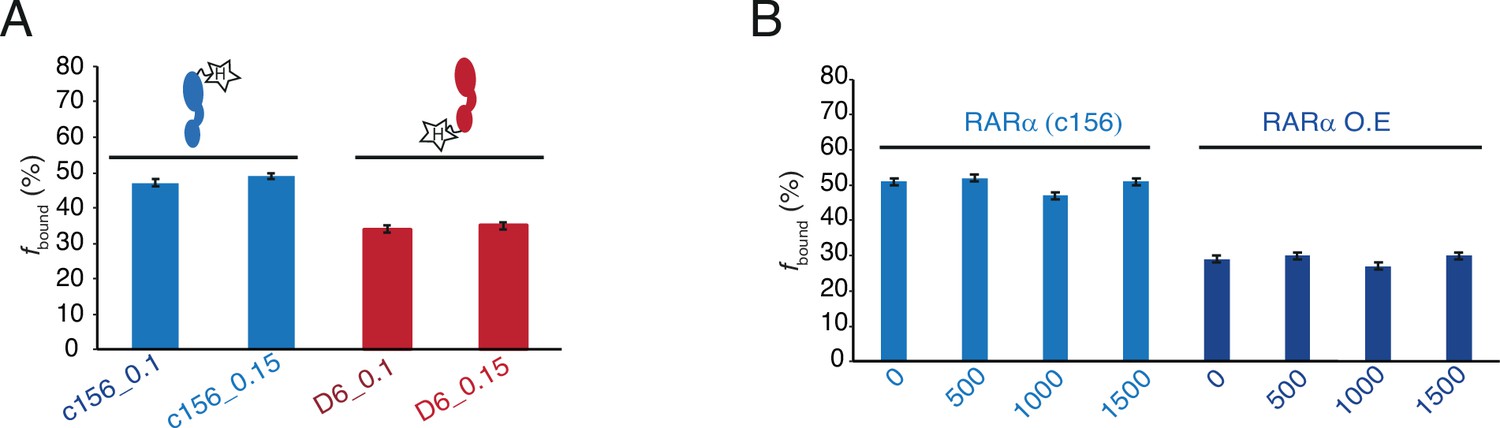
Diffusion coefficient and frame cut-off analysis in single-molecule tracking (SMT) data.
(A) Bar plot showing fbound% of knock-in (KI) Halo-tagged (HT) RARα (c156) and RXRα (D6) calculated with cut-off of 0.1 (μm2/s) and 0.15 (μm2/s) diffusion coefficients. (B) Bar plot showing fbound% of KI HT RARα (c156) and RARα overexpressed (OE) calculated with cut-off of 0, 500, 1000, and 1500 frames. Error bars denote stdev of bootstrapping mean.
Figure 2 with 5 supplements
Chromatin binding of RARα and RXRα can be saturated and is limited by RARα.
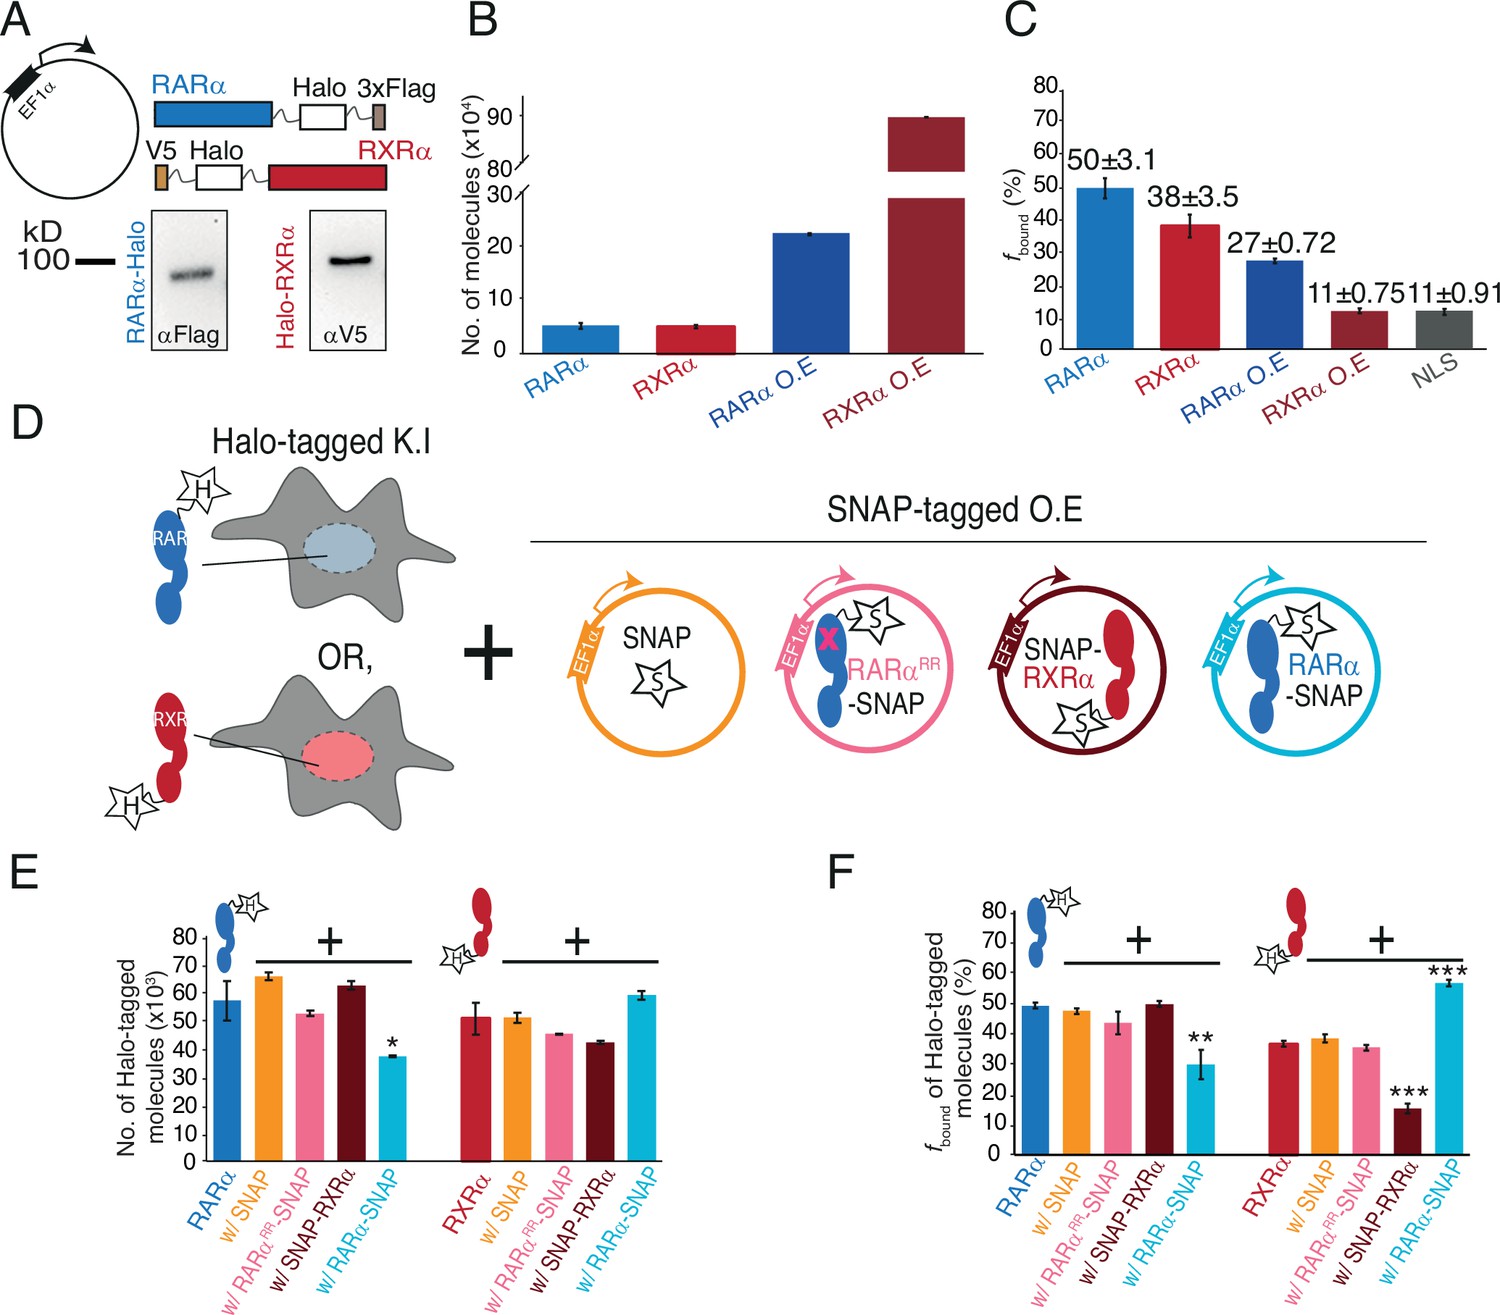
(A) Schematic and western blot of stably integrated EF1α promoter-driven Halo-tagged (HT) RARα (left) and RXRα (right) overexpression in wild-type (WT) U2OS cells. (B) Bar plot; y-axis shows number of HT knock-in (KI) and overexpressed (OE) RARα (blue) and RXRα (red) molecules quantified using flow cytometry. (C) Bar plot; y-axis depicts chromatin-bound fraction (fbound%) of KI and OE RARα, RXRα compared to Halo-NLS (control). (D) Assay condition schematics to determine which of the partners in the RARα/RXRα heterodimer complex is limiting for chromatin binding; parental KI HT RARα or RXRα clones with OE SNAP (orange), SNAP-RXRα (brown), RARα-SNAP (light blue), and RARαRR-SNAP (pink) using stably integrated EF1α promoter-driven transgene. (E) Bar chart; y-axis denotes number of KI HT RARα and RXRα molecules (depicted as blue and red cartoon respectively with ‘H’ labeled star attached) in presence or absence of transgene products. Error bars denote stdev of the mean from three biological replicates. (F) Bar plot showing fbound% of KI HT RARα and RXRα in presence or absence of exogenously expressed SNAP proteins. Error bars for (B), (E) denote stdev of the mean from three biological replicates. Error bars for (C), (F) represent stdev of bootstrapping mean. p-Value≤0.001 (***), ≤0.01 (**), and ≤0.05 (*).
-
Figure 2—source data 1
Includes one file (pdf) containing and explaining each of the raw images in Figure 2A, along with the loading controls.
- https://cdn.elifesciences.org/articles/92979/elife-92979-fig2-data1-v1.zip
-
Figure 2—source data 2
Includes eight raw images (tif) for western blots displayed in Figure 2A, along with the loading controls.
- https://cdn.elifesciences.org/articles/92979/elife-92979-fig2-data2-v1.zip
Figure 2—figure supplement 1
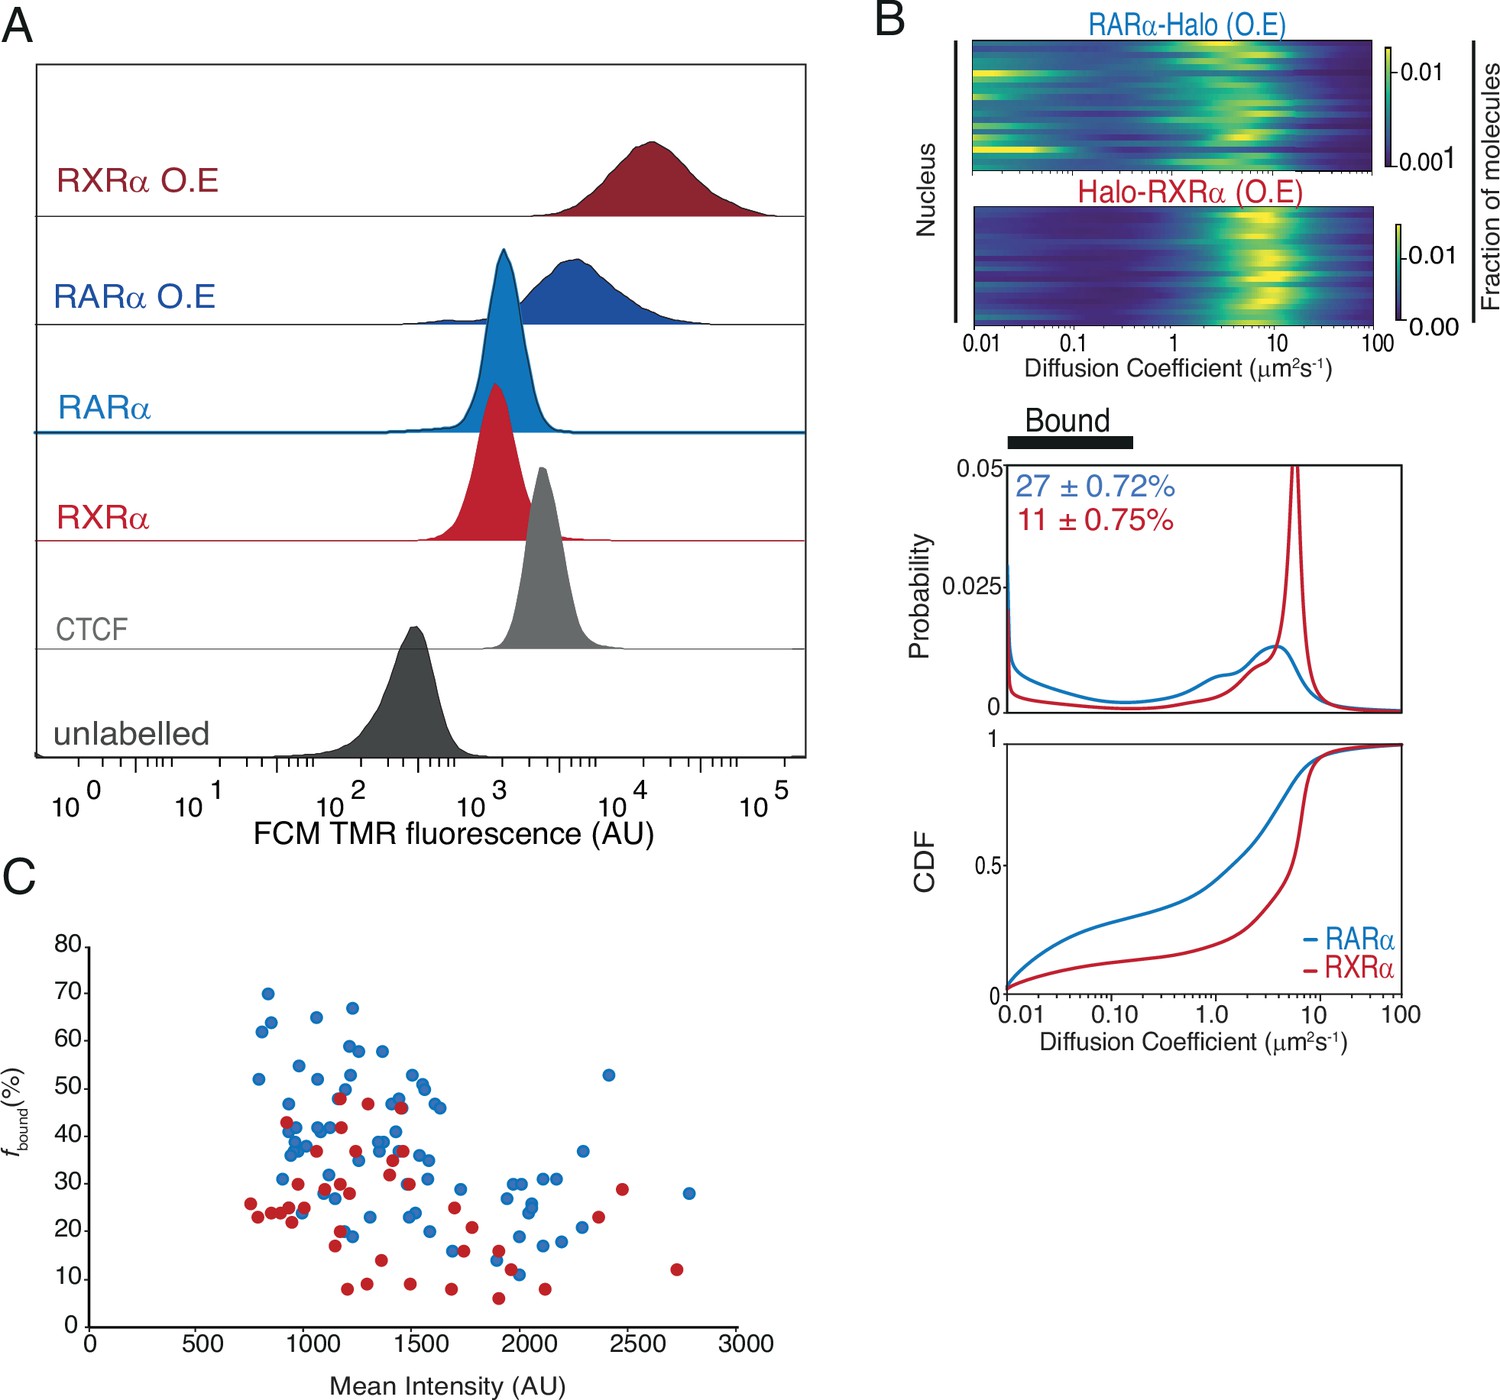
Cellular abundance and diffusion behavior of overexpressed Halo-tagged (HT) RARα and RXRα.
(A) Cellular abundance of HT knock-in (KI) versus overexpressed (OE) RARα and RXRα compared with standard Halo-CTCF cell line using flow cytometry analysis. X-axis shows TMR fluorescence intensity of HT molecules in U2OS cells. (B) Likelihood of diffusion coefficients for OE HT RARα and RXRα. Each line represents a nucleus. Diffusion spectra showing probability density function and cumulative distribution function for OE HT RARα and RXRα is shown underneath. (C) fbound% of KI and overexpressed HT RARα and RXRα extracted from single cells plotted against mean nuclear intensity of single cells. Each dot represents a data collected from a single nucleus.
Figure 2—figure supplement 2
Verification of mutant RARα (RARαRR) and exogenous SNAP-tagged protein expression.
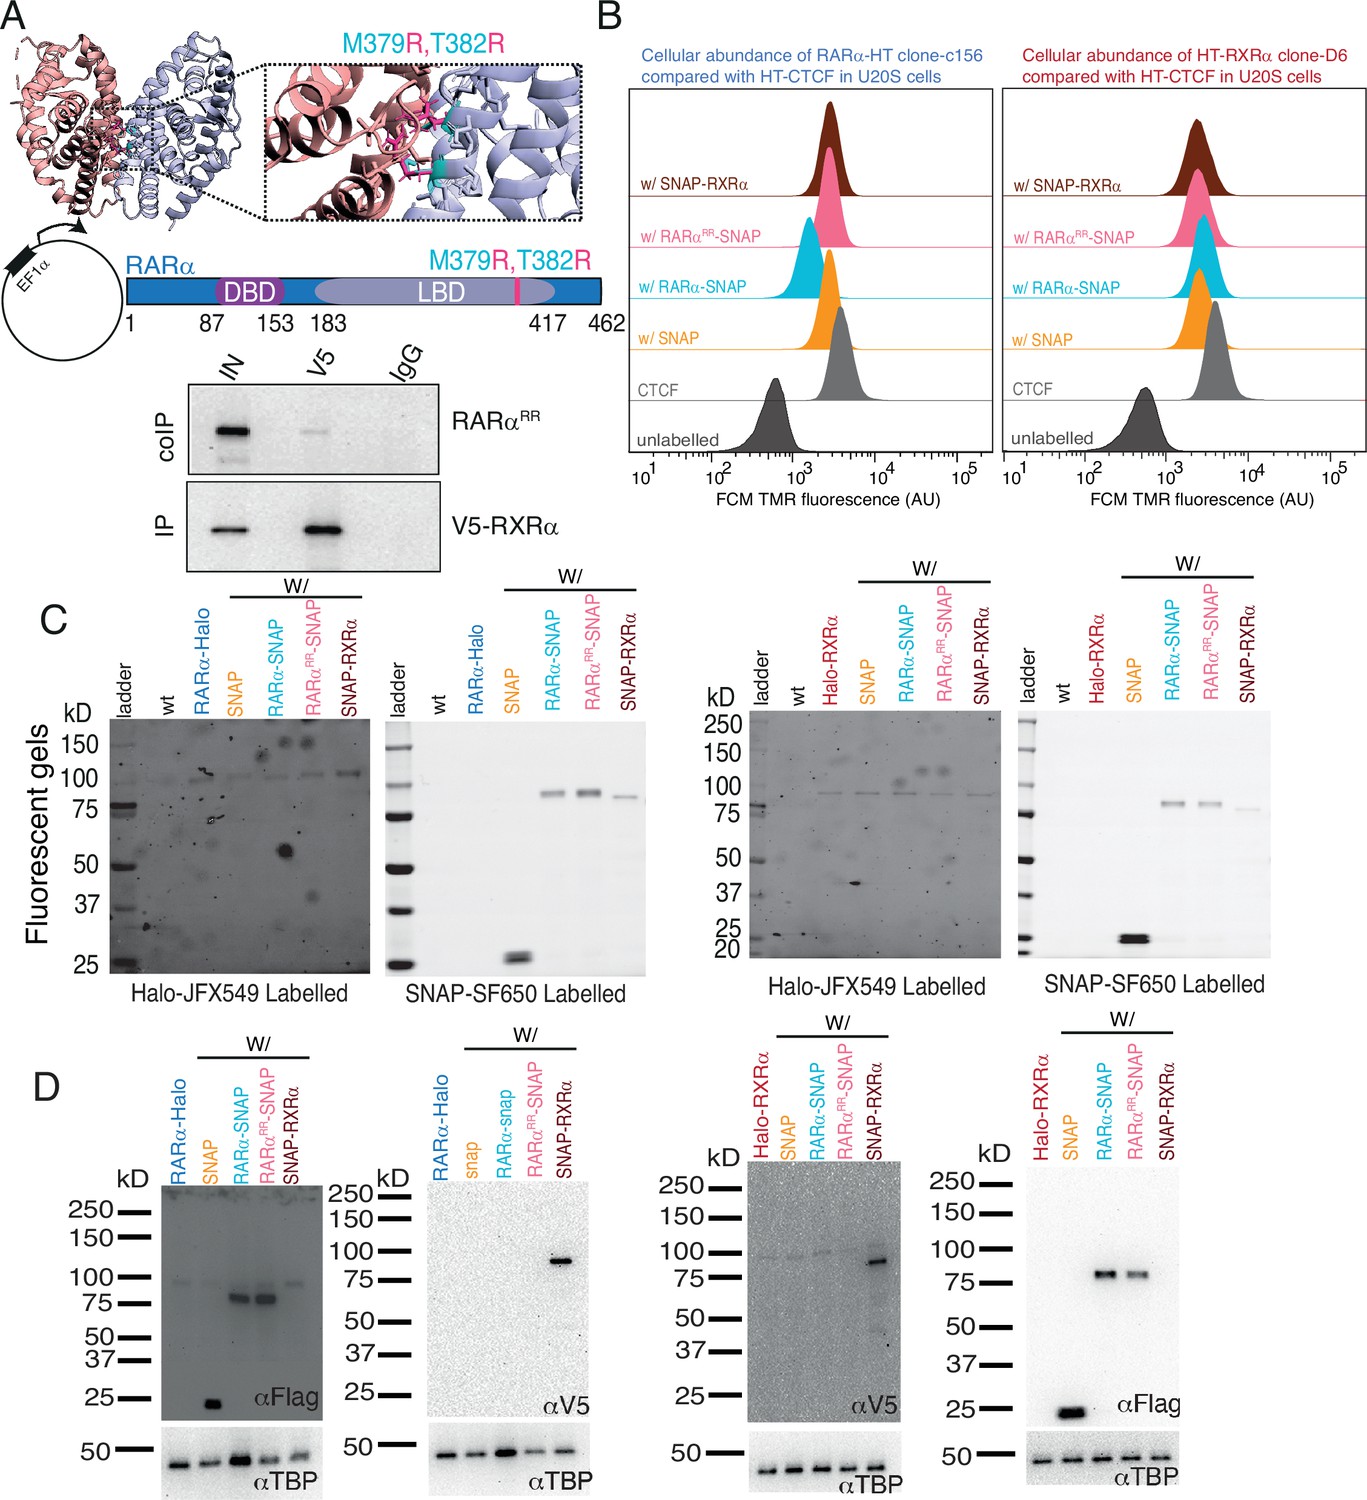
(A) Rosetta modeled structure of the ligand binding domain (LBD) of RARα (pale blue) and RXRα (pale red) heterodimer (PDB code: 1DKF) with point mutation M379R and T382R. Original residues M379 and T382 are shown as cyan sticks and substituted residue arginine (R) is shown as pink sticks. Below the PDB structure is a schematic representation of M379R,T382R mutation in RARα (RARαRR) along with co-immunoprecipitation in Cos7 cells. V5-tagged RXRα was immunoprecipitated and RARαRR was immunoblotted. RARαRR disrupts heterodimerization with RXRα. (B) Cellular abundance of knock-in (KI) Halo-tagged (HT) RARα and RXRα in presence of overexpressed (OE) SNAP proteins using flow cytometry (FCM) analysis. FCM estimated fluorescence of TMR labeled HT RARα and RXRα molecules were compared with Halo-CTCF in U2OS along with unlabeled U2OS control. (C) Fluorescent gels and (D) western blots showing HT KI RARα and RXRα along with OE SNAP proteins in stably integrated conditions. U2OS cells were labeled with Halo ligand JFX549 (100 nM) and SNAP ligand SF650 (50 nM) before lysis.
-
Figure 2—figure supplement 2—source data 1
Includes one file (pdf) containing and explaining each of the raw images shown in Figure 2—figure supplement 2A.
- https://cdn.elifesciences.org/articles/92979/elife-92979-fig2-figsupp2-data1-v1.pdf
-
Figure 2—figure supplement 2—source data 2
Includes four raw images (tif) for co-immunoprecipitation (co-IP) western blots displayed in Figure 2—figure supplement 2A.
- https://cdn.elifesciences.org/articles/92979/elife-92979-fig2-figsupp2-data2-v1.zip
-
Figure 2—figure supplement 2—source data 3
Includes one file (pdf) containing and explaining each of the raw fluorescent gel images shown in Figure 2—figure supplement 2C.
- https://cdn.elifesciences.org/articles/92979/elife-92979-fig2-figsupp2-data3-v1.pdf
-
Figure 2—figure supplement 2—source data 4
Includes four raw images (tif) for fluorescent gels displayed in Figure 2—figure supplement 2C.
- https://cdn.elifesciences.org/articles/92979/elife-92979-fig2-figsupp2-data4-v1.zip
-
Figure 2—figure supplement 2—source data 5
Includes one file (pdf) containing and explaining each of the raw western blot images for RAR-Halo w/ SNAP transcripts, as shown in Figure 2—figure supplement 2D.
- https://cdn.elifesciences.org/articles/92979/elife-92979-fig2-figsupp2-data5-v1.pdf
-
Figure 2—figure supplement 2—source data 6
Includes one file (pdf) containing and explaining each of the raw western blot images for Halo-RXR w/ SNAP transcripts, as shown in Figure 2—figure supplement 2D.
- https://cdn.elifesciences.org/articles/92979/elife-92979-fig2-figsupp2-data6-v1.pdf
-
Figure 2—figure supplement 2—source data 7
Includes six raw images (tif) of western blot images for RAR-Halo w/ SNAP transcripts displayed in Figure 2—figure supplement 2D.
- https://cdn.elifesciences.org/articles/92979/elife-92979-fig2-figsupp2-data7-v1.zip
-
Figure 2—figure supplement 2—source data 8
Includes six raw images (tif) of western blot images for Halo-RXR w/ SNAP transcripts displayed in Figure 2—figure supplement 2D.
- https://cdn.elifesciences.org/articles/92979/elife-92979-fig2-figsupp2-data8-v1.zip
Figure 2—figure supplement 3
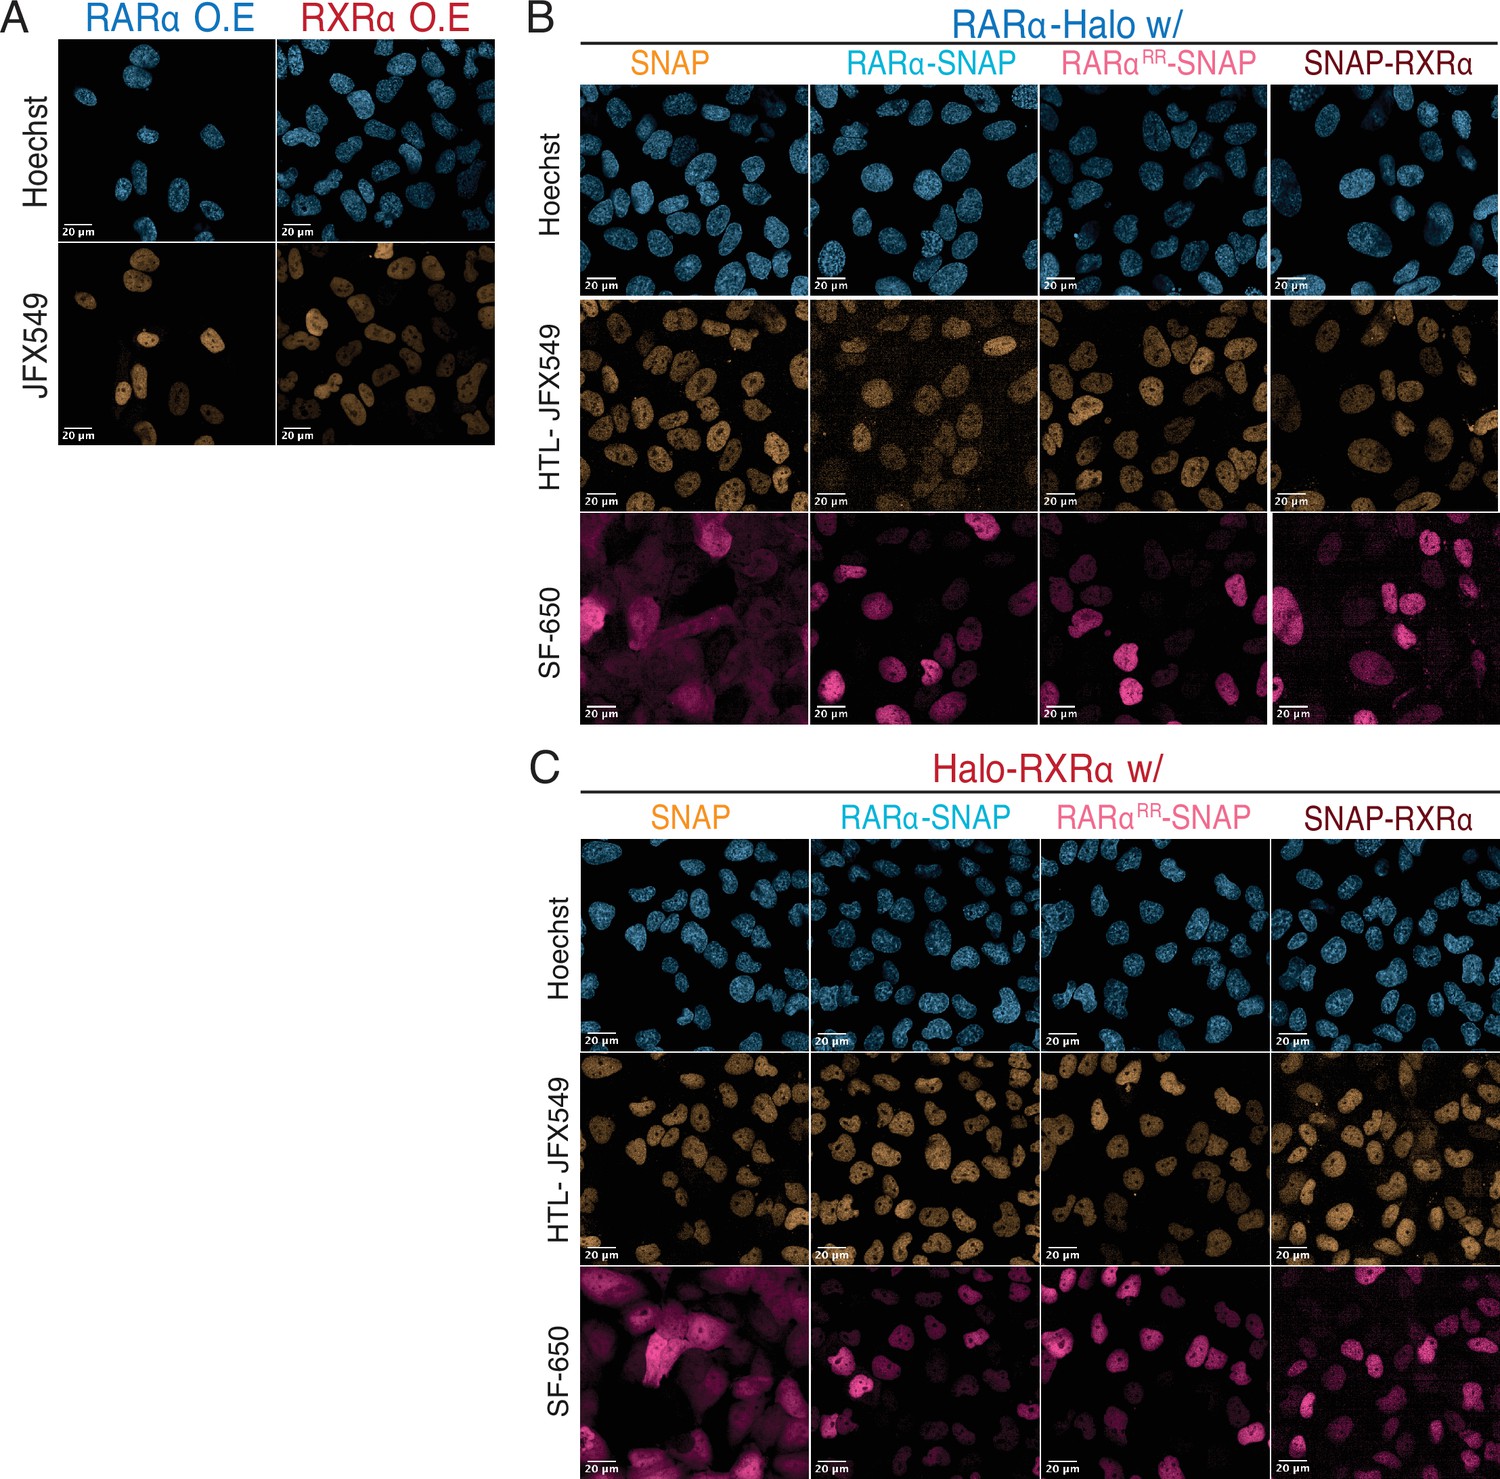
Live-cell confocal images to verify protein expression.
(A) Confocal images of overexpressed (OE) Halo-tagged (HT) RARα and RXRα. Confocal images of U2OS cells expressing knock-in (KI) HT (B) RARα and (C) RXRα in presence of stably integrated OE SNAP proteins. HT molecules were labeled with 100 nM JFX549, and SNAP-tagged (ST) molecules were labeled with SF-650.
Figure 2—figure supplement 4
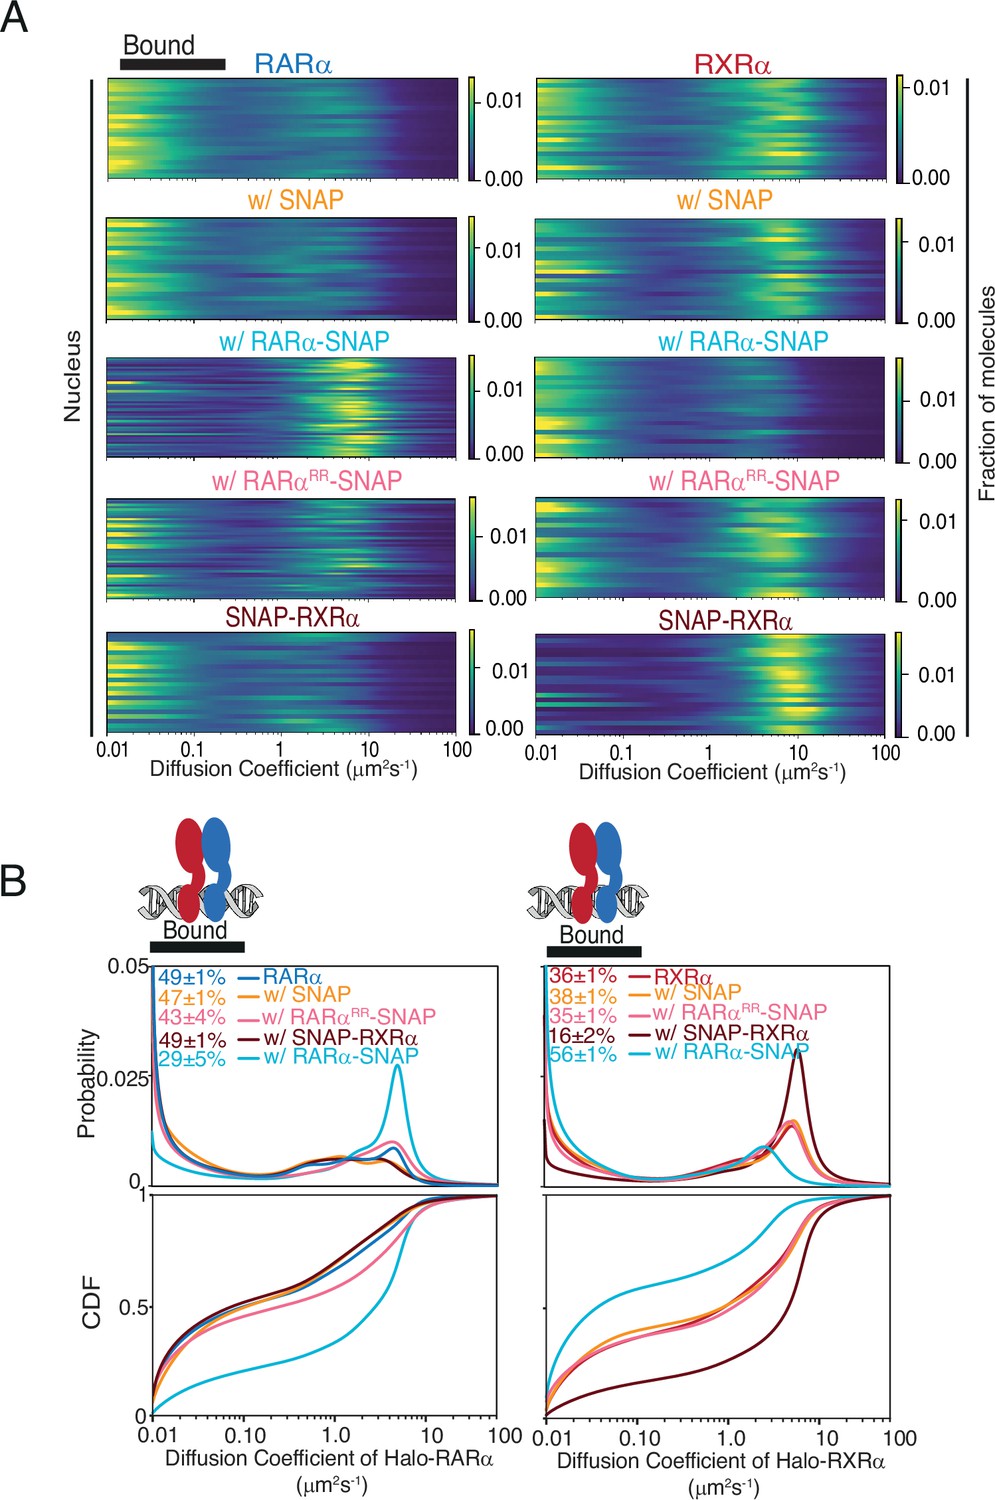
Fast single-molecule tracking (fSMT) of Halo-tagged (HT) RARα and RXRα with (w/) different transgene products.
(A) Likelihood diffusion coefficients and (B) diffusion spectra, probability density function (top), and cumulative distribution function (bottom) for knock-in (KI) HT RARα (left) and RXRα (right) in absence and presence of stably integrated overexpressed (OE) SNAP proteins. Each line in (A) represents a nucleus. fbound% reported shows chromatin binding of RXRα is limited by the availability of RARα but not vice versa. Cartoon above the spectra illustrates bound population as heterodimers of RARα and RXRα bound to chromatin.
Figure 2—figure supplement 5
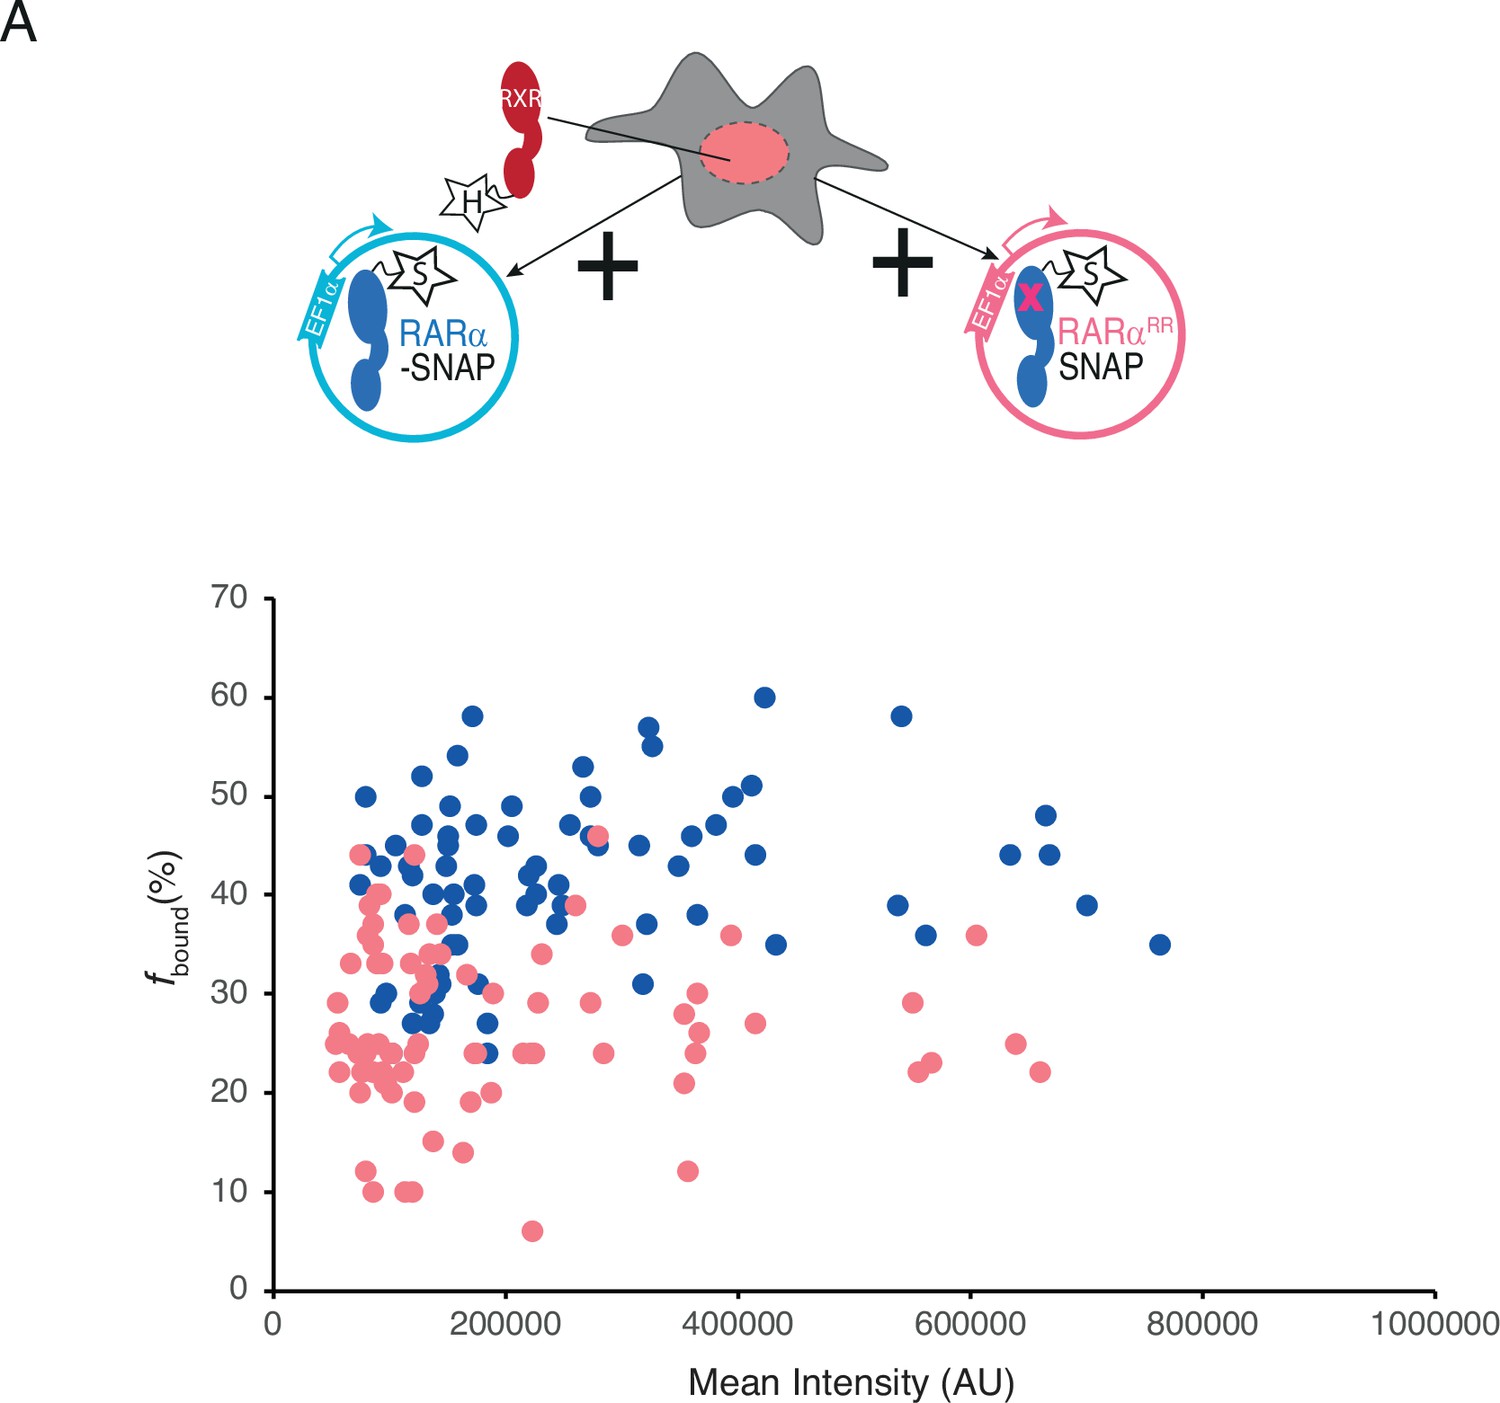
Single-molecule tracking (SMT) analysis to verify change in fbound% with respect to mean intensity.
(A) fbound% of knock-in (KI) Halo-tagged (HT) RXRα in presence of overexpressed RARα-SNAP and RARαRR-SNAP extracted from single cells plotted against mean nuclear intensity of single cells. Each dot represents a data collected from a single nucleus.
Figure 3 with 1 supplement
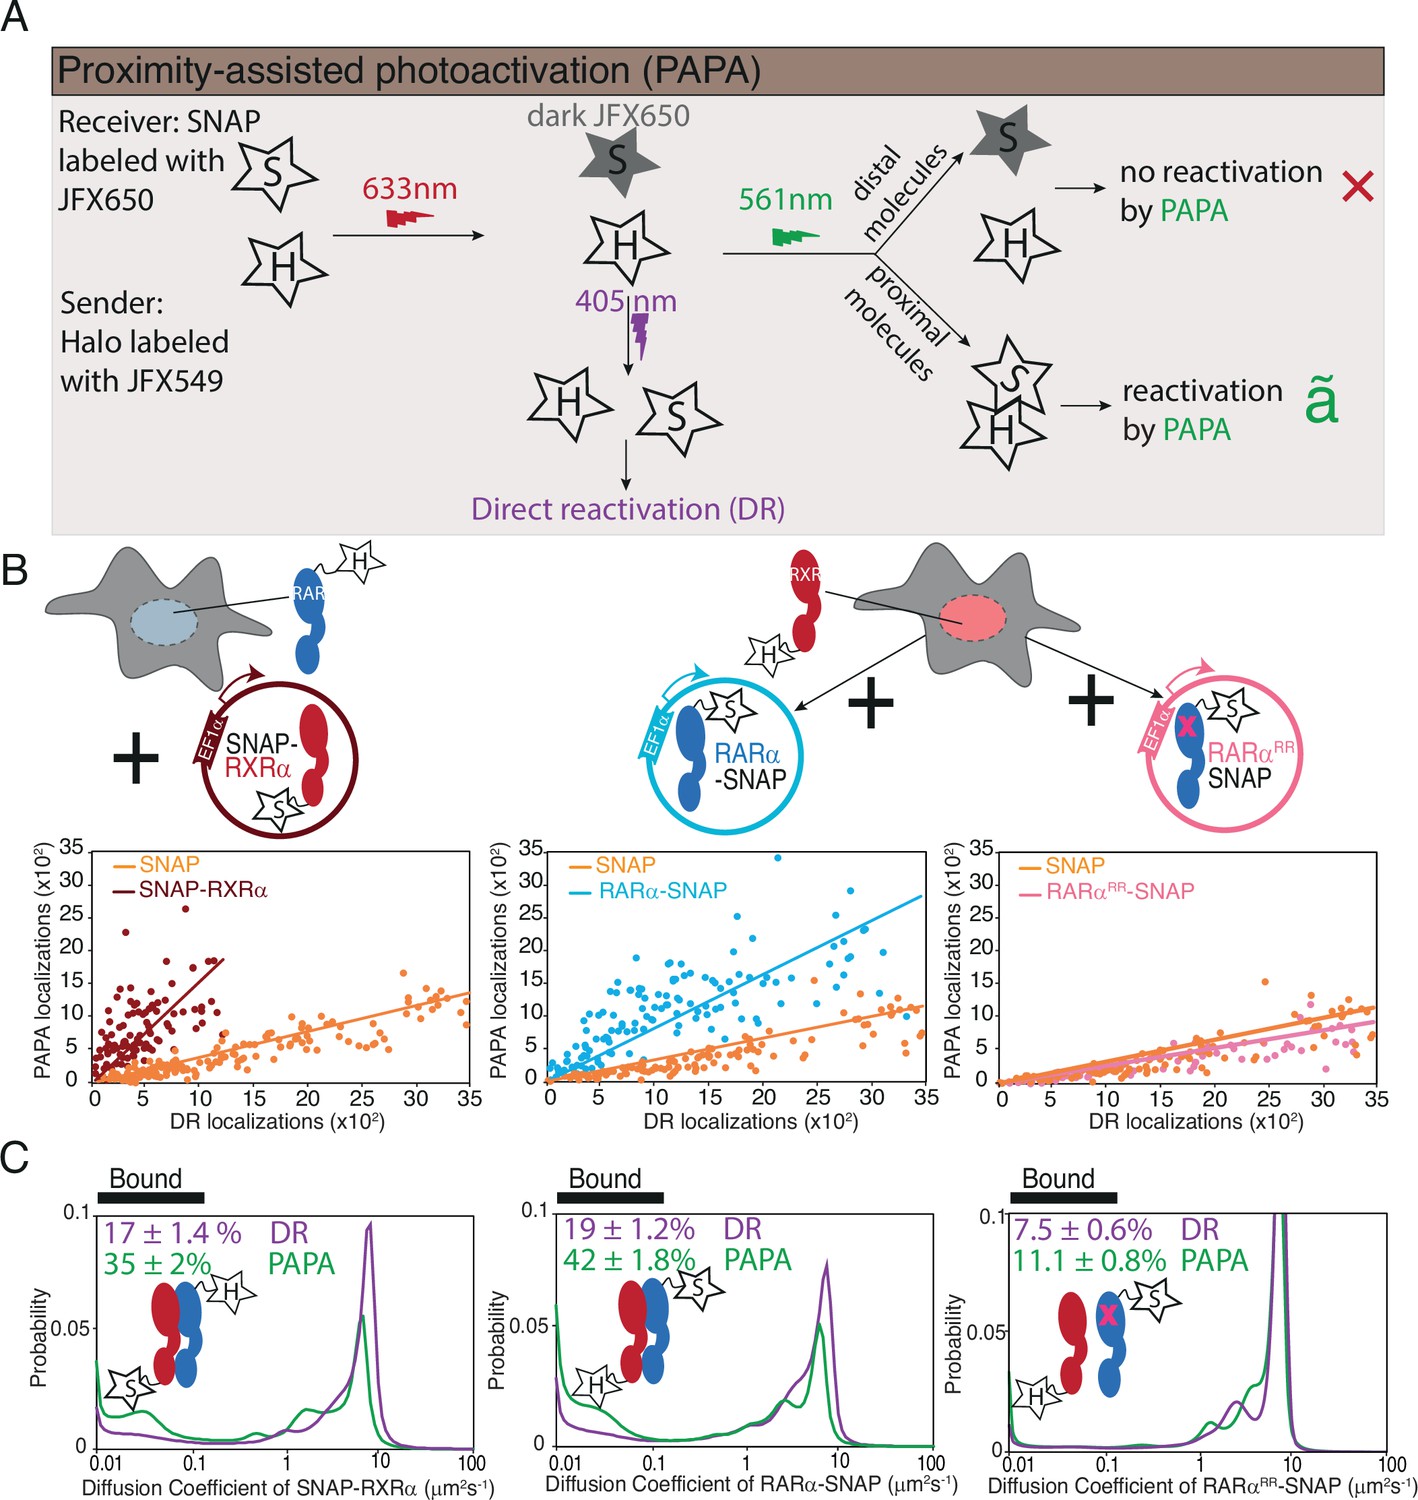
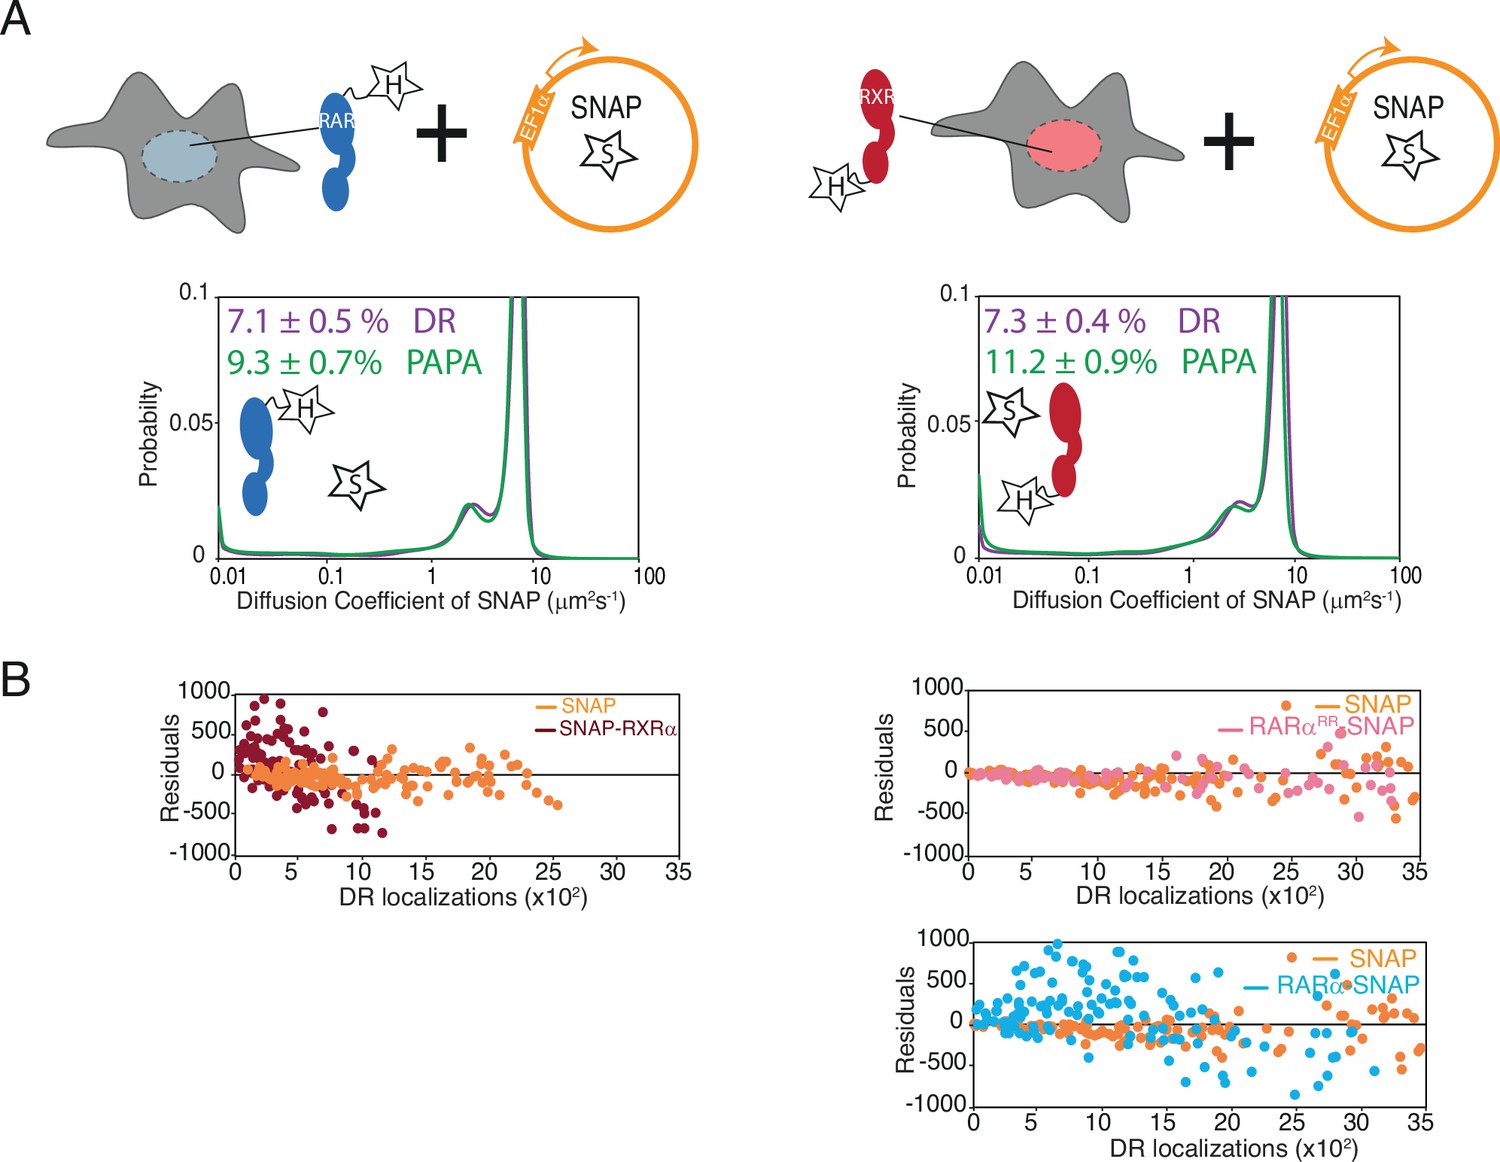
Proximity-assisted photoactivation (PAPA)-single-molecule tracking (SMT) shows direct interaction between Halo-tagged (HT) knock-in (KI) and SNAP-tagged overexpressed RARα and RXRα in live cells.
(A) Schematic illustrates how PAPA signal is achieved. First, SNAP-tagged (ST) protein is labeled with ‘receiver’ fluorophore like JFX650 (star with letter ‘S’) and HT protein is labeled with ‘sender’ fluorophore like JFX549 (star with letter ‘H’). When activated by intense red light the receiver fluorophore goes into a dark state (gray star with S). Upon illumination by green light, the receiver and sender molecules distal to one another do not get photoactivated (red X) but receiver SNAP molecules proximal to the sender gets photoactivated (green ✓). Pulses of violet light can induce direct reactivation (DR) of receiver independent of interaction with the sender. PAPA experiments. (B) Plots showing PAPA versus DR reactivation. (C) Diffusion spectra of PAPA and DR trajectories obtained for ST proteins for the represented conditions; parental HT RARα KI cell, stably expressing RXRα-SNAP (brown, left panel), as well as parental HT RXRα KI cell stably expressing RARα-SNAP (light blue, middle panel) and RARαRR-SNAP (light pink, right panel). A linear increase in PAPA versus DR reactivation is seen for non-interacting SNAP controls and a sublinear increase is seen for interacting SNAP proteins. Respective colored lines show linear fits of the data (see residuals in Figure 3—figure supplement 1B). SNAP control data are re-plotted in middle and right panels. Cartoon inside diffusion spectra depicts if the expressed HT and ST proteins are expected to interact or not. fbound% errors represent stdev of bootstrapping mean.
Figure 3—figure supplement 1
Controls for proximity-assisted photoactivation (PAPA) experiments.
(A) Diffusion spectra of PAPA and direct reactivation (DR) trajectories obtained for SNAP proteins below each corresponding conditions presented as cartoons; the parental Halo-tagged (HT) RARα (left) and RXRα (right) knock-in (KI) cells stably expressing control SNAP protein (orange). Cartoon inside diffusion spectra depicts that the expressed Halo and SNAP proteins are not expected to interact. (B) Residuals of the linear fit for PAPA versus DR localizations for SNAP (orange) and SNAP-RXRα (brown) proteins in presence of HT RARα (left panel), as well as SNAP (orange), RARαRR-SNAP (light pink), and RARα-SNAP (light blue) proteins in presence of HT RXRα (right panel). Same SNAP control data are re-plotted in all plots shown in (B).
Figure 4
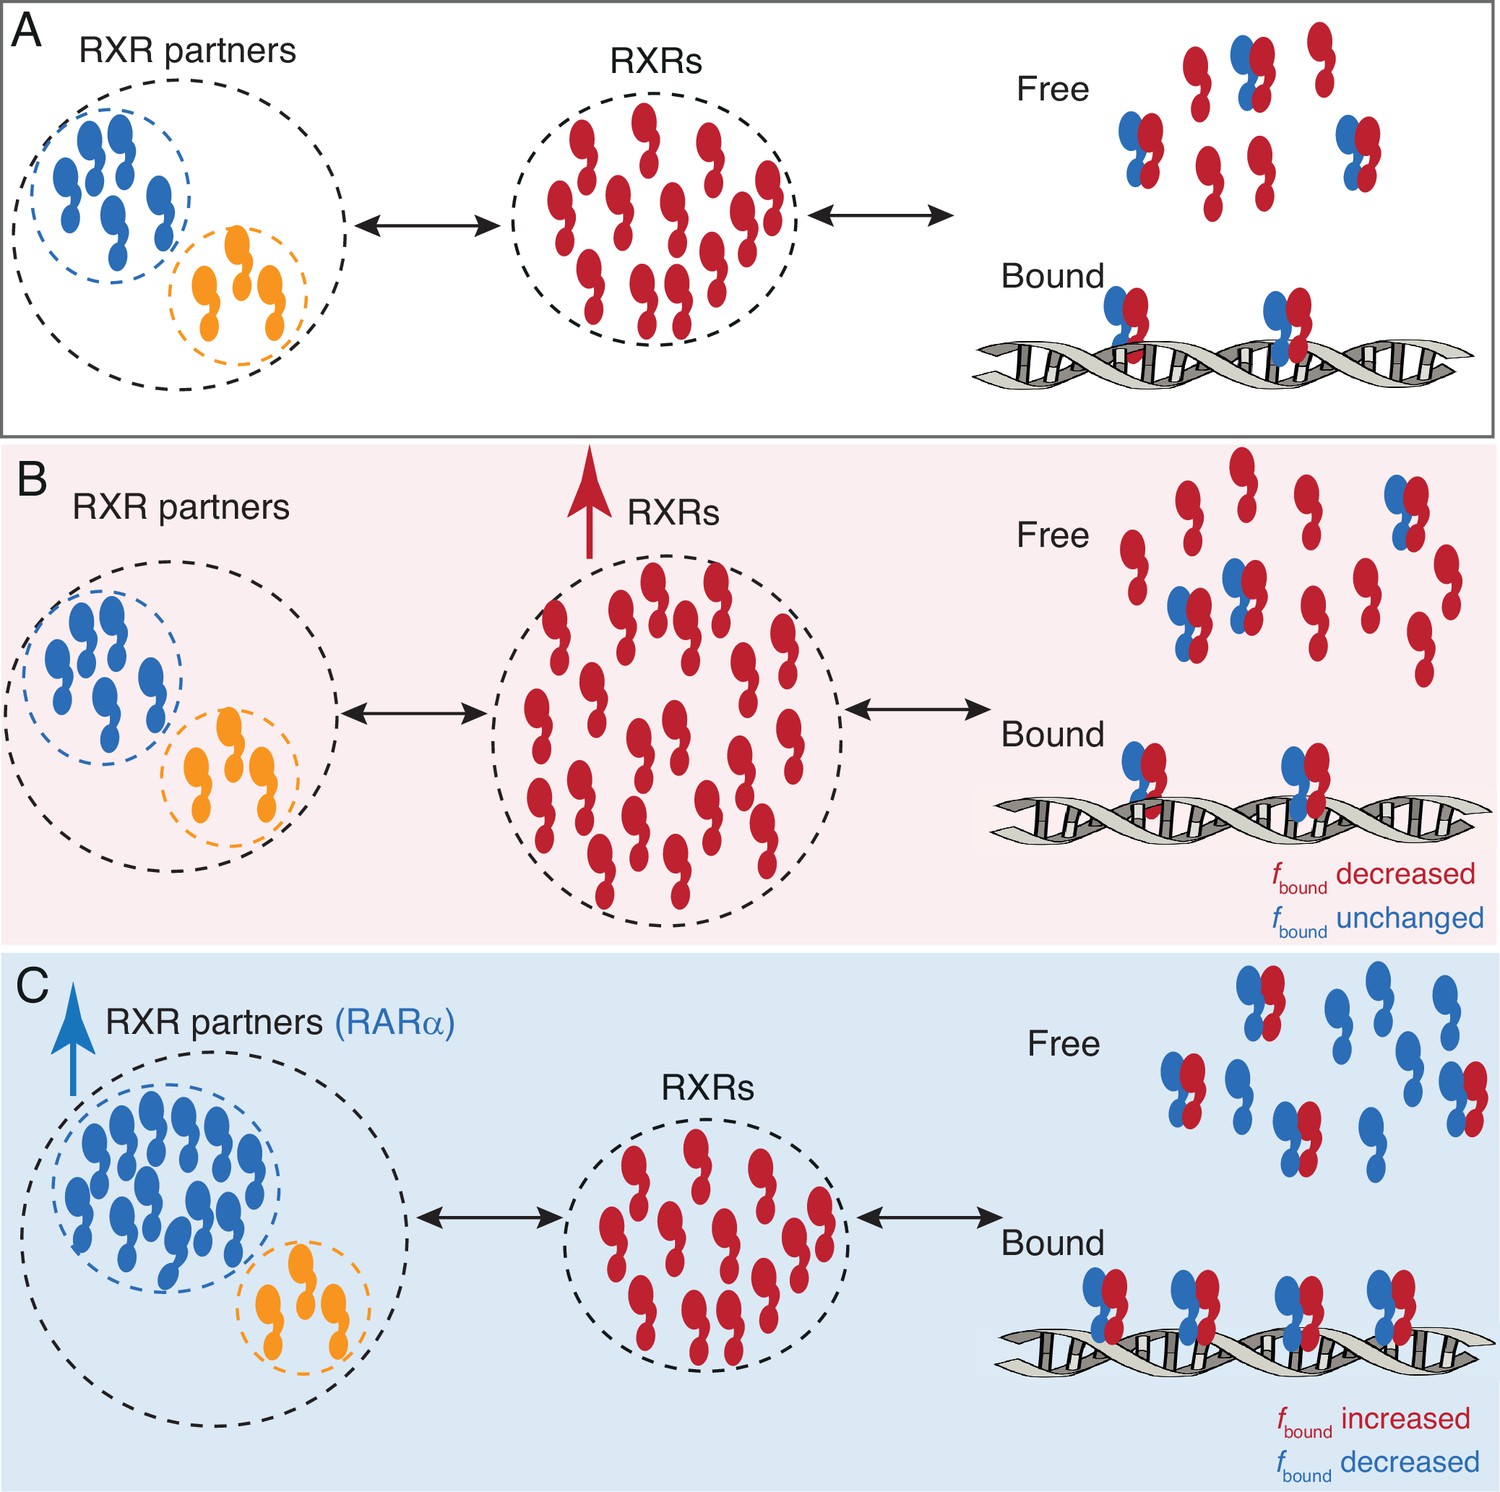
A model for RARa limited chromatin binding of RARa-RXRa heterodimers.
(A) Pool of RXRα (red) and RXR partners (RARα - blue, other Type II nuclear receptors [T2NRs] - yellow) along with some number of chromatin-bound RARα-RXRα heterodimers exist under normal conditions. (B) When the pool of free RXRα is increased, the number of chromatin-bound RARα-RXRα heterodimers does not change. (C) When the pool of RARα is increased, chromatin binding of RARα-RXRα heterodimers increases, until it reaches saturation. Note: For simplicity we have omitted to show heterodimerization of other T2NRs (yellow) with RXRα (red).
Tables
Appendix 2—table 1
T2NRs expressed in U2OS cells according to the Expression Atlas (Papatheodorou et al., 2020; Prakash et al., 2023) and the Human Protein Atlas Databank (Thul et al., 2017; Uhlén et al., 2015).
| Name | TPM (Expression Atlas) | TPM (Human Protein Atlas) |
|---|---|---|
| RARα (NR1B2) | 43 | 47.1 |
| RARβ (NR1B2) | 0.6 | 0.1 |
| RARγ (NR1B3) | 39 | 16.5 |
| RXRα (NR2B1) | 28 | 23.4 |
| RXRβ (NR2B2)* | 56 | 5.3 |
| RXRγ (NR2B3) | n/a | 0 |
| THRA (NR1A1) | 41 | 18.2 |
| THRB (NR1A2) | 2 | 3 |
| LXRA (NR1H3) | 9 | 6.4 |
| LXRB (NR1H2) | 50 | 44.8 |
| COUP-TF1 (NR2F2) | 3 | 2.4 |
| COUP-TF2 (NR2F2) | 34 | 39.7 |
| VDR (NR1I1) | 9 | 7.3 |
| FXR (NR1H4) | n/a | 0.2 |
| PPARA | 14 | 7.7 |
| PPARD | 35 | 17.2 |
| PPARG | 7 | 11.4 |
| NURR (NRA42) | 2 | 0.9 |
| PXR (NR1I2) | 0.6 | 0 |
| CAR (NR1I3) | 26 | 0.3 |
-
TPM = transcripts per kilobase million, TPM values reported by the European Bioinformatics Institute Expression Atlas (ebi.ac.uk) and Human Protein Data Bank (proteinatlas.org) for Type II nuclear receptors (T2NRs) expression in U2OS cells.
-
*
Note: We also observe expression of RXRβ in U2OS cells when probed with RXR antibody specific to the C-terminal epitope (Proteintech, #212181AP) in western blot (Figure 1—figure supplement 2B).
Appendix 2—table 2
Plasmid constructs used for co-immunoprecipitation and to make stable cell lines.
| Name | Promoter | Gene product | Short name in the paper | Appeared in |
|---|---|---|---|---|
| PB EF1α RARα-GDGAGLIN-Halo-3xFLAG IRES Puro | EF1α | RARα C-terminally fused with 3xFLAG-Halo tag through a short peptide linker sequence (GDGAGLIN) | RARα-Halo | Figure 2A–C, Figure 2—figure supplement 1A–C, Figure 1—figure supplement 4B, Figure 2—figure supplement 3A |
| PB EF1α V5-Halo-GDGAGLIN-RXRα IRES Puro | EF1α | RXRα N-terminally fused with V5-Halo tag through a short peptide linker sequence (GDGAGLIN) | Halo-RXRα | Figure 2A–C, Figure 1—figure supplement 1B, Figure 2—figure supplement 1A–C, Figure 2—figure supplement 3A, Figure 1—figure supplement 4B |
| PB EF1αRARα_M379R_T386R-GDGAGLIN-Halo-3xF IRES Puro | EF1α | RARRRα C-terminally fused with 3xFLAG-Halo tag through a short peptide linker sequence (GDGAGLIN) | RARαRR-Halo | Figure 2—figure supplement 2A |
| PB Puro EF1α-RARα-GDGAGLIN-3xFLAG | EF1a | RARα C-terminally fused with 3xFLAG tag through a short peptide linker sequence (GDGAGLIN) | RARα | Figure 1—figure supplement 1B |
| PB EF1a V5-RXRα IRES Puro | EF1α | RXRα N-terminally fused with V5 tag through a short peptide linker sequence (GDGAGLIN) | RXRα | Figure 1—figure supplement 1B, Figure 2—figure supplement 2A |
| PB EF1α ExMCS-GDGAGLIN-SNAPf-3xFLAG IRES Puro | EF1α | SNAPf-3xFLAG tag with a short peptide linker sequence (GDGAGLIN) | SNAP | Figure 2D–F, Figure 2—figure supplement 2B–D, Figure 2—figure supplement 3B and C, Figure 3—figure supplement 1A and B |
| PB EF1α RARα-GDGAGLIN-SNAPf-3xFLAG IRES Puro | EF1α | RARα C-terminally fused with 3xFLAG-SNAPf tag through a short peptide linker sequence (GDGAGLIN) | RARα-SNAP | Figure 2D–F, Figure 3B and C, Figure 2—figure supplement 2B–D, Figure 2—figure supplement 3B and C, Figure 2—figure supplement 5A, Figure 3—figure supplement 1A and B |
| PB EF1α RARRRα -GDGAGLIN-SNAPf-3xFLAG IRES Puro | EF1α | RARRRα C-terminally fused with 3xFLAG-SNAPf tag through a short peptide linker sequence (GDGAGLIN) | RARαRR-SNAP | Figure 2D–F, Figure 3B and C, Figure 2—figure supplement 2B–D, Figure 2—figure supplement 3B and C, Figure 2—figure supplement 5A, Figure 3—figure supplement 1A and B |
| PB EF1α V5-SNAPf-GDGAGLIN-RXRα IRES Neo | EF1α | RXRα N-terminally fused with V5-SNAPf tag through a short peptide linker sequence (GDGAGLIN) | SNAP-RXRα | Figure 2D–F, Figure 3B and C, Figure 2—figure supplement 2B–D, Figure 2—figure supplement 3B and C, Figure 3—figure supplement 1A and B |
| PB PGK Puro EF1α SNAPf- 3xNLS | EF1α | SNAPf - 3xNLS linked through a short linker peptide sequence (GDGAGLIN) | SNAP-NLS | Figure 3, Figure 3—figure supplement 1A and B |
Appendix 2—table 3
Summary of single-molecule tracking (SMT) analysis for all conditions.
-
*
Trajs refers to total number of trajectories of the whole set.
Appendix 2—table 4
Number of molecules estimated according to the previously published protocol (Cattoglio et al., 2019).
| Name | Est.# molecules | Appeared in |
|---|---|---|
| Negative control | 0 (fixed) | Figure 2—figure supplement 1A Figure 2—figure supplement 2B |
| CTCF | 109,800 (standard) | Figure 2—figure supplement 1A Figure 2—figure supplement 2B |
| I RARα.c156 | 57,024±7048 | Figure 2B (replicate 1) and Figure 2E Figure 2—figure supplement 1A |
| I RARα.c239 | 51,596±6144 | Figure 2B (replicate 2) |
| I RARα.c258 | 56,516±5260 | Figure 2B (replicate 3) |
| I RXRα.c10 | 53,548±4042 | Figure 2B (replicate 1) |
| I RXRα.D6 | 50,702±5616 | Figure 2B (replicate 2) and Figure 2E Figure 2—figure supplement 1A |
| I RXRα.D9 | 50,946±5645 | Figure 2B (replicate 3) |
| I RARα (average) | 55,045±2997 | Figure 2B |
| I RXRα (average) | 51,732±1577 | Figure 2B |
| I RARα.c156 w/o atRA | 52,586±2230 | Figure 1—figure supplement 3A |
| I RARα.c156 w/ 1 nM atRA | 39,609±3180 | Figure 1—figure supplement 3A |
| I RARα.c156 w/ 100 nM atRA | 33,593±4673 | Figure 1—figure supplement 3A |
| I RXRα.D6 w/o atRA | 47,130±3291 | Figure 1—figure supplement 3A |
| I RXRα.D6 w/ 1 nM atRA | 45,849±660 | Figure 1—figure supplement 3A |
| I RXRα.D6 w/ 100 nM atRA | 43,021±1946 | Figure 1—figure supplement 3A |
| OE RARα-Halo | 233,732±3738 | Figure 2B Figure 2—figure supplement 1A |
| OE Halo-RXRα | 905,005±1464 | Figure 2B Figure 2—figure supplement 1A |
| I RARα w/ SNAP | 65,617±1293 | Figure 2F Figure 2—figure supplement 2B |
| I RARα w/ RARαRR-SNAP | 52,532±835 | Figure 2F Figure 2—figure supplement 2B |
| I RARα w/ SNAP-RXRα | 62,392±1532 | Figure 2F Figure 2—figure supplement 2B |
| I RARα w/ RARα-SNAP | 37,255±371 | Figure 2F Figure 2—figure supplement 2B |
| I RXRα w/ SNAP | 50,898±1791 | Figure 2F Figure 2—figure supplement 2B |
| I RXRα w/ RARαRR-SNAP | 45,148±106 | Figure 2F Figure 2—figure supplement 2B |
| I RXRα w/ SNAP-RXRα | 42,248±528 | Figure 2F Figure 2—figure supplement 2B |
| I RXRα w/ RARα-SNAP | 58,880±1462 | Figure 2F Figure 2—figure supplement 2B |
-
Errors were calculated from three biological replicates.
Additional files
Download links
A two-part list of links to download the article, or parts of the article, in various formats.
Downloads (link to download the article as PDF)
Open citations (links to open the citations from this article in various online reference manager services)
Cite this article (links to download the citations from this article in formats compatible with various reference manager tools)
Surprising features of nuclear receptor interaction networks revealed by live-cell single-molecule imaging
eLife 12:RP92979.
https://doi.org/10.7554/eLife.92979.3


