Caenorhabditis elegans Dicer acts with the RIG-I-like helicase DRH-1 and RDE-4 to cleave dsRNA
- Department of Biochemistry, University of Utah, United States
Figures
Figure 1 with 3 supplements
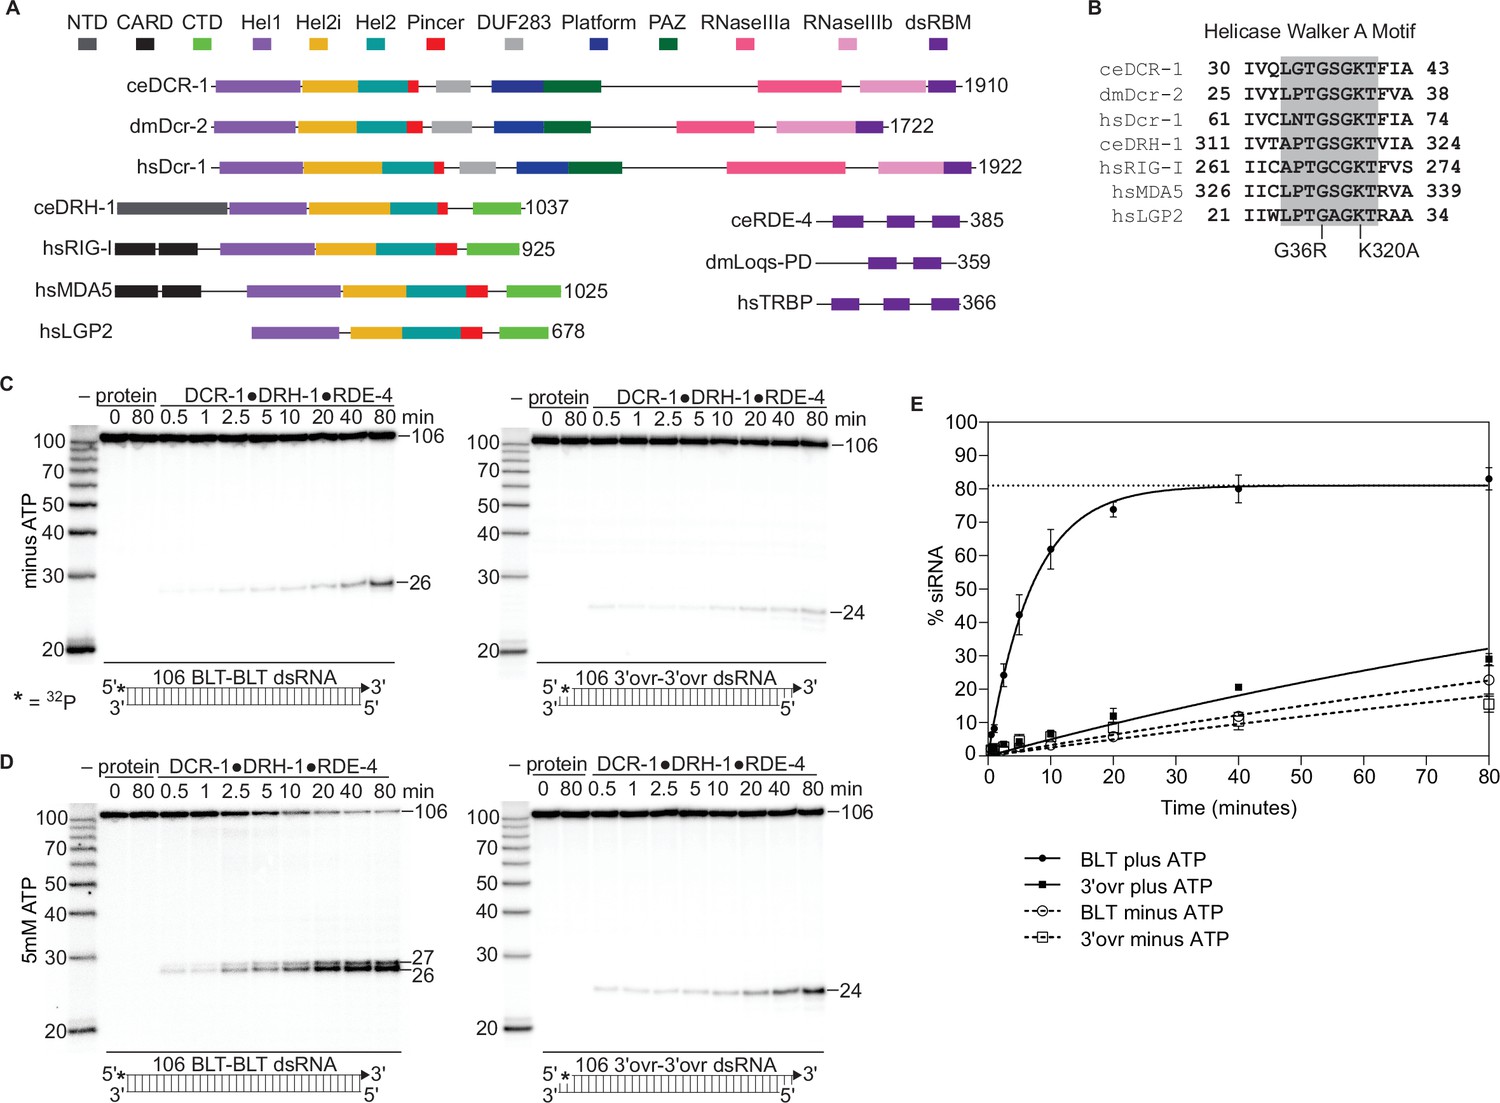
The C. elegans antiviral complex DCR-1•DRH-1•RDE-4 preferentially cleaves blunt dsRNA in an ATP-dependent manner.
(A) Colored rectangles depict conserved domains. NCBI conserved domains (Sayers et al., 2011), Clustal Omega Multiple Sequence Alignments (Goujon et al., 2010; McWilliam et al., 2013; Sievers et al., 2011), and previous reports were used in defining domain boundaries (Guo et al., 2013; Hansen et al., 2019; Sinha et al., 2018). Numbers to right of open-reading frame indicate total amino acids in protein. Organism is indicated: ce, C. elegans; dm, Drosophila melanogaster, hs, Homo sapiens. (B) Amino acids within Walker A motif (shaded) of the Hel1 subdomain with mutations indicated for DCR-1 (G36R) and DRH-1 (K320A). Number indicates the residues at the beginning and end. (C) Single-turnover cleavage assays of DCR-1•DRH-1•RDE-4 (25 nM) with 106 BLT or 3′ovr dsRNA (1 nM) at 20 °C in the absence of ATP. Sense (top) strand was 5′ 32P-end labeled (*) and contained a 2′,3′ cyclic phosphate (filled triangle in cartoon under gel) to minimize cleavage from that end (see Figure 1—figure supplement 2). Products were separated by 17% denaturing PAGE, and a representative PhosphorImage is shown (n≥3). Left, marker nucleotide lengths. See also Figure 1—figure supplements 1–3. (D) Same as C except with 5 mM ATP added to the reaction. (E) Quantification of single-turnover assays as in C and D with symbol key below. Data points are mean ± SD (n=3). Dotted line indicates amplitude constraint (see Materials and methods).
-
Figure 1—source data 1
Raw digital image of cleavage phosphorimager plate used in Figure 1C, left panel.
- https://cdn.elifesciences.org/articles/93979/elife-93979-fig1-data1-v1.zip
-
Figure 1—source data 2
Raw digital image of cleavage phosphorimager plate used in Figure 1C, right panel.
- https://cdn.elifesciences.org/articles/93979/elife-93979-fig1-data2-v1.zip
-
Figure 1—source data 3
Raw digital image of cleavage phosphorimager plate used in Figure 1D, left panel.
- https://cdn.elifesciences.org/articles/93979/elife-93979-fig1-data3-v1.zip
-
Figure 1—source data 4
Raw digital image of cleavage phosphorimager plate used in Figure 1D, right panel.
- https://cdn.elifesciences.org/articles/93979/elife-93979-fig1-data4-v1.zip
Figure 1—figure supplement 1
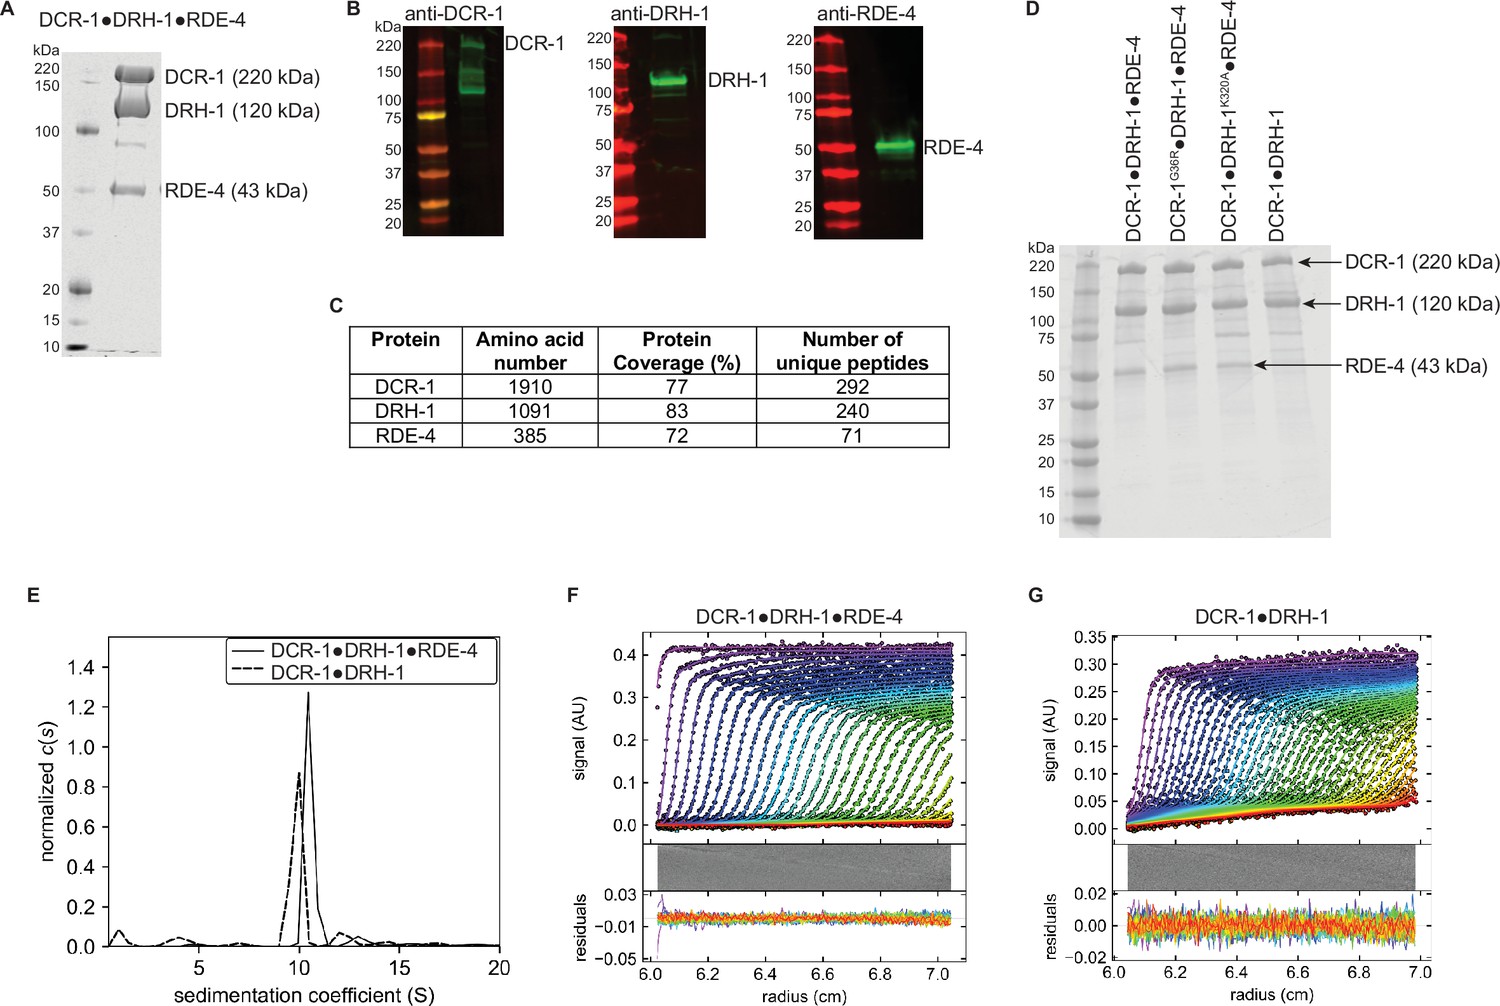
Analysis and validation of C. elegans antiviral complex after gel filtration.
(A) Coomassie-stained SDS-PAGE of DCR-1•DRH-1•RDE-4. Marker molecular weights (kDa) to left of gel and relevant protein names to right. (B) Western blot analyses validating the presence of DCR-1, DRH-1, and RDE-4. Some preparations of Dicer showed lower molecular weight fragments; comparisons to other analyses suggested the commercial antibody preparation detected non-DCR-1 bands, possibly because it was raised against an impure preparation. (C) Mass spectrometry analyses indicating the presence of DCR-1, DRH-1, and RDE-4. (D) Coomassie-stained SDS-PAGE of indicated protein complex. Marker molecular weights (kDa) indicated left of gel and relevant proteins to right. (E - G) SV-AUC sedimentation coefficient (c(s)) analyses of DCR-1•DRH-1•RDE-4 and DCR-1•DRH-1. For E, DCR-1•DRH-1•RDE-4 and DCR-1•DRH-1 complexes were centrifuged at 40,000 RPM, 20 °C, and sedimentation was monitored at 280 nm. C(s) normalized by area showed a s(20,w)=10.7, f/f0=1.75, and MW = 386,284 for DCR-1•DRH-1•RDE-4, and s(20,w)=10.1, f/f0=1.70, and MW = 336,479 for DCR-1•DRH-1, consistent with 1:1:1 and 1:1 complexes, respectively. DCR-1•DRH-1•RDE-4 (F) and DCR-1•DRH-1 (G) absorbance scans and respective fits and residuals, with every second scan and data point shown for clarity (whereas all data were used to obtain fits).
-
Figure 1—figure supplement 1—source data 1
Raw digital image of SDS-PAGE gel used in Figure 1—figure supplement 1A.
- https://cdn.elifesciences.org/articles/93979/elife-93979-fig1-figsupp1-data1-v1.zip
-
Figure 1—figure supplement 1—source data 2
Raw digital image of western blot used in Figure 1—figure supplement 1B, left panel.
- https://cdn.elifesciences.org/articles/93979/elife-93979-fig1-figsupp1-data2-v1.zip
-
Figure 1—figure supplement 1—source data 3
Raw digital image of western blot used in Figure 1—figure supplement 1B, middle panel.
- https://cdn.elifesciences.org/articles/93979/elife-93979-fig1-figsupp1-data3-v1.zip
-
Figure 1—figure supplement 1—source data 4
Raw digital image of western blot used in Figure 1—figure supplement 1B, right panel.
- https://cdn.elifesciences.org/articles/93979/elife-93979-fig1-figsupp1-data4-v1.zip
-
Figure 1—figure supplement 1—source data 5
Raw digital image of SDS-Page gel used in Figure 1—figure supplement 1D.
- https://cdn.elifesciences.org/articles/93979/elife-93979-fig1-figsupp1-data5-v1.zip
Figure 1—figure supplement 2
2′,3′ Cyclic phosphates block ATP-independent cleavage and reveal an ATP-dependent side reaction characterized by heterogeneous products.
(A) Single-turnover cleavage assays of 106 BLT dsRNA (1 nM) with indicated protein complex (50 nM) ±5 mM ATP for 60 min at 20 °C. Sense (top) strand was 5′ 32P-end labeled (*) and both strands contained 2′,3′ cyclic phosphates (filled triangle in cartoon under gel). Products were separated by 17% denaturing PAGE, and a representative PhosphorImage is shown (n=3). Left, marker nucleotide lengths. For dmDcr2, a 2′,3′ cyclic phosphate at a terminus blocks cleavage from that end. For the antiviral complex, this modification eliminated ATP-independent cleavage (see -ATP lanes), but revealed an ATP-dependent side reaction characterized by a heterogeneous cleavage pattern (see +ATP lanes). Such heterogeneous products required higher concentrations of the antiviral complex, and by optimizing conditions we were able to minimize reaction from the 2′,3′ cyclic phosphate allowing us to focus on the first cleavage event from the radiolabeled terminus (e.g. see Figure 1C and D). (B) Same as A except with 106 3′ovr dsRNA (1 nM).
-
Figure 1—figure supplement 2—source data 1
Raw digital image of cleavage phosphorimager plate used in Figure 1—figure supplement 2A.
- https://cdn.elifesciences.org/articles/93979/elife-93979-fig1-figsupp2-data1-v1.zip
-
Figure 1—figure supplement 2—source data 2
Raw digital image of cleavage phosphorimager plate used in Figure 1—figure supplement 2B.
- https://cdn.elifesciences.org/articles/93979/elife-93979-fig1-figsupp2-data2-v1.zip
Figure 1—figure supplement 3
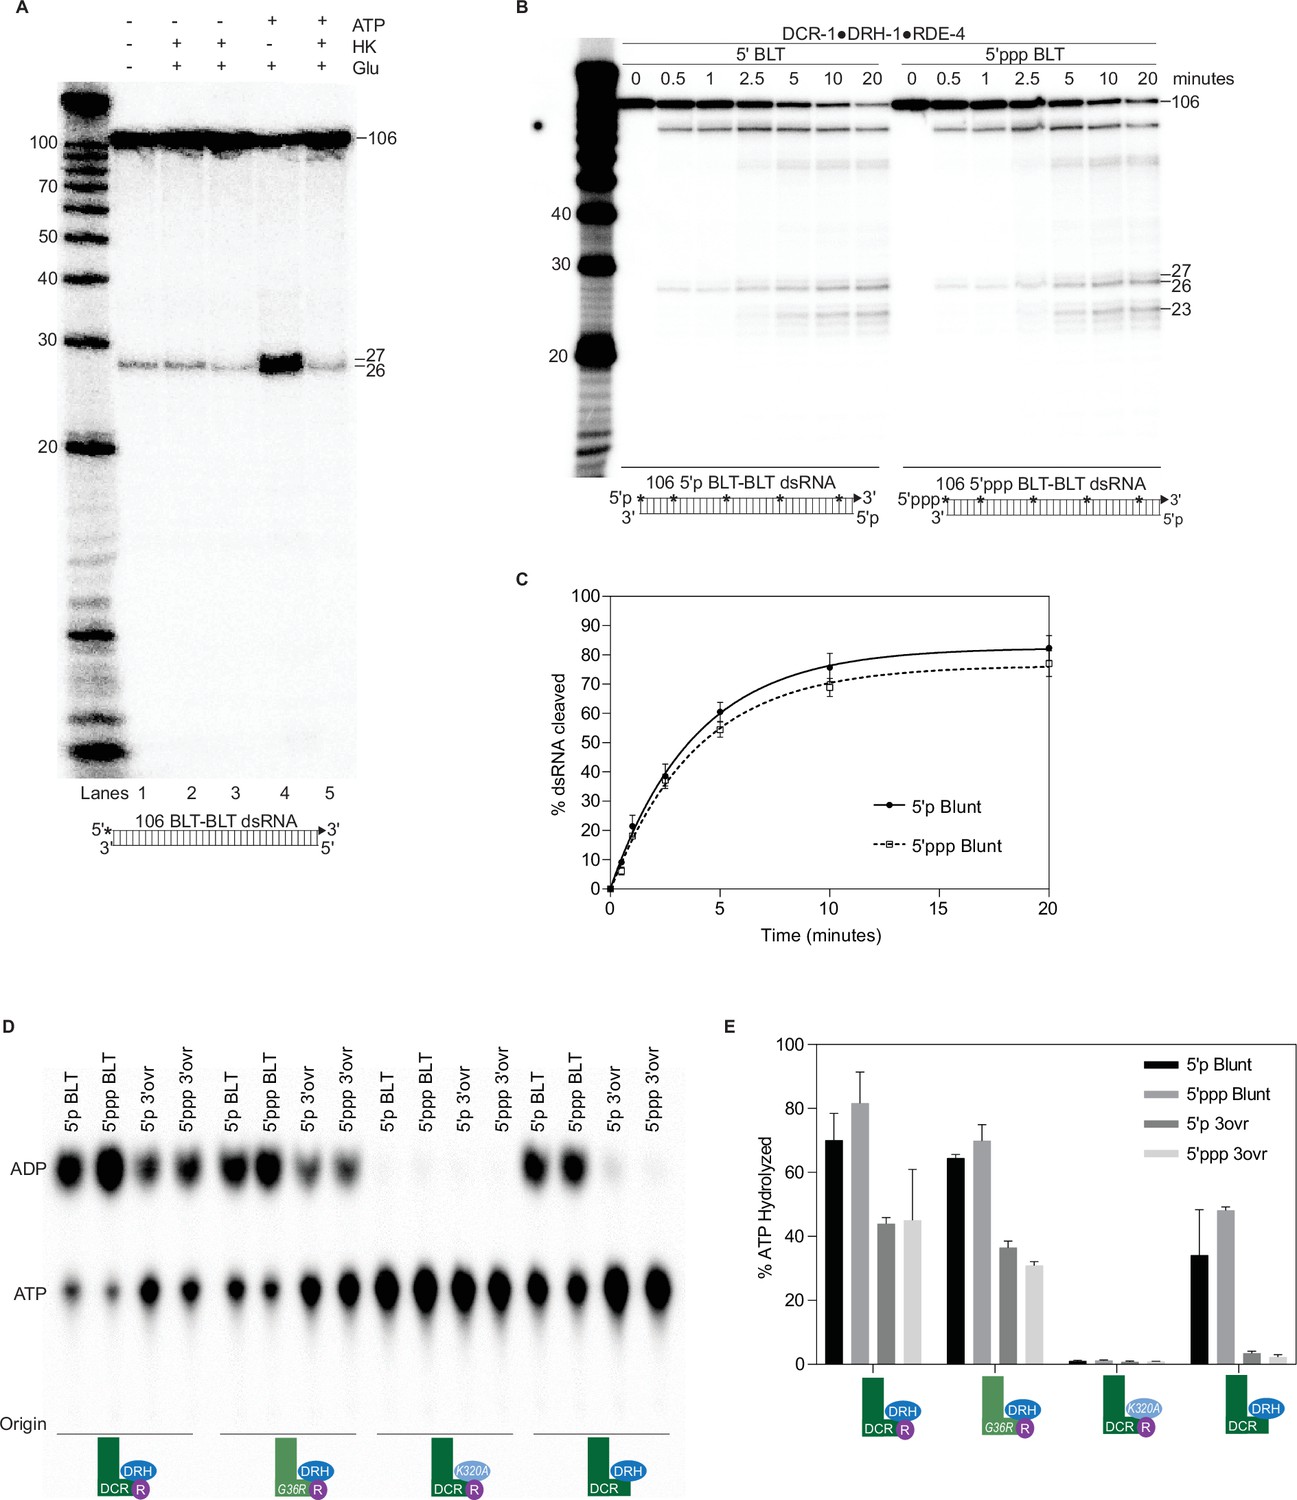
DCR-1•DRH-1•RDE-4 cleaves blunt dsRNA in an ATP-independent manner.
Triphosphates do not affect cleavage or ATP hydrolysis by DCR-1•DRH-1•RDE-4. (A) Single-turnover cleavage assays of DCR-1•DRH-1•RDE-4 (50 nM) with 106 BLT dsRNA (1 nM) and ±5 mM ATP, 10 mM glucose (Glu), or hexokinase (HK) as indicated for 60 min at 20 °C. Lane 2 contained 1 unit of HK and lanes 3 and 5 contained 2 units of HK. Sense (top) strand was 5′ 32P-end labeled (*) and contained a 2′,3′ cyclic phosphate (filled triangle in cartoon under gel). Products were separated by 17% denaturing PAGE, and a representative PhosphorImage is shown (n=3). Left, marker nucleotide lengths. (B) Single-turnover cleavage assays of DCR-1•DRH-1•RDE-4 (25 nM) with 5′p or 5′ppp 106 BLT dsRNA (1 nM) at 20 °C for times indicated. Sense strand was internally-labeled by including 32P-ATP during in vitro transcription (*), allowing all cleavage intermediates to be observed. Products were separated by 17% denaturing PAGE, and a representative PhosphorImage is shown. Left, marker nucleotide lengths. (C) Quantification of single-turnover assays as in B. Data points are mean ± SD (n=3). (D) 50 nM of indicated protein complex was incubated with 200 nM of 5′p 106 BLT, 5′ppp 106 BLT, 5′p 106 3′ovr, or 5′ppp 106 3′ovr dsRNA with 100 μM α-32P-ATP at 20 °C for 15 min. ATP hydrolysis monitored by TLC, and a representative PhosphorImage is shown. Positions of origin, ATP, and ADP are indicated. (E) Quantification of ATP hydrolysis assays as in D. Data points are mean ± SD (n=2).
-
Figure 1—figure supplement 3—source data 1
Raw digital image of cleavage phosphorimager plate used in Figure 1—figure supplement 3A.
- https://cdn.elifesciences.org/articles/93979/elife-93979-fig1-figsupp3-data1-v1.zip
-
Figure 1—figure supplement 3—source data 2
Raw digital image of cleavage phosphorimager plate used in Figure 1—figure supplement 3B.
- https://cdn.elifesciences.org/articles/93979/elife-93979-fig1-figsupp3-data2-v1.zip
-
Figure 1—figure supplement 3—source data 3
Raw digital image of cleavage phosphorimager plate used in Figure 1—figure supplement 3D.
- https://cdn.elifesciences.org/articles/93979/elife-93979-fig1-figsupp3-data3-v1.zip
Figure 2 with 1 supplement

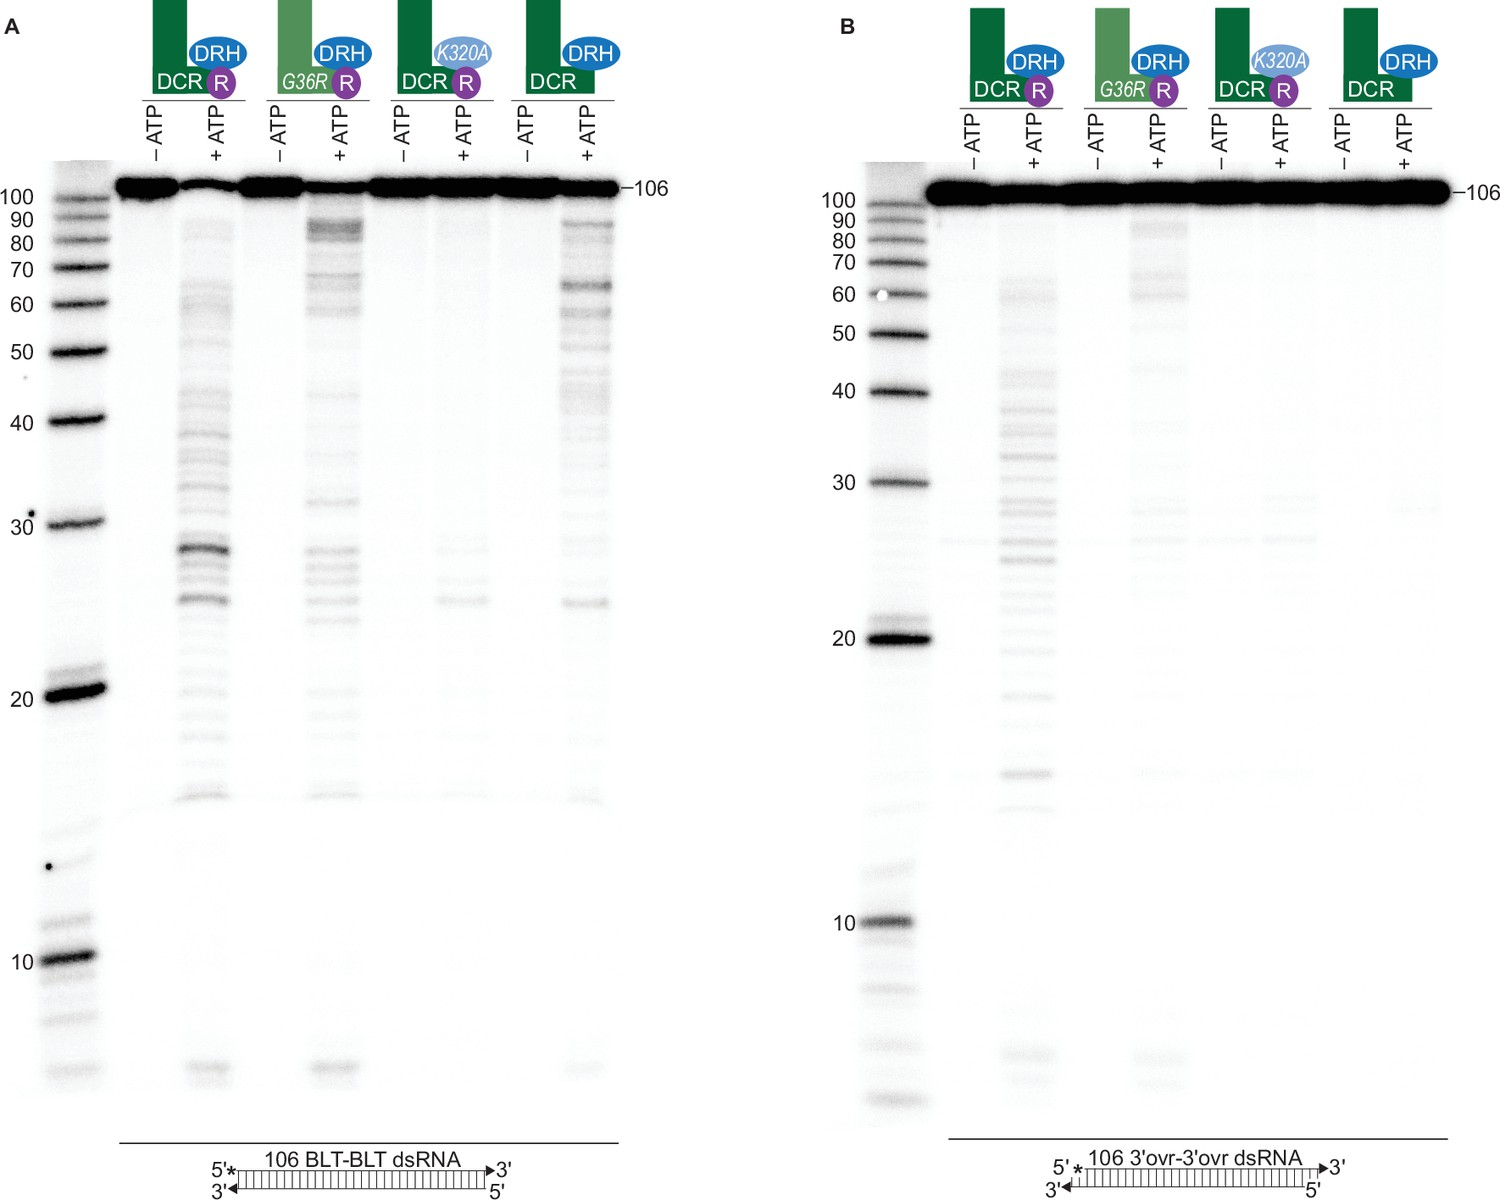
ATP-dependent cleavage reactions are mediated by DCR-1 and DRH-1 helicase domains, whereas RDE-4 is needed for ATP-independent and ATP-dependent cleavage reactions.
(A) Cartoons indicate complexes and variants, with mutations in DCR-1 (green) and DRH-1 (blue) indicated with the amino acid change, and the presence of RDE-4 (R) represented with a purple circle. Single-turnover cleavage assays of 106 BLT dsRNA (1 nM) with indicated protein complex (25 nM) ±5 mM ATP or ATPγS, incubated at 20 °C for 60 min. Sense strand was 5′ 32P-end labeled (*) and contained a 2′,3′ cyclic phosphate (filled triangle in cartoon under gel) to minimize cleavage from the opposite end (see Figure 1—figure supplement 2). Products were separated by 17% denaturing PAGE, and a representative PhosphorImage is shown (n=3). Left, marker nucleotide lengths. (B) Same as A except with 106 3′ovr dsRNA (1 nM). (C) Quantification of single-turnover assays over time, using wildtype or variant antiviral complexes as indicated (25 nM), with 106 BLT dsRNA (1 nM) or 106 3′ovr dsRNA (1 nM) plus 5 mM ATP. Data points are mean ± SD (n=3). See Figure 2—figure supplement 1A-C for representative primary data. Plateau constrained to 81.02 (dotted line). See Materials and methods. (D) DCR-1•DRH-1•RDE-4 (25 nM) was incubated with 106 BLT or 3′ovr dsRNA (400 nM) with 100 μM α-32P-ATP at 20 °C. ATP hydrolysis monitored by thin-layer chromatography (TLC), and a representative PhosphorImage is shown (n≥3). Positions of origin, ATP, and ADP are indicated. See also Figure 2—figure supplement 1D and E. (E–G) Same as D except with complexes indicated. (H) Quantification of ATP hydrolysis assays as in D – G. Data points are mean ± SD (n=3) with symbol key below graph. Plateau constrained to 89.55 (dotted line). See Materials and methods.
-
Figure 2—source data 1
Raw digital image of cleavage phosphorimager plate used in Figure 2A.
- https://cdn.elifesciences.org/articles/93979/elife-93979-fig2-data1-v1.zip
-
Figure 2—source data 2
Raw digital image of cleavage phosphorimager plate used in Figure 2B.
- https://cdn.elifesciences.org/articles/93979/elife-93979-fig2-data2-v1.zip
-
Figure 2—source data 3
Raw digital image of thin-layer chromatography plate used in Figure 2D, left panel.
- https://cdn.elifesciences.org/articles/93979/elife-93979-fig2-data3-v1.zip
-
Figure 2—source data 4
Raw digital image of thin-layer chromatography plate used in Figure 2D, right panel.
- https://cdn.elifesciences.org/articles/93979/elife-93979-fig2-data4-v1.zip
-
Figure 2—source data 5
Raw digital image of thin-layer chromatography plate used in Figure 2E.
- https://cdn.elifesciences.org/articles/93979/elife-93979-fig2-data5-v1.zip
-
Figure 2—source data 6
Raw digital image of thin-layer chromatography plate used in Figure 2F.
- https://cdn.elifesciences.org/articles/93979/elife-93979-fig2-data6-v1.zip
-
Figure 2—source data 7
Raw digital image of thin-layer chromatography plate used in Figure 2G.
- https://cdn.elifesciences.org/articles/93979/elife-93979-fig2-data7-v1.zip
Figure 2—figure supplement 1
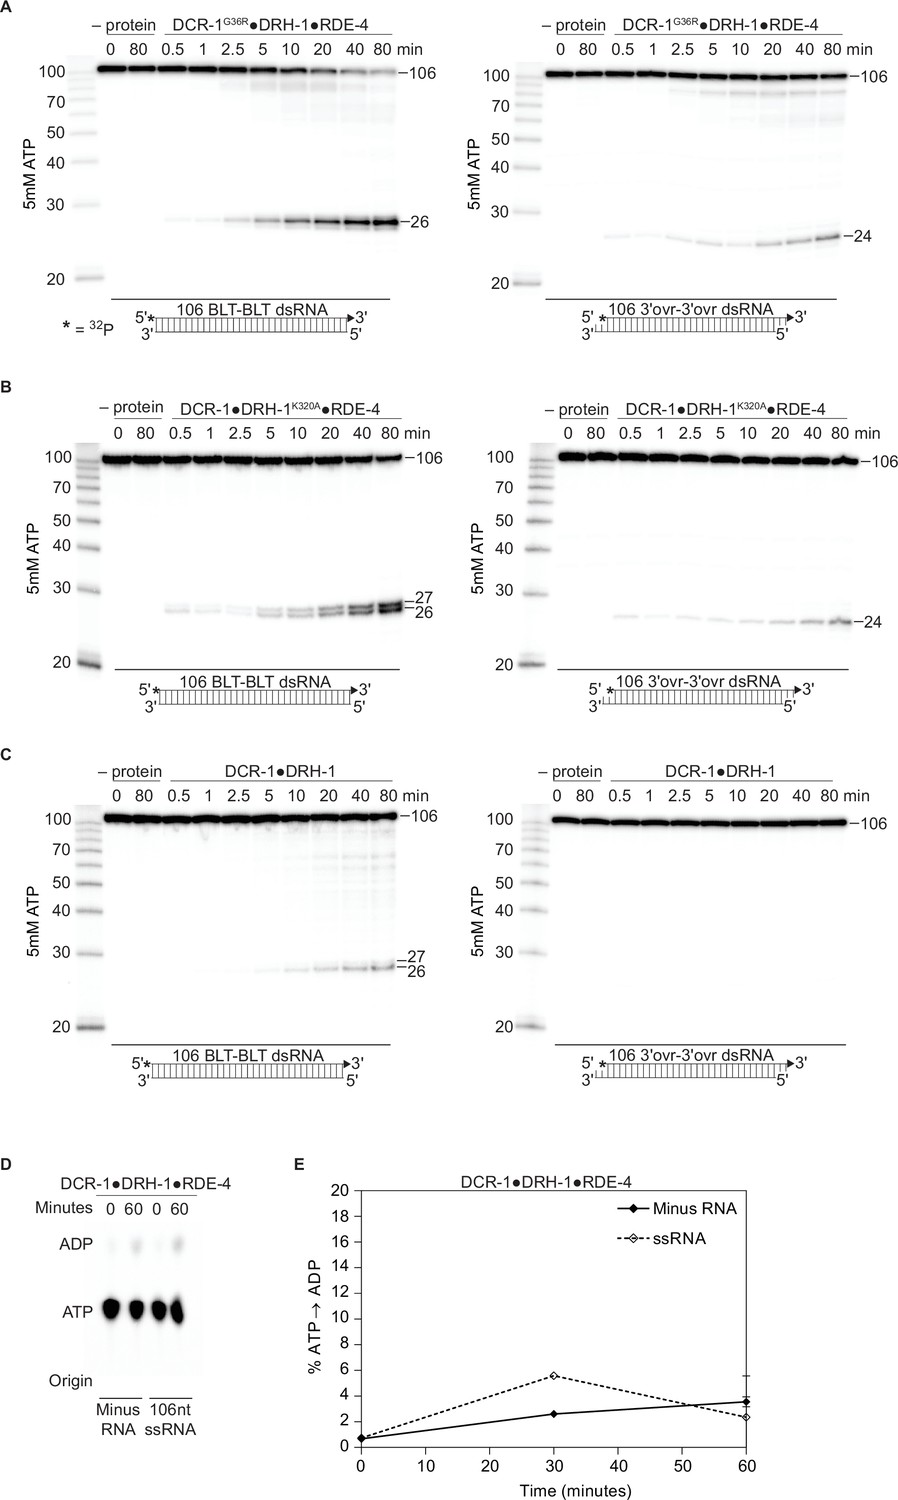
DCR-1, DRH-1, and RDE-4 affect ATP-dependent cleavage rates.
There is a negligible amount of ATP hydrolysis in the absence of dsRNA or presence of ssRNA. (A – C) PhosphorImages show representative primary data (n=3) used for graph shown in Figure 2C. Single-turnover cleavage assays of 25 nM DCR-1G36R•DRH-1•RDE-4 (A), DCR-1•DRH-1K320A•RDE-4 (B) or DCR-1•DRH-1 (C), with 106 BLT or 3′ovr dsRNA (1 nM) and 5 mM ATP at 20 °C. Sense strand was 5′ 32P-end labeled (*). Products were separated by 17% denaturing PAGE. Left, marker nucleotide lengths. (D) DCR-1•DRH-1•RDE-4 (100 nM) was incubated without RNA or with 600 nM ssRNA and with 100 μM α-32P-ATP at 20 °C. ATP hydrolysis monitored by TLC, and a representative PhosphorImage is shown. Positions of origin, ATP, and ADP are indicated. (E) Quantification of ATP hydrolysis assays as in D. Data points are mean ± SD (n=3).
-
Figure 2—figure supplement 1—source data 1
Raw digital image of cleavage phosphorimager plate used in Figure 2—figure supplement 1A, left panel.
- https://cdn.elifesciences.org/articles/93979/elife-93979-fig2-figsupp1-data1-v1.zip
-
Figure 2—figure supplement 1—source data 2
Raw digital image of cleavage phosphorimager plate used in Figure 2—figure supplement 1A, right panel.
- https://cdn.elifesciences.org/articles/93979/elife-93979-fig2-figsupp1-data2-v1.zip
-
Figure 2—figure supplement 1—source data 3
Raw digital image of cleavage phosphorimager plate used in Figure 2—figure supplement 1B, left panel.
- https://cdn.elifesciences.org/articles/93979/elife-93979-fig2-figsupp1-data3-v1.zip
-
Figure 2—figure supplement 1—source data 4
Raw digital image of cleavage phosphorimager plate used in Figure 2—figure supplement 1B, right panel.
- https://cdn.elifesciences.org/articles/93979/elife-93979-fig2-figsupp1-data4-v1.zip
-
Figure 2—figure supplement 1—source data 5
Raw digital image of cleavage phosphorimager plate used in Figure 2—figure supplement 1C, left panel.
- https://cdn.elifesciences.org/articles/93979/elife-93979-fig2-figsupp1-data5-v1.zip
-
Figure 2—figure supplement 1—source data 6
Raw digital image of cleavage phosphorimager plate used in Figure 2—figure supplement 1C, right panel.
- https://cdn.elifesciences.org/articles/93979/elife-93979-fig2-figsupp1-data6-v1.zip
-
Figure 2—figure supplement 1—source data 7
Raw digital image of thin-layer chromatography plate used in Figure 2—figure supplement 1D.
- https://cdn.elifesciences.org/articles/93979/elife-93979-fig2-figsupp1-data7-v1.zip
Figure 3 with 2 supplements
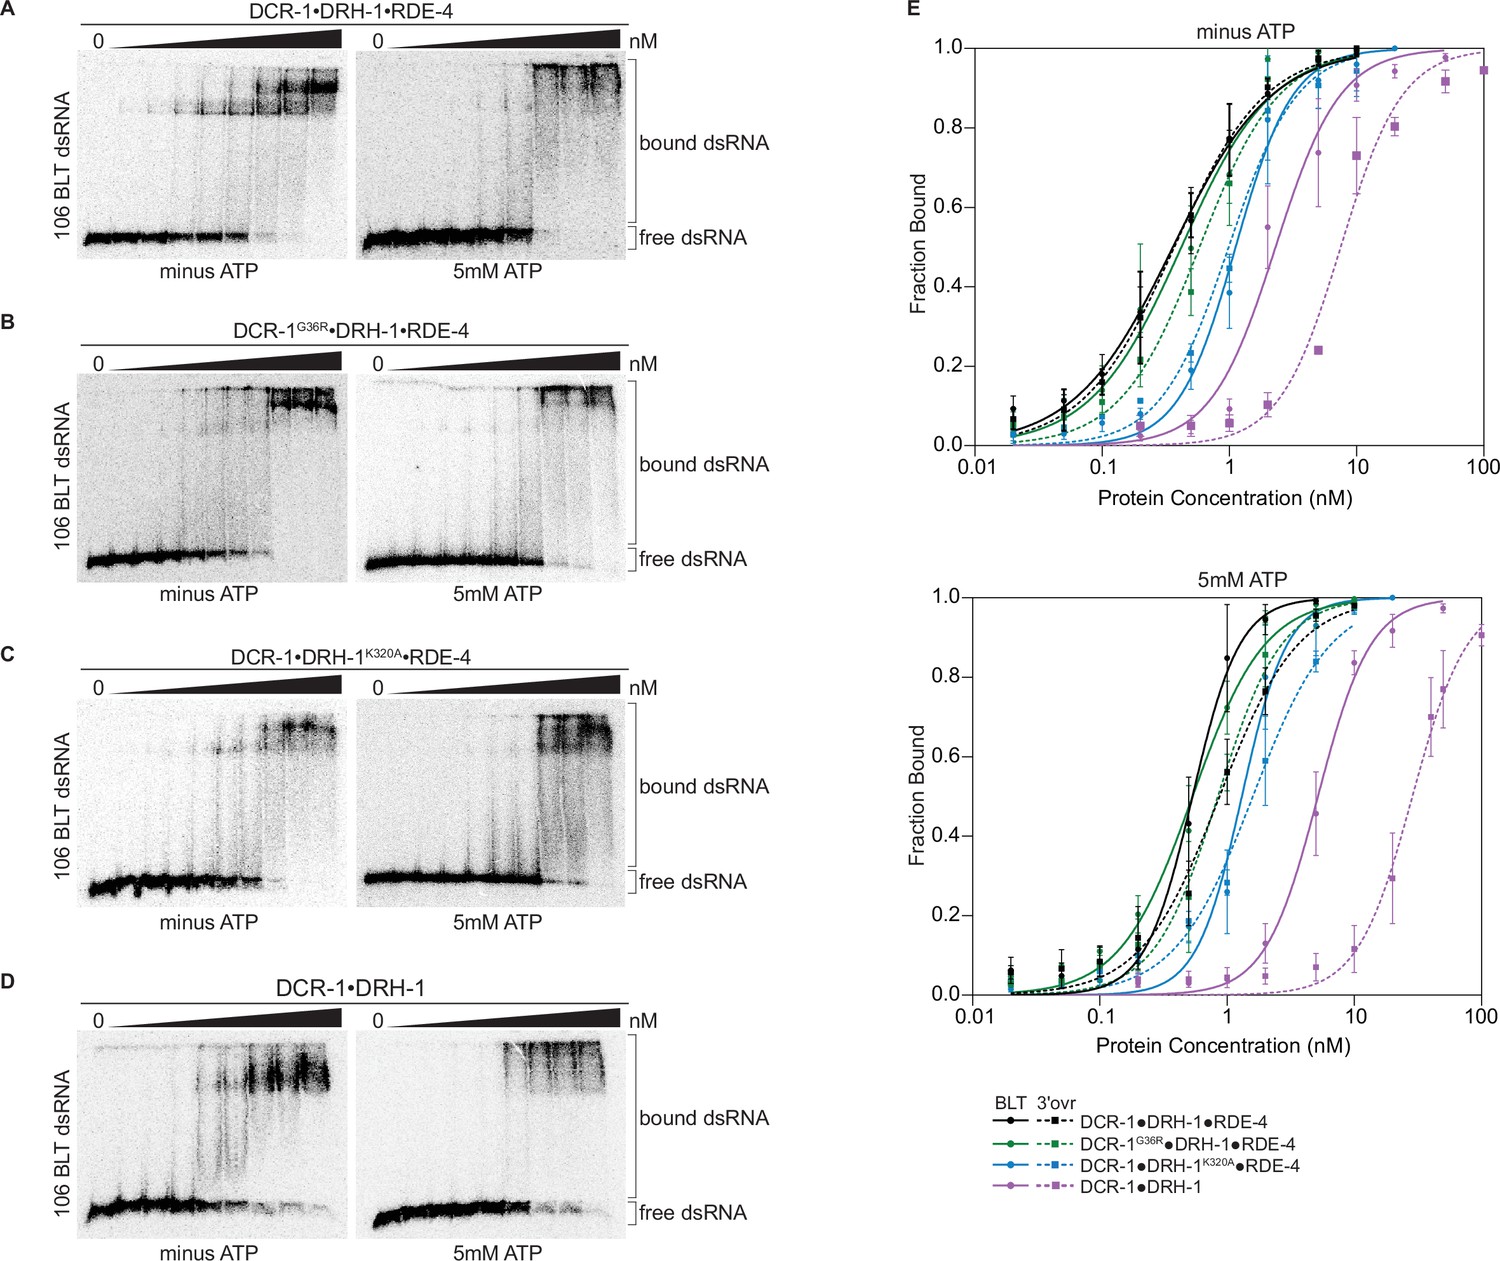
Binding affinity of DCR-1•DRH-1•RDE-4 wildtype and mutant complexes for 106 BLT dsRNA in the absence or presence of ATP.
(A) Representative PhosphorImages showing gel mobility shift assays with increasing concentrations ranging from 0 to 5 nM of DCR-1•DRH-1•RDE-4 with 106 BLT dsRNA ±5 mM ATP as indicated. Sense strand was 5′ 32P-end labeled (*) and contained a 2′,3′ cyclic phosphate. As labeled on right, all dsRNA that migrated through the gel more slowly than dsRNAfree was considered bound. (B–D) Same as A except with indicated complexes. Protein concentrations increased from left to right as indicated and range from 0 to 10 nM (B and C), and 0–50 nM (D). (E) Radioactivity in PhosphorImages as in A – D was quantified to generate binding isotherms for wildtype and mutant complexes ±5 mM ATP (see key). Fraction bound was determined using radioactivity for dsRNAfree and dsRNAbound. Data was fit to calculate dissociation constant, Kd, using the Hill formalism, where fraction bound = 1/(1 + (Kdn/[P]n)). Data points, mean ± SD (n≥3). See also Figure 3—figure supplement 1.
-
Figure 3—source data 1
Raw digital image of gel shift phosphorimager plate used in Figure 3A, left panel.
- https://cdn.elifesciences.org/articles/93979/elife-93979-fig3-data1-v1.zip
-
Figure 3—source data 2
Raw digital image of gel shift phosphorimager plate used in Figure 3A, right panel.
- https://cdn.elifesciences.org/articles/93979/elife-93979-fig3-data2-v1.zip
-
Figure 3—source data 3
Raw digital image of gel shift phosphorimager plate used in Figure 3B, left panel.
- https://cdn.elifesciences.org/articles/93979/elife-93979-fig3-data3-v1.zip
-
Figure 3—source data 4
Raw digital image of gel shift phosphorimager plate used in Figure 3B, right panel.
- https://cdn.elifesciences.org/articles/93979/elife-93979-fig3-data4-v1.zip
-
Figure 3—source data 5
Raw digital image of gel shift phosphorimager plate used in Figure 3C, left panel.
- https://cdn.elifesciences.org/articles/93979/elife-93979-fig3-data5-v1.zip
-
Figure 3—source data 6
Raw digital image of gel shift phosphorimager plate used in Figure 3C, right panel.
- https://cdn.elifesciences.org/articles/93979/elife-93979-fig3-data6-v1.zip
-
Figure 3—source data 7
Raw digital image of gel shift phosphorimager plate used in Figure 3D, left panel.
- https://cdn.elifesciences.org/articles/93979/elife-93979-fig3-data7-v1.zip
-
Figure 3—source data 8
Raw digital image of gel shift phosphorimager plate used in Figure 3D, right panel.
- https://cdn.elifesciences.org/articles/93979/elife-93979-fig3-data8-v1.zip
Figure 3—figure supplement 1
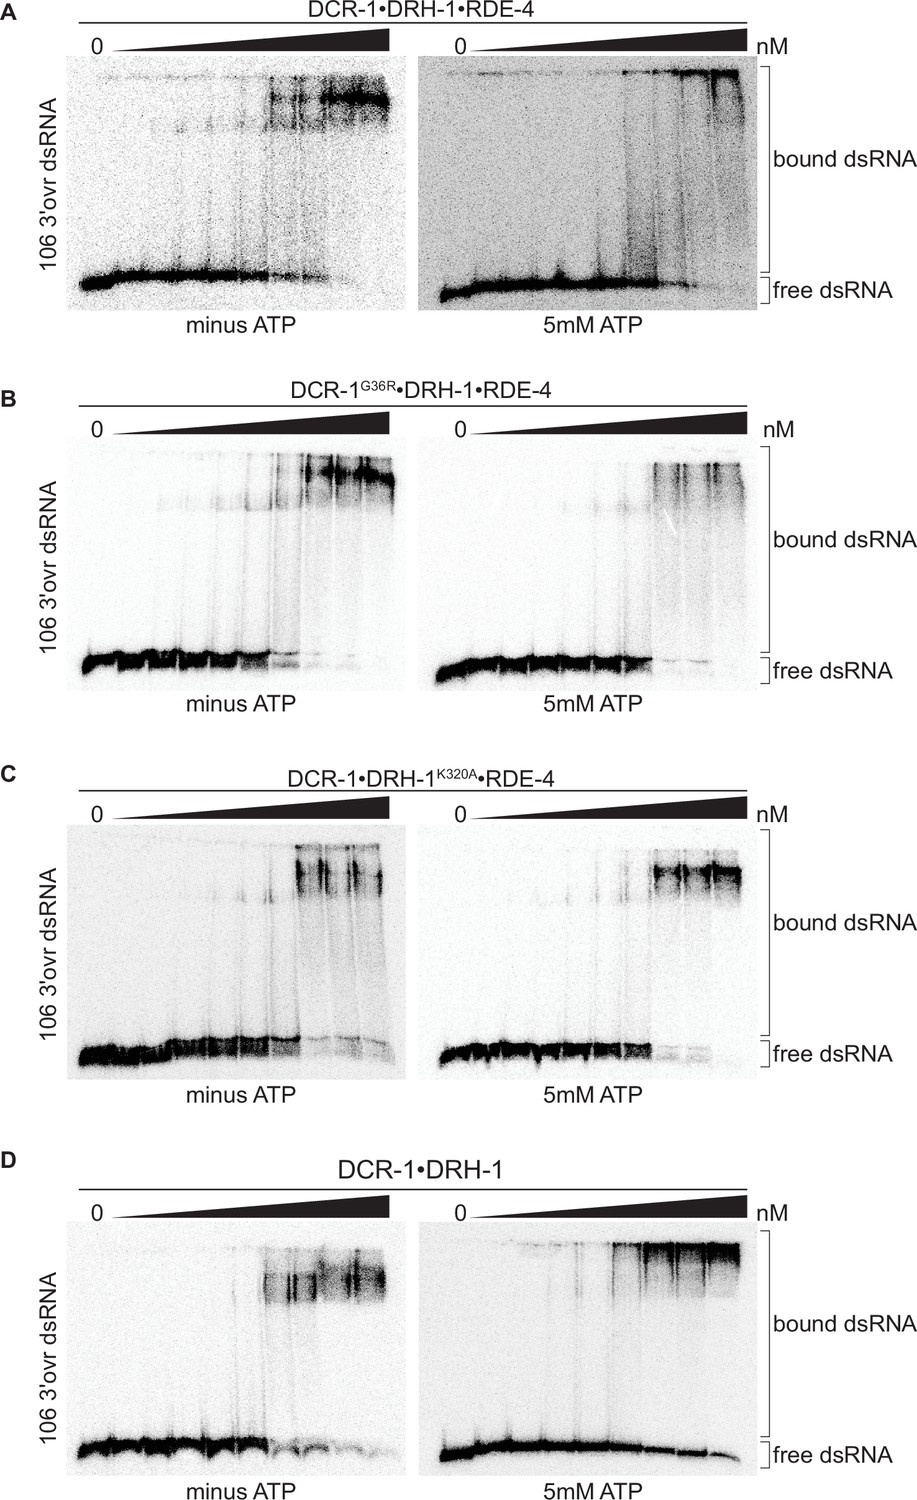
Binding affinity of DCR-1•DRH-1•RDE-4 wildtype and mutant complexes for 106 3′ovr dsRNA in the absence or presence of ATP.
(A) Representative PhosphorImages showing gel mobility shift assays of increasing concentrations of DCR-1•DRH-1•RDE-4 ranging from 0 to 10 nM with 106 3′ovr dsRNA ±5 mM ATP as indicated. Sense strand was 5′ 32P-end labeled (*) and contained a 2′,3′ cyclic phosphate as illustrated in Figure 1C. As labeled on right, all dsRNA that migrated through the gel more slowly than dsRNAfree was considered bound. (B–D) Same as A except with indicated complexes. Protein concentrations increased from left to right as indicated and range from 0 to 10 nM (B and C), and 0–100 nM (D).
-
Figure 3—figure supplement 1—source data 1
Raw digital image of gel shift phosphorimager plate used in Figure 3—figure supplement 1A, left panel.
- https://cdn.elifesciences.org/articles/93979/elife-93979-fig3-figsupp1-data1-v1.zip
-
Figure 3—figure supplement 1—source data 2
Raw digital image of gel shift phosphorimager plate used in Figure 3—figure supplement 1A, right panel.
- https://cdn.elifesciences.org/articles/93979/elife-93979-fig3-figsupp1-data2-v1.zip
-
Figure 3—figure supplement 1—source data 3
Raw digital image of gel shift phosphorimager plate used in Figure 3—figure supplement 1B, left panel.
- https://cdn.elifesciences.org/articles/93979/elife-93979-fig3-figsupp1-data3-v1.zip
-
Figure 3—figure supplement 1—source data 4
Raw digital image of gel shift phosphorimager plate used in Figure 3—figure supplement 1B, right panel.
- https://cdn.elifesciences.org/articles/93979/elife-93979-fig3-figsupp1-data4-v1.zip
-
Figure 3—figure supplement 1—source data 5
Raw digital image of gel shift phosphorimager plate used in Figure 3—figure supplement 1C, left panel.
- https://cdn.elifesciences.org/articles/93979/elife-93979-fig3-figsupp1-data5-v1.zip
-
Figure 3—figure supplement 1—source data 6
Raw digital image of gel shift phosphorimager plate used in Figure 3—figure supplement 1C, right panel.
- https://cdn.elifesciences.org/articles/93979/elife-93979-fig3-figsupp1-data6-v1.zip
-
Figure 3—figure supplement 1—source data 7
Raw digital image of gel shift phosphorimager plate used in Figure 3—figure supplement 1D, left panel.
- https://cdn.elifesciences.org/articles/93979/elife-93979-fig3-figsupp1-data7-v1.zip
-
Figure 3—figure supplement 1—source data 8
Raw digital image of gel shift phosphorimager plate used in Figure 3—figure supplement 1D, right panel.
- https://cdn.elifesciences.org/articles/93979/elife-93979-fig3-figsupp1-data8-v1.zip
Figure 3—figure supplement 2
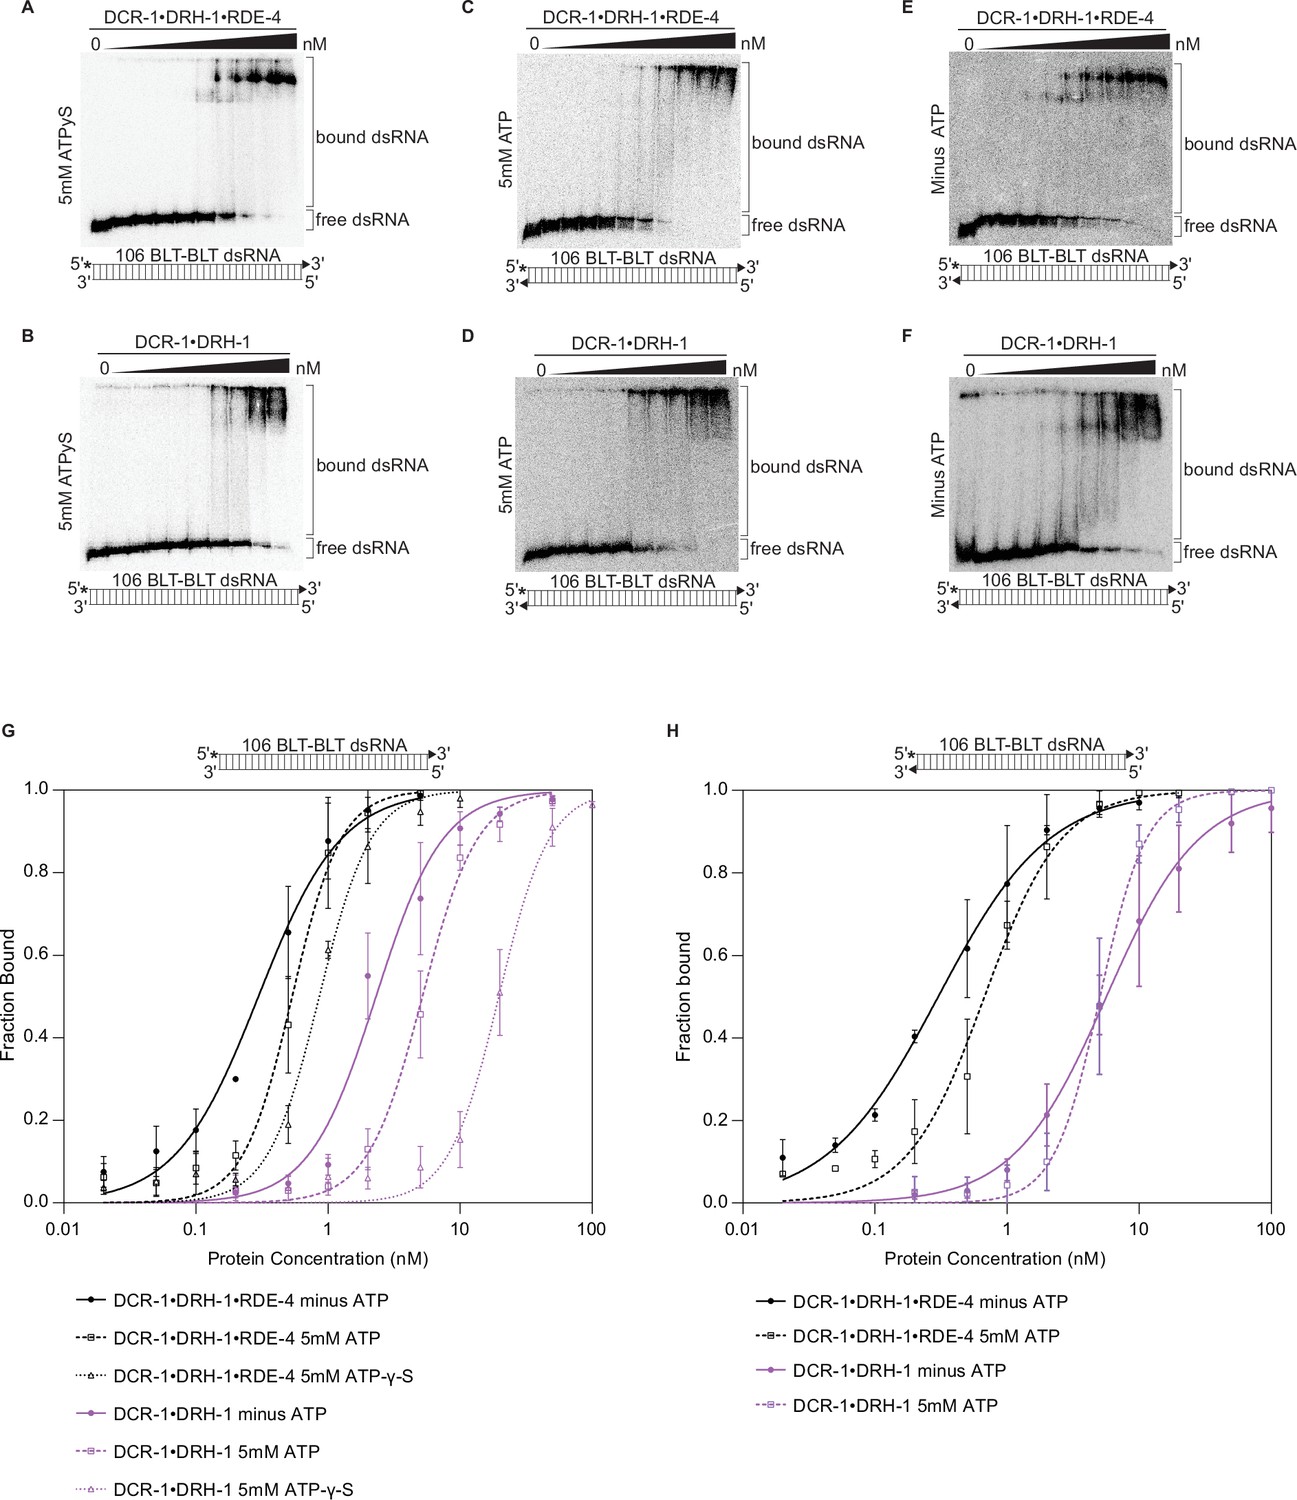
Binding affinity of DCR-1•DRH-1•RDE-4 and DCR-1•DRH-1 for 106 BLT dsRNA in the presence of ATPγS, and for 106 BLT blocked with cyclic phosphate on both ends in the presence and absence of ATP.
See also Figure 1—figure supplement 2. (A – F) Representative PhosphorImages showing gel mobility shift assays with indicated complexes and the presence (5 mM) or absence of ATP or ATPγS as indicated on the left side of the gel. Protein concentrations increased from left to right as indicated and range from 0 to 10 nM (A and E), 0 to 20 nM (C), and 0 to 100 nM (B, D, and F). As illustrated in the cartoon below each gel, all reactions contained 106 BLT dsRNA with the sense (top) strand 5′ 32P-end labeled (*) and one or both strands containing a 2′,3′ cyclic phosphate (filled triangles). As labeled on the right, all dsRNA that migrated through the gel more slowly than dsRNAfree was considered bound. (G) Binding isotherms showing trends for DCR-1•DRH-1•RDE-4 and DCR-1•DRH-1 with 106 BLT dsRNA containing a 2′,3′ cyclic phosphate on the sense strand (filled triangle in cartoon above graph) ±5 mM ATP or 5 mM ATP-γ-S. Data points, mean ± SD (n≥3). (H) Binding isotherms showing trends for DCR-1•DRH-1•RDE-4 and DCR-1•DRH-1 with 106 BLT dsRNA containing a 2′,3′ cyclic phosphate on the sense and antisense strands (filled triangle in cartoon above graph) ±5 mM ATP. Data points, mean ± SD (n≥3).
-
Figure 3—figure supplement 2—source data 1
Raw digital image of gel shift phosphorimager plate used in Figure 3—figure supplement 2A.
- https://cdn.elifesciences.org/articles/93979/elife-93979-fig3-figsupp2-data1-v1.zip
-
Figure 3—figure supplement 2—source data 2
Raw digital image of gel shift phosphorimager plate used in Figure 3—figure supplement 2B.
- https://cdn.elifesciences.org/articles/93979/elife-93979-fig3-figsupp2-data2-v1.zip
-
Figure 3—figure supplement 2—source data 3
Raw digital image of gel shift phosphorimager plate used in Figure 3—figure supplement 2C.
- https://cdn.elifesciences.org/articles/93979/elife-93979-fig3-figsupp2-data3-v1.zip
-
Figure 3—figure supplement 2—source data 4
Raw digital image of gel shift phosphorimager plate used in Figure 3—figure supplement 2D.
- https://cdn.elifesciences.org/articles/93979/elife-93979-fig3-figsupp2-data4-v1.zip
-
Figure 3—figure supplement 2—source data 5
Raw digital image of gel shift phosphorimager plate used in Figure 3—figure supplement 2E.
- https://cdn.elifesciences.org/articles/93979/elife-93979-fig3-figsupp2-data5-v1.zip
-
Figure 3—figure supplement 2—source data 6
Raw digital image of gel shift phosphorimager plate used in Figure 3—figure supplement 2F.
- https://cdn.elifesciences.org/articles/93979/elife-93979-fig3-figsupp2-data6-v1.zip
Figure 4 with 5 supplements
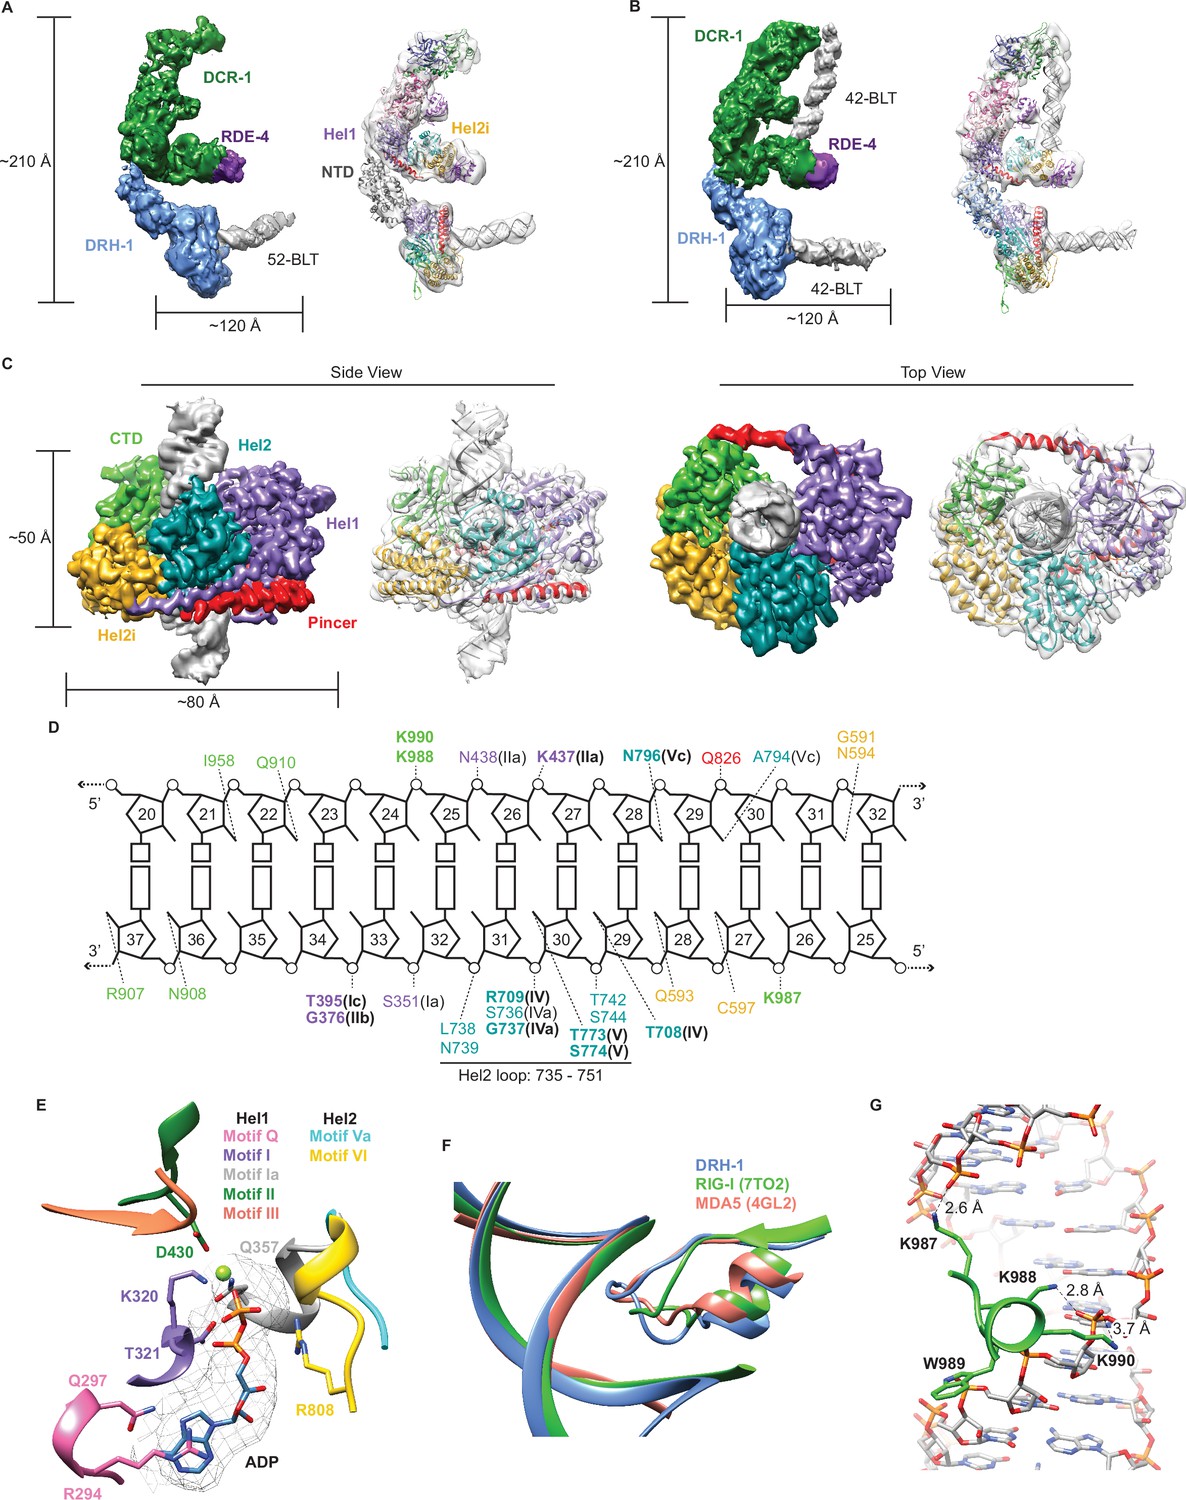
Cryo-EM analyses provide insight into ATP-dependent and ATP-independent cleavage mechanisms.
(A) 6.1 Å reconstruction of DCR-1•DRH-1•RDE-4. DCR-1 and RDE-4 densities were fitted with human Dicer in complex with TRBP (PBD 5ZAK) (Liu et al., 2018), DRH-1 density was fitted with an AlphaFold2 model of DRH-1, and a 52-BLT A-form dsRNA was built in Chimera. Color of protein names correlates with model colors. The domains of DCR-1, DRH-1, and RDE-4 are color coded the same as in Figure 1A. For simplicity, only domains discussed in the text are labeled. See also Figure 4—figure supplement 1. (B) 7.6 Å reconstruction of DCR-1•DRH-1•RDE-4. DCR-1 and RDE-4 densities were fit with PBD 5ZAL (Liu et al., 2018), DRH-1 density was fit with the AlphaFold2 prediction of DRH-1, and a 42-BLT A-form dsRNA was built in Chimera. See also Figure 4—figure supplement 2. (C) 3D reconstruction at 2.9 Å fitted with a refined model of the helicase and CTD domains of DRH-1 and dsRNA. See also Figure 4—figure supplement 3 and Supplementary file 1b. (D) The interactions between DRH-1 and dsRNA, determined with a 3.7 Å cutoff for contacts. Bold residues indicate residues that are identical with RIG-I, MDA5, or both. See also Figure 4—figure supplement 4. (E) ADP, Mg++, and surrounding helicase motifs. Colors: motif Q (pink), motif I (purple), motif Ia (gray), motif II (green), motif III (coral), motif Va (cyan), and motif VI (yellow). The density of ADP is shown in mesh. (F) Conserved loop in the Hel2 domain is inserted into the dsRNA major groove. DRH-1=blue, residues 733–756; RIG-I (7TO2) (Wang and Pyle, 2022)=green, residues 659–679; MDA5 (4GL2) (Wu et al., 2013)=salmon, residues 752–773. Note that this figure includes residues on each side of the loop. See also Figure 4—figure supplement 4. (G) Lysines 987, 988, and 990 interact with the dsRNA backbone. See also Figure 4—figure supplement 4.
Figure 4—figure supplement 1
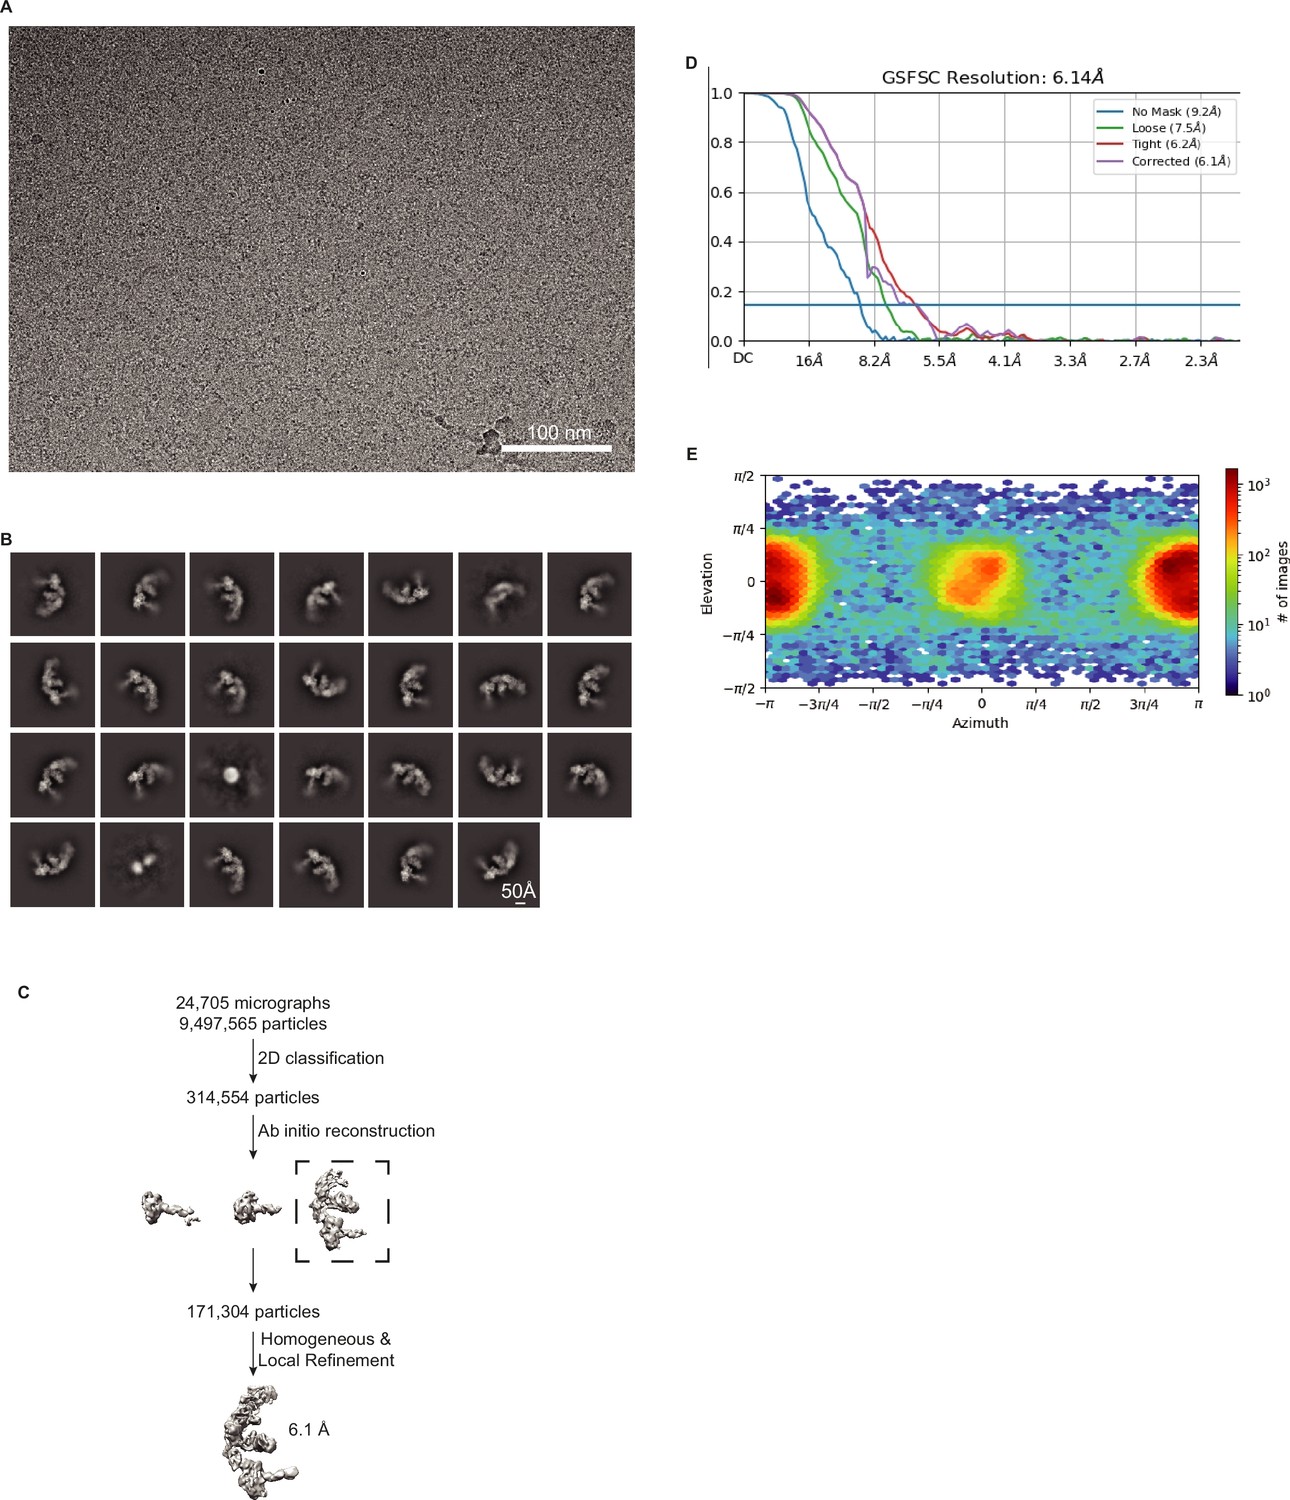
Validation of DCR-1•DRH-1•RDE-4 structure with 52 BLT dsRNA, no ATP.
(A) Representative cryo-EM micrograph. (B) Representative 2D class averages. (C) Processing tree of cryo-EM data in cryoSPARC. (D) Gold-standard FSC plot. (E) Orientation distribution of particles.
Figure 4—figure supplement 2
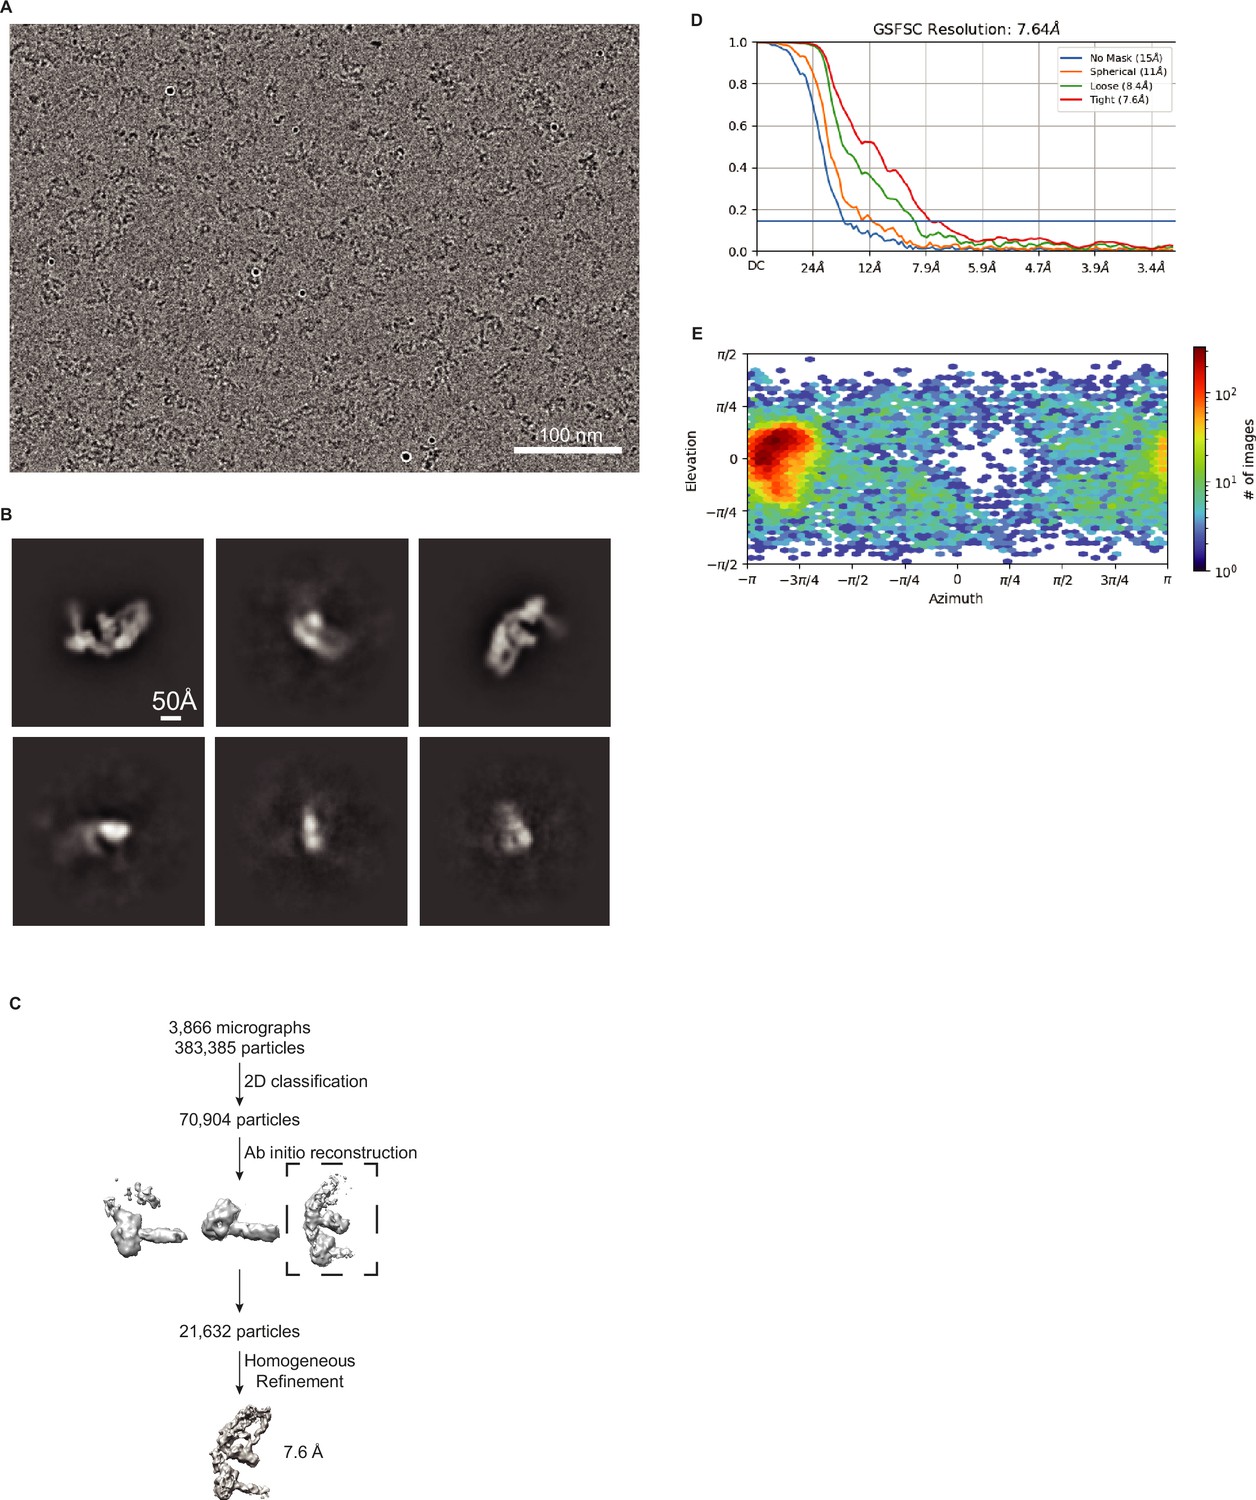
Validation of DCR-1•DRH-1•RDE-4 structure with 42 BLT dsRNA.
(A) Representative cryo-EM micrograph. (B) Representative 2D class averages. (C) Processing tree of cryo-EM data in cryoSPARC. (D) Gold-standard FSC plot. (E) Orientation distribution of particles.
Figure 4—figure supplement 3
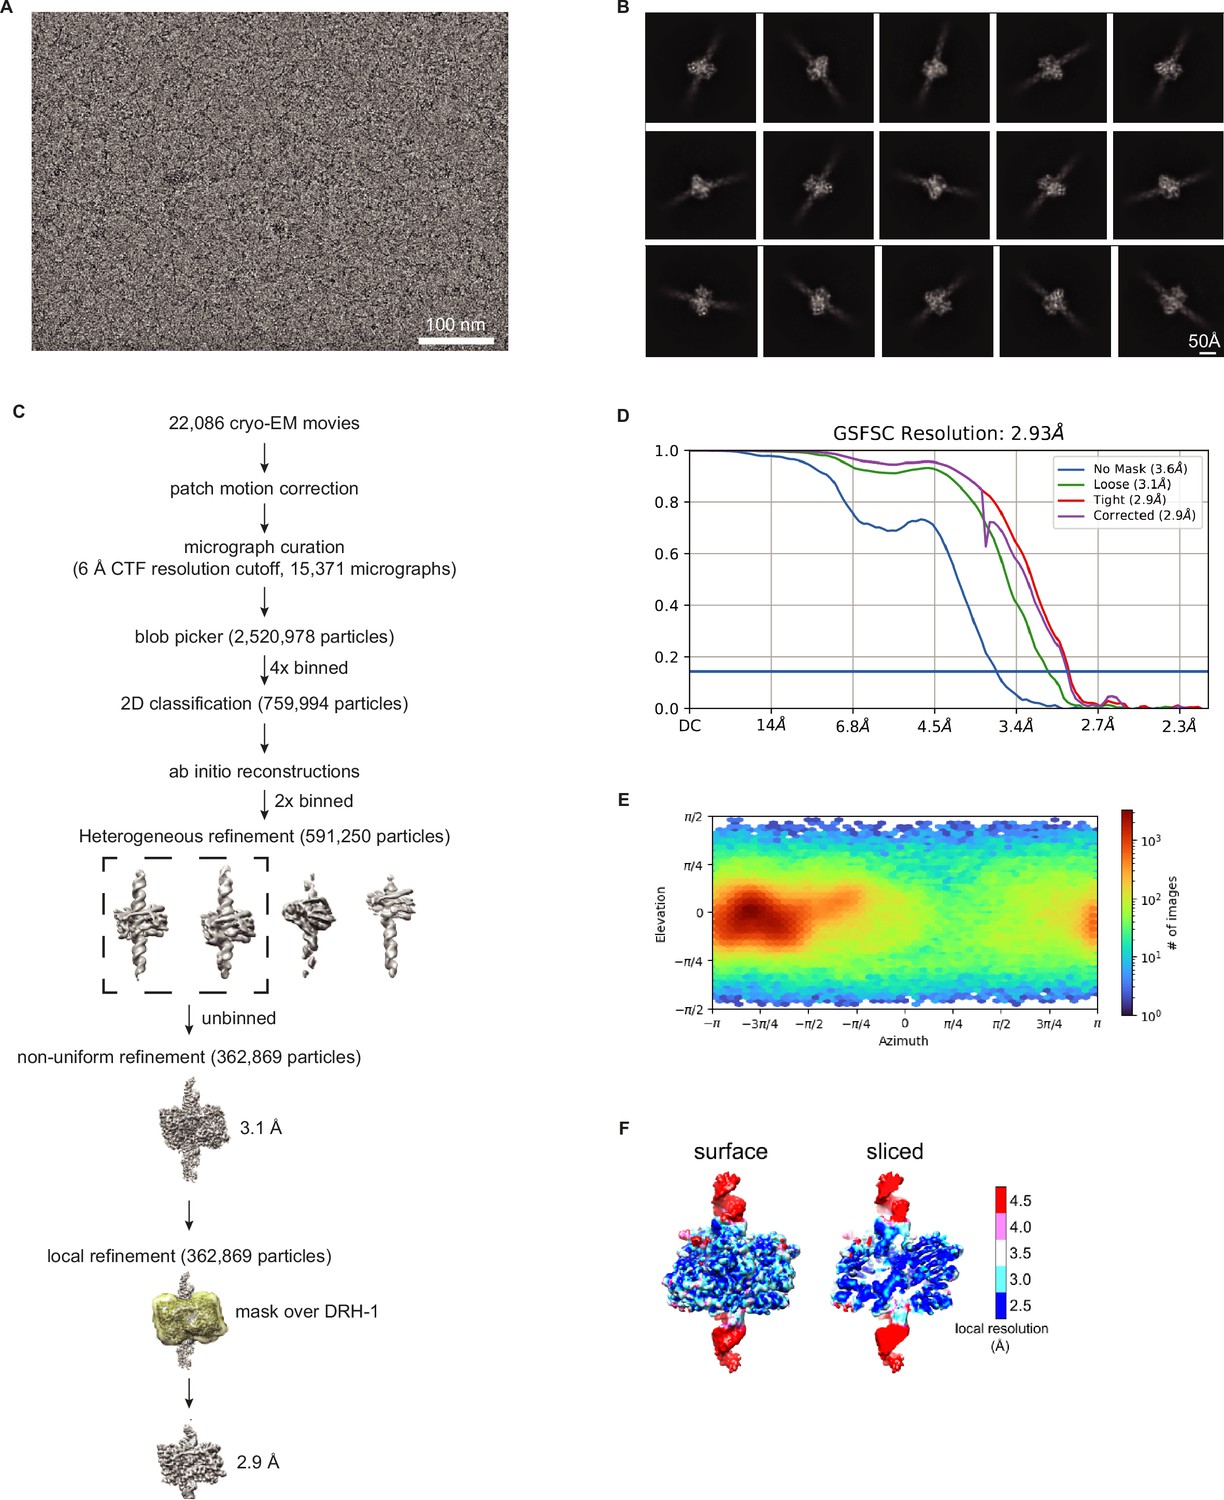
Validation of DRH-1 structure with 106 3′ovr dsRNA.
(A) Representative cryo-EM micrograph. (B) Representative 2D class averages. (C) Processing tree of cryo-EM data in cryoSPARC. (D) Gold-standard FSC plot. (E) Orientation distribution of particles. (F) Local resolution heat map.
Figure 4—figure supplement 4
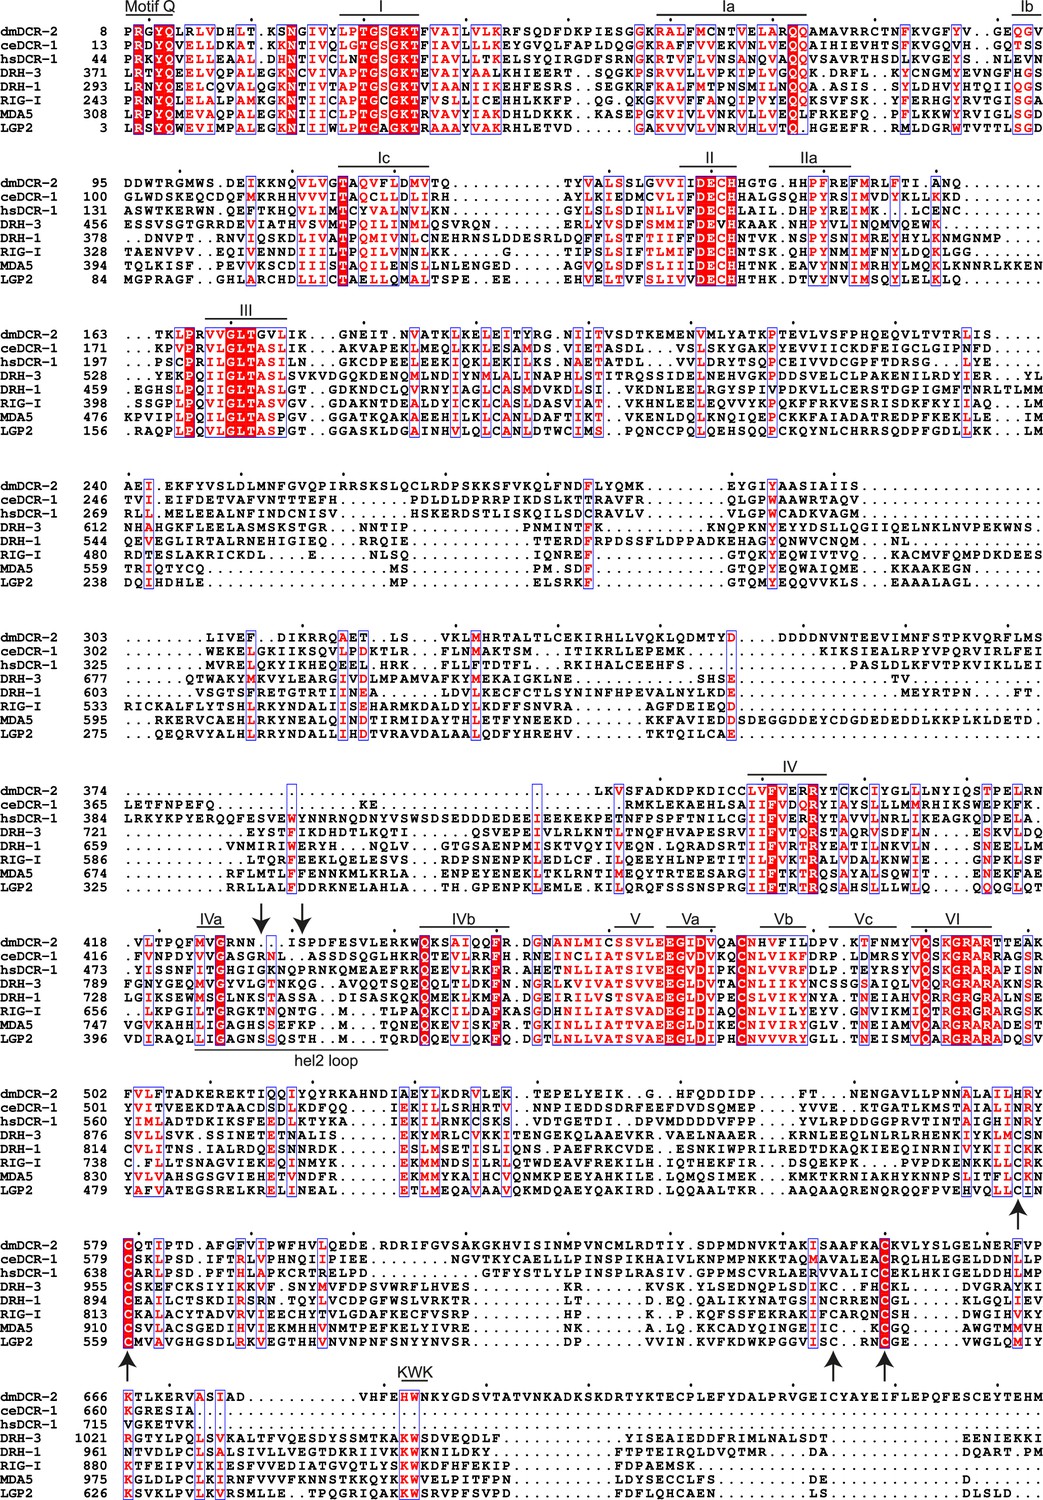
Sequence alignment of RLRs and Dicer helicase and DUF domains.
(A) Structure-based multiple sequence alignment was carried out using Clustal Omega Multiple Sequence Alignments (Goujon et al., 2010; McWilliam et al., 2013; Sievers et al., 2011), and illustrated with ESPript (Robert and Gouet, 2014). Conserved helicase motifs are indicated with a line above the sequence. Arrows pointing down indicate the two threonine residues phosphorylated in RIG-I. Arrows pointing up indicate conserved cysteines in RLRs.
Figure 4—figure supplement 5
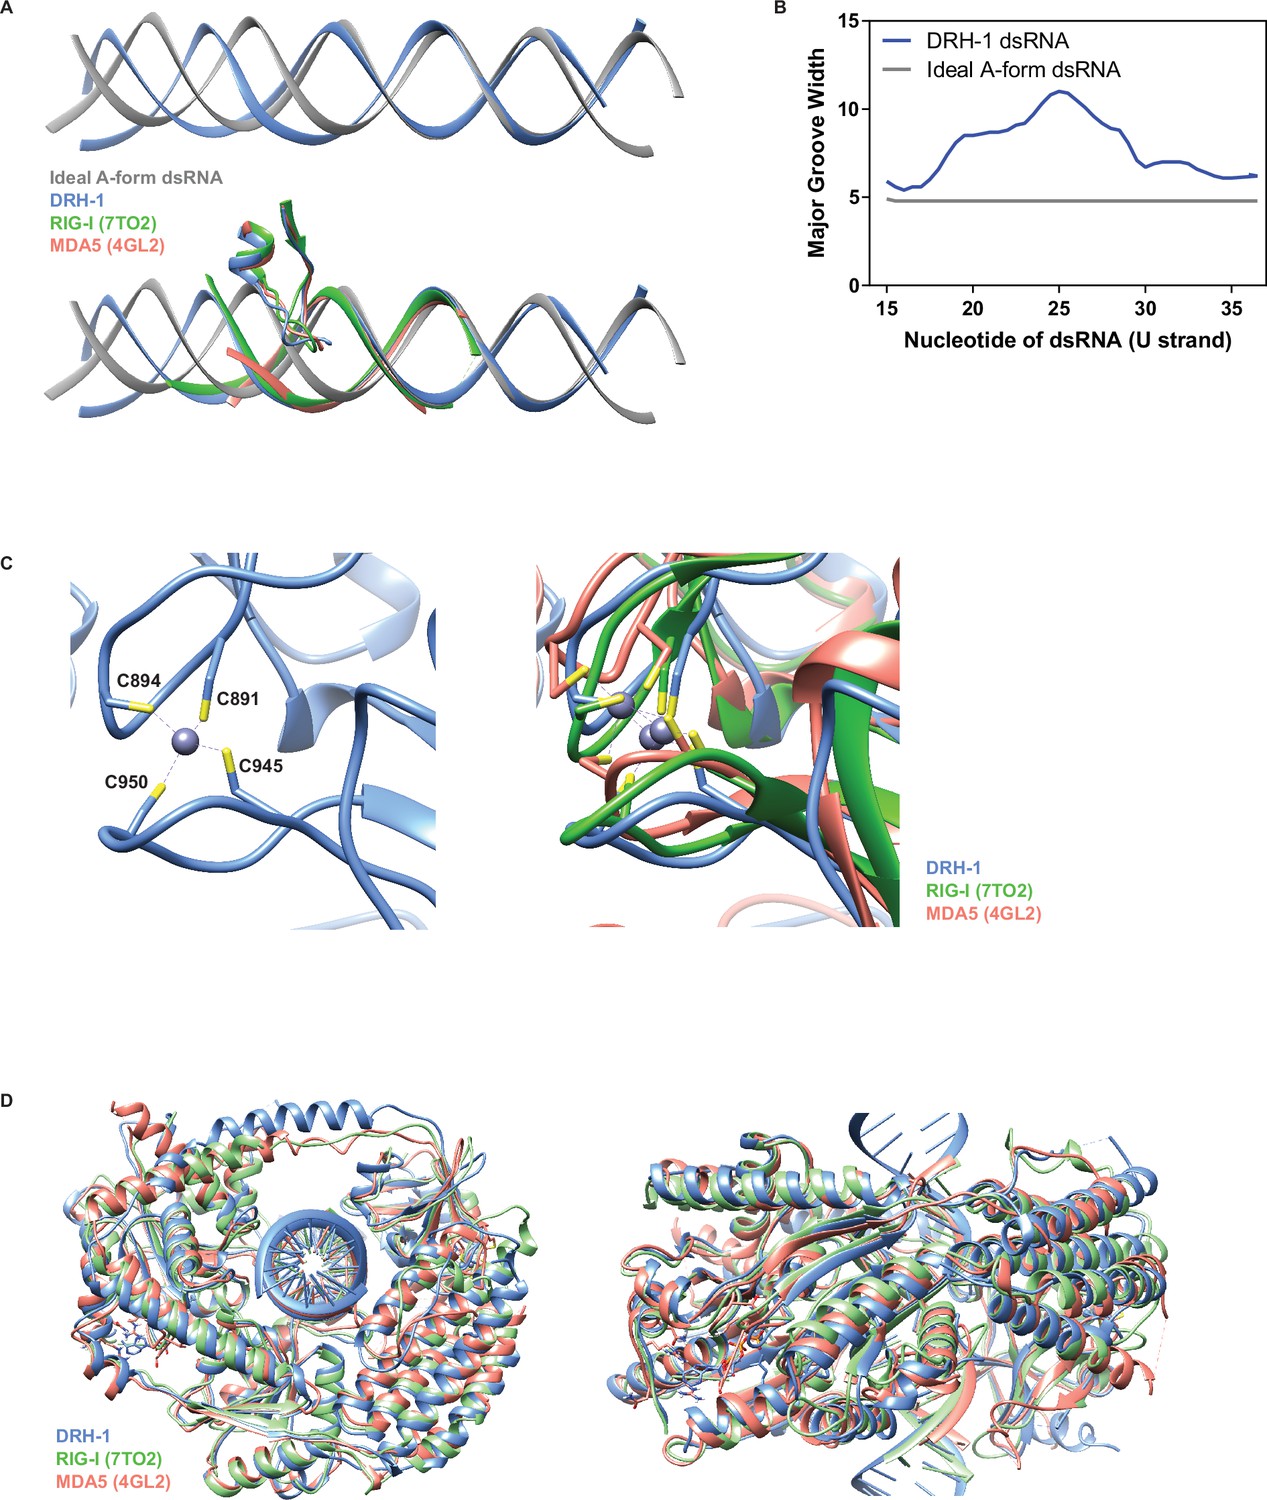
Comparison of DRH-1 with RIG-I and MDA5.
(A) Top: Comparison between an ideal A-form dsRNA (generated in Chimera) and DRH-1 bound dsRNA. Bottom: Comparison between an ideal A-form dsRNA (generated in Chimera) and dsRNA bound to DRH-1 (blue), RIG-I (green, PDB 7TO2) (Wang and Pyle, 2022), and MDA5 (salmon, PDB 4GL2) (Wu et al., 2013). (B) Comparison of the major groove width between an ideal A-form dsRNA and DRH-1 bound dsRNA using Curves+ (Blanchet et al., 2011; Lavery et al., 2009). Nucleotides numbered as in our PDB (8T5S). (C) Left: Four cysteines coordinate binding a zinc ion in DRH-1 (blue). Right: Comparison of structural zinc ion between DRH-1 (blue), RIG-I (green, 7TO2), and MDA5 (salmon, 4GL2). (D) Structural alignment of DRH-1 (blue) with RIG-I (green, 7TO2) and MDA5 (salmon, 4GL2).
Figure 5

Autoinhibition of DRH-1 is relieved to promote processive cleavage.
(A) Full length DRH-1 (25 nM) was incubated with 106 BLT dsRNA (400 nM) with 100 μM α-32P-ATP at 20 °C (lane 2). ΔNTD DRH-1 (25 nM) was incubated without RNA (-RNA; lane 1) or with 400 nM 106 BLT (lanes 3–11) or 3′ovr dsRNA (lanes 12–20) with 100 μM α-32P-ATP at 20 °C. ATP hydrolysis was monitored by TLC, and a representative PhosphorImage is shown. Positions of origin, ATP, and ADP are indicated. (B) Quantification of ATP hydrolysis assay as in A. Data points are mean ± SD (n=3) with symbol key in graph. (C and D) A representative PhosphorImage (C) shows trap experiments using 50 nM DCR-1•DRH-1•RDE-4 and 1 nM 32P-internally labeled 106 BLT dsRNA ±2000 nM 52 BLT cold dsRNA. Quantification (D) shows mean ± SD (n=3). Cold dsRNA was added at 2.75 minutes as indicated by the vertical dotted line and arrow. (E) Single-turnover cleavage assays of 106 BLT or 106 3′ovr dsRNA (1 nM) with indicated protein complex (25 nM)±5 mM ATP as indicated. Sense strand was 32P-internally labeled to allow visualization of intermediates, with red line noting internal cleavage products of 21–23 nts and blue line noting 22–23 nt products. Products were separated by 17% denaturing PAGE, and a representative PhosphorImage is shown (n=3). Left, marker nucleotide lengths. AH, alkaline hydrolysis.
-
Figure 5—source data 1
Raw digital image of thin-layer chromatography plate used in Figure 5A.
- https://cdn.elifesciences.org/articles/93979/elife-93979-fig5-data1-v1.zip
-
Figure 5—source data 2
Raw digital image of cleavage phosphorimager plate used in Figure 5C.
- https://cdn.elifesciences.org/articles/93979/elife-93979-fig5-data2-v1.zip
-
Figure 5—source data 3
Raw digital image of cleavage phosphorimager plate used in Figure 5E.
- https://cdn.elifesciences.org/articles/93979/elife-93979-fig5-data3-v1.zip
Figure 6
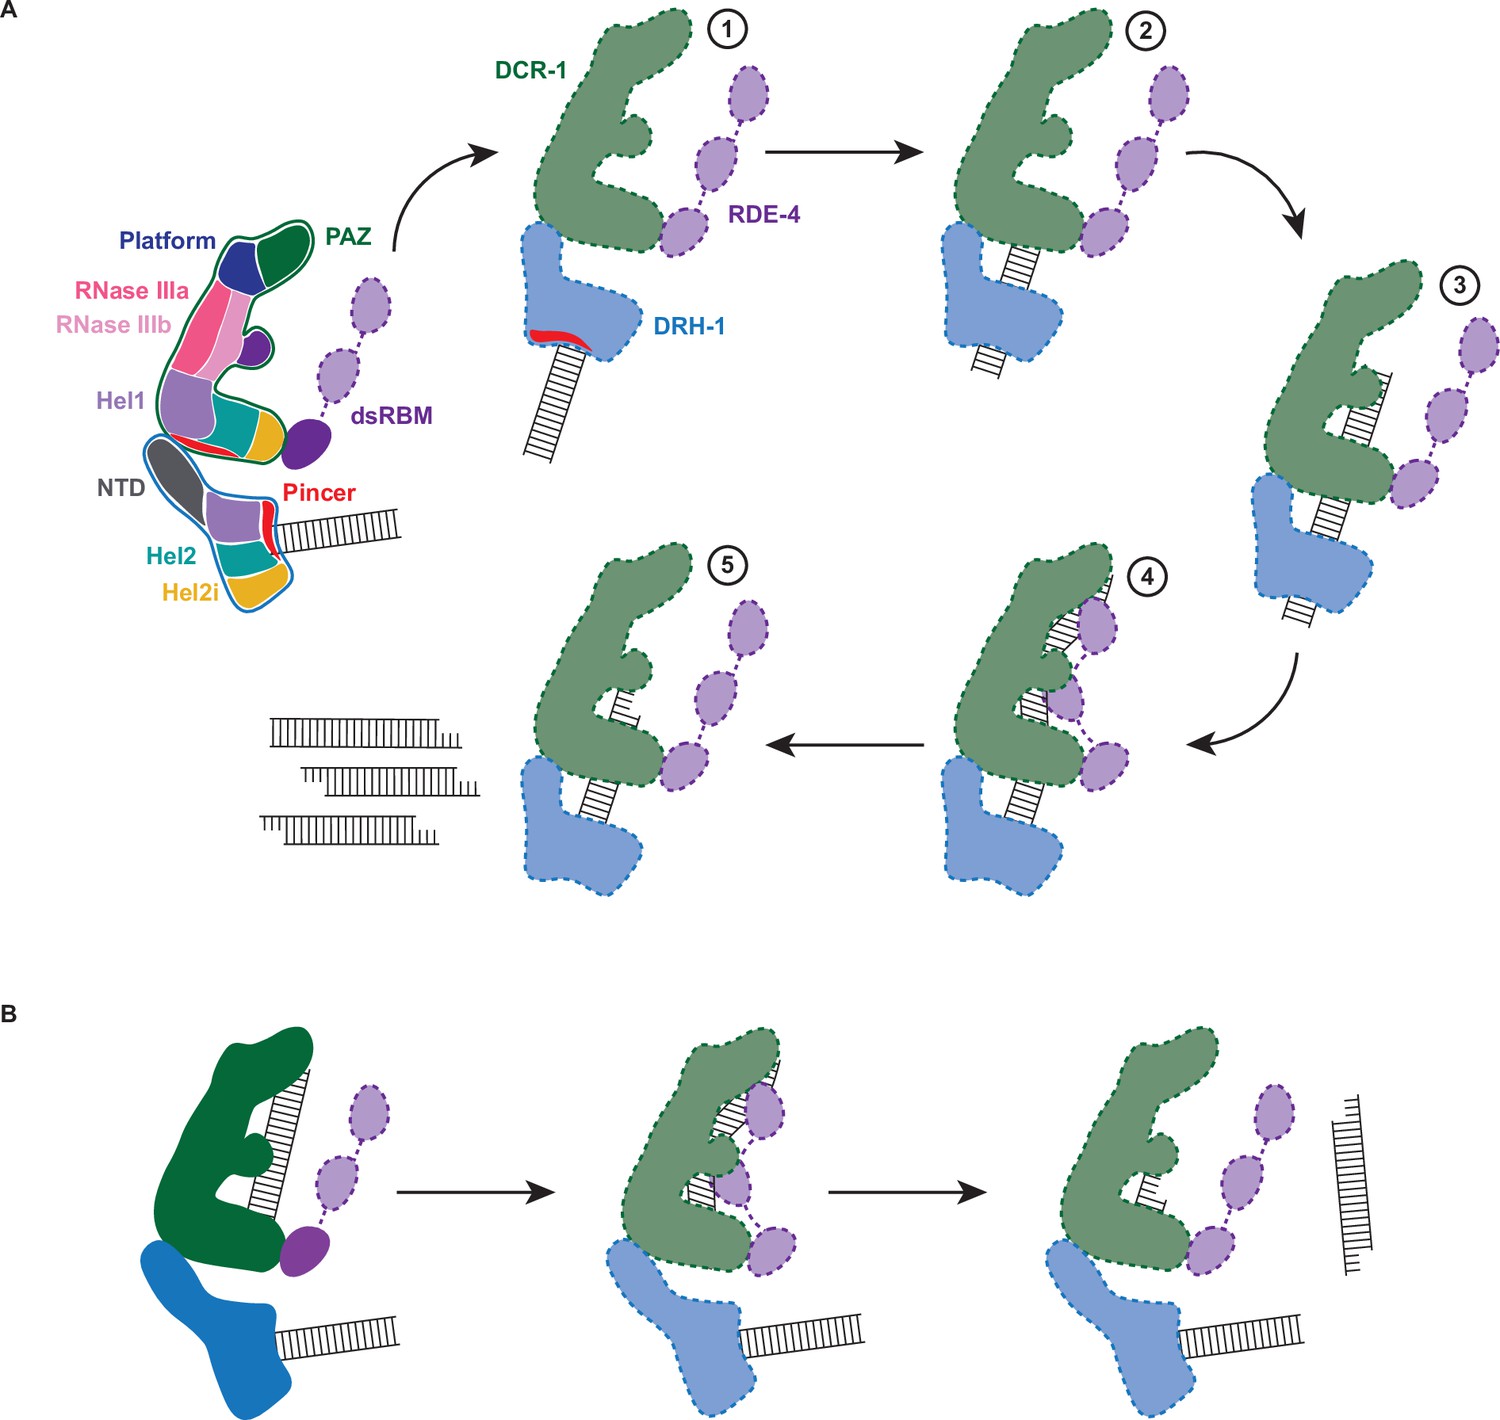
Working model of dsRNA cleavage by DCR-1•DRH-1•RDE-4.
(A) Model for ATP-dependent cleavage. Far left shows cartoon of complex with domains color-coded. Illustrations 1–5 show proposed steps as discussed in text, with DCR-1 (green), DRH-1, (blue), and RDE-4 (purple). Solid lines indicate structures observed in our cryo-EM studies, while dashed lines indicate proposed intermediates not yet observed. Pincer subdomain (red) is colored to orient proposed DRH-1 conformational change. Additional details in text. (B) Model for ATP-independent cleavage, with colors and solid and dashed lines as in A.
Tables
Table 1
Summary of kobs, t1/2, and Kd values.
| kobs (min–1)(Cleavage) | t1/2 (min)(Cleavage) | kobs (min–1)(ATP Hydrolysis) | Kd (nM) | ||
|---|---|---|---|---|---|
| +ATP | +ATP | +ATP | - ATP | +ATP | |
| DCR-1•DRH-1•RDE-4 | |||||
| 106 BLT | 0.14±0.01 | 4.9 | 0.11±0.01 | 0.30±0.04 | 0.53±0.04 |
| 106 3′ovr | 0.006±0.0005 | 109.6 | 0.03±0.005 | 0.37±0.04 | 0.87±0.10 |
| DCR-1G36R•DRH-1•RDE-4 | |||||
| 106 BLT | 0.05±0.004 | 13.65 | 0.018±0.002 | 0.42±0.06 | 0.53±0.05 |
| 106 3′ovr | 0.007±0.0007 | 95.99 | 0.014±0.002 | 0.58±0.07 | 0.85±0.08 |
| DCR-1•DRH-1K320A•RDE-4 | |||||
| 106 BLT | 0.013±0.001 | 49.77 | n.d. | 1.12±0.12 | 1.31±0.13 |
| 106 3′ovr | 0.003±0.0004 | 199.6 | n.d. | 0.99±0.10 | 1.60±0.15 |
| DCR-1•DRH-1 | |||||
| 106 BLT | 0.002±0.0003 | 235.2 | 0.012±0.001 | 2.11±0.28 | 5.18±0.33 |
| 106 3′ovr | n.d. | n.d. | n.d. | 7.50±0.80 | 28.64±2.03 |
| ΔNTD DRH-1 | |||||
| 106 BLT | 0.08 | ||||
| 106 3′ovr | 0.002 | ||||
-
Values shown are mean ± SD (n=3). n.d., not detected.
Key resources table
| Reagent type (species) or resource | Designation | Source or reference | Identifiers | Additional information |
|---|---|---|---|---|
| Antibody | Anti-drh-1 (N-term) antibody | Sigma-Aldrich | Cat# SAB1300243 | |
| Antibody | DYKDDDDK (Flag) Tag Polyclonal Antibody | ThermoFisher | Cat# PA1-984B | |
| Antibody | dcr-1 polyclonal antibody | Fischer Scientific | Cat# PAB3792 | |
| Antibody | Anti-rde-4 | Thomas Duchaine | N/A | |
| Cell line | Sf9 (Spodoptera frugiperda) cells | Expression Systems | Cat# 94–001 S | |
| Commercial kit | Baculovirus titering kit | Expression Systems | Cat# 97 | |
| Commercial kit | biGBac kit | Addgene | Cat# 1000000088 | Rapid generation of baculoviral expression constructs |
| Recombinant DNA reagent | DCR-1 in plib vector | This paper | N/A | plib vector is from biGBac kit |
| Recombinant DNA reagent | DCR-1G36R in plib vector | This paper | N/A | |
| Recombinant DNA reagent | OSF-DRH-1 in plib vector | This paper | N/A | DRH-1 was modified in house to add OSF tag |
| Recombinant DNA reagent | OSF-ΔNTD-DRH-1 in plib vector | This paper | N/A | |
| Recombinant DNA reagent | OSF-DRH-1K320A in plib vector | This paper | N/A | |
| Recombinant DNA reagent | RDE-4 in plib vector | This paper | N/A | |
| Recombinant DNA reagent | DCR-1•OSF-DRH-1•RDE-4 in pbig vector | This paper | N/A | pbig vector is from biGBac kit |
| Recombinant DNA reagent | DCR-1G36R•OSF-DRH-1•RDE-4 in pbig vector | This paper | N/A | |
| Recombinant DNA reagent | DCR-1•OSF-DRH-1K320A•RDE-4 in pbig vector | This paper | N/A | |
| Recombinant DNA reagent | DCR-1•OSF-DRH-1 in pbig vector | This paper | N/A |
Additional files
-
Supplementary file 1
Supplemental tables.
(a) Summary of Kd values. (b) Cryo-EM data collection, refinement, and validation statistics.
- https://cdn.elifesciences.org/articles/93979/elife-93979-supp1-v1.docx
-
MDAR checklist
- https://cdn.elifesciences.org/articles/93979/elife-93979-mdarchecklist1-v1.pdf
Download links
A two-part list of links to download the article, or parts of the article, in various formats.
Downloads (link to download the article as PDF)
Open citations (links to open the citations from this article in various online reference manager services)
Cite this article (links to download the citations from this article in formats compatible with various reference manager tools)
Caenorhabditis elegans Dicer acts with the RIG-I-like helicase DRH-1 and RDE-4 to cleave dsRNA
eLife 13:RP93979.
https://doi.org/10.7554/eLife.93979.3


