Embryonic origins of forebrain oligodendrocytes revisited by combinatorial genetic fate mapping
- Institutes of Brain Science, State Key Laboratory of Medical Neurobiology and MOE Frontiers Center for Brain Science, Department of Neurobiology, Zhongshan Hospital, Fudan University, China
Figures
Figure 1
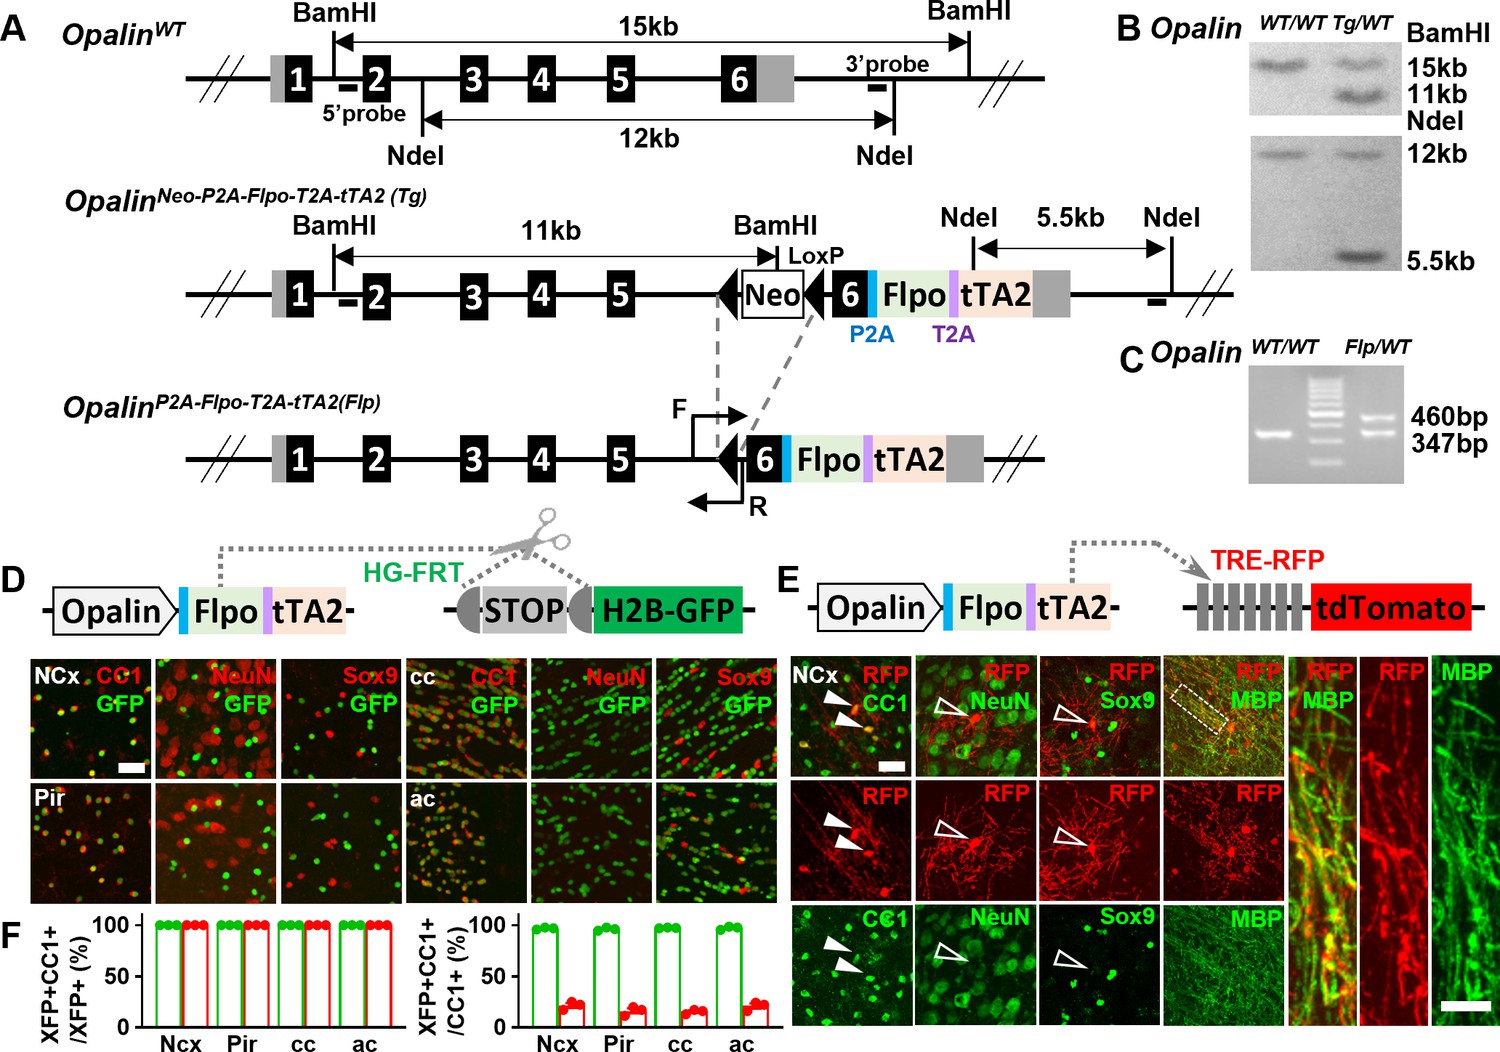
A new driver mouse for efficient and specific oligodendrocyte (OL) labeling.
(A) Scheme for generating the OpalinP2A-Flpo-T2A-tTA2 allele. (B) Southern blot confirmation of correctly targeted embryonic stem cell clone. (C) Genomic polymerase chain reaction (PCR) to genotype F1 offspring. (D) OL labeling by Flp. (E) OL labeling by tTA2. High magnification images of the boxed region showing co-localization of red fluorescent protein (RFP) with myelin basic protein (MBP) staining, which further demonstrated the myelination ability of labeled OLs. (F) Quantification of labeling specificity (left panel) and efficiency (right panel) by colacalization with OL marker CC1. Both reporting systems are highly specific, as shown by the complete co-localization of fluorescent protein (XFP) with OL marker (CC1) and lack of co-staining with neuronal marker (NeuN) or astrocyte marker (Sox9). Quantification bar graph was not presented for NeuN and Sox9 as zero co-localizations were observed in all analyzed regions. Close to complete OL labeling was achieved by Flp-dependent H2B-GFP reporter in all analyzed regions (green dots), while sparser labeling with variable regional density was achieved by tTA2-dependent tdTomato reporter driven by TRE promoter (red dots). NCx: neocortex. Pir: piriform cortex. cc: corpus callosum. ac: anterior commissure. Scale bar: 50 μm in low magnification images, 5 μm in high magnification images. Quantification: n = 3. Dots represent data from individual mice.
-
Figure 1—source data 1
Raw unedited blot for Figure 1B.
- https://cdn.elifesciences.org/articles/95406/elife-95406-fig1-data1-v1.zip
-
Figure 1—source data 2
Uncropped and labeled blot for Figure 1B.
- https://cdn.elifesciences.org/articles/95406/elife-95406-fig1-data2-v1.zip
-
Figure 1—source data 3
Raw unedited gel for Figure 1C.
- https://cdn.elifesciences.org/articles/95406/elife-95406-fig1-data3-v1.zip
-
Figure 1—source data 4
Uncropped and labeled gel for Figure 1C.
- https://cdn.elifesciences.org/articles/95406/elife-95406-fig1-data4-v1.zip
-
Figure 1—source data 5
The raw data for the visualization of data presented in Figure 1F.
- https://cdn.elifesciences.org/articles/95406/elife-95406-fig1-data5-v1.xlsx
Figure 2 with 3 supplements
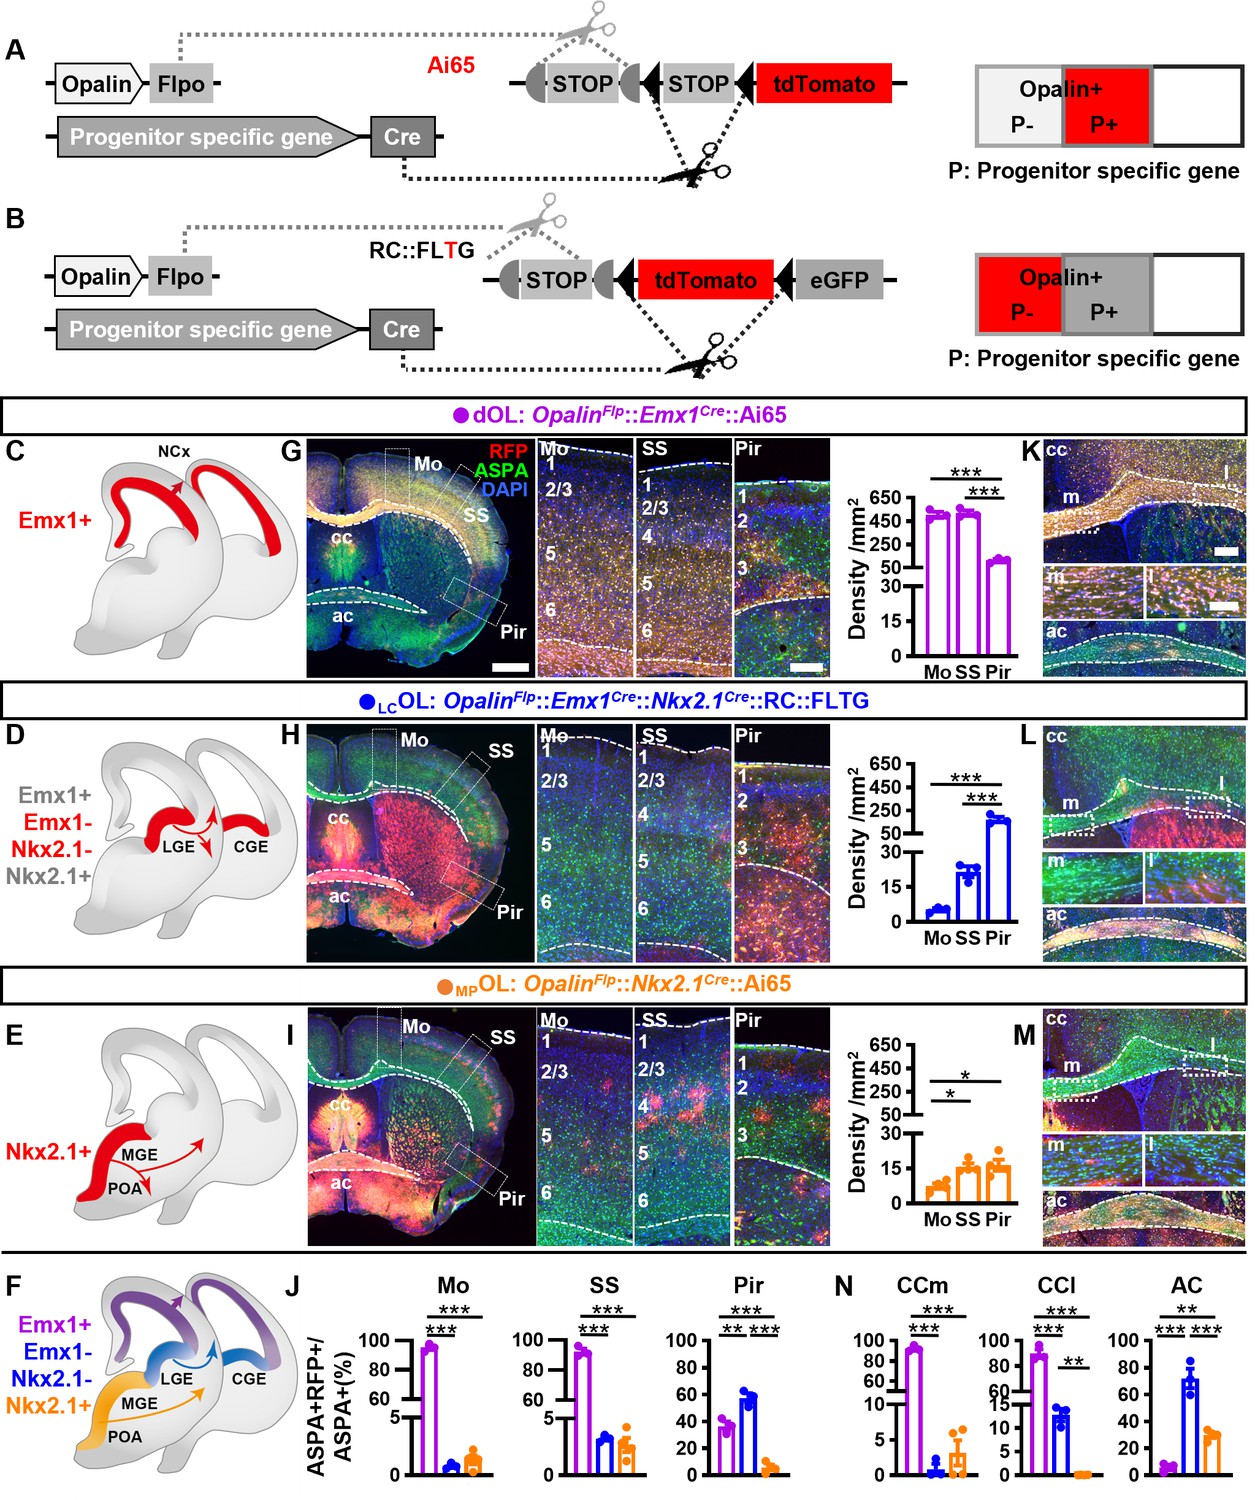
Combinatorial fate mapping of dOLs, MPOLs, and LCOLs.
(A) Strategy for intersectional labeling. Flp-AND-Cre labels oligodendrocytes (OLs) from Cre-expressing progenitors with RFP. (B) Strategy for subtractional labeling of OLs derived from non-Cre-expressing progenitors with RFP. The eGFP expressing OLs derived from Cre-expressing progenitors were not used for analysis in this scenario and thereby were not highlighted by color. Schematics showing intersectional labeling of dOLs in OpalinFlp::Emx1Cre::Ai65 (C), subtractional labeling of LCOLs in OpalinFlp::Emx1Cre::Nkx2.1Cre::RC::FLTG (D), intersectional labeling of MPOLs in OpalinFlp::Nkx2.1Cre::Ai65 (E), and cortical OLs derived from all three origins (F). (G–I) Representative images (left panels) and quantifications (right panels) of RFP+ cell density in motor cortex (Mo), somatosensory cortex (SS), and piriform cortex (Pir). (J) Quantification of differential contribution to ASPA+ OLs by three embryonic origins to Mo, SS, and Pir. Representative images (K–M) and quantifications (N) of differential contribution to ASPA+ OLs by three embryonic origins in the two major commissure white matter tracts: corpus callosum (cc) and anterior commissure (ac). MPOLs and LCOLs preferentially reside in the medial and lateral cc (cc-m and cc-l), respectively. Scale bar: 1 mm in low magnification images in (G–I), 250 μm in high magnification images of the boxed area in (G–I) and low magnification images in (K–M), 100 μm in high magnification images of the boxed area (cc-m and cc-l) in (K–M). n = 3 for dOLs and LCOLs; n = 4 for MPOLs. Dots represent data from individual mice. Error bar: standard error of the mean (SEM). *p < 0.05, **p < 0.01, ***p < 0.001.
-
Figure 2—source data 1
The raw data for the visualization of data presented in Figure 2G–J, N.
- https://cdn.elifesciences.org/articles/95406/elife-95406-fig2-data1-v1.xlsx
Figure 2—figure supplement 1
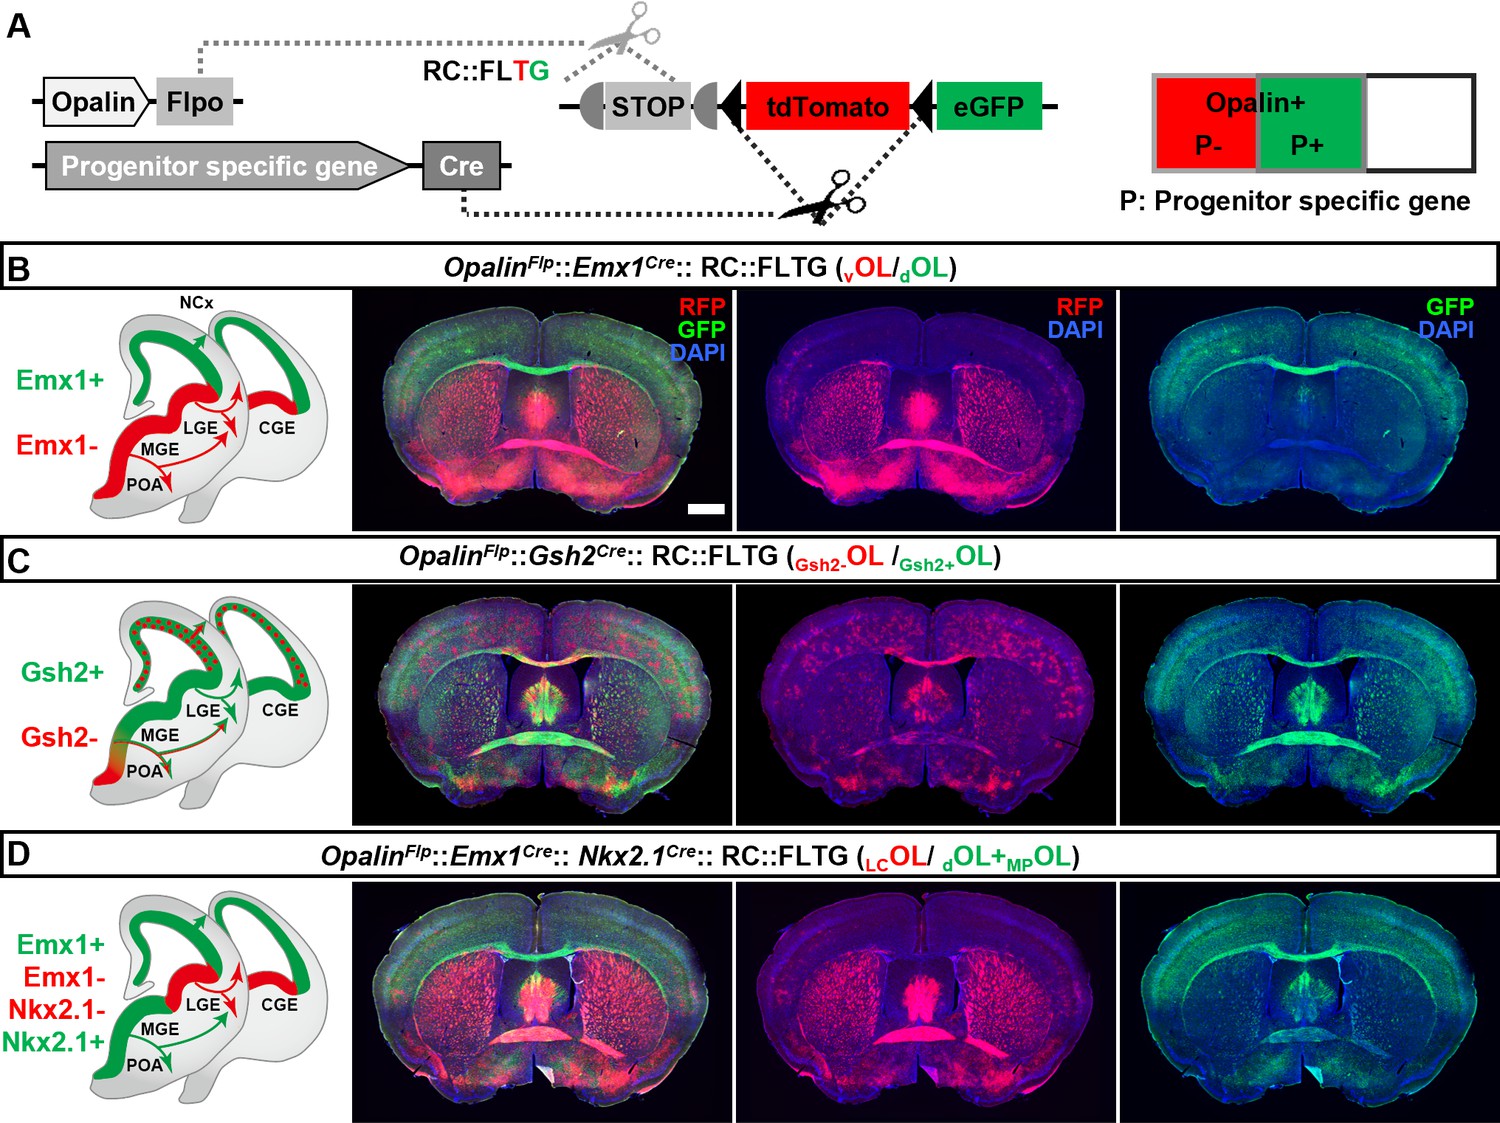
Simultaneous differential labeling of oligodendrocytes (OLs) derived from complementary embryonic origins.
(A) Strategy for simultaneous labeling of OLs derived from complementary origins. Flp-NOT-Cre labels OLs from non-Cre-expressing progenitors with RFP, while Flp-AND-Cre labels OLs from Cre-expressing progenitors with eGFP. (B) Coronal sections showing GFP+ OLs from dorsal origin (dOLs) and RFP+ OLs from ventral origin (vOLs) in OpalinFlp::Emx1Cre::RC::FLTG. (C) Coronal sections showing GFP+ OLs derived from Gsh2+ progenitors (Gsh2+OL) and RFP+ OLs derived from Gsh2− progenitors (Gsh2−OL) in OpalinFlp::Gsh2Cre::RC::FLTG. (D) Coronal sections showing GFP+ OLs from dorsal and medial ganglionic eminence/preoptic area (MGE/POA) origin (dOLs+MP OLs) and RFP+ OLs from lateral/caudal ganglionic eminences (LGE/CGE) origin (LCOLs) in OpalinFlp:: Emx1Cre:: Nkx2.1Cre::RC::FLTG. Scale bar: 1 mm.
Figure 2—figure supplement 2
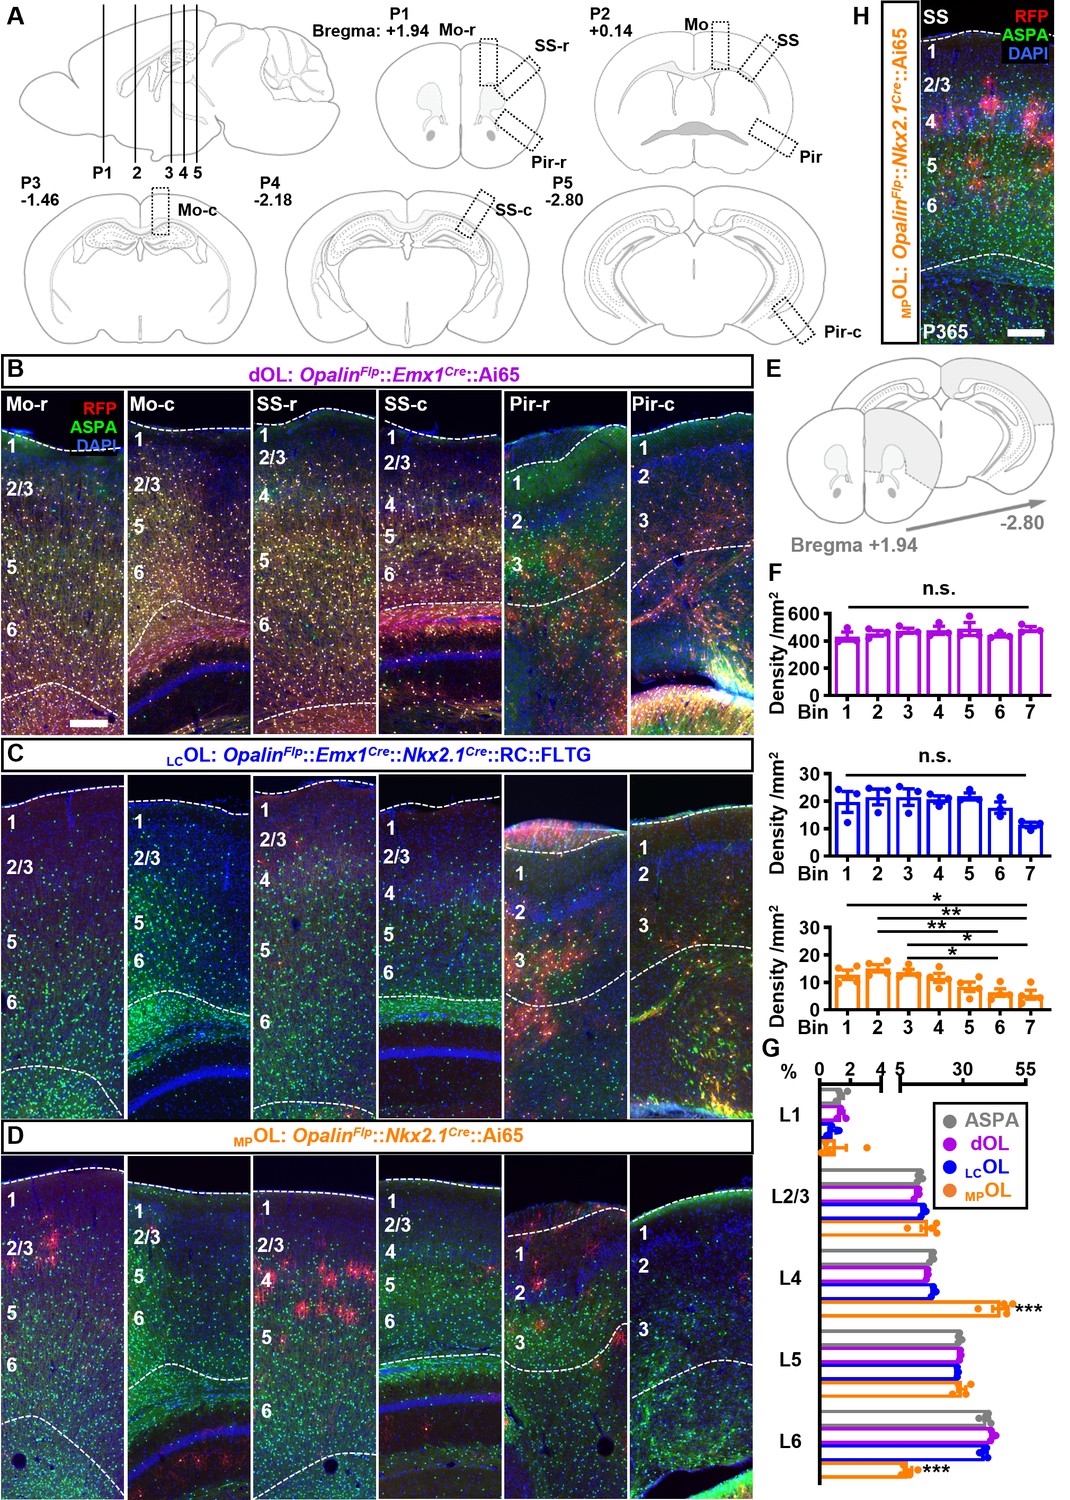
The distribution pattern of cortical dOLs, MPOLs, and LCOLs.
(A) Schematics of cortical regions chosen for quantifications and for showing representative images (boxed regions). Every fourth coronal section between Bregma +1.94 and −2.80 mm was analyzed. Positions (P) 1–5 correspond to sections from which representative images were taken from. P2 corresponds to the sections shown in Figure 2G–I. (B–D) For each cortical region, two representative images at the rostral (r) and caudal (c) ends were presented for each combination. (E, F) Quantification of rostral–caudal distribution of neocortical dOLs, LCOLs, and MPOLs. Neocortical area of slices ranging from Bregma +1.94 to −2.80 (gray shaded region in E) was quantified and grouped into seven evenly divided bins along the rostral–caudal axis. Densities of dOLs and LCOLs showed no significant change across bins, while MPOLs exhibited lower density in more caudal regions. (G) Distributions of dOLs, LCOLs, and MPOLs across six layers in SS. Similar to the total oligodendrocyte (OL) distribution quantified based on aspartoacylase (ASPA) staining, more dOLs and LCOLs reside in deeper layers. In contrast, MPOLs are highly enriched in L4 at the cost of L6 with significant deviation from the total OLs. (H) Representative image of SS from 1-year-old OpalinFlp::Nkx2.1Cre::Ai65 mouse. Scale bar: 200 μm. n = 3 for dOLs and LCOLs; n = 4 for MPOLs and ASPA. Dots represent data from individual mice. Error bar: standard error of the mean (SEM). *p < 0.05, **p < 0.01, ***p < 0.001.
-
Figure 2—figure supplement 2—source data 1
The raw data for the visualization of data presented in Figure 2—figure supplement 2F, G.
- https://cdn.elifesciences.org/articles/95406/elife-95406-fig2-figsupp2-data1-v1.xlsx
Figure 2—figure supplement 3

Intersectional labeling of oligodendrocytes (OLs) derived from both dorsal origin and medial ganglionic eminence/preoptic area (MGE/POA).
(A) Coronal sections showing both dOLs and MPOLs labeled by RFP in OpalinFlp::Emx1Cre::Nkx2.1Cre::Ai65. (B) Higher magnification images showing ASPA+RFP+ dOLs/MPOLs (closed arrow heads) and ASPA+RFP− putative LCOLs (open arrow heads). The latter cells were difficult to find in neocortical regions such as motor cortex (Mo) and somatosensory cortex (SS), and corpus callosum (cc), but were frequently encountered in piriform cortex (Pir) and anterior commissure (ac). Scale bar: 1 mm in low magnification images, 200 μm in Mo, SS, cc, and ac, 10 μm in high magnification images of boxed area.
Figure 3
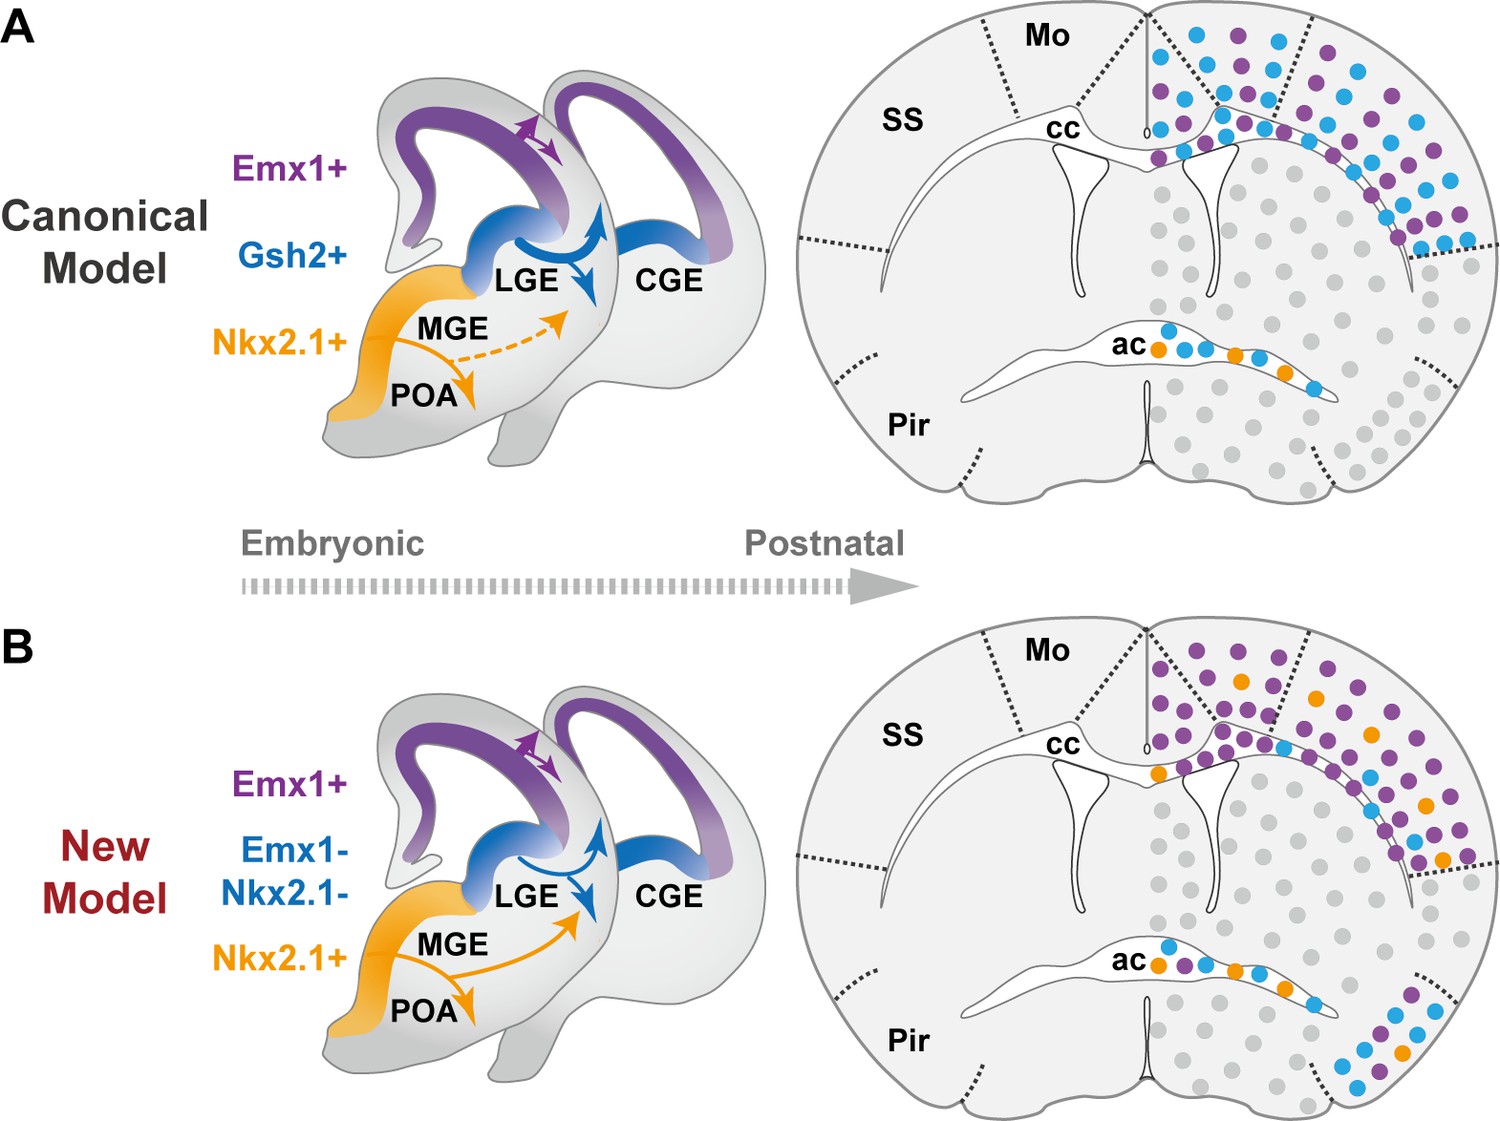
The classical and revised model of forebrain oligodendrocyte (OL) origins.
(A) In the classical model (Kessaris et al., 2006), OLs derived from medial ganglionic eminence/preoptic area (MGE/POA) (orange) were largely eliminated postnatally (thin dashed line), while those from lateral/caudal ganglionic eminences (LGE/CGE) (blue) and dorsal origin (purple) survive at similar proportions (thick solid line). Therefore, neocortex (NCx) and corpus callosum (cc) contain comparable density of LCOLs (blue dots) and dOLs (purple dots) and are devoid of MPOLs (orange dots). (B) In the new model, NCx and cc mainly contain dOLs with very low contribution from the ventral origins. LCOLs mainly contribute to piriform cortex (Pir) and anterior commissure (ac). MPOLs makes a small but sustained contribution to NCx, with a strong laminar preference toward layer 4 in somatosensory cortex (SS). In addition, dOLs and MPOLs also make substantial contributions to Pir and ac, respectively. Gray dots indicate OLs in unanalyzed regions.
Tables
Key resources table
| Reagent type (species) or resource | Designation | Source or reference | Identifiers | Additional information |
|---|---|---|---|---|
| Genetic reagent (Mus musculus) | Nkx2.1Cre | The Jackson Laboratory | Strain#: 008661; RRID: IMSR_JAX:008661 | |
| Genetic reagent (Mus musculus) | Gsh2Cre | The Jackson Laboratory | Strain#: 025806; RRID: IMSR_JAX:025806 | |
| Genetic reagent (Mus musculus) | Emx1Cre | The Jackson Laboratory | Strain#: 005628; RRID: IMSR_JAX:005628 | |
| Genetic reagent (Mus musculus) | Ai65 | The Jackson Laboratory | Strain#: 021875; RRID: IMSR_JAX:021875 | |
| Genetic reagent (Mus musculus) | RC::FLTG | The Jackson Laboratory | Strain#: 026932; RRID: IMSR_JAX:026932 | |
| Genetic reagent (Mus musculus) | Ai62 | The Jackson Laboratory | Strain#: 022731; RRID: IMSR_JAX:022731 | |
| Genetic reagent (Mus musculus) | HG-FRT | The Jackson Laboratory | Strain#: 028581; RRID: IMSR_JAX:028581 | |
| Genetic reagent (Mus musculus) | OpalinP2A-Flpo-T2A-tTA2 | This paper | See Materials and methods, Mice | |
| Antibody | anti-RFP (goat polyclonal) | SICGEN | Cat# AB0081-200; RRID: AB_2333095 | IF (1:2000) |
| Antibody | anti-RFP (rabbit polyclonal) | Rockland | Cat# 600-401-379; RRID: AB_2209751 | IF (1:2000) |
| Antibody | anti-GFP (chicken polyclonal) | Aves Labs | Cat# GFP-1020; RRID: AB_10000240 | IF (1:1000) |
| Antibody | anti-MBP (rat polyclonal) | AbD Serotec | Cat# MCA409S; RRID: AB_325004 | IF (1:500) |
| Antibody | anti-CC1 (rabbit polyclonal) | Oasis Biofarm | Cat# OB-PRB070; RRID: AB_2934254 | IF (1:500) |
| Antibody | anti-CC1 (mouse polyclonal) | Millipore | Cat# OP80; RRID: AB_2057371 | IF (1:300) |
| Antibody | anti-ASPA (rat polyclonal) | Oasis Biofarm | Cat# OB-PRT005; RRID: AB_2938679 | IF (1:200) |
| Antibody | anti-Sox9 (rabbit polyclonal) | Chemicon | Cat# AB5535; RRID: AB_2239761 | IF (1:2000) |
| Antibody | anti-NeuN (mouse monoclonal) | Millipore | Cat# MAB377; RRID: AB_2298772 | IF (1:500) |
| Sequence-based reagent | Opalin-F | This paper | PCR primers | GGCCTATGTTTGATTTCCAGCACTG |
| Sequence-based reagent | Opalin-R | This paper | PCR primers | AGCACTTATGACTGCTGAGCCGTTC |
| Chemical compound, drug | Tail lysis buffer | Viagen | Cat# 102-T | |
| Chemical compound, drug | Proteinase K | Beyotime | Cat# ST535 | |
| Chemical compound, drug | Sodium pentobarbital | Sigma-Aldrich | Cat# P3761 | |
| Chemical compound, drug | Normal Donkey Serum | Abcam | Cat# ab7475 | |
| Chemical compound, drug | Triton X-100 | Sigma-Aldrich | Cat# X100PC | |
| Chemical compound, drug | Citrate buffer | Oasis-Biofarm | Cat# BR-AB001 | |
| Other | Aqua-mount | Southern Biotech | Cat# 0100-01 | |
| Other | DAPI stain | Invitrogen | Cat# D1306 | (10 mg/ml) |
| Software, algorithm | ImageJ | National Institutes of Health | RRID: SCR_003070 | |
| Software, algorithm | QuPath | Queen’s University Belfast | RRID: SCR_018257 | |
| Software, algorithm | Adobe Photoshop | Adobe Systems | RRID: SCR_014199 | |
| Software, algorithm | GraphPad Prism v8.0.1 | GraphPad Software | RRID: SCR_002798 |
Additional files
Download links
A two-part list of links to download the article, or parts of the article, in various formats.
Downloads (link to download the article as PDF)
Open citations (links to open the citations from this article in various online reference manager services)
Cite this article (links to download the citations from this article in formats compatible with various reference manager tools)
Embryonic origins of forebrain oligodendrocytes revisited by combinatorial genetic fate mapping
eLife 13:RP95406.
https://doi.org/10.7554/eLife.95406.3


