Changes in local mineral homeostasis facilitate the formation of benign and malignant testicular microcalcifications
- Division of Translational Endocrinology, Department of Endocrinology and Internal Medicine, University Hospital Copenhagen, Herlev-Gentofte, Denmark
- Novo Nordisk Foundation Center for Basic Metabolic Research, University of Copenhagen, Denmark
- Department of Growth and Reproduction, Rigshospitalet, University of Copenhagen, Denmark
- Division of Bone and Mineral Research, Harvard School of Dental Medicine/Harvard Medical School, Harvard University, United States
- School of Biodiversity, One Health & Veterinary Medicine, University of Glasgow, United Kingdom
- Centre for Stem Cell Biology, Department of Biomedical Science, University of Sheffield, Western Bank, United Kingdom
- Department of Pathology, Rigshospitalet, Denmark
- MRC Centre for Reproductive Health, University of Edinburgh, The Queen’s Medical Research Institute, United Kingdom
- Department of Urology, Dalhousie University, Canada
- Department of Clinical Medicine, Copenhagen University Hospital, Denmark
Figures
Figure 1 with 1 supplement
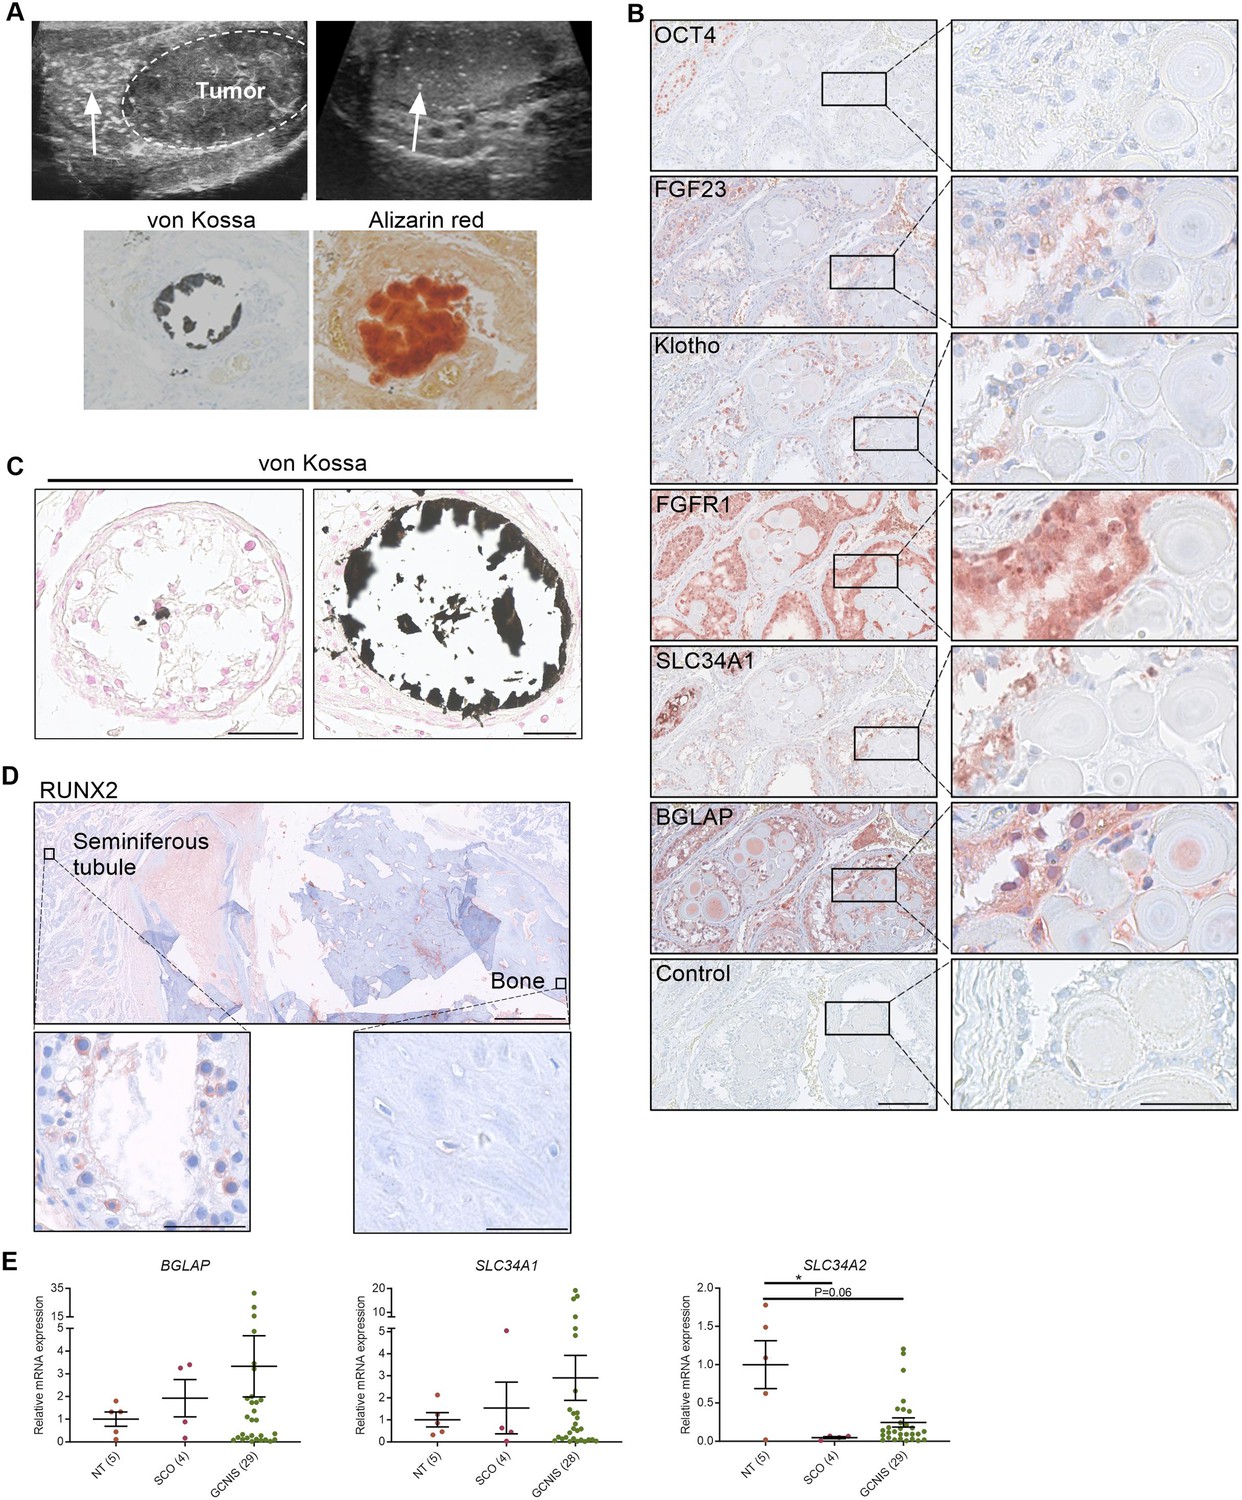
Deposition of hydroxyapatite is linked with the induction of bone markers and changes in the expression of phosphate transporters.
(A) Ultrasonic detection of testicular microlithiasis adjacent to a tumor (left) or in an otherwise healthy testis (right). Arrows indicate testicular microlithiasis. Staining of calcifications by von Kossa and alizarin red in human testis. (B) IHC staining of proteins potentially involved in the formation of testicular microcalcifications adjacent to microcalcifications in human testis. OCT4: marker of germ cell neoplasia in situ (GCNIS) cells. Control: without primary antibody. Scale bars correspond to 125 µm (left) and 25 µm (right). (C) Mild (left) and moderate (right) microcalcifications in human testis stained with von Kossa. Scale bars correspond to 50 µm. (D) Severe bone formation in testis from a man with no known history of local trauma or other predisposing factors of ectopic ossification. IHC staining with RUNX2. Scale bars correspond to 1.25 mm (upper), 50 µm (lower left), and 100 µm (lower right). (E) Expression levels of the bone marker (BGLAP) and phosphate transporters (SLC34A1 and SLC34A2) in NT (normal testis), SCO (Sertoli-cell-only) pattern, and GCNIS. Data are presented as mean ± SEM. *p<0.05. ANOVA on log-transformed data was used as the statistical test.
-
Figure 1—source data 1
Numerical data used to generate the figure.
- https://cdn.elifesciences.org/articles/95545/elife-95545-fig1-data1-v1.xlsx
Figure 1—figure supplement 1
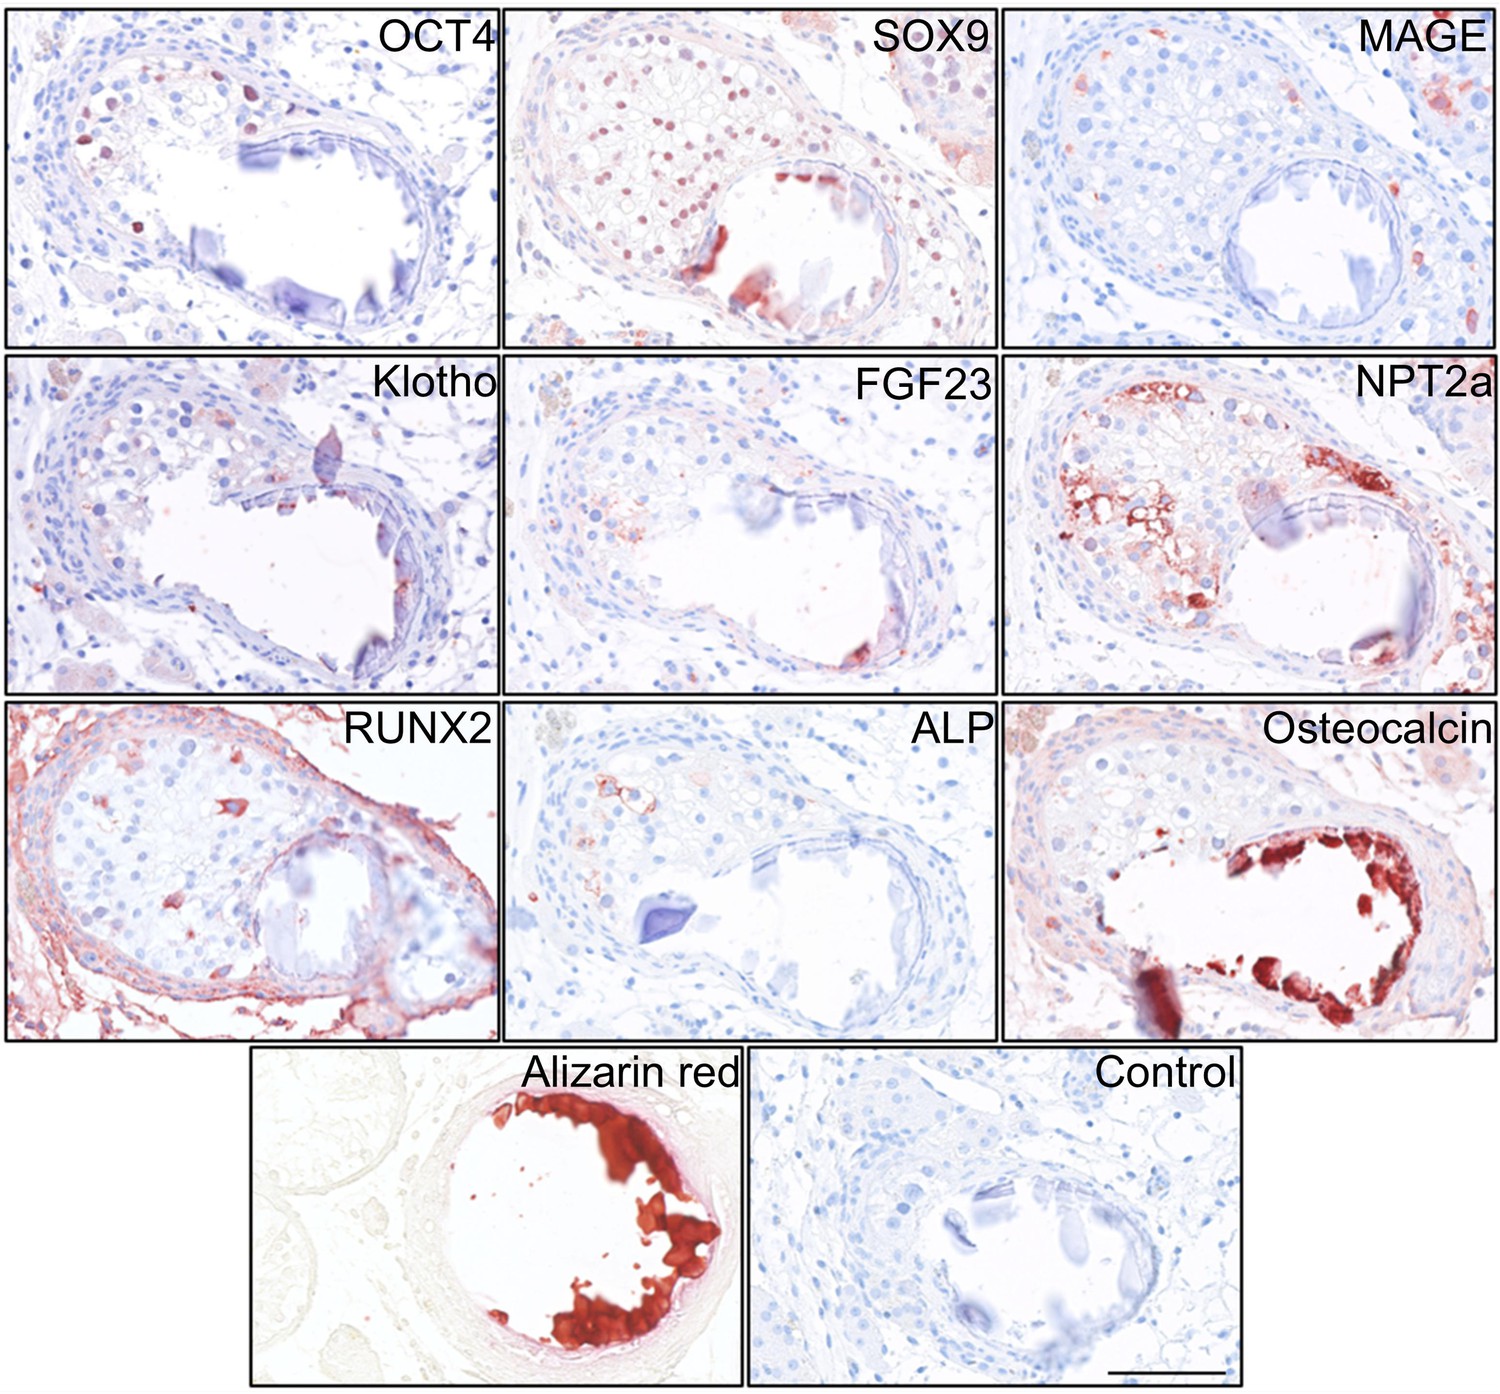
Deposition of hydroxyapatite and bone markers.
IHC staining of proteins potentially involved in the formation of testicular microcalcifications adjacent to microcalcifications in human testis. Scale bar corresponds to 100 µm.
Figure 2
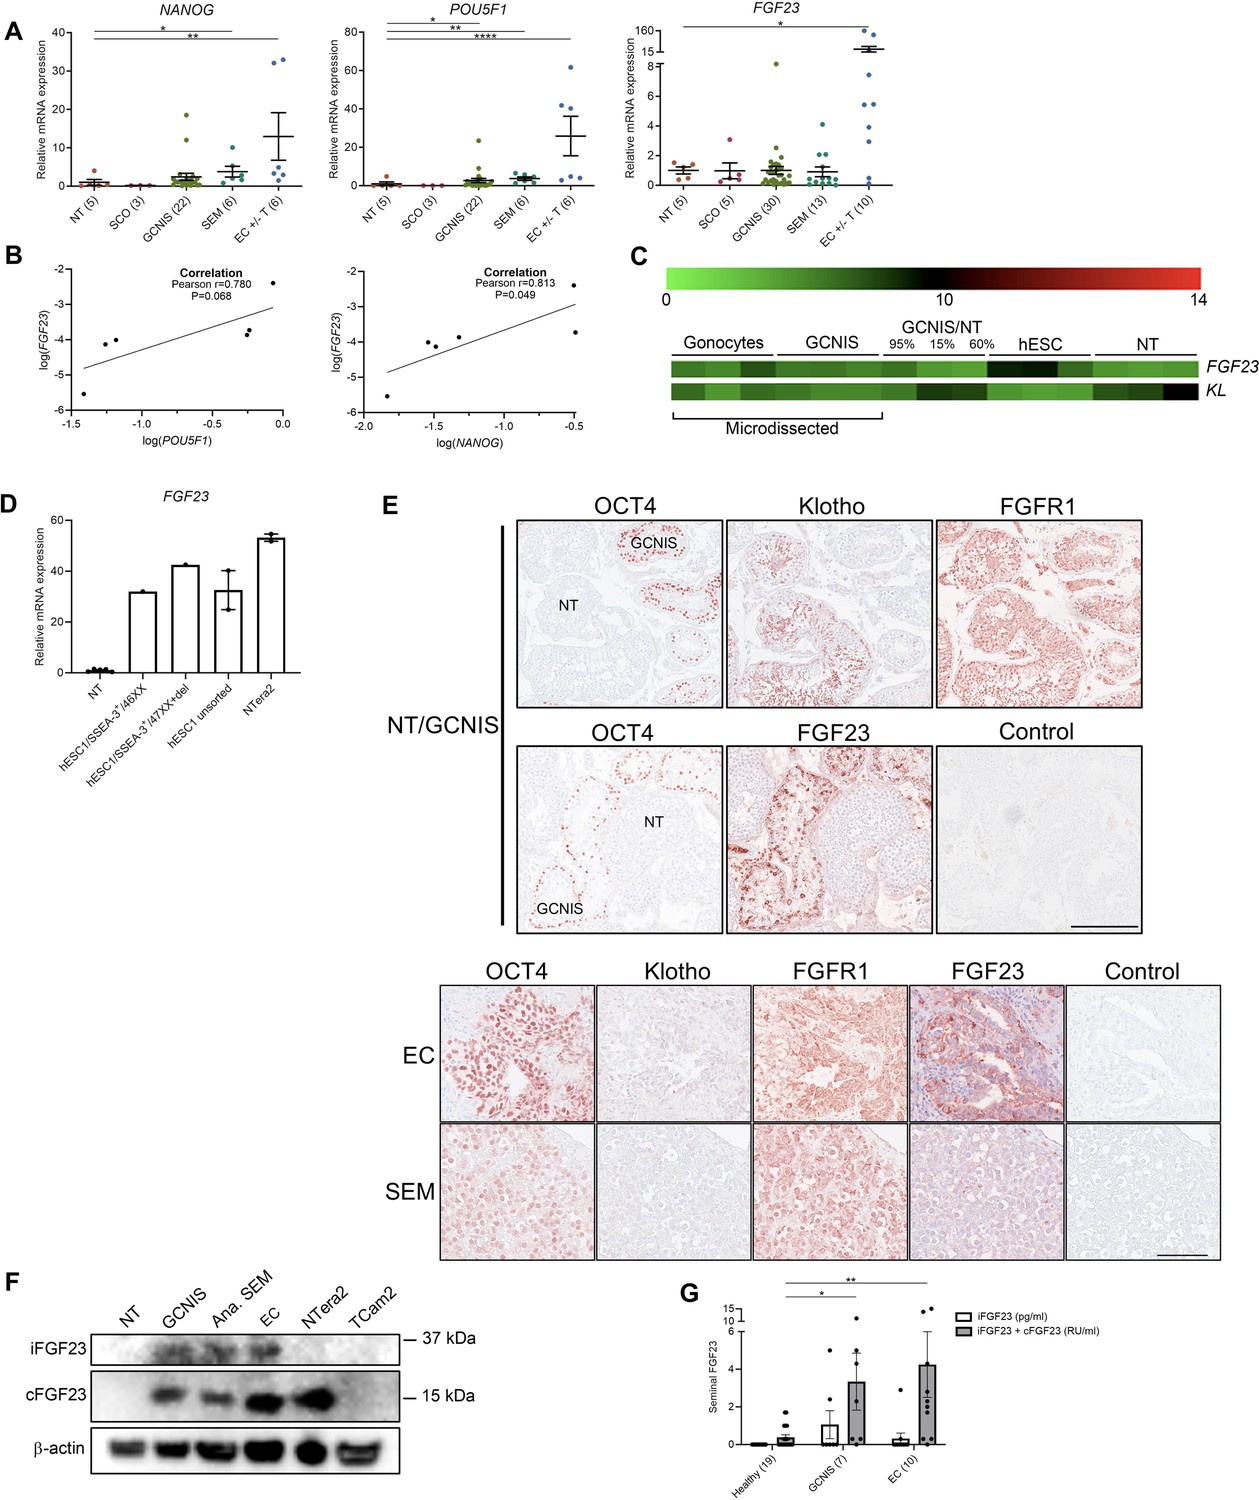
Ectopic expression of FGF23 in human testicular germ cell tumors and embryonic stem cells.
(A) Expression levels of the pluripotency factors NANOG, POU5F1, and FGF23 in normal testis (NT), Sertoli-cell-only (SCO) pattern, germ cell neoplasia in situ (GCNIS), seminoma (SEM), and EC +/- teratoma (T). ANOVA with Dunnett’s multiple comparisons test on log-transformed data was used as the statistical test. (B) Correlations between gene expression of FGF23 and POU5F1 or NANOG in EC +/- T were tested with Pearson correlation tests. (C) Microarray showing expression levels of FGF23 and KL in microdissected fetal gonocytes and GCNIS compared with testicular tissue samples with varying percentages of GCNIS, hESC, and NT. (D) Expression level of FGF23 in NT, hESC, and NTera2 cells (n=1–5). (E) IHC staining of GCNIS with adjacent NT, EC, and SEM. Scale bars correspond to 250 µm (upper panels) and 100 µm (lower panels). (F) Western blot of iFGF23 and cFGF23 in NT, GCNIS, anaplastic SEM, EC, NTera2 cells, and TCam2 cells. (G) Levels of seminal iFGF23 or total FGF23 (iFGF23+cFGF23) in healthy men or men with GCNIS or EC. Parentheses on the x-axis indicate sample size. Kruskal-Wallis test was used as the statistical test. Data are presented as mean ± SEM. *p<0.05, **p<0.01, ****p<0.0001.
-
Figure 2—source data 1
Numerical data used to generate the figure.
- https://cdn.elifesciences.org/articles/95545/elife-95545-fig2-data1-v1.xlsx
-
Figure 2—source data 2
Original files for western blot analysis displayed in Figure 2F.
- https://cdn.elifesciences.org/articles/95545/elife-95545-fig2-data2-v1.zip
-
Figure 2—source data 3
Original western blots for Figure 2F, indicating the relevant bands.
- https://cdn.elifesciences.org/articles/95545/elife-95545-fig2-data3-v1.zip
Figure 3
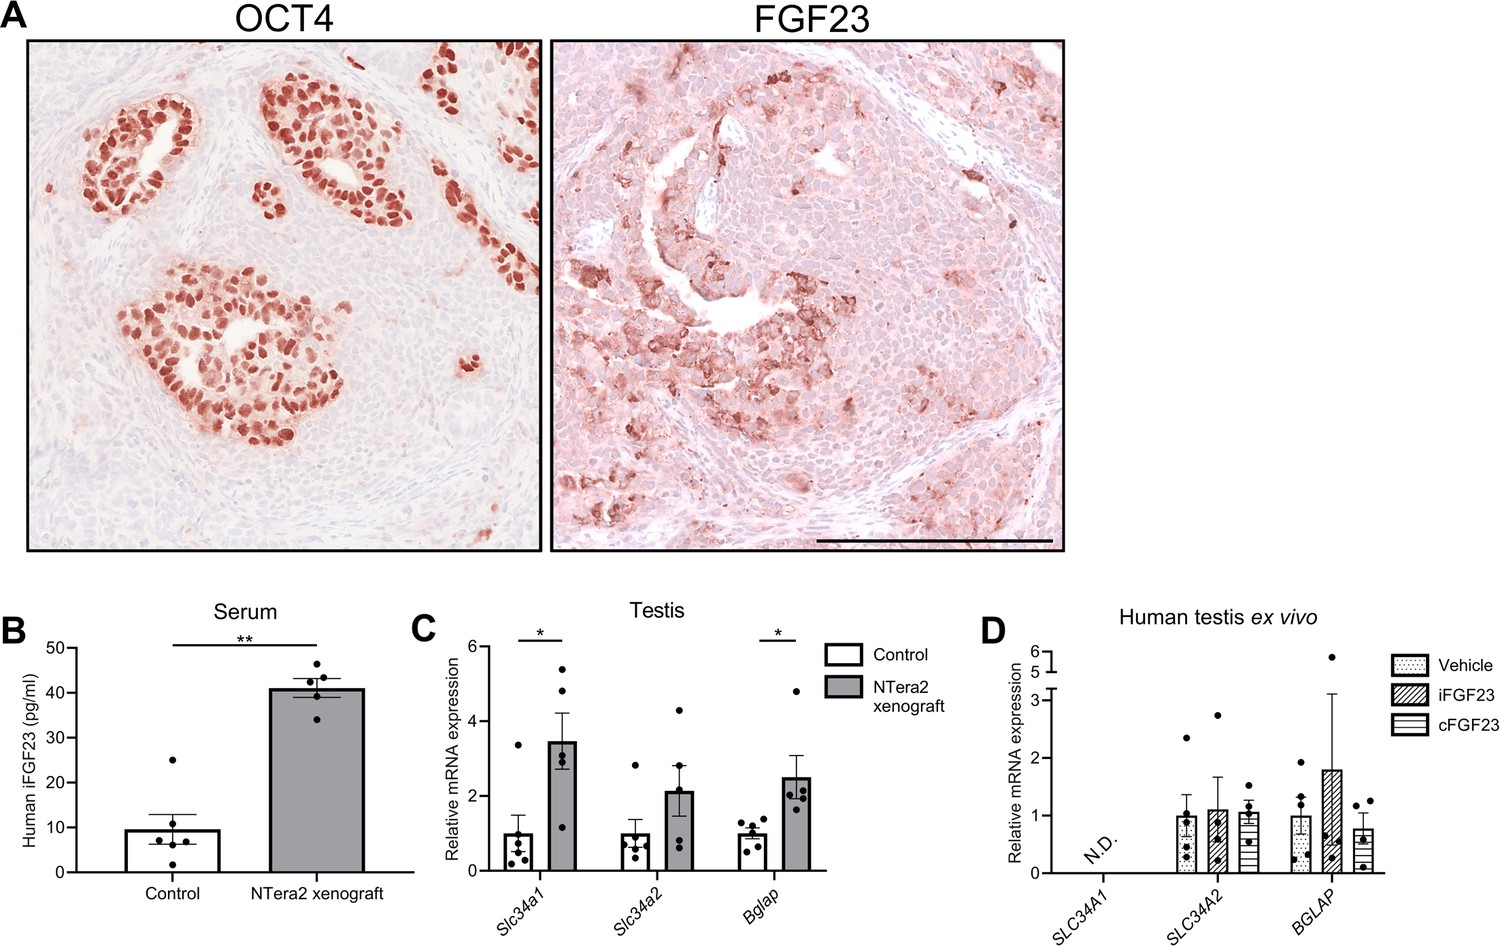
Change in expression of phosphate transporters and a bone marker in testis of FGF23-producing NTera2 cell tumors in xenografted mice.
(A) OCT4 and FGF23 expression in the tumor on the flank of the nude mice. The scale bar corresponds to 250 µm. (B) Serum levels of human iFGF23 in control or NTera2 cell inoculated nude mice (n=5–6). A two-sided Student’s t-test was used as the statistical test. (C) Expression level of the phosphate transporters Slc34a1 and Slc34a2 and the bone marker Bglap in testis of control or NTera2 cell xenografted nude mice (n=5–6). Two-sided Student’s t-tests with Holm-Šídák correction were used as the statistical tests. (D) Effects of iFGF23 (50 ng/ml) or cFGF23 (200 ng/ml) after 24 hr in human ex vivo cultures of testis tissue without germ cell neoplasia in situ (GCNIS). ANOVAs with Dunnett’s multiple comparisons test on log-transformed data were used as the statistical tests. Data are presented as mean ± SEM. *p<0.05, **p<0.01.
-
Figure 3—source data 1
Numerical data used to generate the figure.
- https://cdn.elifesciences.org/articles/95545/elife-95545-fig3-data1-v1.xlsx
Figure 4
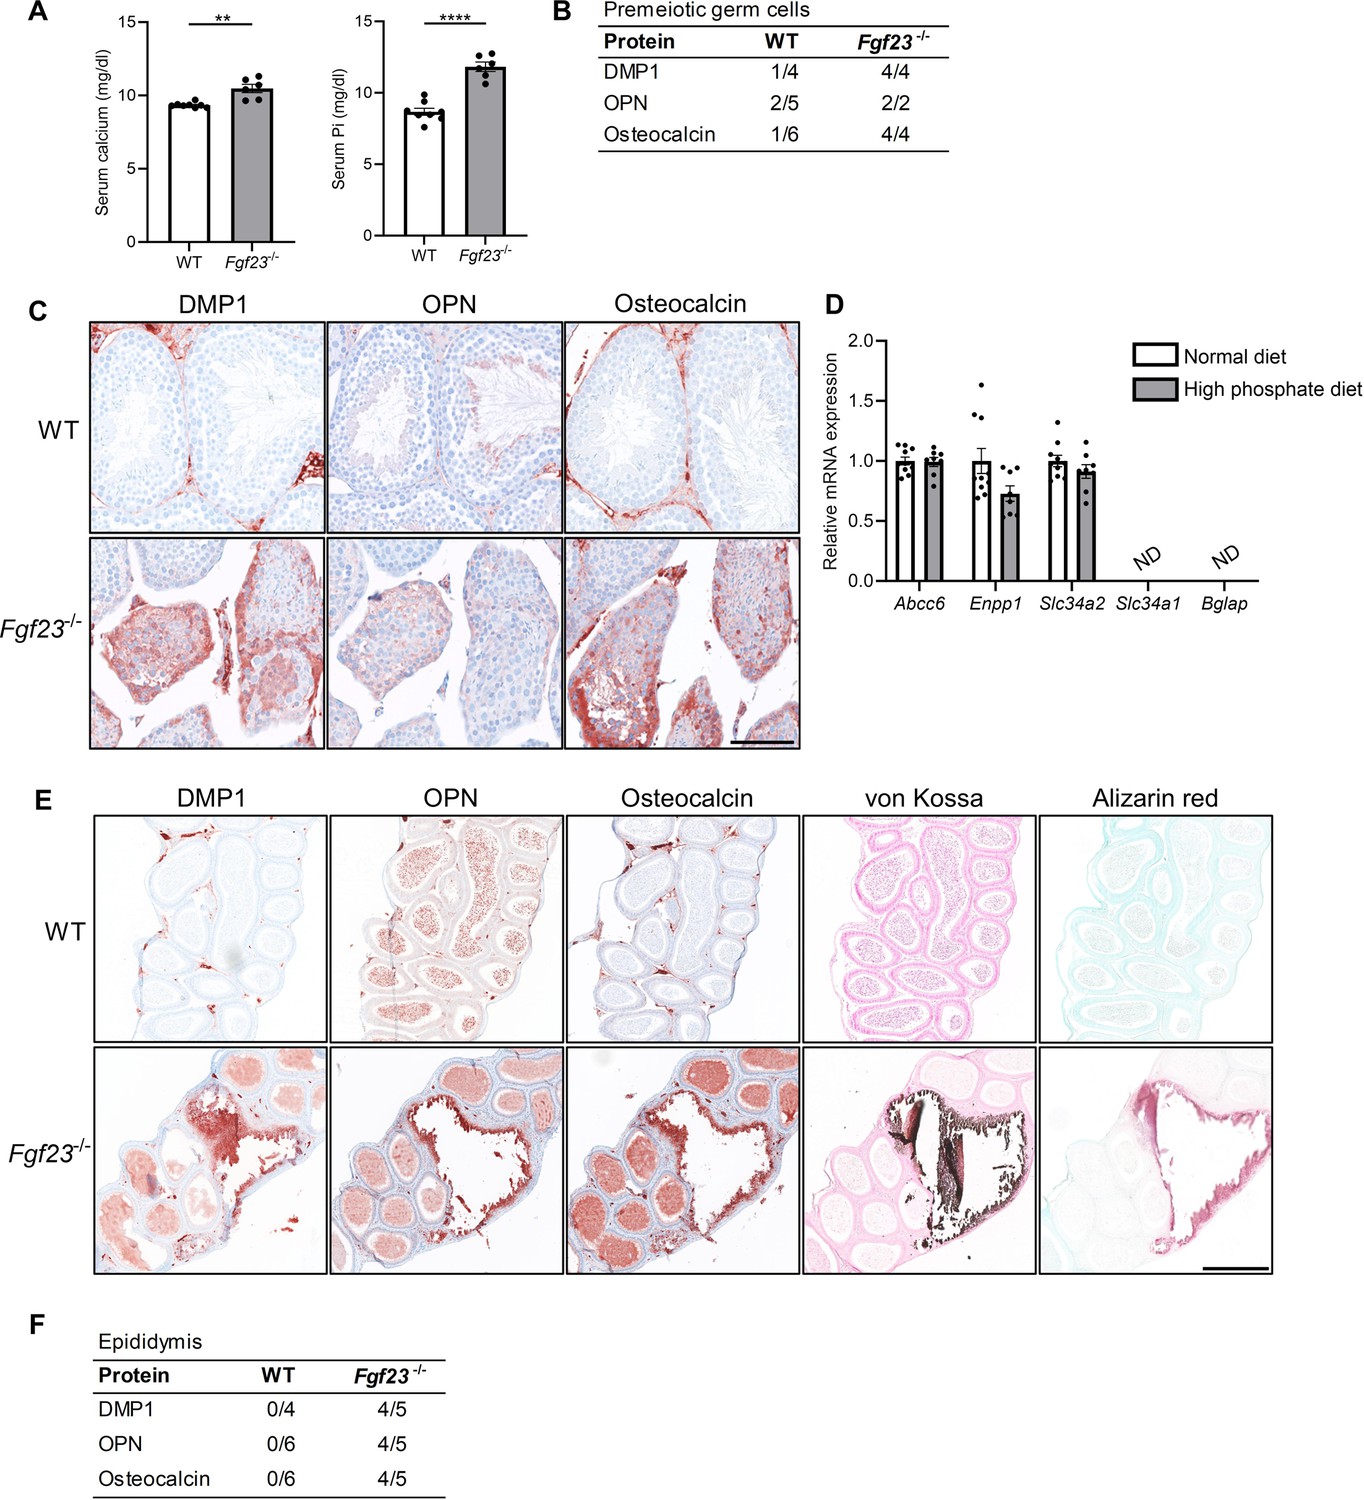
Mineralization in reproductive organs of Fgf23 knockout mice.
(A) Serum levels of calcium and inorganic phosphate (Pi) in wild-type (WT) and Fgf23-/- mice. Mann-Whitney (serum calcium) or two-sided Student’s t-test (serum Pi) were used as the statistical tests. (B) Table of bone marker expression observed in premeiotic germ cells in WT and Fgf23-/- mice. (C) IHC staining of bone markers and vitamin D processing enzymes in WT and Fgf23-/- mice. Scale bar corresponds to 100 µm. (D) Expression level of the calcification regulators Abcc6 and Enpp1, the phosphate transporters Slc34a2 and Slc34a1, and the bone marker Bglap in testis of mice that received normal or high phosphate diet (n=8–10). Two-sided Student’s t-tests with Holm-Šídák correction were used as the statistical tests. (E) IHC staining of bone markers and staining of minerals with von Kossa and alizarin red in epididymis of WT and Fgf23-/- mice. The scale bar corresponds to 250 µm. (F) Table of bone marker expression observed in the epididymis of WT and Fgf23-/- mice. Data are presented as mean ± SEM. **p<0.01 and ****p<0.0001.
-
Figure 4—source data 1
Numerical data used to generate the figure.
- https://cdn.elifesciences.org/articles/95545/elife-95545-fig4-data1-v1.xlsx
Figure 5
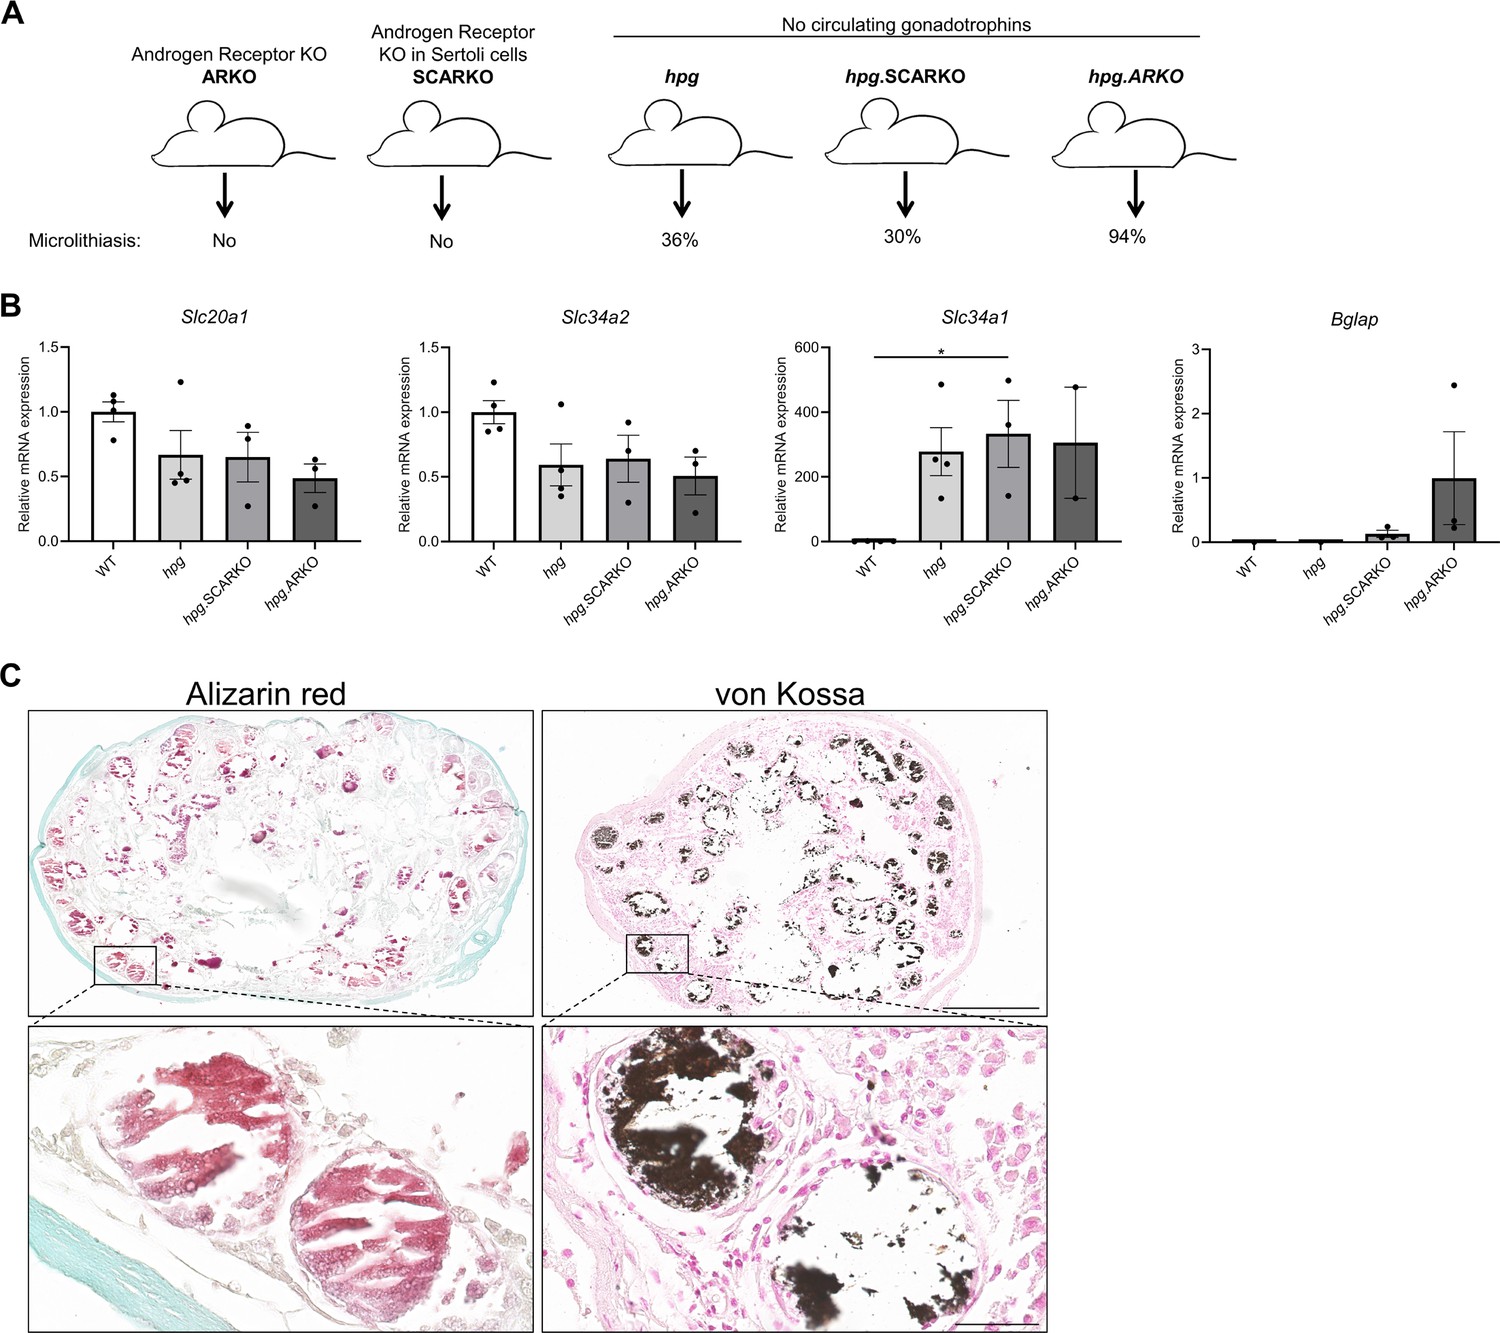
Testicular microcalcifications in hypogonadal and Sertoli cells-ablated mice.
(A) Schematic representation of the prevalence of microlithiasis in ARKO, SCARKO, hpg, hpg.SCARKO, and hpg.ARKO mice models. (B) Expression levels of Slc20a1, Slc34a2, Slc34a1, and Bglap in testis of hpg, hpg.SCARKO, and hpg.ARKO mice models (n=2–4). Data are presented as mean ± SEM. *p<0.05. ANOVAs with Dunnett’s multiple comparisons test were used as the statistical tests. (C) Microcalcifications in Sertoli cell-ablated mice. Mineral staining with alizarin red or von Kossa. Scale bars correspond to 500 µm (upper pictures) and 50 µm (lower pictures).
-
Figure 5—source data 1
Numerical data used to generate the figure.
- https://cdn.elifesciences.org/articles/95545/elife-95545-fig5-data1-v1.xlsx
Figure 6
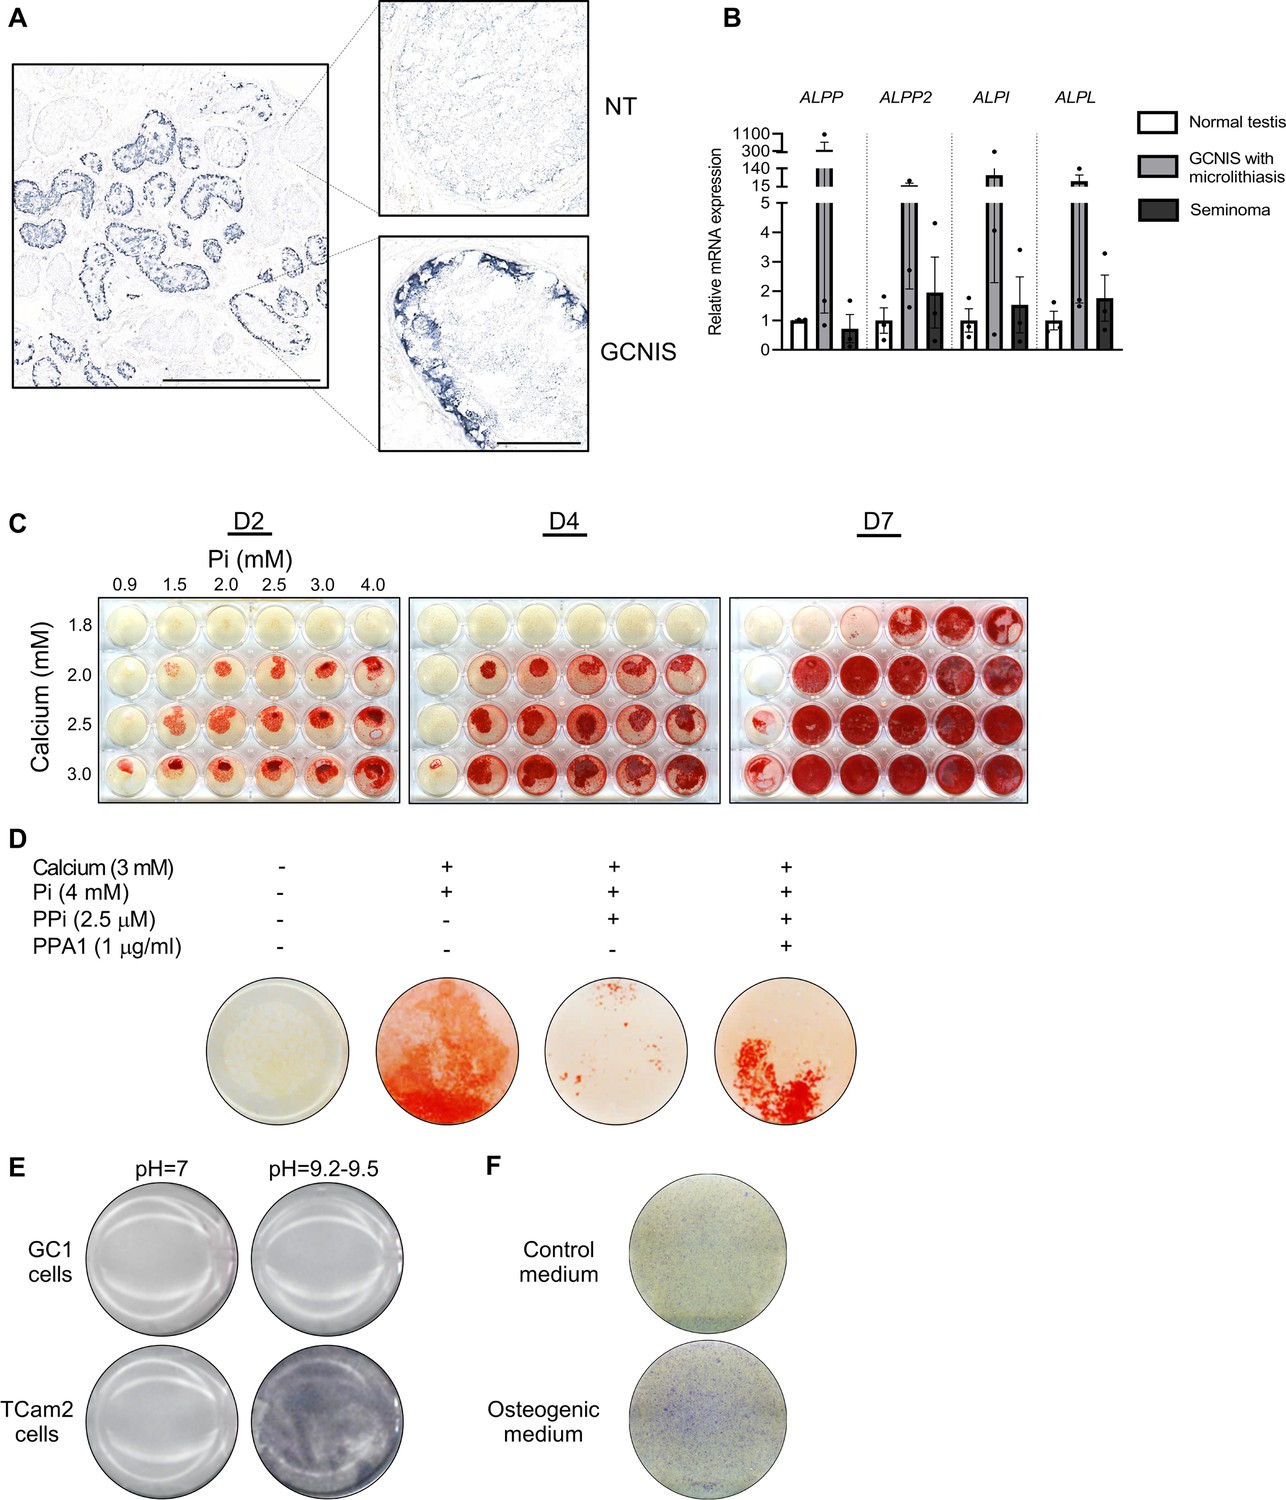
Alkaline phosphatase activity in normal testis and germ cell neoplasia in situ (GCNIS) and calcium and phosphate induced mineralization in vitro.
(A) Staining of alkaline phosphatase activity with BCIP/NBT in normal testis (NT) with adjacent tubules containing GCNIS. Scale bars correspond to 1 mm (left picture) and 100 µm (right pictures). (B) Expression levels of the four alkaline phosphatases in normal testis, GCNIS with microlithiasis, and seminoma. ANOVAs with Dunnett’s multiple comparisons test were used as the statistical tests. (C) Mineralization stained with alizarin red in GC1 cells treated with increasing concentrations of calcium and inorganic phosphate (Pi) for 2, 4, or 7 days. (D) Mineralization stained with alizarin red in GC1 cells with calcium and/or phosphate in the presence of the mineralization inhibitor pyrophosphate (PPi) and/or pyrophosphatase (PPA1) that catalyzes the hydrolysis of PPi to Pi for 4 days. (E) Staining of alkaline phosphatase activity with BCIP/NBT in GC1 or TCam2 cells in pH=7 or pH=9.2–9.5. (F) Fast Blue RR staining of alkaline phosphatase activity in GC1 cells cultured in control or osteogenic medium for 14 days.
-
Figure 6—source data 1
Numerical data used to generate the figure.
- https://cdn.elifesciences.org/articles/95545/elife-95545-fig6-data1-v1.xlsx
Figure 7
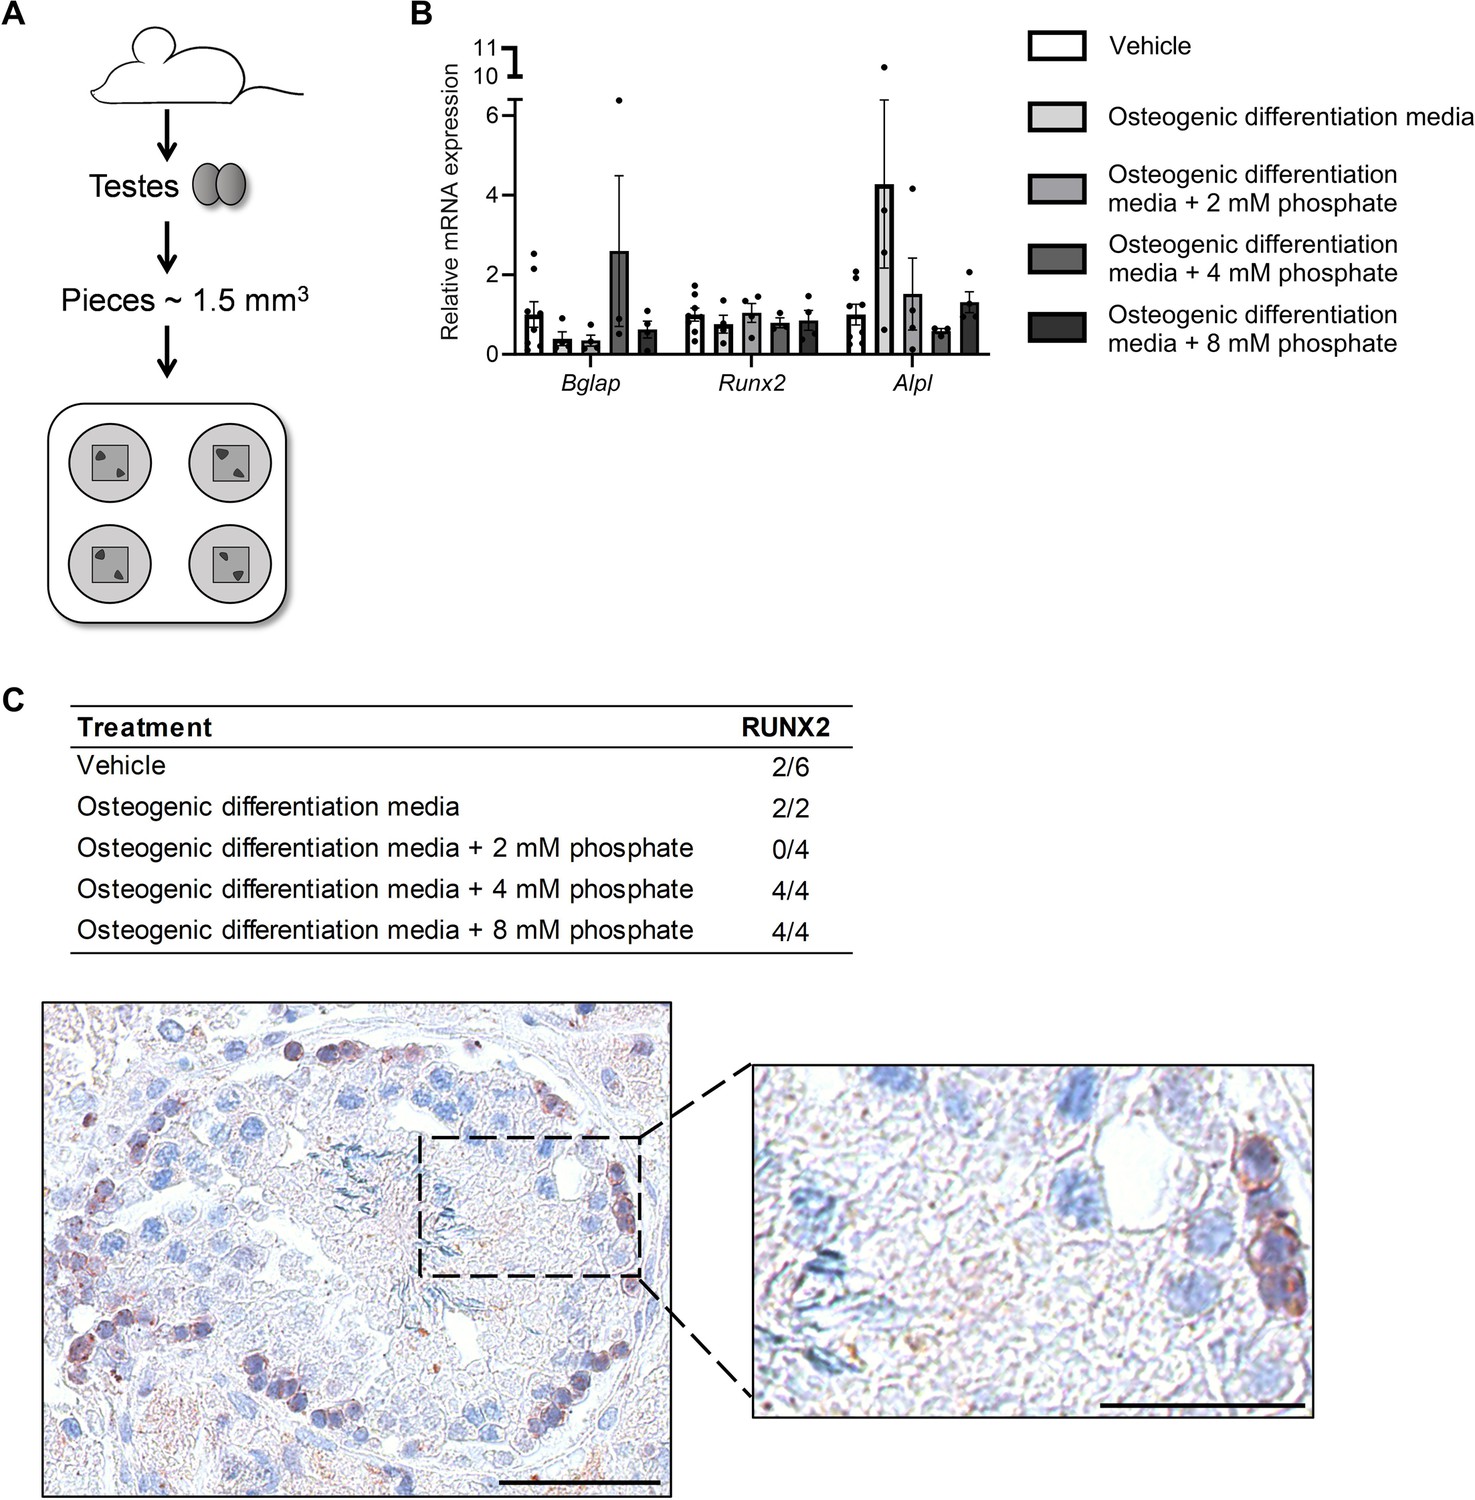
Ex vivo mouse testis culture in osteogenic differentiation media.
(A) Schematic representation of the mouse testis ex vivo model. (B) Expression levels of Bgalp, Runx2, and Alpl in ex vivo mouse testis tissue culture specimens treated with osteogenic medium -/+ phosphate. ANOVAs on log-transformed (Bglap and Alpl) or non-transformed data were used as the statistical tests. (C) Table of the prevalence of focal expression of RUNX2 in mouse testis ex vivo cultures with vehicle and osteogenic treatment for 14 days. Representative RUNX2 staining in the ex vivo culture treated with osteogenic media and 8 mM phosphate. Scale bars correspond to 50 µm (left picture) and 25 µm (right picture).
-
Figure 7—source data 1
Numerical data used to generate the figure.
- https://cdn.elifesciences.org/articles/95545/elife-95545-fig7-data1-v1.xlsx
Figure 8
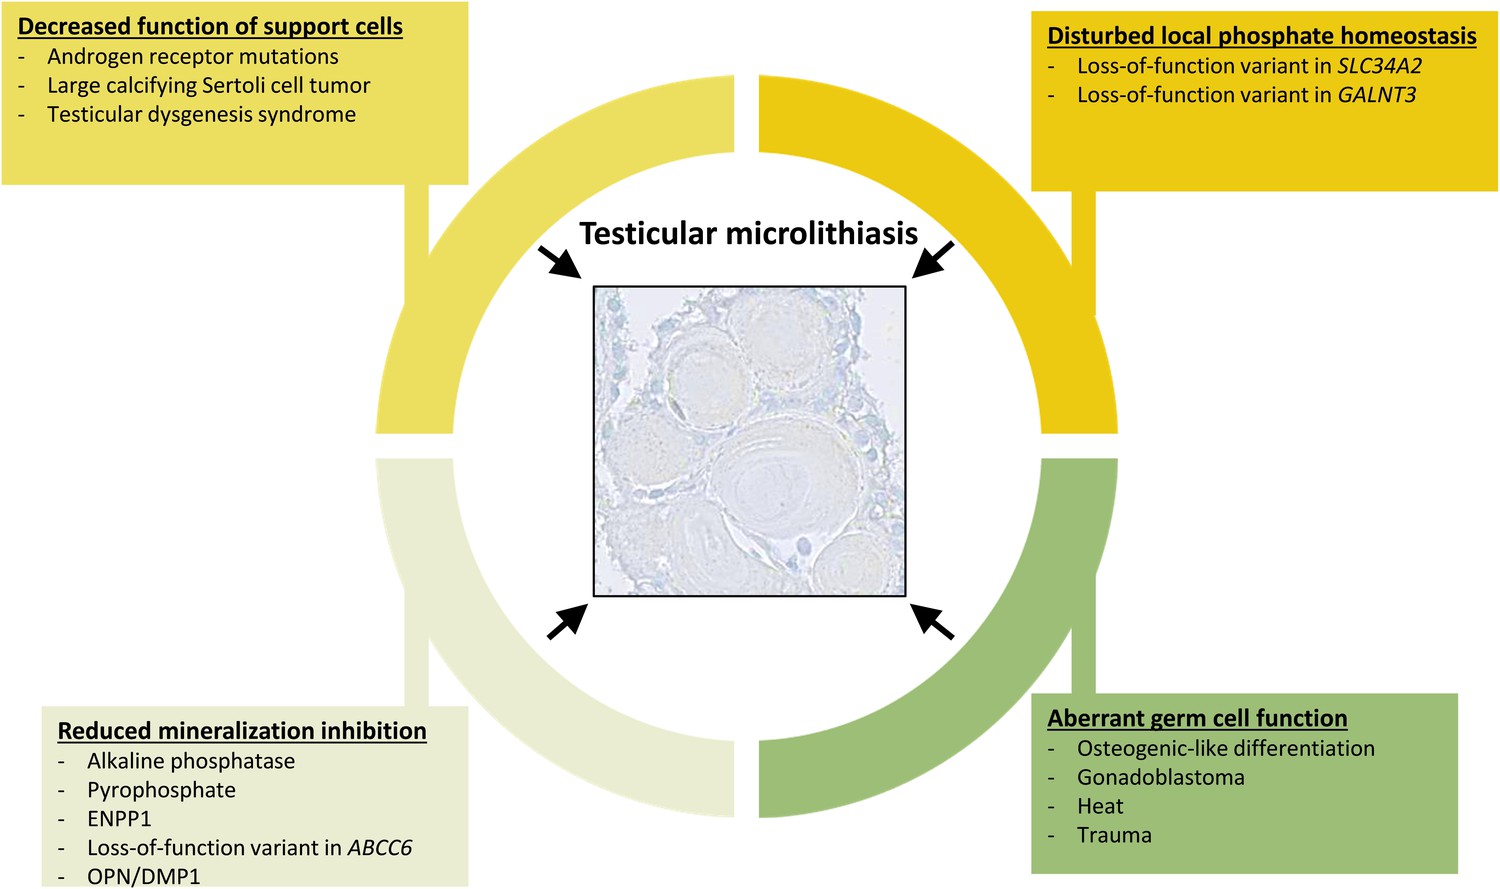
Overview of events that can contribute to the formation of testicular microlithiasis.
We suggest that the formation of testicular microcalcifications occurs as a consequence of one or more of the following events: decreased function of the Sertoli cells, disturbed local phosphate homeostasis, reduction of mineralization inhibitors, or aberrant germ cell function. These changes alone or in combination can drive osteogenic-like differentiation of germ cells resulting in intratubular deposition of microcalcifications consisting of hydroxyapatite.
Tables
Table 1
Immunohistochemical expression of selected proteins in human specimens.
| n | FGF23 | Klotho | FGFR1 | Osteocalcin | RUNX2 | OPN | |
|---|---|---|---|---|---|---|---|
| Normal testis | 7–15 | ++to +++ | ++to +++ | + | |||
| Germ cell carcinoma in situ | 6–18 | +++ | to +/- | ++to +++ | + | +++ | + |
| Hyalinized/calcified testis | 5–14 | to + | +/to + | ++ | +++ | +++ | +++ |
| Classical seminoma | 4–15 | to + | ++ | ||||
| Anaplastic seminoma | 2 | ++ | +/ | ++ | NA | NA | NA |
| Embryonal carcinoma | 4–13 | ++to +++ | to +/- | ++ | +/to ++ | +/to + | +/to + |
| Teratoma | 3–6 | to + | +/to ++ | ++ | +/to ++ | +/to + | +/to + |
| Fetal testis | 3 | to +/- | ++ | NA | NA | NA |
-
- Not expressed.
-
+/- Barely detectable in few cells.
-
+ Expressed in few cells.
-
++ Markedly expressed in some cells or expressed in most cells.
-
+++ High expression in most cells.
-
N.A. Not available.
Additional files
-
MDAR checklist
- https://cdn.elifesciences.org/articles/95545/elife-95545-mdarchecklist1-v1.pdf
-
Supplementary file 1
List of primary antibodies used for IHC staining.
- https://cdn.elifesciences.org/articles/95545/elife-95545-supp1-v1.docx
-
Supplementary file 2
List of primers used for quantitative RT-PCR (qRT-PCR).
- https://cdn.elifesciences.org/articles/95545/elife-95545-supp2-v1.docx
Download links
A two-part list of links to download the article, or parts of the article, in various formats.
Downloads (link to download the article as PDF)
Open citations (links to open the citations from this article in various online reference manager services)
Cite this article (links to download the citations from this article in formats compatible with various reference manager tools)
Changes in local mineral homeostasis facilitate the formation of benign and malignant testicular microcalcifications
eLife 13:RP95545.
https://doi.org/10.7554/eLife.95545.3


