Identification of nonsense-mediated decay inhibitors that alter the tumor immune landscape
- Ludwig Center for Cancer Genetics and Therapeutics, Johns Hopkins University School of Medicine, United States
- Cellular and Molecular Medicine Graduate Program, Johns Hopkins University School of Medicine, United States
- Department of Oncology, Johns Hopkins Medical Institutions, United States
- Sidney Kimmel Cancer Center, Johns Hopkins University School of Medicine, United States
- Howard Hughes Medical Institute, Johns Hopkins University School of Medicine, United States
- Sol Goldman Pancreatic Cancer Research Center, Johns Hopkins University School of Medicine, United States
- Department of Neurosurgery, Johns Hopkins University School of Medicine, United States
- Department of Molecular and Comparative Pathobiology, Johns Hopkins University School of Medicine, United States
Figures
Figure 1 with 8 supplements
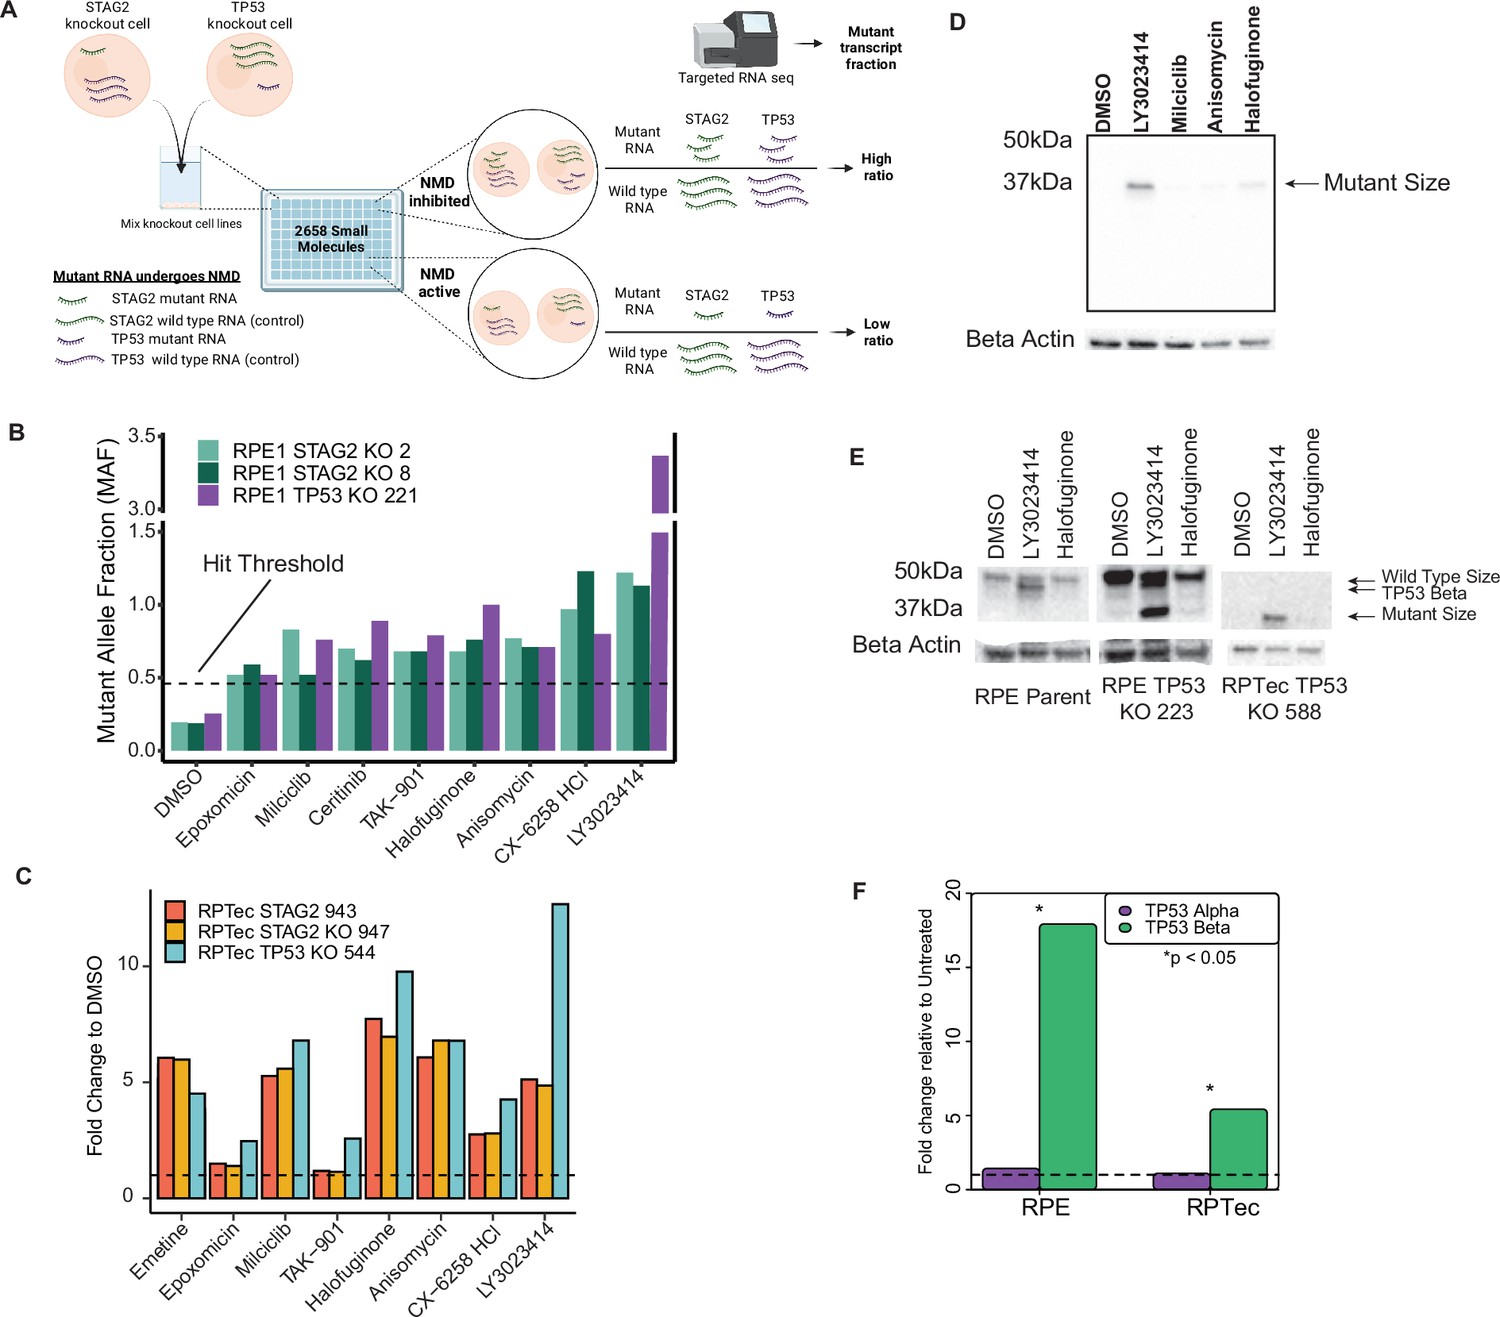
LY3023414 is a small molecule capable of increasing transcription of nonsense-mediated decay (NMD) targets.
(A) Schematic of high-throughput screen (HTS) used to identify inhibitors of NMD. Mutant transcripts are represented by a smaller length in the cartoon for illustrative purposes only. All small molecules were tested at 10 μM. (B) Mutant RNA reads relative to wild-type reads for the top 8 hits from the HTS. The dotted line represents the minimum fraction required to be considered a hit (>5 standard deviations above dimethyl sulfoxide [DMSO] control). Full screen results are presented in Figure 1—figure supplement 4. (C) Targeted RNA-sequencing results of isogenic RPTec knockout clones treated with the eight best hits from the HTS at 10 µM. The dotted line represents a relative RNA expression level of 1, equal to that of DMSO-treated wells. Data for ceritinib, which did not validate on any line, are presented only in Figure 1—figure supplement 8. (D) TP53 western blot on RPE TP53 224, containing a homozygous TP53 mutation, using the four hit compounds that validated in RPTec isogenic lines at 10 μM. (E) Western blot analysis of full-length TP53α and isoform TP53β after treatment with two NMD inhibitor lead candidates at 10 μM. TP53β (expression known to be controlled by NMD) as well as mutant TP53 are prominently induced by LY3023414 whereas full length is not. Note that RPE TP53 223 is a heterozygous knockout clone with one near wild-type allele whereas RPTec TP53 588 contains a homozygous TP53 indel mutation. (F) Quantitative real-time PCR (qPCR) showing 10 μM LY3023414 treatment causes increased expression of the NMD controlled alternative transcript for TP53, TP53β, in parent cell lines for RPE1 and RPTec. Significance determined by Student’s t-test. Unless indicated otherwise cells were exposed to test compound for 16 hr.
Figure 1—figure supplement 1
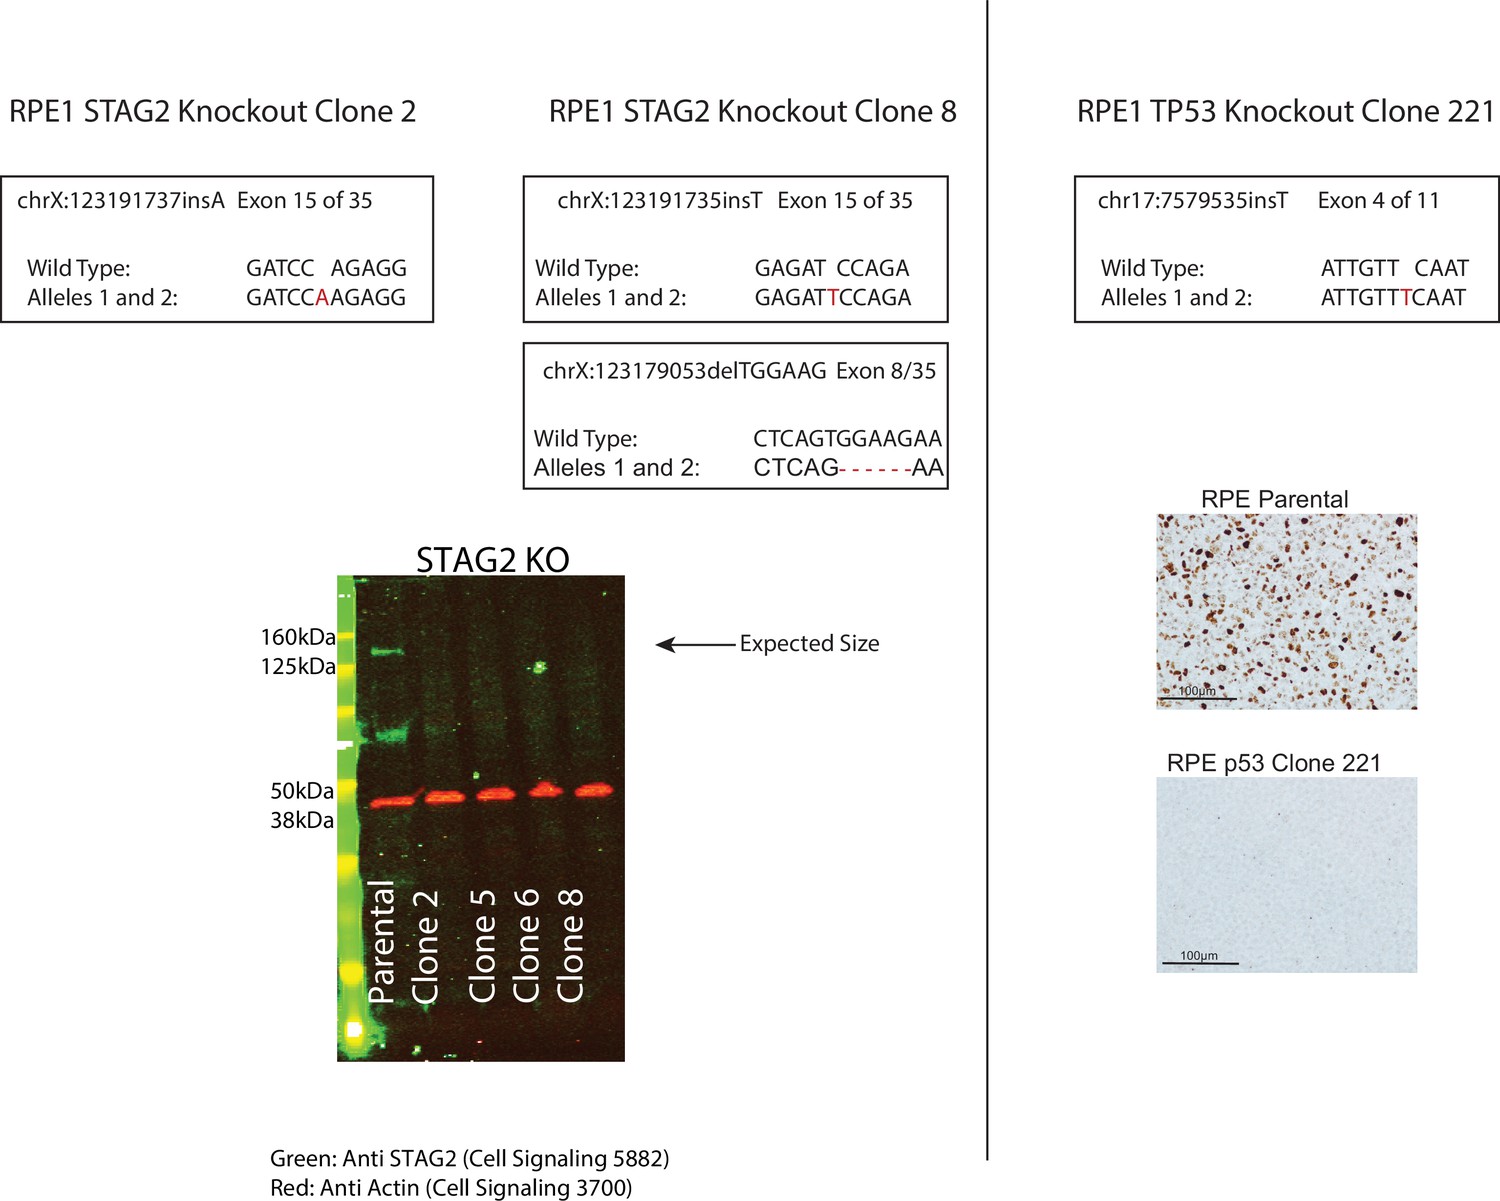
Next-generation sequencing results depicting genomic mutations at the CRISPR target area in STAG2 (top left) and TP53 (top right) isogenic cell line clones in the RPE1 cell line which were used in subsequent experiments.
Western blot showing STAG2 protein loss in four independent clones of which only clones 2 and 8 were used in subsequent experiments (bottom left). Note that STAG2 clone 8 has two independent biallelic indel events. The mutation in exon 15 was used for scoring relative transcript levels in the screen and for subsequent work. Immunohistochemistry (IHC) results confirming p53 protein loss in RPE TP53 221 (bottom right).
Figure 1—figure supplement 2
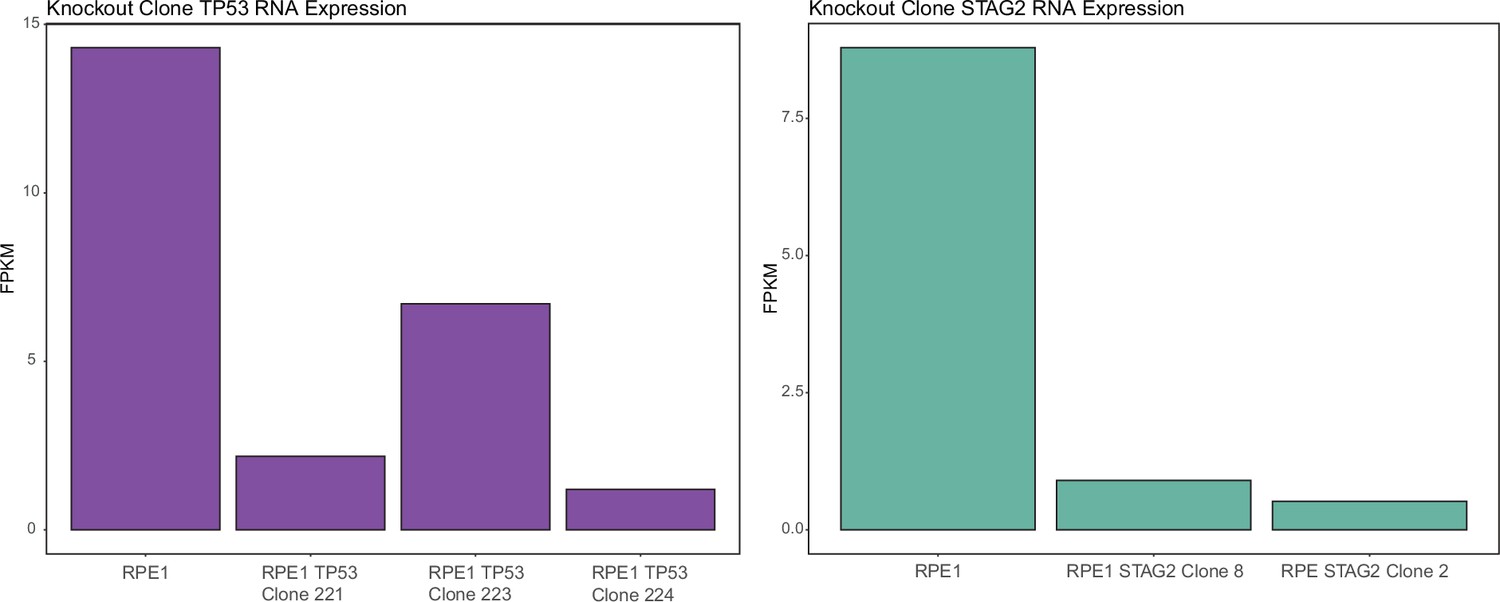
Fold change in RNA expression levels from whole transcriptome RNA-sequencing data for STAG2 and TP53 knockout clones in the RPE1 cell line background.
RPE1 TP53 clone 221, RPE1 STAG2 clone 2, and RPE1 STAG2 clone 8 were used in the high-throughput screen (HTS). RPE1 TP53 clone 223 and RPE1 TP53 clone 224 are used in Figure 1—figure supplement 6. Note clone 223 has a 9-bp in-frame deletion in one allele and an out-of-frame deletion on the other allele, presumably accounting for the higher level of expression.
Figure 1—figure supplement 3

RNA transcript level changes based on quantitative real-time PCR (qPCR) in STAG2 and TP53 knockout clones treated with the known nonsense-mediated decay (NMD) inhibitor emetine at 12 mg/ml.
Red arrows indicate the cell line containing the truncating mutation in the gene being assessed. Error bars show standard deviation of three biological replicates. All changes are statistically significant by Student’s t-test (p < 0.05).
Figure 1—figure supplement 4
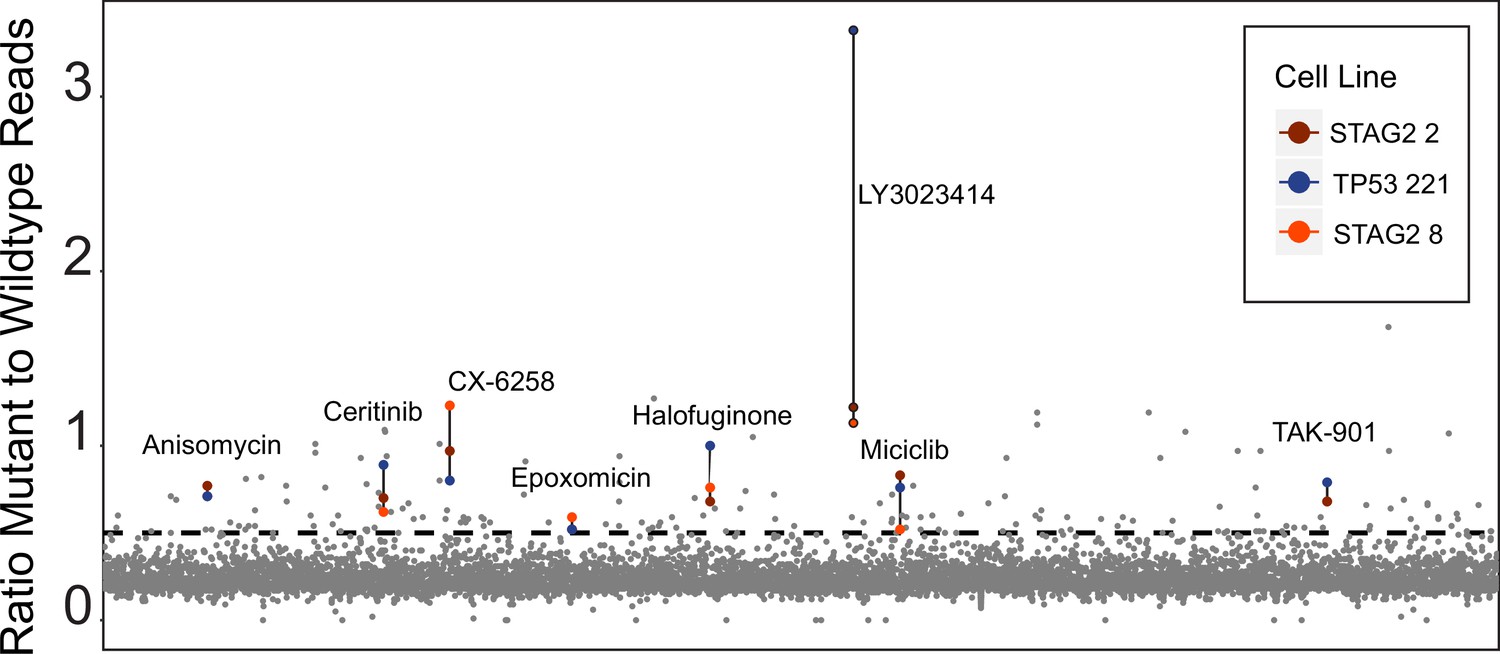
Primary screen results from high-throughput assay.
The x-axis represents all 2658 compounds screened at 10 µM, y-axis shows ratio of mutant to wild-type reads for each of the three isogenic cell lines. Higher values indicate more mutant RNA reads, representing inhibition of nonsense-mediated decay (NMD). The dotted line at 0.46 is the cutoff for a hit to be called (5 standard deviations above dimethyl sulfoxide [DMSO]-treated samples). Colored data points demarcate the eight hit compounds in the three screened cell lines.
Figure 1—figure supplement 5
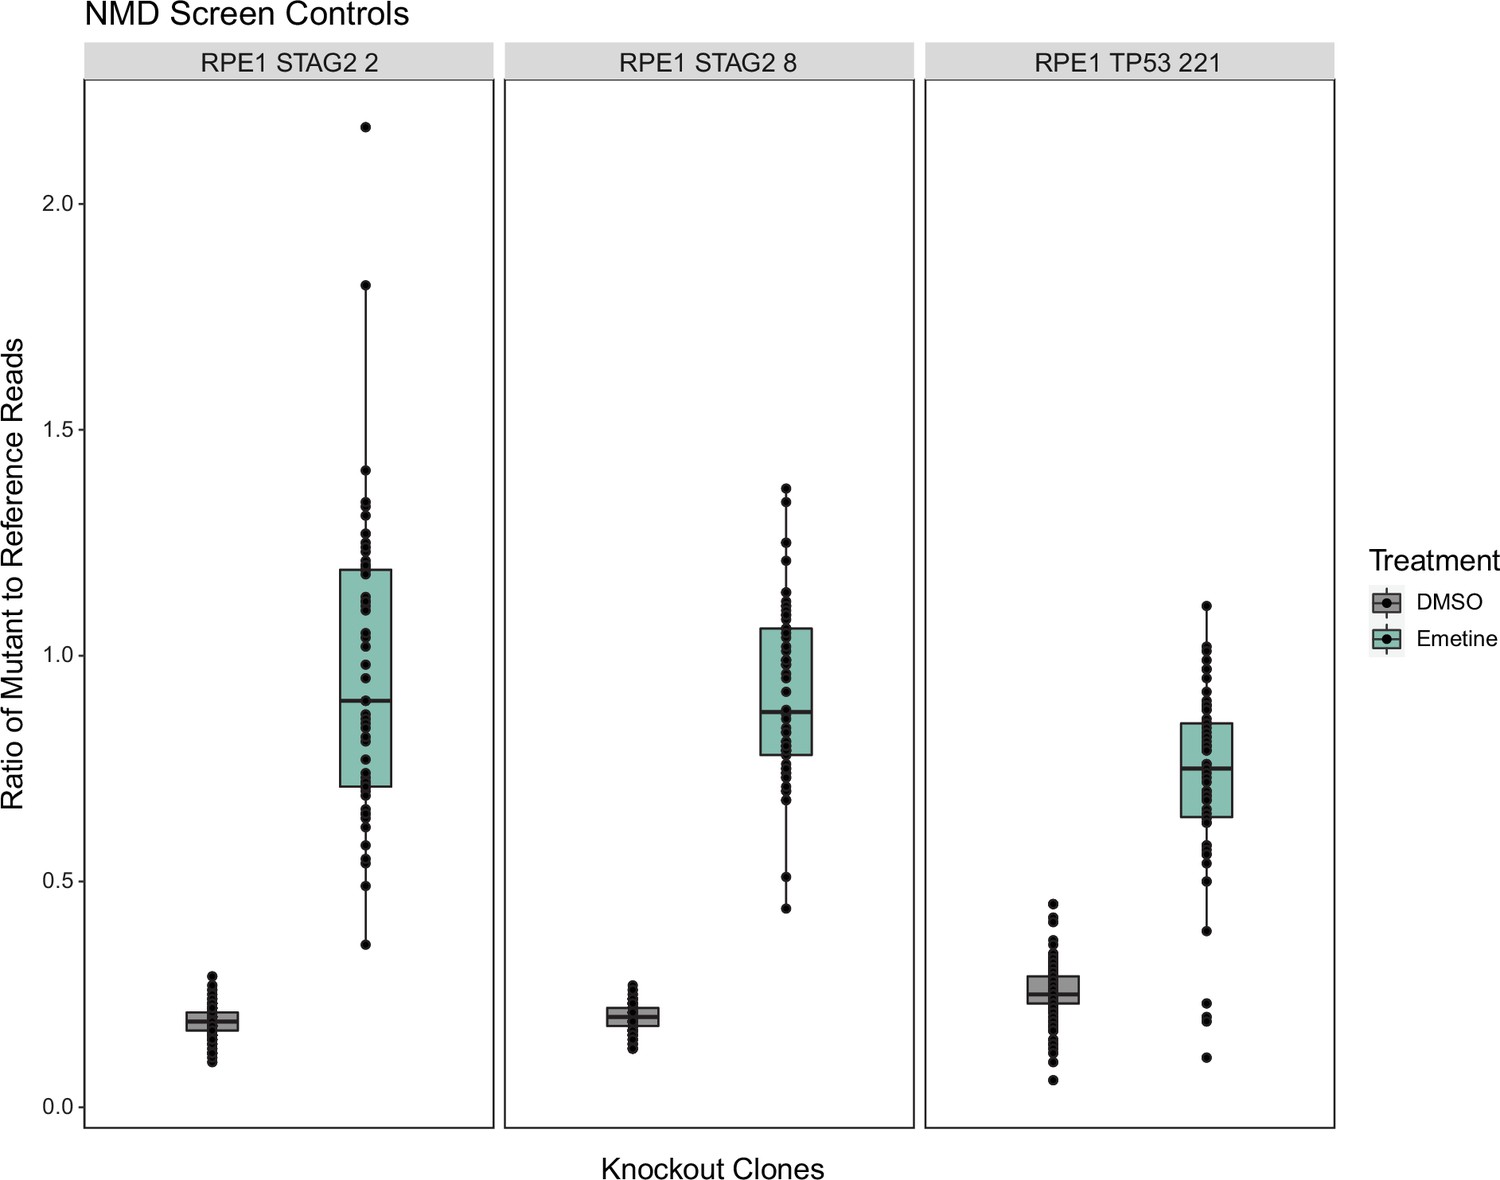
Emetine and dimethyl sulfoxide (DMSO) control sample data from the high-throughput screen (HTS) for each of the three clones used as measured by deep-targeted RNA-sequencing.
Six DMSO and two emetine (12 mg/ml) samples were included in each dosing plate for a total of 198 DMSO and 66 emetine measurements in each boxplot.
Figure 1—figure supplement 6
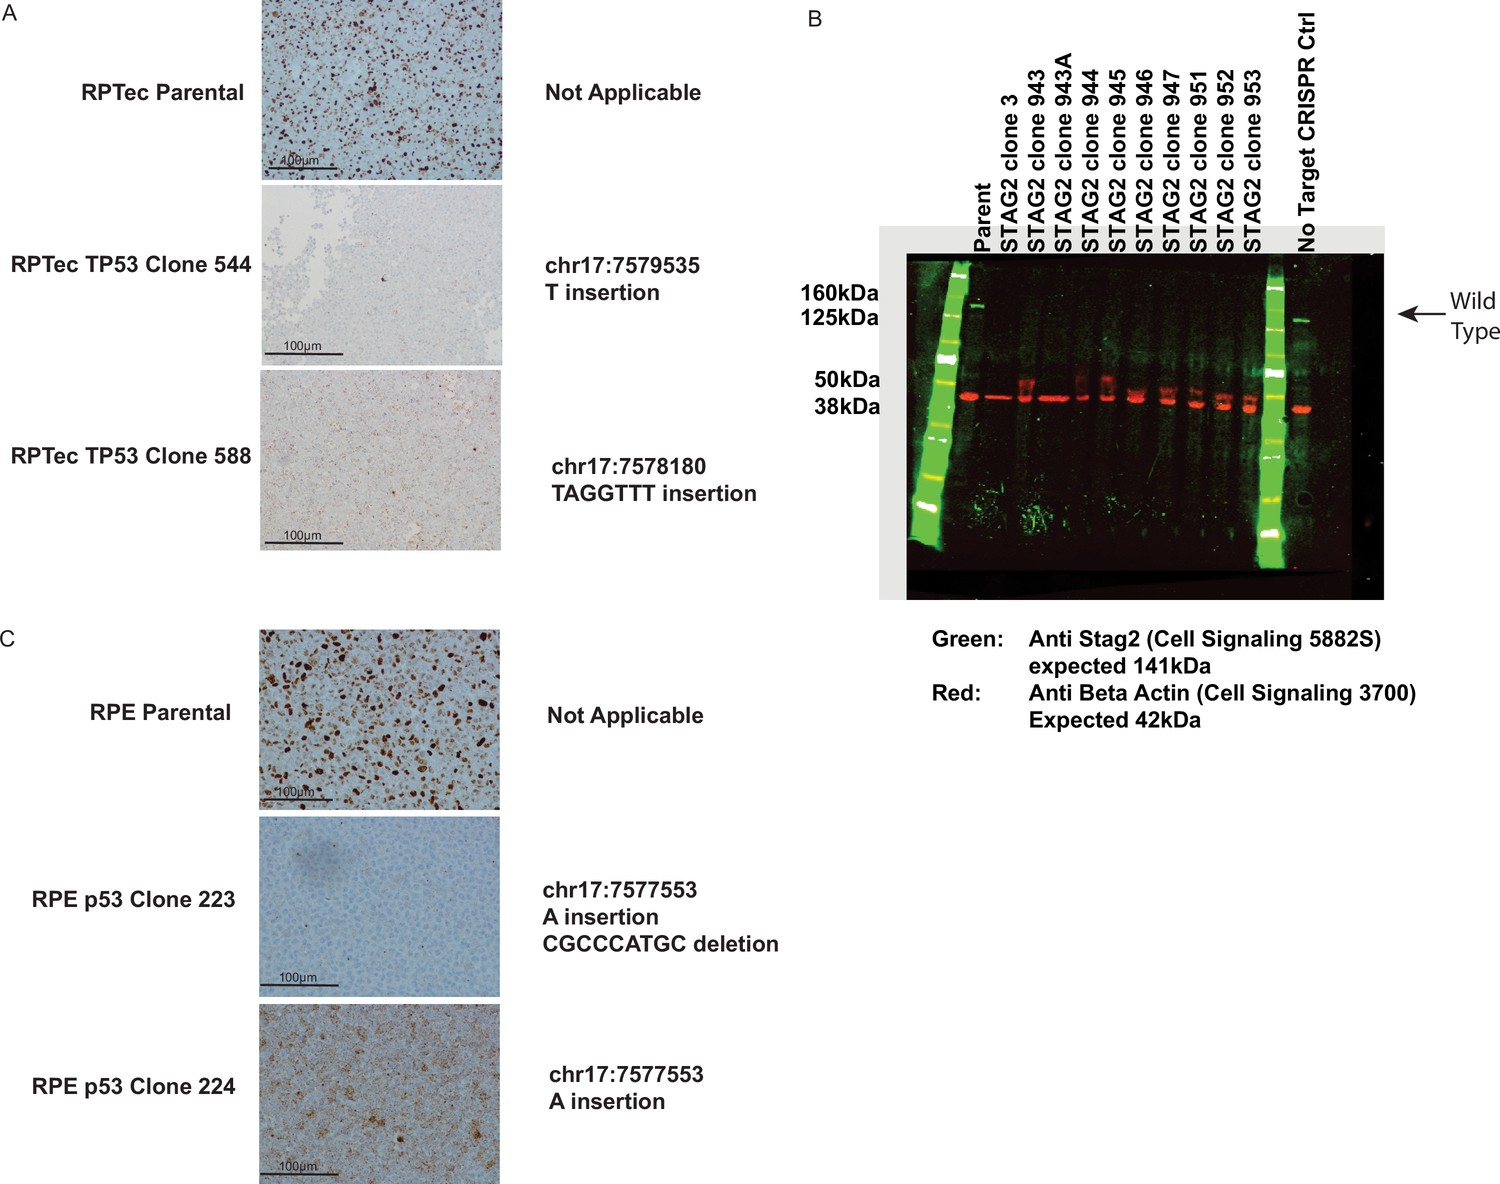
Knockout status for isogenic cell lines used in this study.
(A) Immunohistochemistry (IHC) staining of TP53 in RPTec TP53 knockout clones. (B) Western blot against STAG2 on RPTec STAG2 knockout clones demonstrating successful knockout at the protein level of all 10 clones. Out-of-frame indels were confirmed in all clones by next-generation sequencing (NGS) (data not shown). The arrow indicates the expected size for full-length STAG2 protein. (C) IHC staining of TP53 protein on RPE1 TP53 knockout clones. Clone 223 contains the same truncating mutation found in clone 224 on allele 1 and has a 9-bp in-frame deletion that preserves some full-length TP53α and TP53β isoform expression on allele 2 (see Figure 1E). Note that the IHC image shown for RPE1 parent (control) in part C is the same image shown in Figure 1—figure supplement 1.
Figure 1—figure supplement 7

Protein schematic cartoons showing indel mutation site and expected size of various TP53 knockout clones used in this study.
Note: RPE TP53 223 has an in-frame deletion in the DNA-binding domain.
Figure 1—figure supplement 8
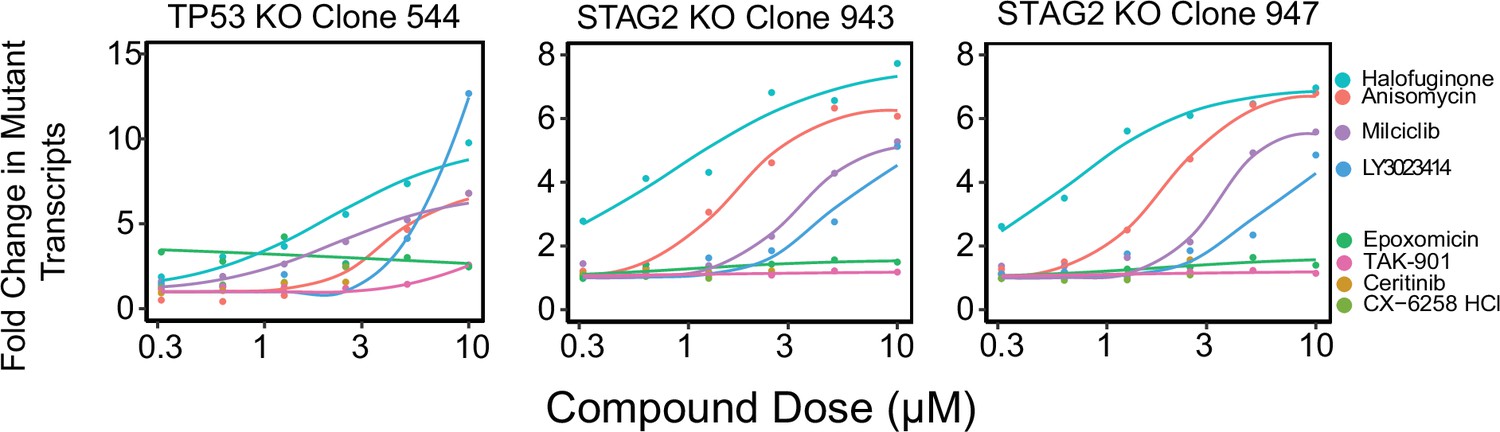
Fold change in mutant RNA transcription levels for STAG2 and TP53 in three knockout cell lines from the RPtec background containing out-of-frame indels targeted by nonsense-mediated decay (NMD).
Each line was treated with each of the eight hit compounds from the screen. The 10 µM dose is also shown in Figure 1C.
Figure 2
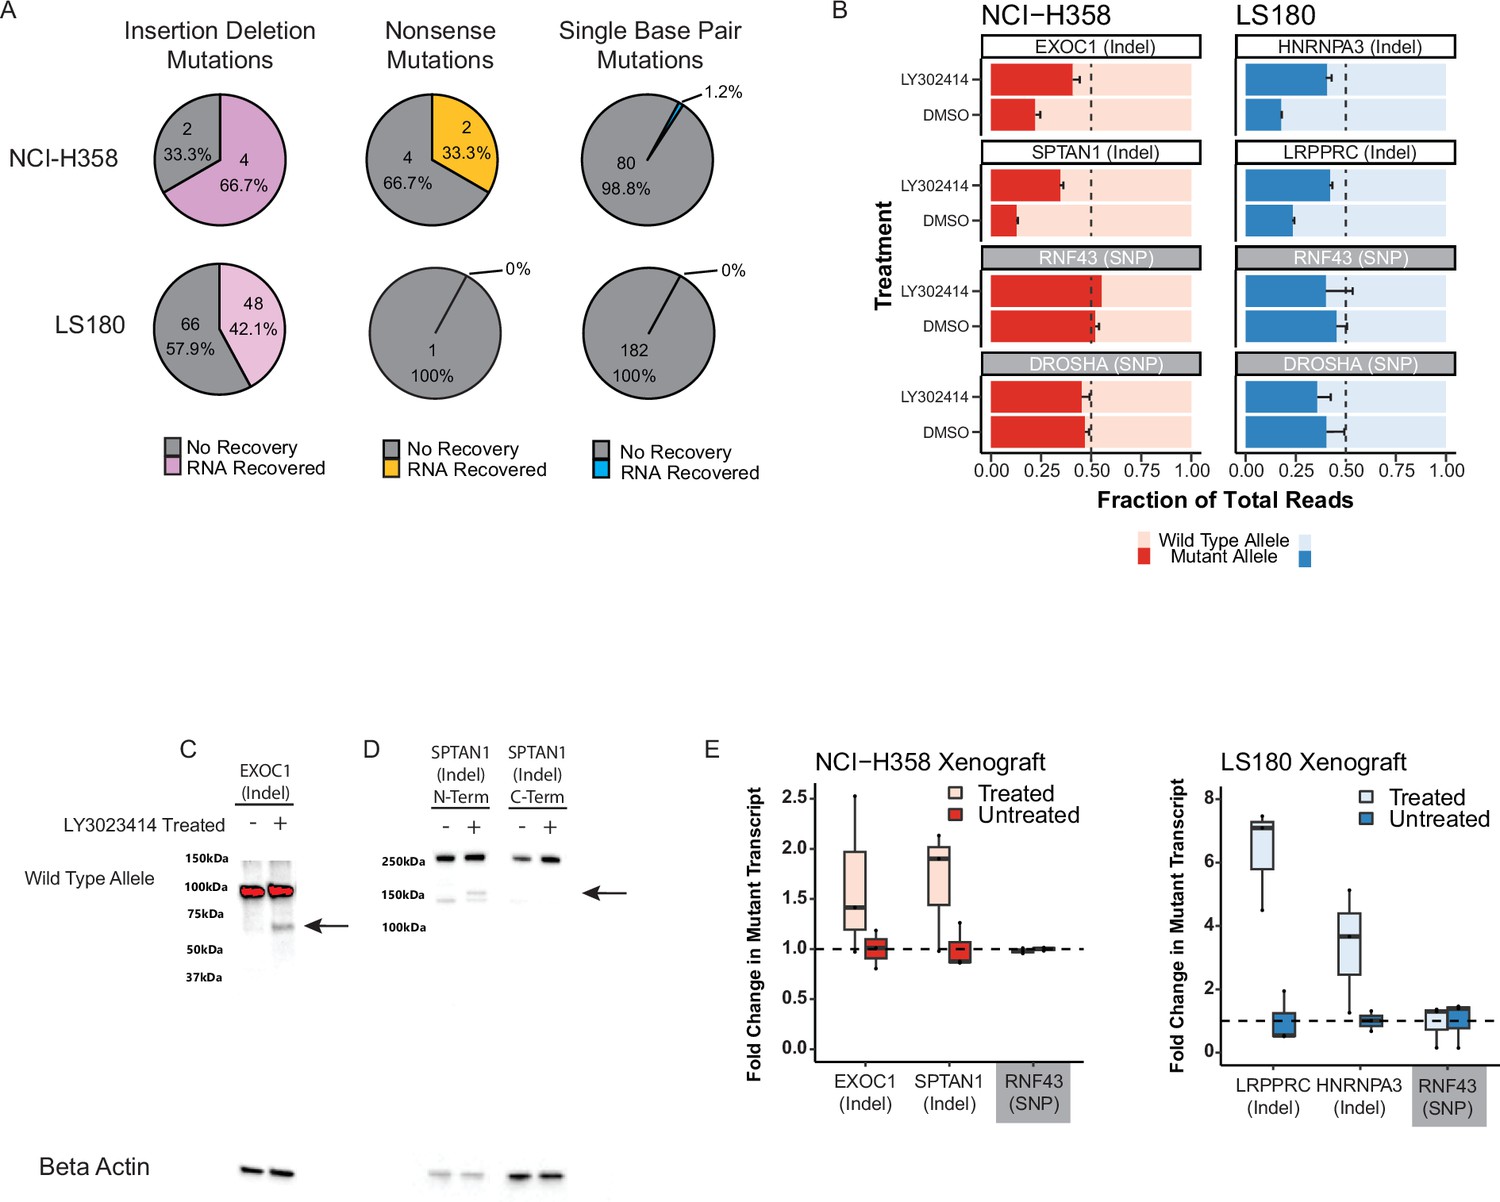
Inhibiting nonsense-mediated decay (NMD) in cancer cells increases broad expression of truncated gene messenger RNA (mRNA) and protein.
(A) Mutant transcript recovery rates for genes containing heterozygous indel mutations based on RNA-sequencing results in cell lines treated with 5 µM LY3023414 for 16 hr. Strict inclusion criteria were used, such that only mutations with sufficient sequencing coverage are shown (see methods). Recovery is defined as at least two-fold increase over dimethyl sulfoxide (DMSO) treatment. (B) Targeted high coverage RNA-sequencing confirms recovery of mutant transcript levels in NCI-H358 and LS180 cancer cell lines treated with 5 µM LY3023414. RNF43 and DROSHA contain common heterozygous single-nucleotide polymorphisms (SNPs) and the mutant allele refers to the non-reference genome allele. Error bars indicate 95% confidence limits. (C) Western blot analyses of NCI-H358 cells showing mutant and wild-type protein levels in EXOC1 and (D) SPTAN1 with and without 5 µM LY3023414 treatment. The black arrow indicates the expected size of the mutant protein. The C-terminal SPTAN1 antibody is downstream of the out-of-frame indel mutation and is not expected to identify the mutant allele. (E) Fold change in the number of mutant RNA transcripts from deep-targeted RNA-sequencing of heterozygous mutated genes in NCI-H358 and LS180 xenografts treated by oral gavage with 60 mg/kg LY3023414 assayed 16 hr post-treatment. Student’s t-test for target genes are all p < 0.05, while the null hypothesis holds for RNF43 (common SNP).
Figure 3 with 7 supplements

Novel nonsense-mediated decay (NMD) inhibitor KVS0001 is SMG1 specific and induces expression of NMD-targeted genes in vitro and in vivo.
(A) Fraction of mutant allele transcripts in genes with heterozygous indels previously established in this study as sensitive to NMD inhibition. Results show mutant levels after siRNA treatment targeting kinases inhibited by LY3023414. RNF43 and DROSHA are common heterozygous single-nucleotide polymorphisms (SNPs) (shaded gray) and serve as negative controls. (B) Fraction of mutant allele transcripts in genes with truncating mutations known to be sensitive to NMD inhibition after siRNA treatment with siUPF1 or non-targeting siRNA. Data from deep-targeted RNA-sequencing. (C) Structure of novel NMD inhibitor KVS0001. (D) Targeted RNA-sequencing on three genes with heterozygous, out-of-frame, indel mutations in LS180 cancer cells treated in a dose–response with KVS0001 or SMG1i-11. RNF43 serves as a control (common heterozygous SNP) and the mutant allele refers to the non-reference genome allele. (E) Western blot of EXOC1 protein in NCI-H358 cells treated with 5 µM novel inhibitor KVS0001, LY3023414, or SMG1i-11 for 24 hr. (F) Western blot of phosphorylated UPF1 on three cell lines treated with 5 µM KVS0001, SMG1i-11, or dimethyl sulfoxide (DMSO). Note that total UPF1 and p-UPF1 were run on different gels, loading controls correspond to indicated gel. (G) Fold change in the number of mutant allele transcripts measured by targeted RNA-seq in genes containing heterozygous out-of-frame indel mutations in NCI-H358 or (H) LS180 subcutaneous xenografts in bilateral flanks of nude mice. Mice were treated once with intraperitoneal (IP) injection of vehicle or 30 mg/kg KVS0001 and tumors harvested 16 hr post IP treatment. All genes shown contain heterozygous out-of-frame truncating mutations except RNF43 and DROSHA which serve as controls (contain heterozygous SNPs).
Figure 3—figure supplement 1

RNA expression levels of kinases post siRNA targeting in NCI-H358 and LS180 cells by quantitative real-time PCR (qPCR).
Cells are treated with siRNAs targeting genes known to be inhibited by LY3023414. Error bars represent 95% confidence intervals.
Figure 3—figure supplement 2
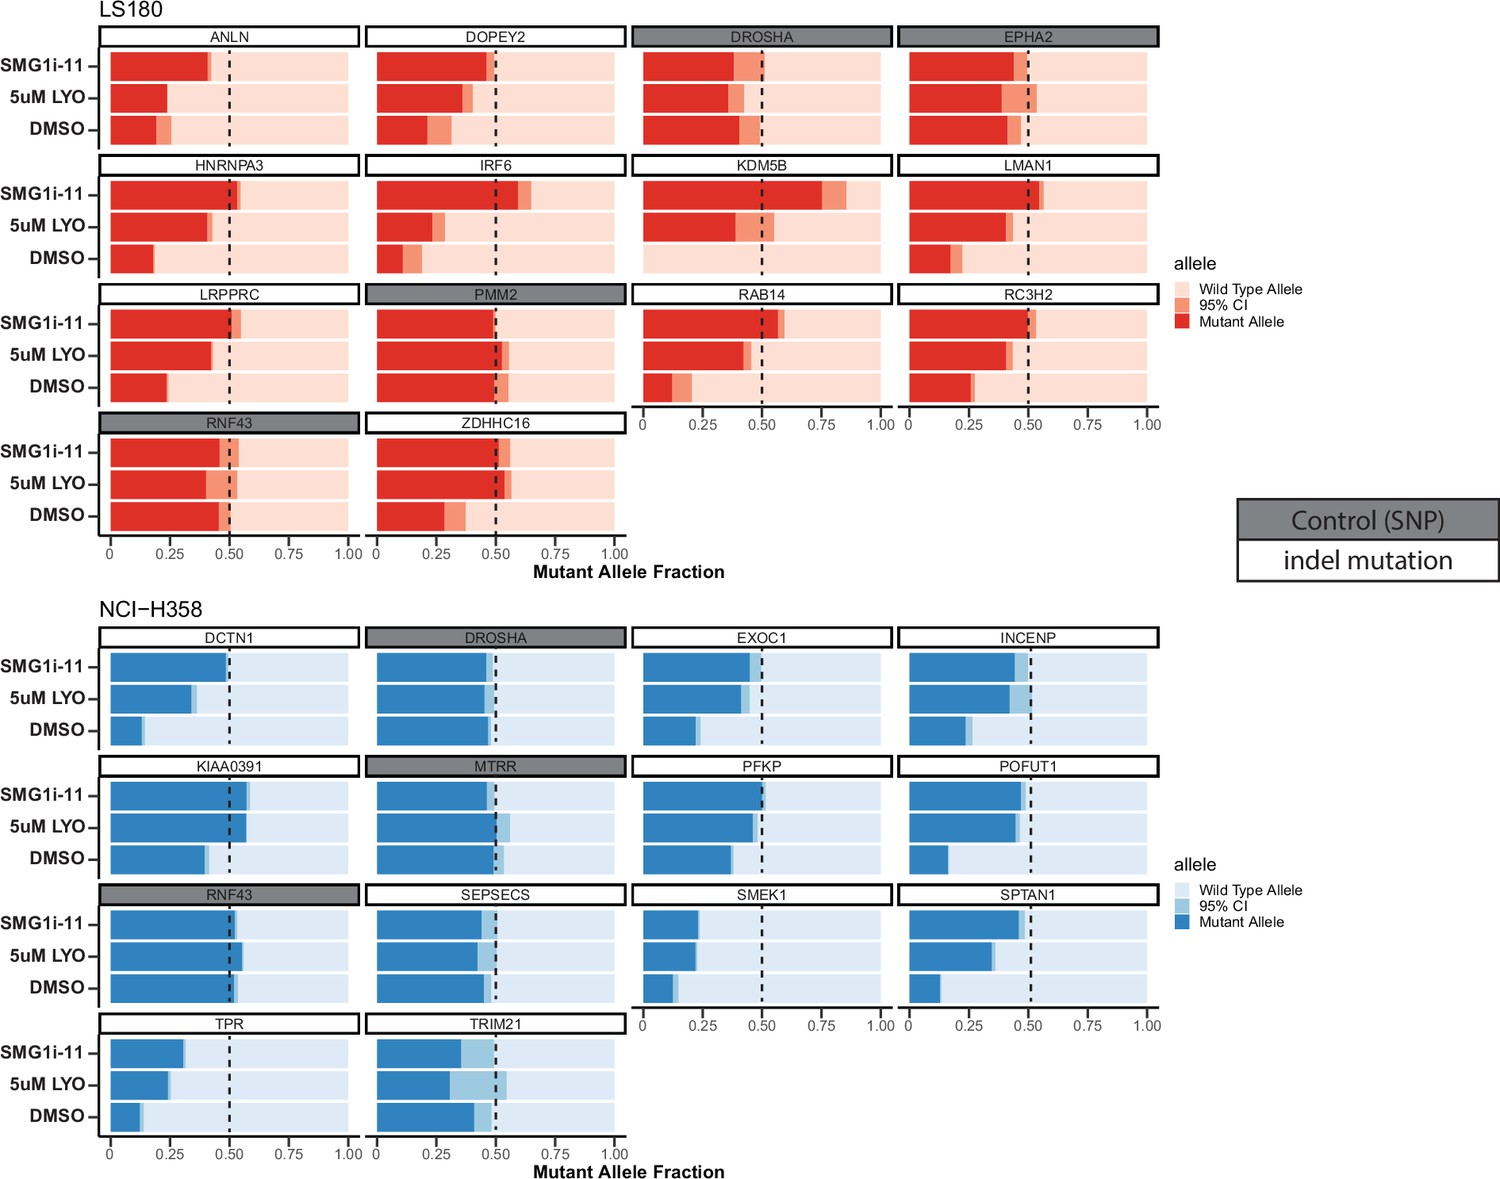
Slider plots showing mutant allele fraction relative to total reads measured by deep-targeted RNA-sequencing for in vitro treated LS180 (top in red) or NCI-H358 (bottom in blue) cells with 5 µM LY3023414 (labeled LYO) or a previously described SMG1 inhibitor SMG1i-11 at 1 µM.
Gene names are shown in the boxes above each slider plot, genes highlighted in gray are common single-nucleotide polymorphisms (SNPs) and serve as a negative control (not expected to change). In the case of the control SNPs, the mutant allele refers to the non-reference genome allele. TRIM21 did not show a large change in expression with either small molecule, while ANLN did not show a difference with LY3023414 but did respond to SMG1i-11. The remaining genes responded to nonsense-mediated decay (NMD) inhibition by both LY3023414 and SMG1i-11.
Figure 3—figure supplement 3
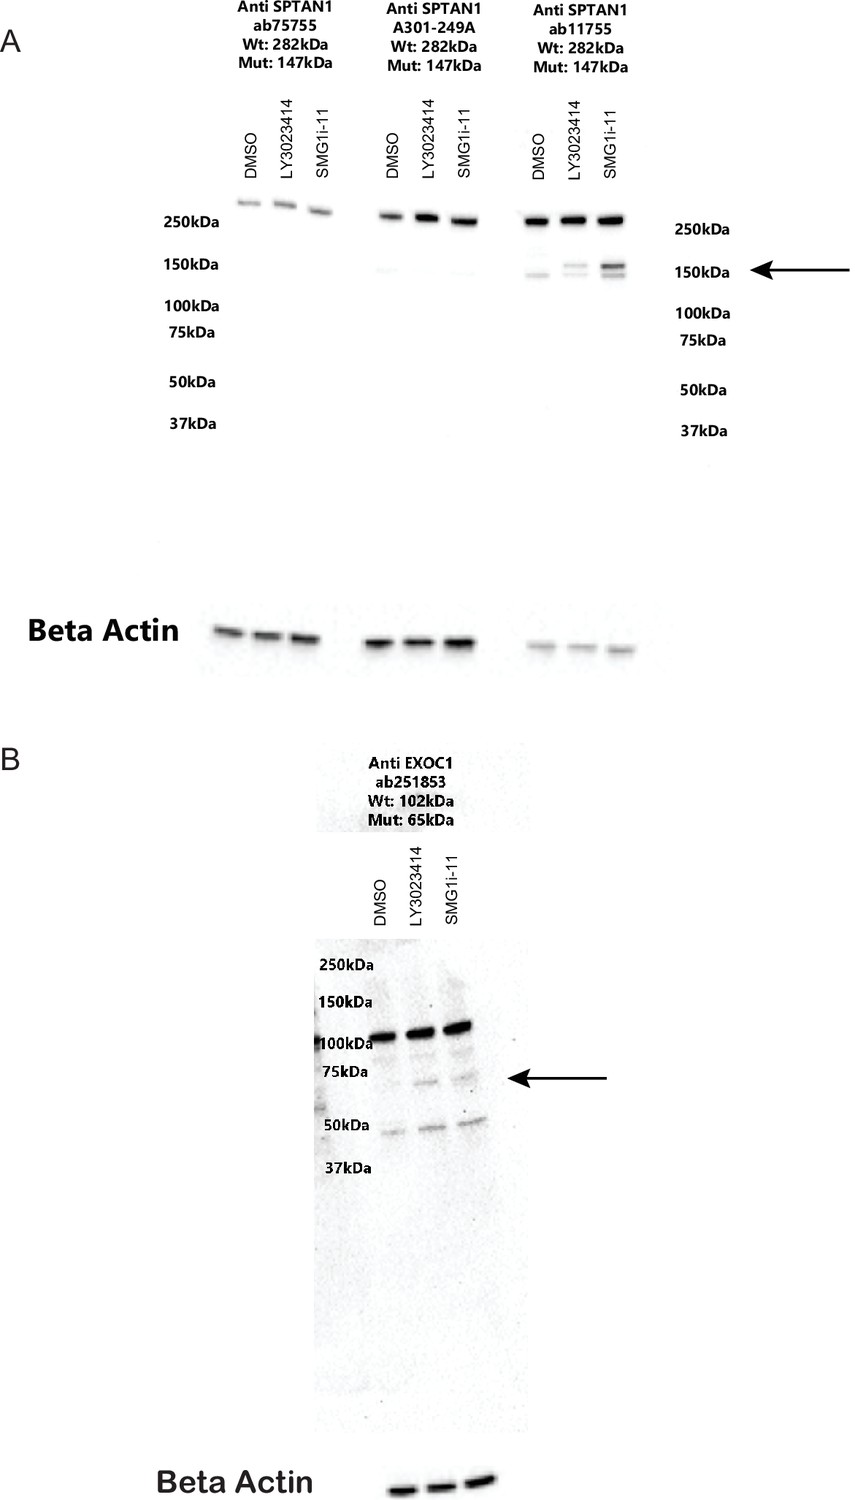
Mutant protein expression only occurs in the presence of nonsense-mediated decay (NMD) inhibtion.
(A) Western blot showing SPTAN1 expression after treatment with dimethyl sulfoxide (DMSO), 5 µM LY3023414, or 1 µM SMG1 inhibitor SMG1i-11 (lanes 1, 2, and 3, respectively, for each antibody). The arrow indicates the expected size of the mutant NMD-targeted protein. Antibody ab75755 (Abcam) binds C-terminal to the out-of-frame indel and does not show mutant protein as expected. Antibody A301-249 (Bethyl) is polyclonal and also did not bind mutant protein. Antibody ab11755 (Abcam) is located N-terminal to the indel and does display mutant protein expression. (B) Western blot showing EXOC1 expression after treatment with DMSO, 5 µM LY3023414, or 1 µM SMG1i-11 (lanes 1, 2, and 3, respectively). The arrow indicates the expected size of the mutant (NMD-targeted) protein.
Figure 3—figure supplement 4

Biophysical properties for novel SMG1 inhibitor KVS0001.
Figure 3—figure supplement 5
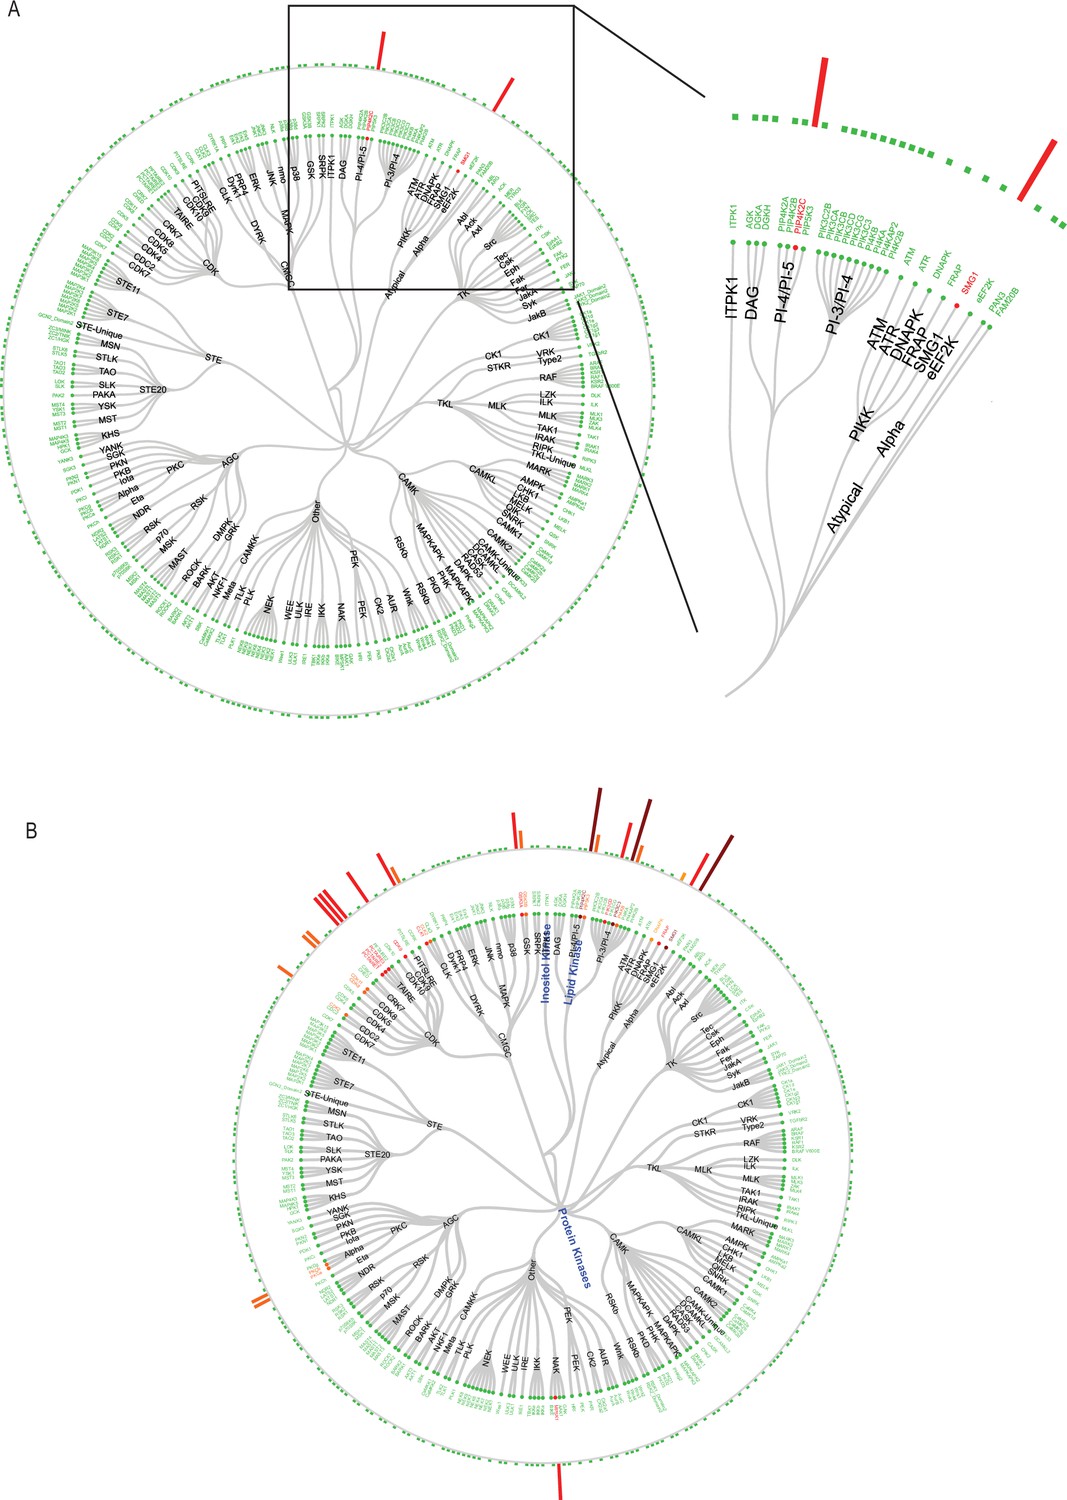
Kinase specifity for KVS0001.
(A) Kinativ assay results for KVS0001 at 100 nM and (B) 1 µM run with biological replicates showing KVS0001 specificity against the known kinome. Results are based on the average between two unique peptides for each kinase.
Figure 3—figure supplement 6
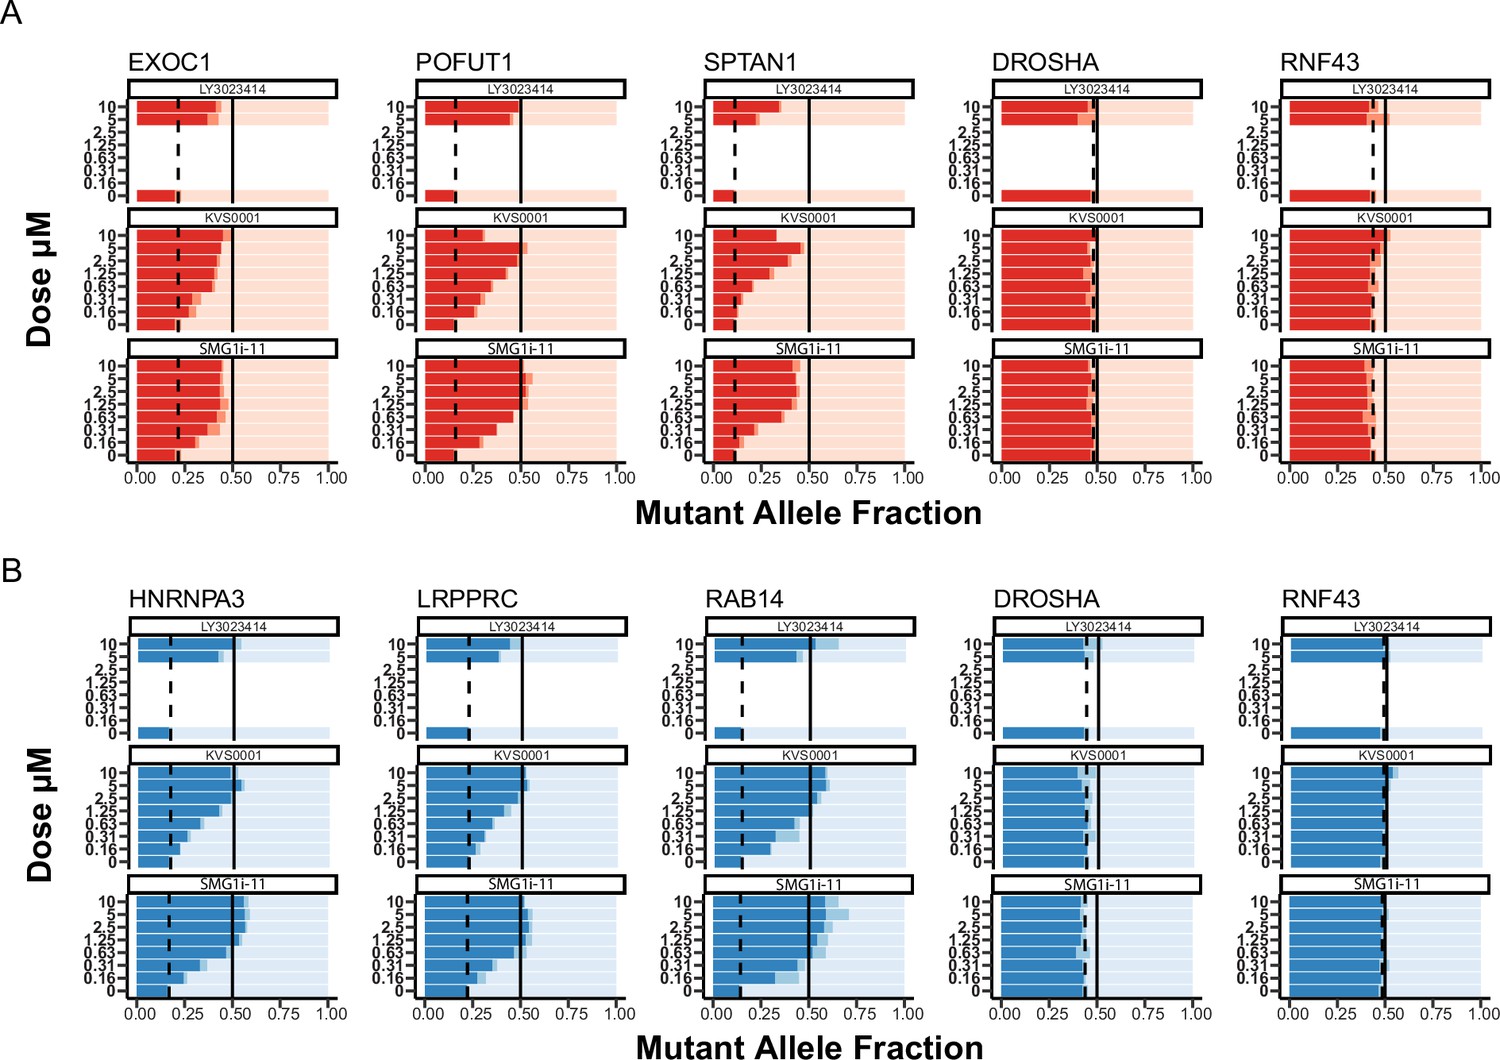
(A) Slider plots showing mutant allele fraction measured by deep-targeted RNA-sequencing for genes from NCI-H358 (top in red) and (B) LS180 (bottom in blue) treated in a dose–response in vitro with novel nonsense-mediated decay (NMD) inhibitor KVS0001.
DROSHA and RNF43 are common heterozygous single-nucleotide polymorphisms (SNPs) and serve as a negative control. In the case of the control SNPs, the mutant allele refers to the non-reference genome allele. Only the highest two concentrations were tested on LY3023414 which served as a positive control in this experiment. The dotted line indicates the mutant expression with dimethyl sulfoxide (DMSO) treatment and the solid line is a reference for equal expression of both the wild-type and mutant alleles.
Figure 3—figure supplement 7

Mutant protein expression in presence of nonsense-mediated decay (NMD) inhibtion.
(A) Western blot showing expression of LMAN1 in LS180 cells treated with dimethyl sulfoxide (DMSO) (lane 1), KVS0001 at 5 µM (lane 2), or SMG1i-11 at 1 µM (lane 3). Arrows indicate expected size of wild-type and mutant LMAN1 protein. (B) Stain free loading control image for gel.
Figure 4 with 4 supplements
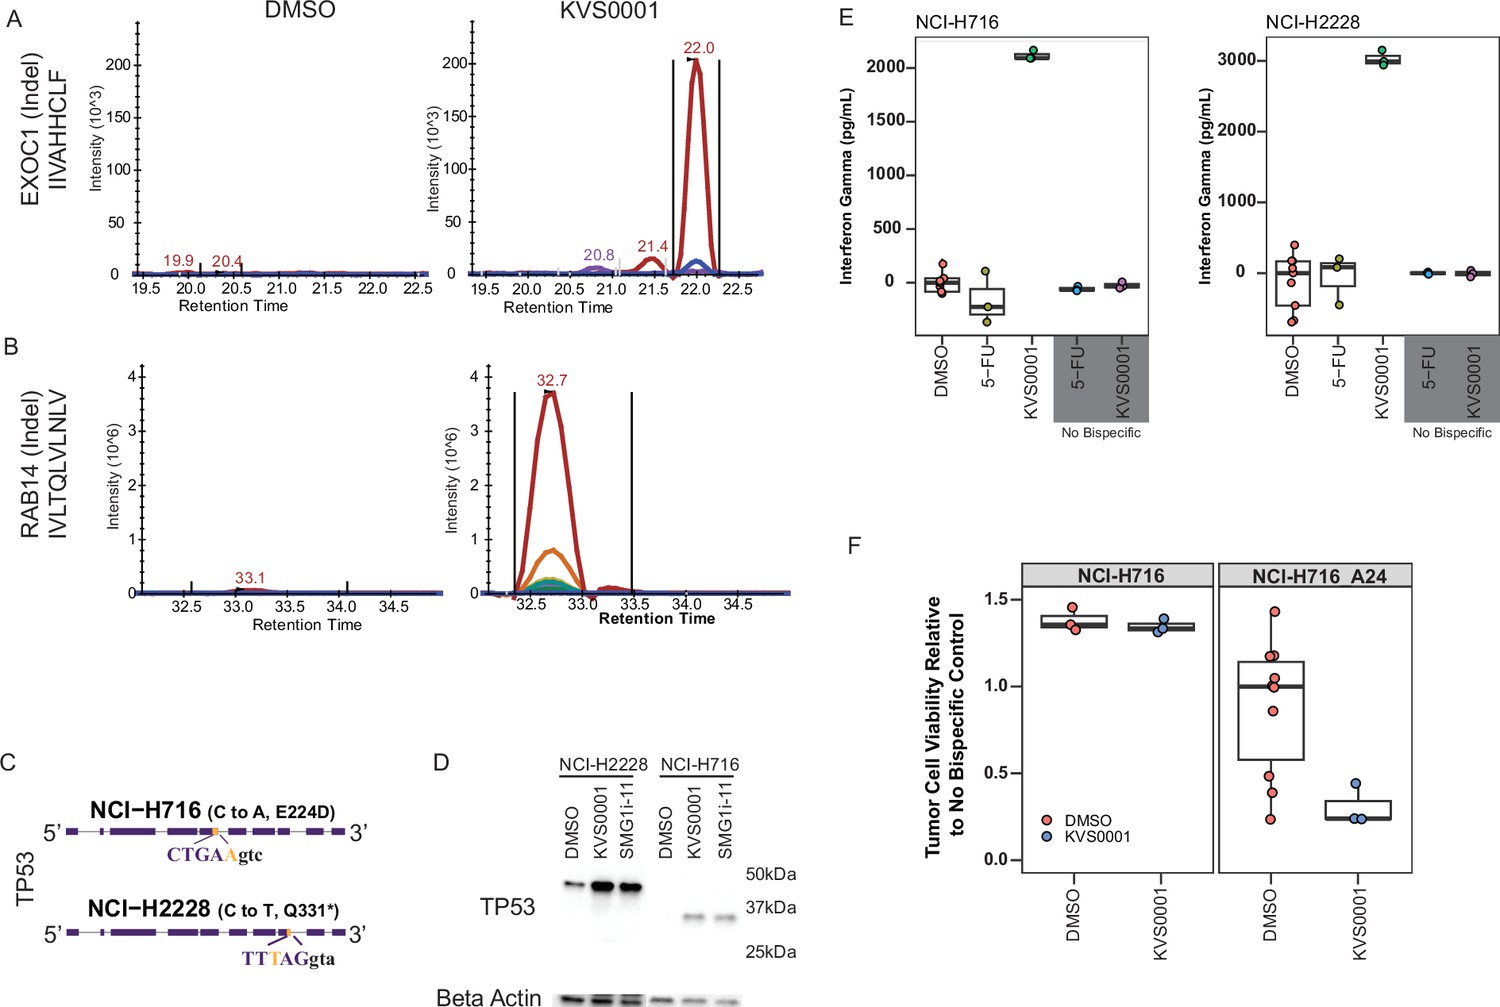
KVS0001 treatment induces targetable cell surface presentation of peptides known to be downregulated by nonsense-mediated decay (NMD).
(A) MHC class I HLA presentation of mutant specific peptide sequences from NCI-H358 and (B) LS180 cells by quantitative HPLC–mass spectrometry treated with dimethyl sulfoxide (DMSO) or 5 µM KVS0001. The gene name, type of mutation (in parenthesis), and presented peptide are shown on the y-axis for each gene. Colors indicate different ions. (C) TP53 gene structure and mutant DNA sequence for NCI-H716 and NCI-H2228 cancer cell lines, both contain a homozygous splice site mutation in TP53. Capital letters represent exonic sequence; lowercase letters represent intronic sequence. DNA mutation reflected by gold bases. (D) Western blot against TP53 in the presence or absence of 5 µM NMD inhibitor in NCI-H716_A24 and NCI-H2228 cell lines. NCI-H2228 has an expected size of 46.6 kDa and NCI-H716 of 34.7 kDa. (E) Interferon (IFN-γ) levels over baseline based on enzyme-linked immunosorbent assay (ELISA) in a co-culture assay with NCI-H716_A24 and NCI-H2228 cells, 1.25 µM NMD inhibitor, human CD3+ T-cells, and bispecific antibody for TP53 and CD3. Chemotherapy (5-fluorouracil) is shown as a control. (F) Cell killing based on luciferase levels in a co-culture assay in NCI-H716 cells with and without A24 expression, treated with TP53-CD3 bispecific antibody, 1.25 µM NMD inhibitor and human CD3+ T-cells.
Figure 4—figure supplement 1
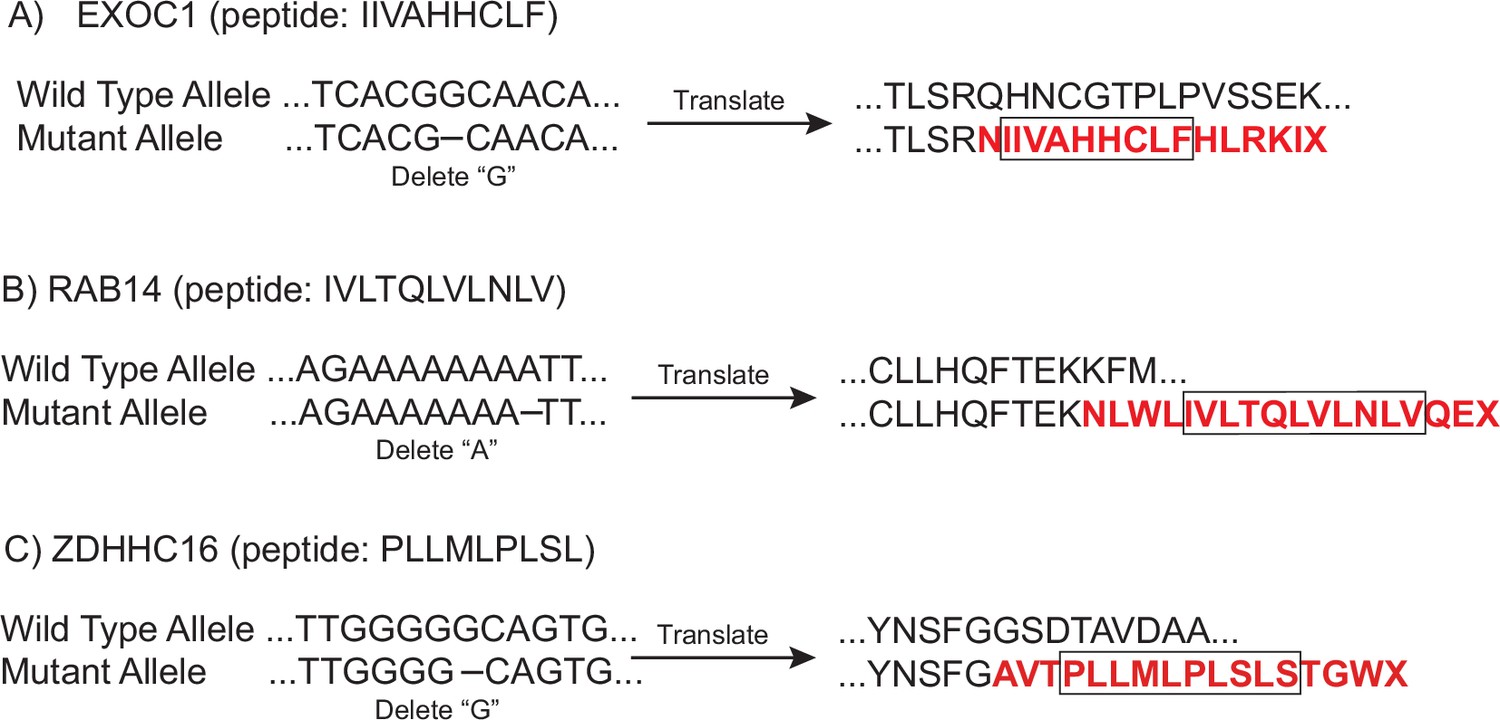
DNA and protein sequences for the wild-type and mutant alleles of (A) EXOC1, (B) RAB14, and (C) ZDHHC16 genes.
The mutant protein sequences caused by the out-of-frame indel are highlighted in red and the boxes indicate the peptides presented on the cell surface and identified by mass spectrometry in cells treated with 5 µM of KVS0001 (see Figure 4A and B).
Figure 4—figure supplement 2
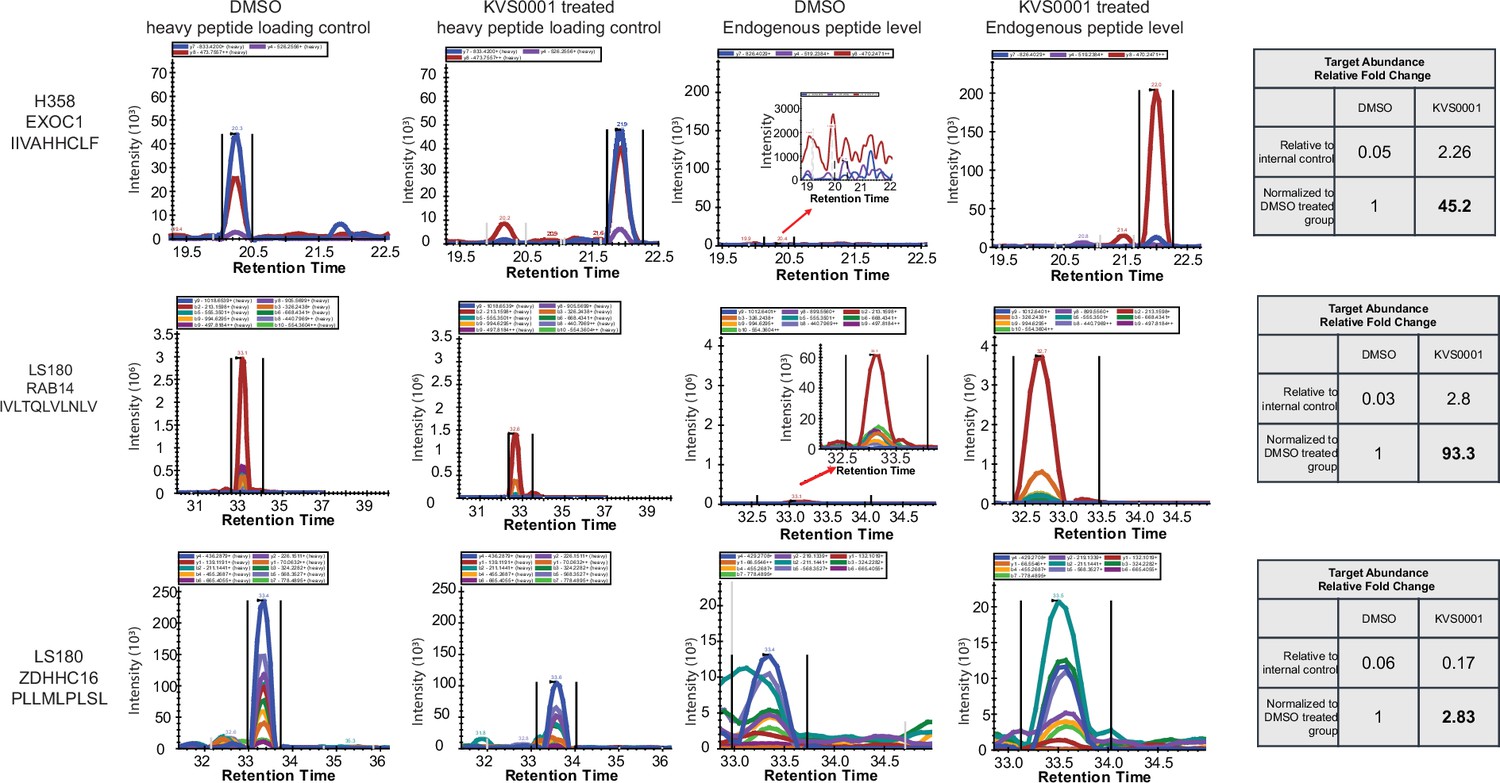
Heavy peptide loading controls and endogenous (light) peptide presentation of genes in LS180 and NCI-H358 treated with dimethyl sulfoxide (DMSO) or 5 µM KVS0001.
Data are from quantitative HPLC–mass spectrometry. Note: y-axis scale changes between samples. Tables on the right show relative increase in peptide presentation with KVS0001.
Figure 4—figure supplement 3
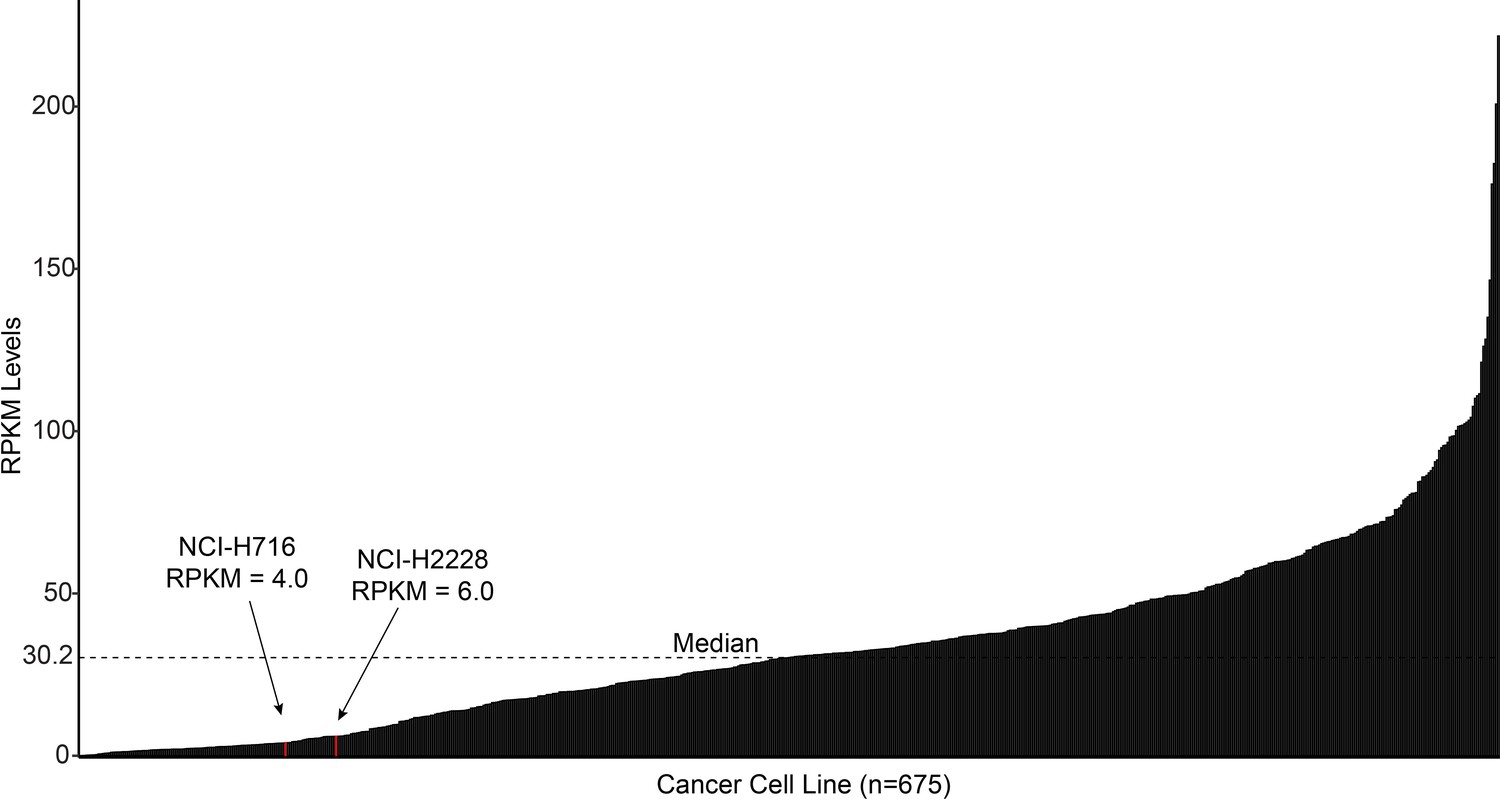
Waterfall plot of publicly available TP53 RNA expression (as shown by FPKM) for 675 cancer cell lines.
The two cell lines used in this study are highlighted in red and were in the bottom quartile of TP53 expression.
Figure 4—figure supplement 4
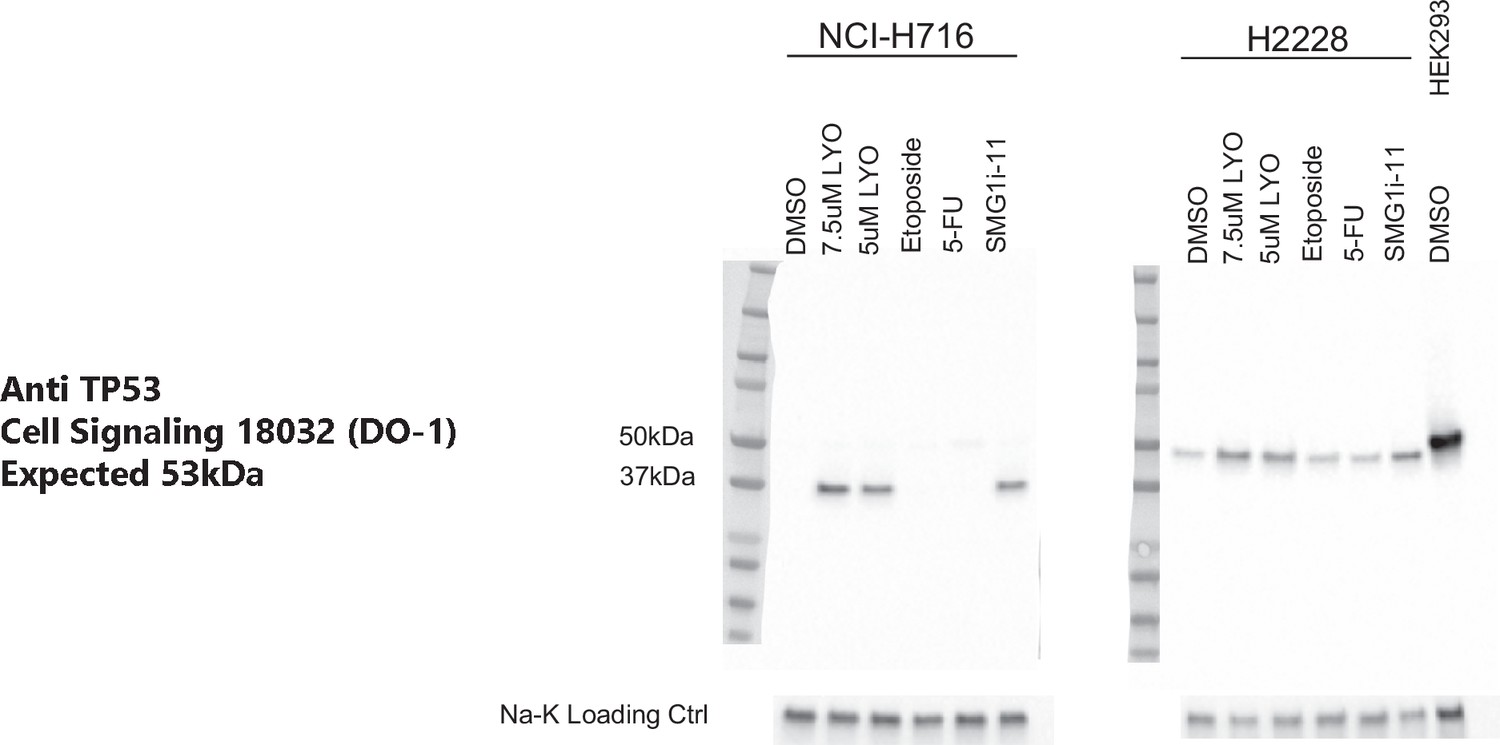
Western blot of TP53 on NCI-H716 and NCI-H2228 cells treated with 5 or 7.5 µM of nonsense-mediated decay (NMD) inhibitor, 1 µM SMG1i-11, or 200 mg/ml chemotherapy, showing controls related to Figure 4D.
LYO is LY3023414 and 5-FU is 5-fluorouracil. HEK293 parent cells are shown as a control (wild-type TP53 protein).
Figure 5 with 2 supplements
In vivo treatment of murine tumors with KVS0001 yield differential tumor growth compared with vehicle treatment.
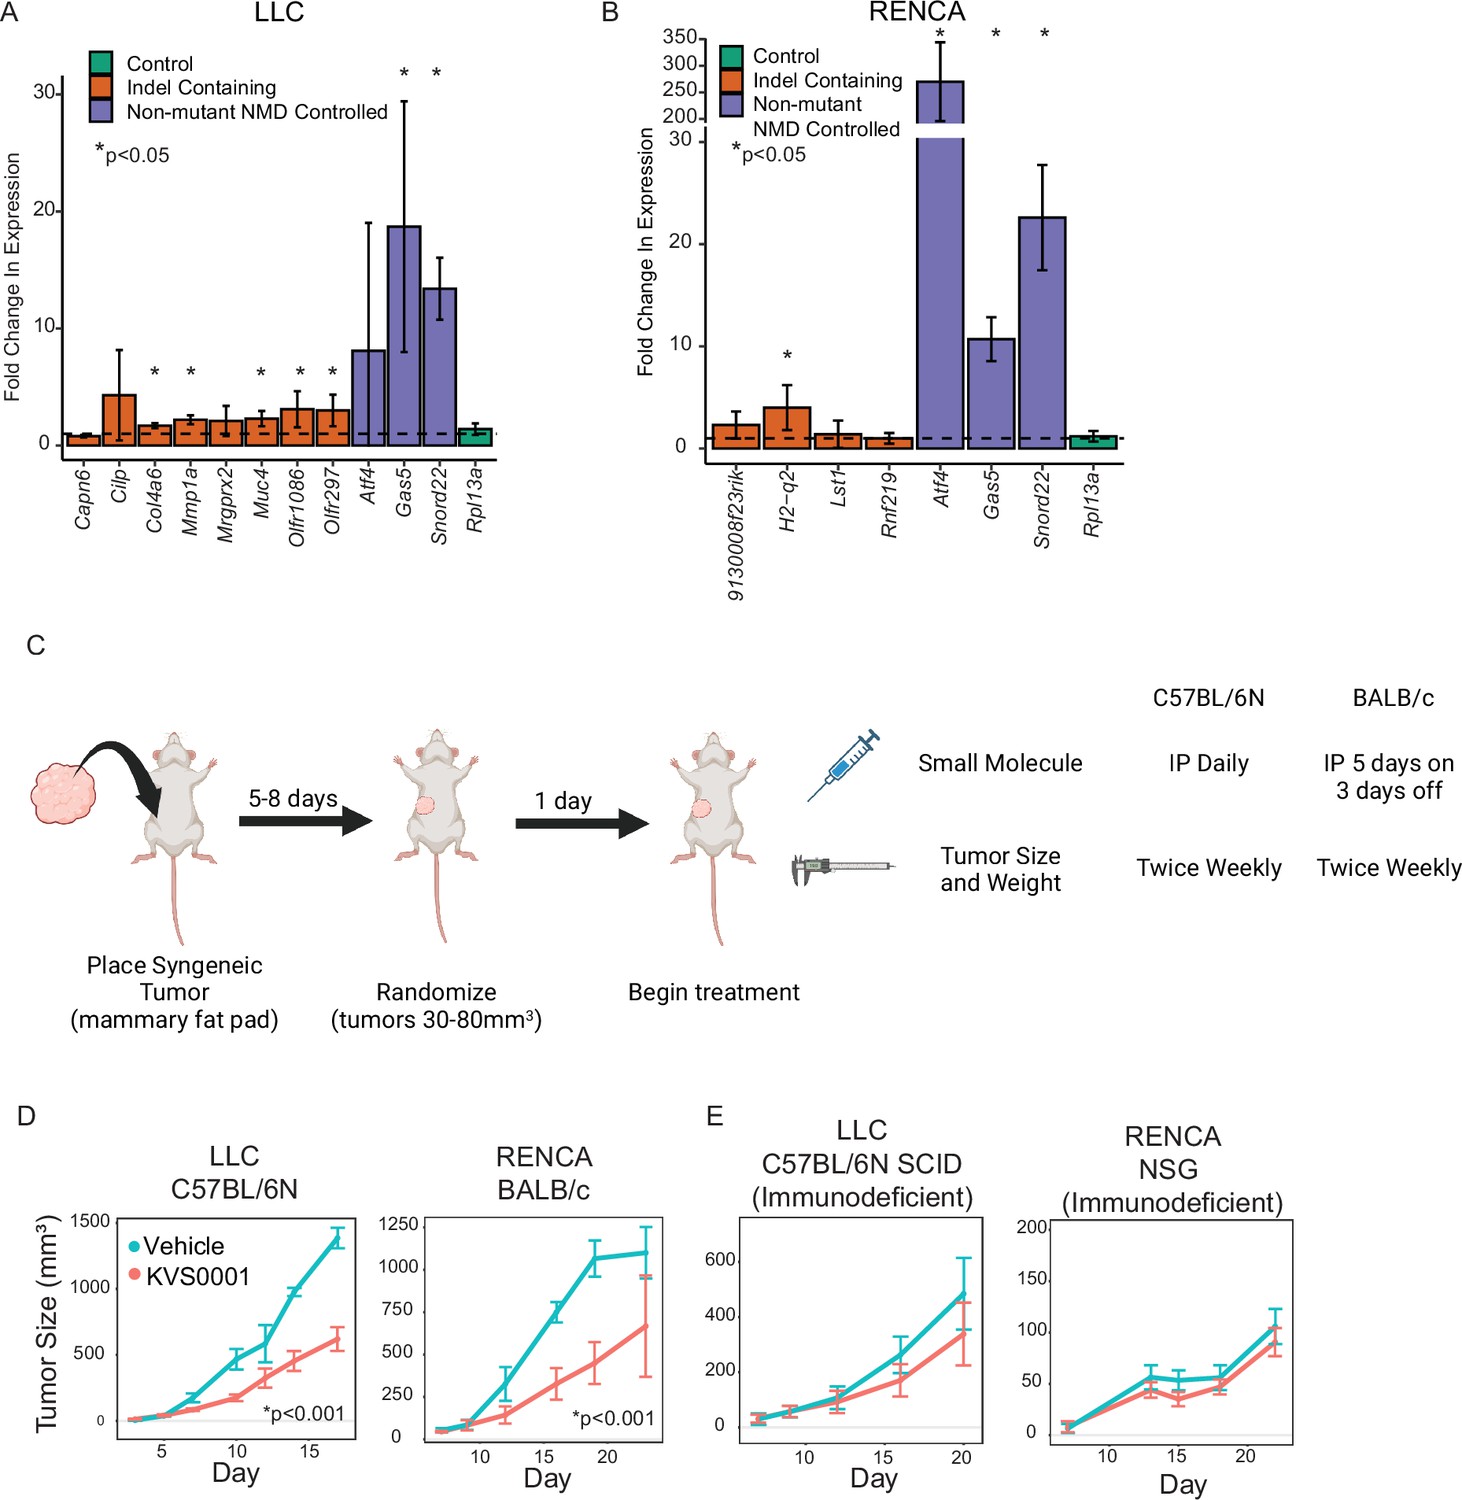
(A) Fold change in RNA transcript levels in LLC or (B) RENCA cells treated in vitro with 5 µM of nonsense-mediated decay (NMD) inhibitor KVS0001 or dimethyl sulfoxide (DMSO). Orange bars indicate genes with homozygous indel mutations potentially targeted by NMD. Purple bars show genes with no mutations but that are known to have their normal transcription levels controlled by NMD. Green bar is a control gene that should not change with treatment. The dotted line shows relative expression of DMSO treatment (equal to 1). * indicates significantly different from untreated by Student’s T-test. (C) Treatment schedule for syngeneic tumor mouse experiments. (D) Average tumor size of LLC (left) and RENCA (right) syngeneic tumors in immune-competent mice (n = 8) treated with 30 mg/kg KVS0001 or vehicle control IP. Difference is statistically significant after day 10 based on one-way analysis of variance (ANOVA) with Dunnett’s test p < 0.001 (p < 0.05 for day 23 RENCA data point) for both tumors tested. (E) Average tumor size of LLC (left) and RENCA (right) in immunodeficient mice (n = 8) treated with 30 mg/kg KVS0001 or vehicle control. Error bars show 95% confidence intervals in all plots.
Figure 5—figure supplement 1
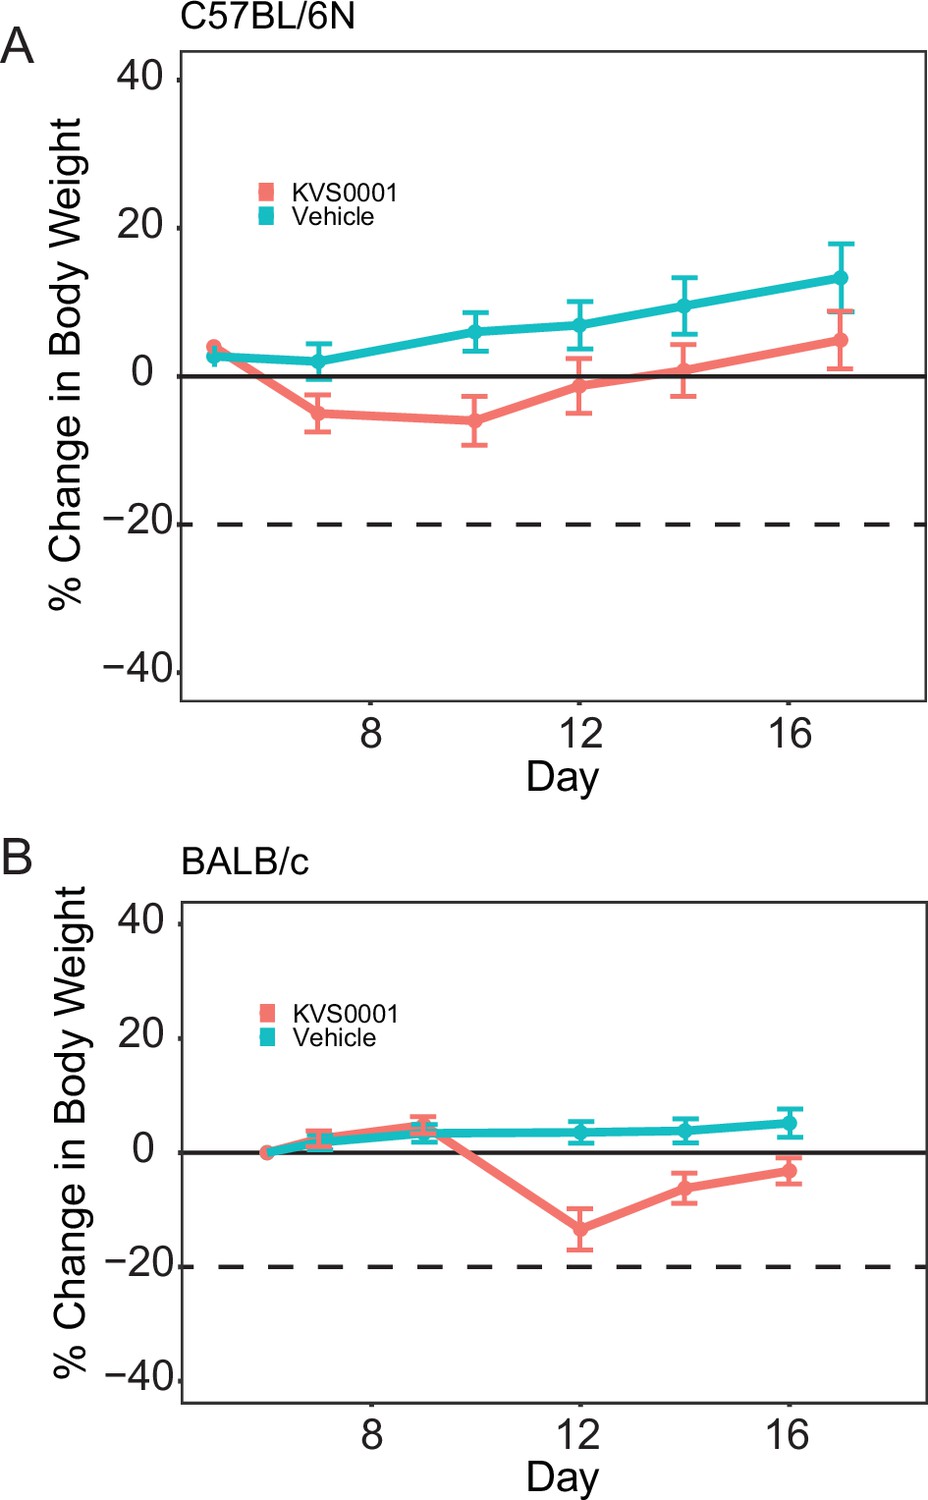
Mouse weights for (A) C57BL/6N and (B) BALB/c tumor-bearing mice treated with 30 mg/kg KVS0001 or vehicle control intraperitoneal (IP) daily.
N = 8 for all arms.
Figure 5—figure supplement 2
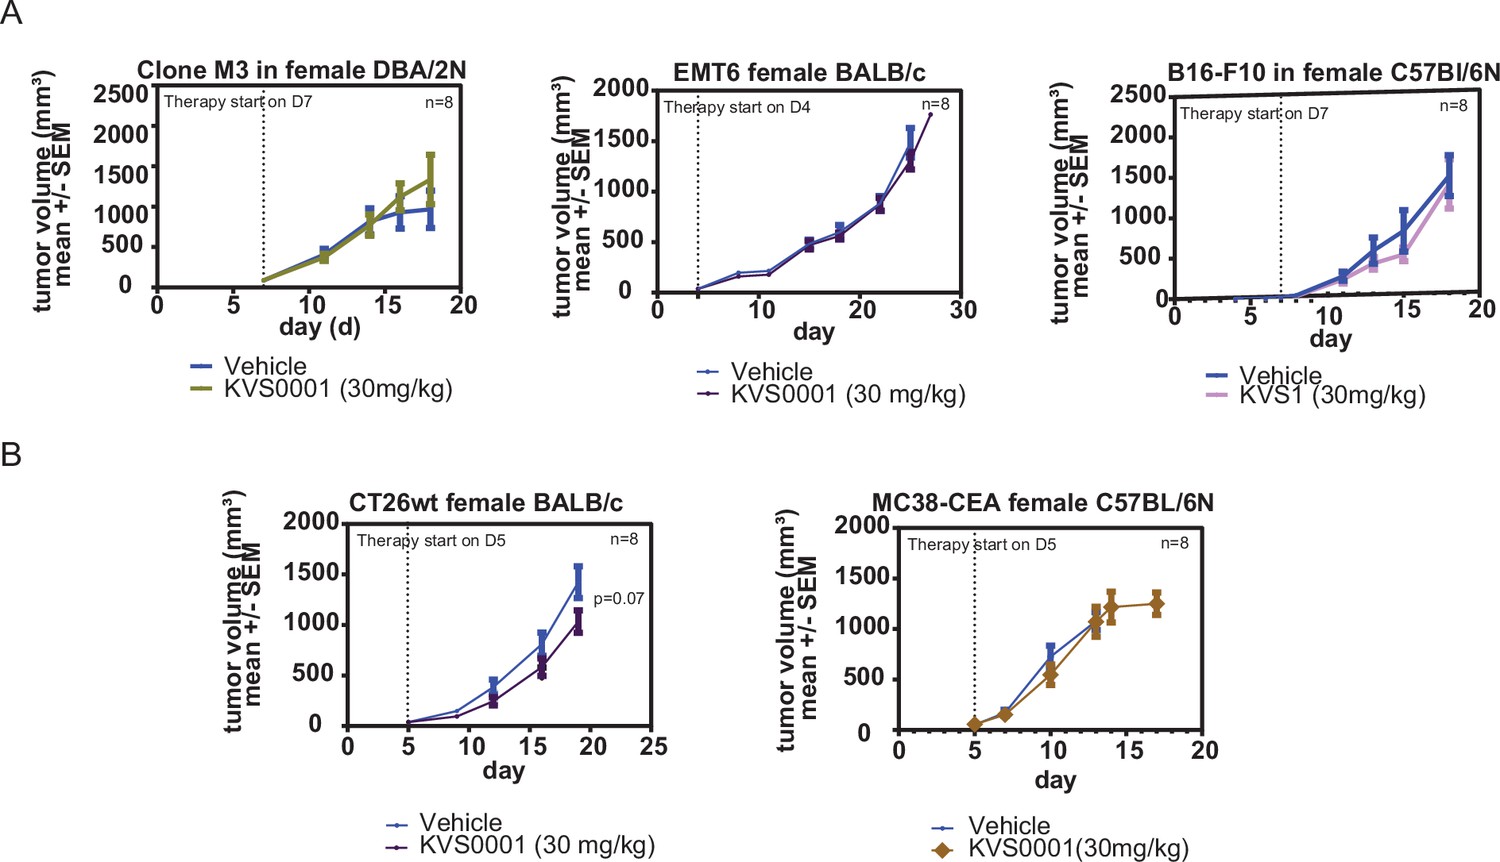
Mouse tumor size as measured by calipers for mammary fat pad placed syngeneic tumor models treated daily with 30 mg/kg KVS0001 or vehicle IP.
(A) Tumors with low/moderate and (B) high indel mutational loads are shown. No results presented in this figure supplement are statistically significant. Error bars show 95% confidence intervals.
Chemical structure 1

Flowchart describing synthesis for KVS0001.
Tables
Key resources table
| Reagent type (species) or resource | Designation | Source or reference | Identifiers | Additional information |
|---|---|---|---|---|
| Antibody | Donkey anti goat IgG 680RD monoclonal | Licor | 926-68074, RRID:AB_10956736 | Used for western blot at 1:10 K |
| Antibody | Donkey anti mouse 680RD monoclonal | Licor | 926-68072, RRID:AB_10953628 | Used for western blot at 1:15 K |
| Antibody | Goat anti mouse HRP monoclonal | Jackson Immuno Research | 115-035-006, RRID:AB_2338500 | Used for western blot at 1:2500 |
| Antibody | Donkey anti rabbit 800CW monoclonal | Licor | 926-32213, RRID:AB_621848 | Used for western blot at 1:10 K |
| Antibody | Goat anti rabbit HRP monoclonal | Jackson Immuno Research | 111-035-006, RRID:AB_2337936 | Used for western blot at 1:2500 |
| Antibody | Mouse anti Beta-actin monoclonal | Cell Signaling Technology | 3700S | Used for western blot at 1:5000 |
| Antibody | Rabbit anti EXOC1 polyclonal | Abcam | ab251853 | Used for western blot at 0.4 µg/ml |
| Antibody | Mouse anti LMAN1 monoclonal | Thermo Fisher Scientific | CF502137 | Used for western blot at 1:200 |
| Antibody | Mouse anti OKT-3 monoclonal | Biolegend | 317347 | Used for T-cell culturing at 15 ng/ml |
| Antibody | Rabbit anti p21/WAF1 monoclonal | Cell Signaling Technology | 2947S, RRID:AB_823586 | Used for western blot at 1:1000 |
| Antibody | Mouse anti TP53 monoclonal | Cell Signaling Technology | 18032S, RRID:AB_2798793 | Used for western blot at 1:1000 |
| Antibody | Rabbit anti Phospho-(Ser/Thr) ATM/ATR polyclonal | Cell Signaling Technology | 2851S, RRID:AB_330318 | Used for western blot at 1:1000 |
| Antibody | Rabbit anti Sodium Potassium Pump (Na-K) polyclonal | Cell Signaling Technology | 3010S, RRID:AB_2060983 | Used for western blot at 1:500 |
| Antibody | Rabbit anti SPTAN1 (polyclonal) | Bethyl | A301-249A, RRID:AB_890655 | Used for western blot at 0.04 µg/ml |
| Antibody | Mouse anti SPTAN1 (N-Terminal) monoclonal | Abcam | ab11755, RRID:AB_298540 | Used for western blot at 1:1000 |
| Antibody | Rabbit anti SPTAN1 (C-Terminal) monoclonal | Abcam | ab75755, RRID:AB_1309947 | Used for western blot at 1:1000 |
| Antibody | Rabbit anti STAG2 monoclonal | Cell Signaling Technology | 5882S, RRID:AB_10834529 | Used for western blot at 1:1000 |
| Antibody | Goat anti UPF1 polyclonal | Abcam | ab10510, RRID:AB_297251 | Used for western blot at 1:2500 |
| Antibody | Mouse α-HLA-A24 monoclonal | MBL Life Science | Cat #K0208-A64, RRID:AB_1953030 | Used for flow cytometry at 10 µg/ml |
| Antibody | TP53-CD3 bispecific antibody | This study | N/A | See ‘bispecific scFv construction’ in methods, anti CD-3 and anti TP53 sequence. Used for co-culture at 12.5 pg/ml |
| Other | HLA-A24 Retrovirus | Hsiue et al., 2021 | N/A | Retrovirus which introduces and HLA-A24 expression vector |
| Other | Luciferase lentivirus | OriGene | Cat #PS100071 | Lentivirus that introduces luciferase into cells |
| Chemical compound, drug | 1% penicillin–streptomycin | Thermo Fisher Scientific | Cat #15140122 | |
| Other | 4–15% Mini-PROTEAN TGX Precast Protein Gels | Bio-Rad | Cat #456-1086 | Used for western blotting |
| Chemical compound, drug | 5-Fluoruracil | Sigma-Aldrich | Cat #F6627 | |
| Other | AMPure beads | Beckman Coulter | Cat #A63880 | Used to purify DNA before sequencing |
| Chemical compound, drug | Cremaphor | Sigma-Aldrich | Cat #C5135 | |
| Chemical compound, drug | DharmaFECT1 transfection reagent | Horizon | Cat #T-2001-02 | |
| Chemical compound, drug | Dimethyl sulfoxide (DMSO) | Sigma-Aldrich | Cat #C6295 | |
| Chemical compound, drug | DMEM medium | Gibco | Cat #11995065 | |
| Chemical compound, drug | EMEM medium | ATCC | Cat #30-2003 | |
| Chemical compound, drug | Emetine | Sigma-Aldrich | Cat #7083-71-8 | |
| Chemical compound, drug | EPITHELIAL CELL MEDIUM-Complete Kit | Science Cell Research | Cat #4101 | |
| Chemical compound, drug | Fetal bovine serum (FBS) | HyClone | Cat #16777-006 | |
| Chemical compound, drug | Glycerol | Sigma-Aldrich | Cat #G5516 | |
| Chemical compound, drug | KVS0001 | This study | N/A | Novel small molecule targeting SMG1 kinase. See ‘Resource availability’ |
| Chemical compound, drug | LY3023414 | Selleckchem | Cat #S8322 | |
| Chemical compound, drug | Matrigel Phenol Red Free Standard Formulation | Corning | Cat #356237 | |
| Chemical compound, drug | MEGM Mammary Epithelial Cell Growth Medium BulletKit | Lonza | Cat #CC3150 | |
| Chemical compound, drug | Methylcellulose | Sigma-Aldrich | Cat #M6385 | |
| Chemical compound, drug | Phosphate-buffered saline (PBS) | Thermo Fisher | Cat #J60465.K2 | |
| Other | Phusion Flash High-Fidelity PCR Master Mix | Thermo Fisher | Cat #F548S | PCR reagent |
| Other | Pierce ECL Western Blotting Substrate | Thermo Fisher | Cat #32106 | Western blot reagent |
| Other | PRIMETIME Gene Expression master mix | Integrated DNA Technologies | Cat #1055770 | Real-time PCR reagent |
| Chemical compound, drug | Protease inhibitor | Millipore Sigma | Cat #4693159001 | |
| Other | QIAshredder | QIAGEN | Cat #79656 | Western blot reagent |
| Recombinant protein | Recombinant IL-2 protein | Prometheus Therapeutics and Diagnostics | Cat #aldesleukin | |
| Recombinant protein | Recombinant IL-7 protein | BioLegend | Cat #581908 | |
| Chemical compound, drug | RediJect D-Luciferin Ultra Bioluminescent Substrate | PerkinElmer | Cat #770505 | |
| Chemical compound, drug | RIPA Lysis and Extraction buffer | Thermo Fisher | Cat #89901 | Western blot and real-time PCR reagent |
| Chemical compound, drug | RNA Later | Invitrogen | Cat #AM7020 | Real-time PCR reagent |
| Chemical compound, drug | RPMI 1640 medium | Gibco | Cat #11875-119 | |
| Chemical compound, drug | Selleckchem Bioactive Compound library (Supplementary file 2) | Selleckchem | Cat #L1700 | |
| Chemical compound, drug | SMG1-specific inhibitor: 11j | Ascendex LLC | N/A | |
| Other | SsoAdvanced Universal SYBR Green Supermix | Bio-Rad | Cat #1725270 | Real-time PCR reagent |
| Chemical compound, drug | Trypsin | Gibco | Cat #25300054 | |
| Commercial assay or kit | AllPrep DNA/RNA Mini Kit | QIAGEN | Cat #80204 | |
| Commercial assay or kit | Agilent RNA ScreenTape | Agilent | Cat #5067-5576 | |
| Commercial assay or kit | Agilent RNA ScreenTape Sample Buffer | Agilent | Cat #5067-5577 | |
| Commercial assay or kit | Agilent RNA Ladder | Agilent | Cat #5067-5578 | |
| Commercial assay or kit | BCA Protein Assay Kit | Thermo Fisher | Cat #23227 | |
| Commercial assay or kit | Bio-Rad SingleShot Cell Lysis kit | Bio-Rad | Cat #1725080 | |
| Commercial assay or kit | ELISA | R&D Systems | Cat #SIF50C | |
| Commercial assay or kit | High-Capacity cDNA Reverse Transcription Kit | Advanced Biosystems | Cat #4368814 | |
| Commercial assay or kit | Illumina RNA library prep kit | Illumina | Cat #RS-122-2001 | |
| Commercial assay or kit | Kinase kinativ assay | ActivX Biosciences | N/A | |
| Commercial assay or kit | Luciferase Assay System | Promega | Cat #E1501 | |
| Commercial assay or kit | RNeasy | QIAGEN | Cat #74104 | |
| Other | Whole transcriptome RNA-seq: NCI-H358 | This study | FASTQ files for RNA-seq. Available on Dryad | |
| Other | Whole transcriptome RNA-seq: LS180 | This study | FASTQ files for RNA-seq. Available on Dryad | |
| Other | Whole transcriptome RNA-seq: Isogenic knockout cell lines | Cook et al., 2022 | EGAD00001008559 | FASTQ files for RNA-seq. Available on EGA database |
| Cell Line (murine) | B16-F10 | ATCC | Cat #CRL-6475, RRID:CVCL_0159 | |
| Cell Line (Human) | HEK293T | ATCC | Cat #CRL-3216, RRID:CVCL_0063 | |
| Cell Line (murine) | Lewis lung carcinoma (LLC) | ATCC | Cat #CRL-1642, RRID:CVCL_4358 | |
| Cell Line (Human) | LS180 | ATCC | Cat #CL-187, RRID:CVCL_0397 | |
| Cell Line (Human) | MCF10a | ATCC | Cat #CRL-10317, RRID:CVCL_0598 | |
| Cell Line (Human) | NCI-H716 | ATCC | Cat #CCL-251, RRID:CVCL_1581 | |
| Cell Line (Human) | NCI-H2228 | ATCC | Cat #CRL-5935, RRID:CVCL_1543 | |
| Cell Line (Human) | NCI-H358 | ATCC | Cat #CRL-5807, RRID:CVCL_1559 | |
| Cell Line (murine) | Renca | ATCC | Cat #CRL-2947, RRID:CVCL_2174 | |
| Cell Line (Human) | RPE1 | ATCC | Cat #CRL-4000, RRID:CVCL_4388 | |
| Cell Line (Human) | RPE1 STAG2 2 | Cook et al., 2022 | N/A | |
| Cell Line (Human) | RPE1 STAG2 5 | Cook et al., 2022 | N/A | |
| Cell Line (Human) | RPE1 STAG2 6 | Cook et al., 2022 | N/A | |
| Cell Line (Human) | RPE1 STAG2 8 | Cook et al., 2022 | N/A | |
| Cell Line (Human) | RPE1 TP53 221 | Cook et al., 2022 | N/A | |
| Cell Line (Human) | RPE1 TP53 223 | Cook et al., 2022 | N/A | |
| Cell Line (Human) | RPE1 TP53 224 | Cook et al., 2022 | N/A | |
| Cell Line (Human) | RPTec | ATCC | Cat #CRL-4031, RRID:CVCL_K278 | |
| Cell Line (Human) | RPTec STAG2 3 | Cook et al., 2022 | N/A | |
| Cell Line (Human) | RPTec STAG2 943 | Cook et al., 2022 | N/A | |
| Cell Line (Human) | RPTec STAG2 943A | Cook et al., 2022 | N/A | |
| Cell Line (Human) | RPTec STAG2 944 | Cook et al., 2022 | N/A | |
| Cell Line (Human) | RPTec STAG2 945 | Cook et al., 2022 | N/A | |
| Cell Line (Human) | RPTec STAG2 946 | Cook et al., 2022 | N/A | |
| Cell Line (Human) | RPTec STAG2 947 | Cook et al., 2022 | N/A | |
| Cell Line (Human) | RPTec STAG2 951 | Cook et al., 2022 | N/A | |
| Cell Line (Human) | RPTec STAG2 952 | Cook et al., 2022 | N/A | |
| Cell Line (Human) | RPTec STAG2 953 | Cook et al., 2022 | N/A | |
| Cell Line (Human) | RPTec TP53 544 | Cook et al., 2022 | N/A | |
| Cell Line (Human) | RPTec TP53 588 | Cook et al., 2022 | N/A | |
| Strain, strain background (Mus musculus, female) | BALB/cAnAHsd | Harlan Laboratories | ||
| Strain, strain background (M. musculus, female) | C57BL/6NCrl | Charles River GmbH | ||
| Strain, strain background (M. musculus, female) | BALB/cAnNCrl | Charles River GmbH | ||
| Strain, strain background (M. musculus, female) | Hsd:Athymic Nude-Foxn1nu | Harlan Laboratories | ||
| Strain, strain background (M. musculus, female) | NOD.Cg-Prkdcscid Il2rgtm1Wjl/SzJ (NSG) | Jackson Laboratories | ||
| Recombinant DNA reagent | for Primers see Supplementary file 6 | This study | N/A | |
| Recombinant DNA reagent | HTS Screen sequencing primer: STAG2 Seq Forward: AATGATACGGCGACCACCGAGATCTACACTCTTTCCCTACACGACGCTCTTCCGATCTNNNNNNNNGAAT TTCTCTACAAAAAGCTCTTCA | This study | N/A | Used in high-throughput screen to amplify STAG2 CRISPR mutation site |
| Recombinant DNA reagent | HTS Screen sequencing primer: STAG2 Seq Reverse: CAAGCAGAAGACGGCATACGAGATNNNNNNNNNNTTCATCATTCCATCCTCCTC | This study | N/A | Used in high-throughput screen to amplify STAG2 CRISPR mutation site |
| Recombinant DNA reagent | HTS Screen sequencing primer: TP53 Seq Forward: AATGATACGGCGACCACCGAGATCTACACTCTTTCCCTACACGACGCTCTTCCGATCTNNNNNNNN GAAACTACTTCCTG AAAACAACGT | This study | N/A | Used in high-throughput screen to amplify TP53 CRISPR mutation site |
| Recombinant DNA reagent | HTS Screen sequencing primer: TP53 Seq Reverse: CAAGCAGAAGACGGCATACGAGATN NNNNNNNNNGCTTCATC TGGACCTGGGTC | This study | N/A | Used in high-throughput screen to amplify TP53 CRISPR mutation site |
| Recombinant DNA reagent | ON-TARGETplus Human UPF1 siRNA Smartpool 10 nmol | Horizon Discovery | Cat #L-011763-00-0010 | |
| Recombinant DNA reagent | ON-TARGETplus Human mTOR siRNA Smartpool 10 nmol | Horizon Discovery | Cat #L-003008-00-0010 | |
| Recombinant DNA reagent | ON-TARGETplus Human ATM siRNA Smartpool 10 nmol | Horizon Discovery | Cat #L-003201-00-0010 | |
| Recombinant DNA reagent | ON-TARGETplus Human ATR siRNA Smartpool 10 nmol | Horizon Discovery | Cat #L-003202-00-0010 | |
| Recombinant DNA reagent | SMARTpool: ON-TARGETplus SMG1 siRNA | Horizon Discovery | Cat #L-005033-00-0020 | |
| Recombinant DNA reagent | SMARTpool: ON-TARGETplus PRKDC siRNA | Horizon Discovery | Cat #L-005030-00-0010 | |
| Recombinant DNA reagent | SMARTpool: ON-TARGETplus PIK3CA siRNA | Horizon Discovery | Cat #L-003018-00-0010 | |
| Recombinant DNA reagent | ON-TARGETplus Non-targeting Pool | Horizon Discovery | Cat #D-001810-10 | |
| Recombinant DNA reagent | Phage display library | GeneArt | N/A | |
| Software, algorithm | HISAT2 (version 2.0.5) | Kim et al., 2019 | N/A | |
| Software, algorithm | StringTie (version 1.3.3) | Pertea et al., 2016 | N/A | |
| Software, algorithm | Ballgown (version 2.6.0) | Pertea et al., 2016 | N/A | |
| Software, algorithm | R (version 4.0.3) | R Development Core Team, 2022 | N/A | |
| Software, algorithm | ggplot (version 3.4.1) | Wickham, 2016 | N/A | |
| Software, algorithm | Pipeline for analyzing mutant and normal transcript abundance | MSSQL was used for initial data processing | N/A |
Additional files
-
Supplementary file 1
Summary of cell lines used in this manuscript and their origin.
- https://cdn.elifesciences.org/articles/95952/elife-95952-supp1-v1.xlsx
-
Supplementary file 2
Selleck Chem Library compounds used for the nonsense-mediated decay (NMD) high-throughput screen (HTS screen).
- https://cdn.elifesciences.org/articles/95952/elife-95952-supp2-v1.xlsx
-
Supplementary file 3
Structures of novel nonsense-mediated decay (NMD; SMG1) inhibitors designed for this study.
- https://cdn.elifesciences.org/articles/95952/elife-95952-supp3-v1.xlsx
-
Supplementary file 4
List of kiNativ assay results for all kinase proteins tested at three concentrations of KVS0001.
- https://cdn.elifesciences.org/articles/95952/elife-95952-supp4-v1.xlsx
-
Supplementary file 5
Mutations found in LLC and RENCA murine tumors.
- https://cdn.elifesciences.org/articles/95952/elife-95952-supp5-v1.xlsx
-
Supplementary file 6
List of primers used in this study with sequences.
- https://cdn.elifesciences.org/articles/95952/elife-95952-supp6-v1.xlsx
-
MDAR checklist
- https://cdn.elifesciences.org/articles/95952/elife-95952-mdarchecklist1-v1.pdf
Download links
A two-part list of links to download the article, or parts of the article, in various formats.
Downloads (link to download the article as PDF)
Open citations (links to open the citations from this article in various online reference manager services)
Cite this article (links to download the citations from this article in formats compatible with various reference manager tools)
Identification of nonsense-mediated decay inhibitors that alter the tumor immune landscape
eLife 13:RP95952.
https://doi.org/10.7554/eLife.95952.3


