Allosteric modulation by the fatty acid site in the glycosylated SARS-CoV-2 spike
- Centre for Computational Chemistry, School of Chemistry, University of Bristol, United Kingdom
- School of Chemistry, University of Bristol, United Kingdom
- Department of Chemistry and Biochemistry, University of California San Diego, United States
- School of Biochemistry, University of Bristol, United Kingdom
- Max Planck Bristol Centre for Minimal Biology, School of Chemistry, United Kingdom
- School of Cellular and Molecular Medicine, University of Bristol, University Walk, United Kingdom
- Department of Molecular Biology, University of California San Diego, United States
Figures
Figure 1
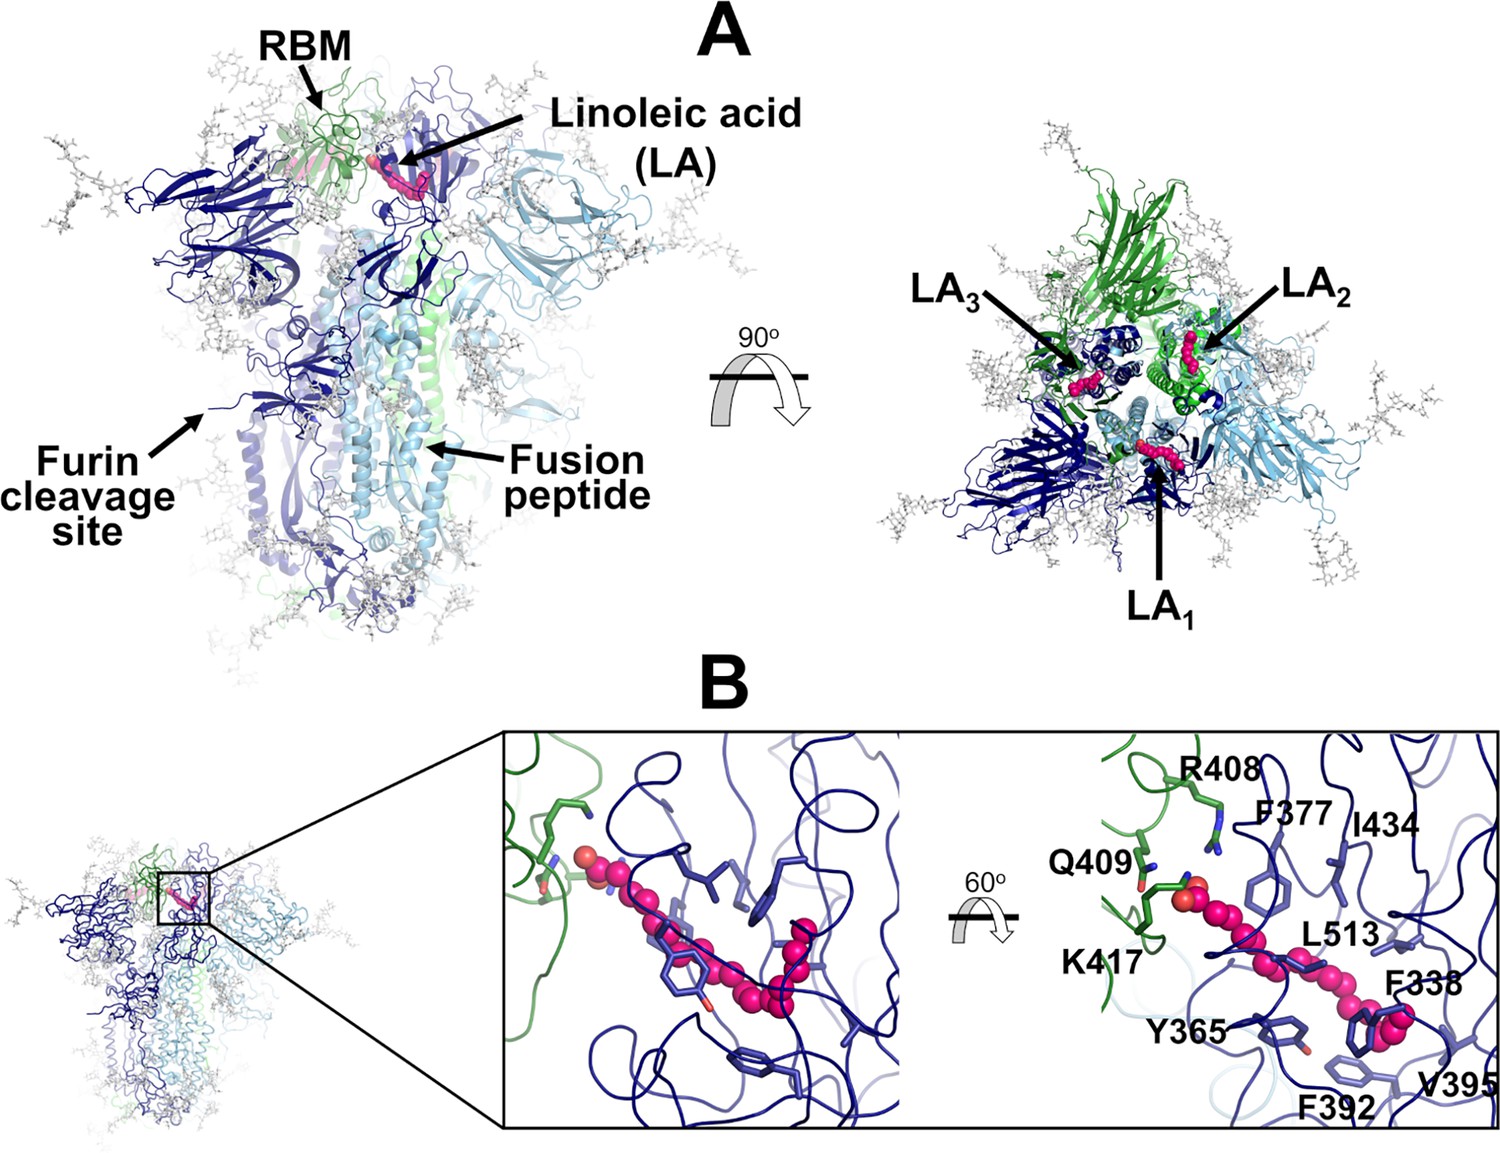
Structure of the glycosylated head region of the ancestral SARS-CoV-2 spike with linoleate (LA) bound to the free fatty acid (FA) binding site.
(A) Model of the ectodomain of the glycosylated SARS-CoV-2 spike with LA bound. The spike-LA complex model was built using the cryo-EM structure 7JJI as a reference (Bangaru et al., 2020). Each monomer in the spike homotrimer is shown in a different colour: dark blue, light blue, and green. Glycans are indicated with grey sticks, and LA molecules are highlighted with magenta spheres. Three FA binding sites exist in the trimer, each located at the interface between two neighbouring monomers. In this model, all three receptor-binding motifs (RBMs) are in the ‘down’ conformation, and the protein is cleaved at the furin recognition site at the S1/S2 interface. (B) Detailed view of the FA binding site. This hydrophobic site is formed by two receptor-binding domains (RBDs), with one providing the hydrophobic pocket for the FA hydrocarbon tail and the other providing polar (Q409) and positively charged (R408 and K417) residues to bind the negatively charged FA headgroup.
Figure 2 with 3 supplements
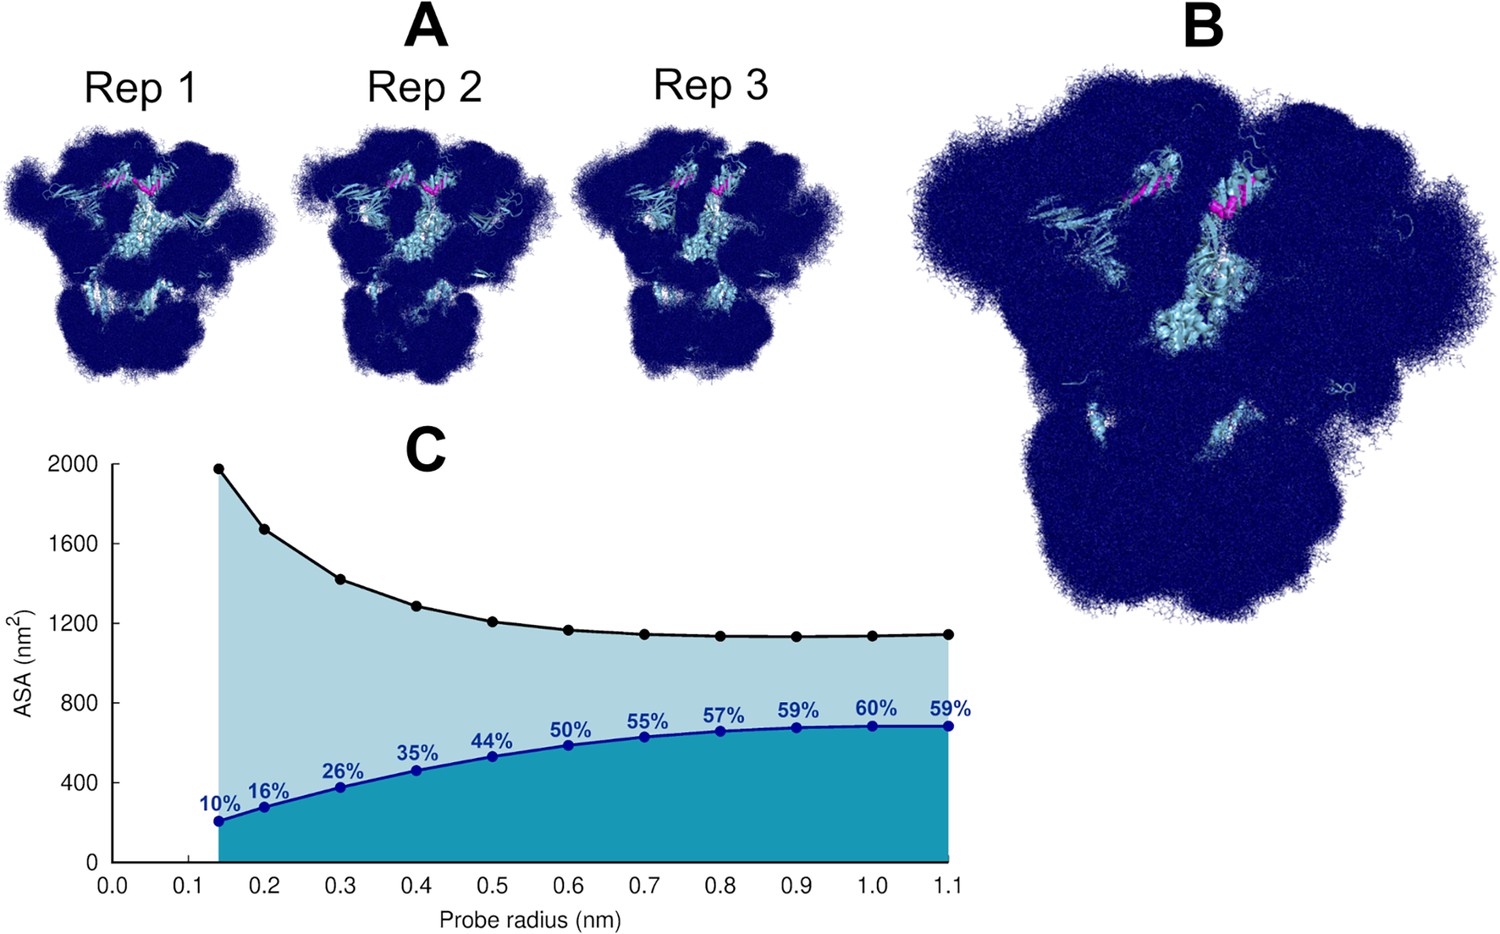
Glycan shielding of the spike.
(A) Overlapping of the conformations adopted by the glycans during the simulation for each individual replica. The position of the glycans in 376 frames (one frame every 2 ns) are shown with dark blue sticks. (B) Overlapping of the glycan conformations in all three replicas (in a total of 1128 frames). The protein is shown as a light blue cartoon whereas the glycans are the dark blue sticks. The magenta spheres represent the linoleate (LA) molecules. (C) Solvent accessible surface area of the protein and the area shielded by glycans at multiple probe radii. The probe radius ranges from 0.14 nm (corresponding to a water molecule) to 1.1 nm (corresponding to a small antibody molecule). The values are averaged across all replicas. The area shielded by the glycans corresponds to the dark blue line, whereas the black line represents the accessible surface area of the protein without glycans (similarly to e.g. Oliveira et al., 2021b; Casalino et al., 2020).
Figure 2—figure supplement 1
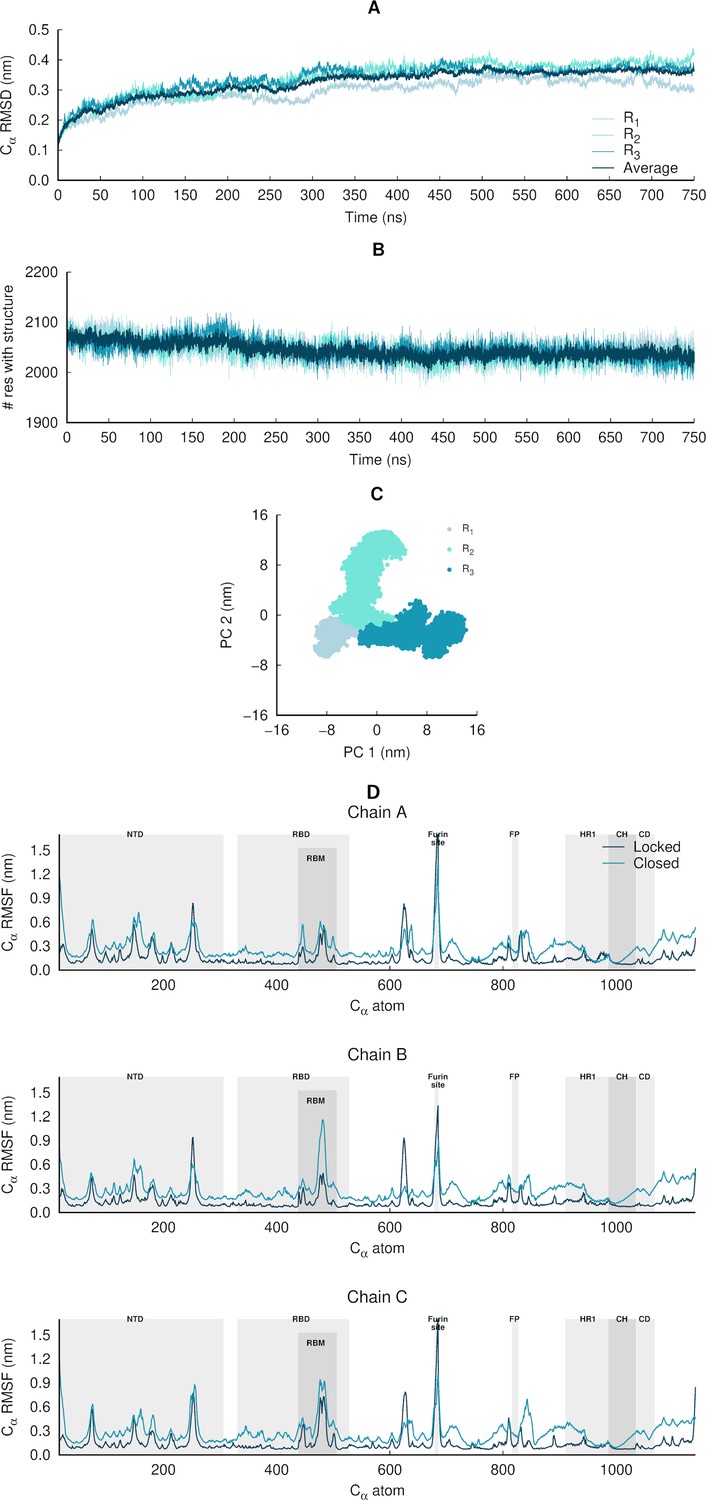
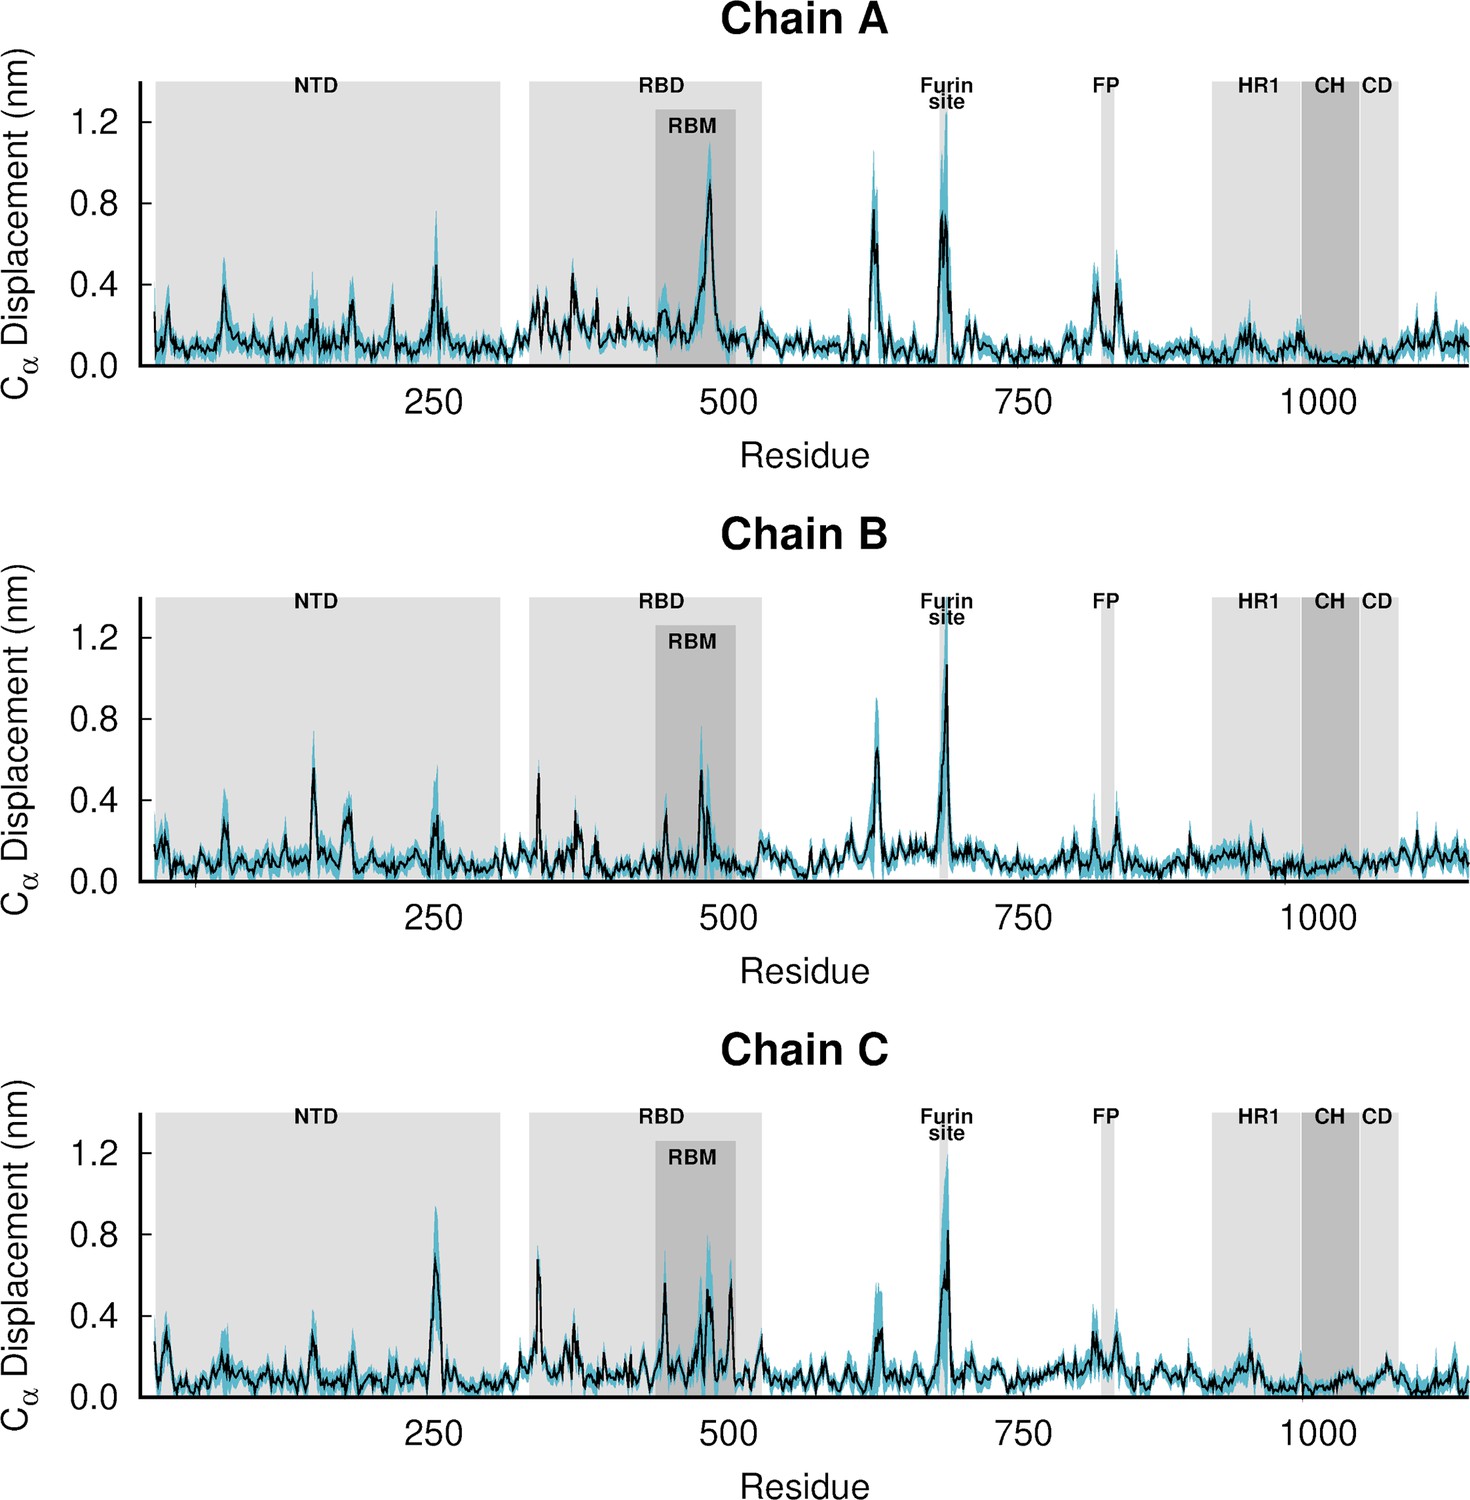
Structural stability, equilibration, and sampling of the equilibrium simulations of the glycosylated SARS-CoV-2 ancestral spike.
(A) Temporal evolution of the Cα root mean square deviations (RMSD) relative to the starting structure. The dark blue line corresponds to the average Cα RMSD, averaged over all three replicate simulations (namely R1, R2, and R3). These results indicate that the systems are stable over the simulation time. (B) Time evolution of the spike’s secondary structure content (assigned by DSSP; Kabsch and Sander, 1983), showing numbers of residues assigned to α-helix, 310-helix, 5-helix, β-sheet, and β-bridge secondary structure classes. The light blue lines correspond to the time evolution of the number of residues with secondary structure in the individual replicate simulations, whereas the dark blue line corresponds to the average number of residues over all three replicates. (C) Principal component analysis (PCA) of the three replicates, for all Cα atoms. All replicates were combined for the PCA, with one conformation per 100 ps per replicate (in a total of 22,501 frames). (D) Average Cα root mean square fluctuations (RMSF) for the glycosylated ancestral spike in the locked (with linoleate [LA] bound) and closed (without LA) states. The Cα RMSF was calculated using the entire equilibrium trajectories and averaged across all replicates for each state (three replicates for locked spike and three for the closed one). The trajectories for the closed glycosylated spike were taken from Casalino et al., 2020. The grey boxes identify key regions in the protein, namely the N-terminal domain (NTD), receptor-binding domain (RBD), receptor-binding motif (RBM), fusion peptide (FP), heptad repeat 1 (HR1), central helix (CH), connector domain (CD). Please note that the fusion-peptide proximal region (FPPR) is situated immediately before the FP. Please zoom in on the image for detailed visualisation.
Figure 2—figure supplement 2
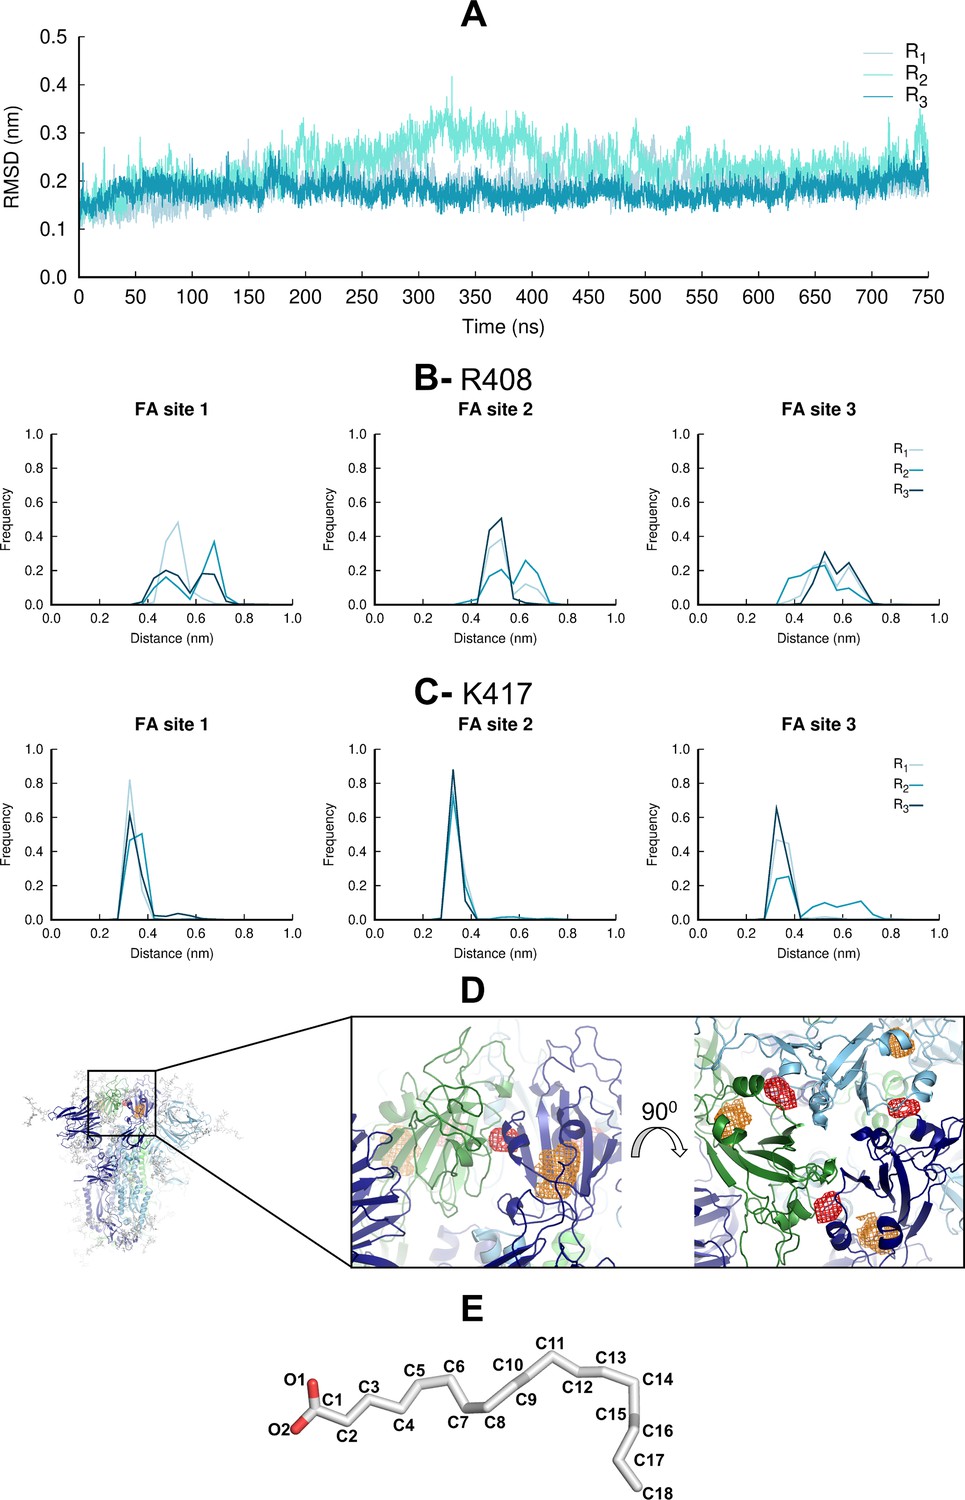
Motions and interactions of the linoleate (LA) molecules during the equilibrium molecular dynamics (MD) simulations.
(A) Average root mean square deviations (RMSD) of the LA molecules for each replica relative to the starting model. The RMSD values are the average over the three LA molecules. No LA molecule exits the fatty acid (FA) site during the equilibrium MD simulations, consistent with high-affinity binding at this site (Toelzer et al., 2020; Shoemark et al., 2021). (B and C) Distributions of the distances between the negatively charged carboxylate group of LA and the positively charged sidechain of R408 (B) and K417 (C) in each FA site. (D) Probability density maps (with a 0.00001 Å–3 contour) for the carboxylate carbon C1 (red mesh) and the aliphatic carbon C18 (orange mesh). See panel E for FA structure and atom label. The probability density maps were determined using 7501 frames per replicate. The structure used as the starting point for the simulations is shown with cartoon. Each monomer in the spike homotrimer is shown in a different colour: dark blue, light blue, and green. (E) Structure of LA, with labels in all nonhydrogen atoms.
Figure 2—figure supplement 3
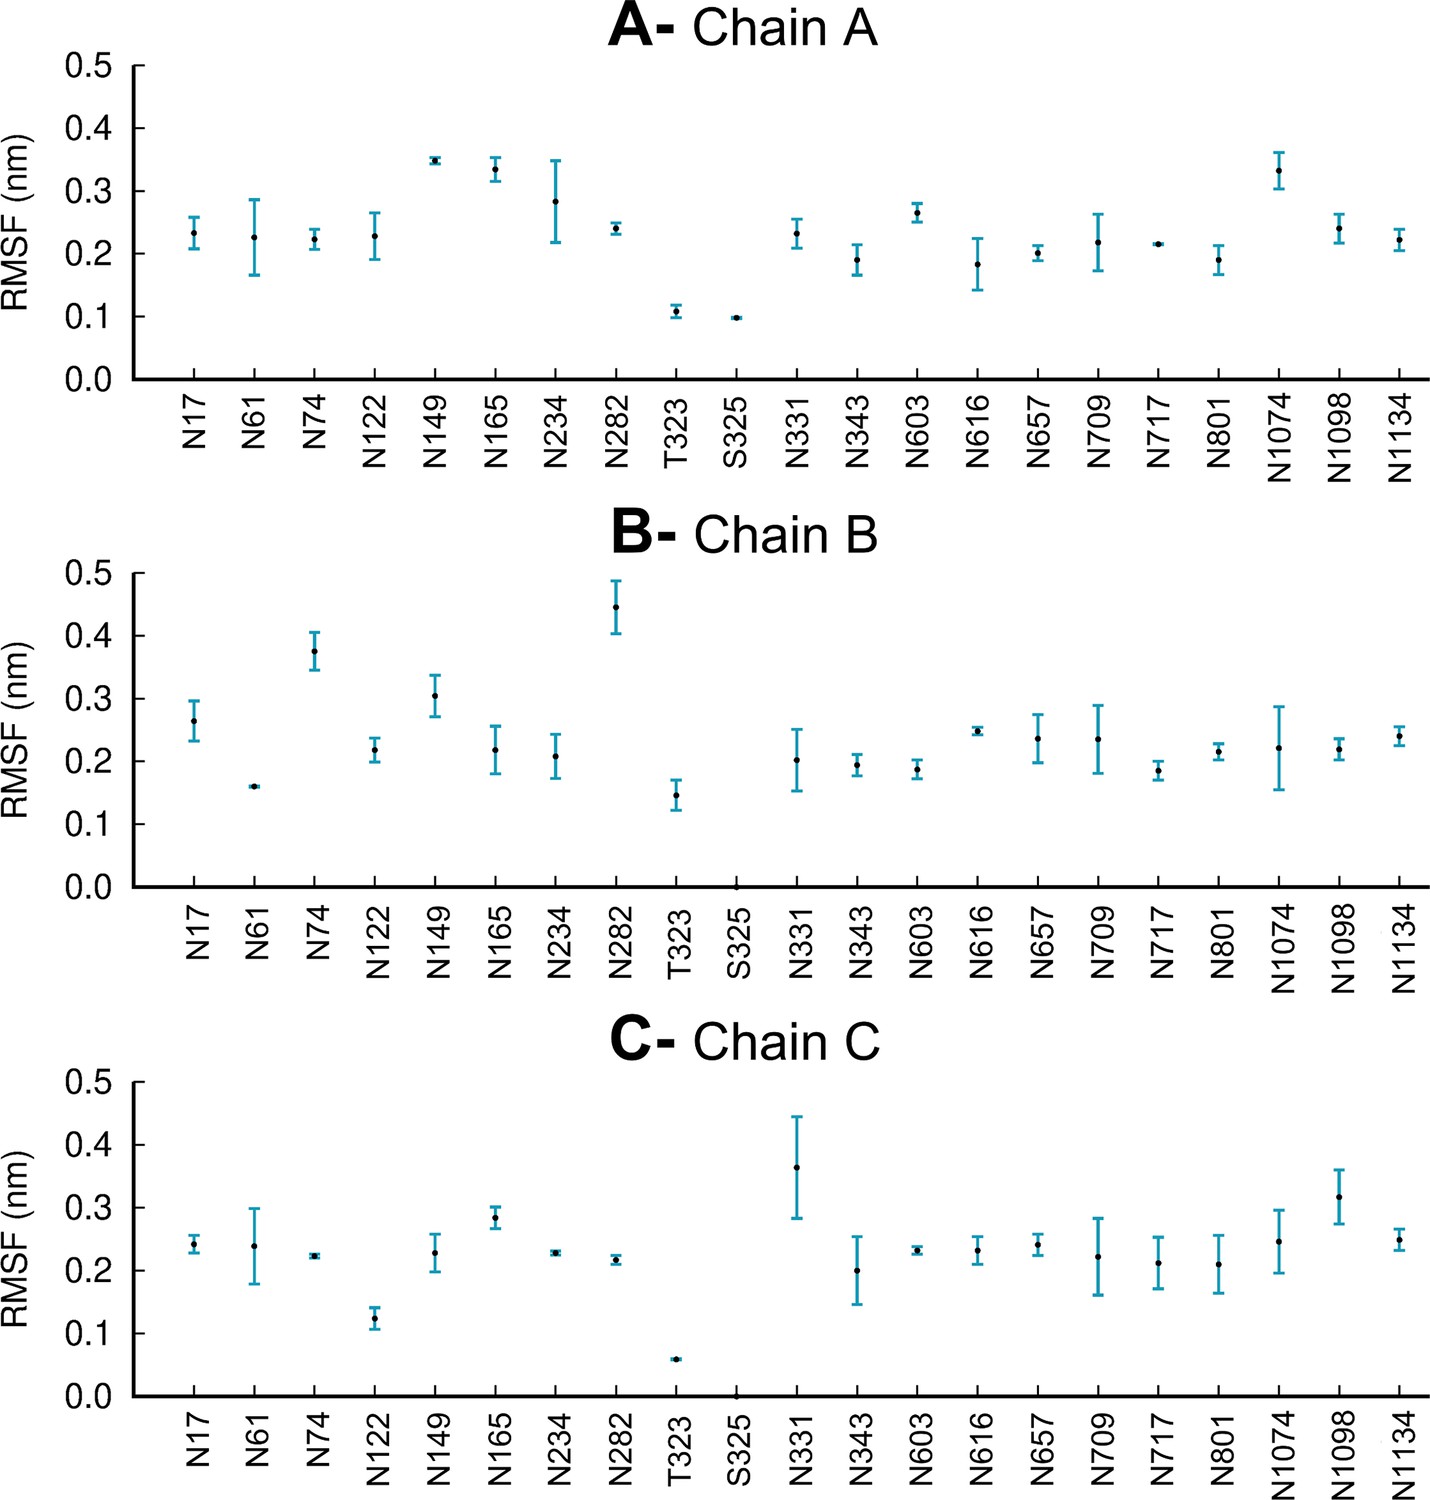
Average root mean square fluctuations (RMSF) of each glycan for chains A (A), B (B), and C (C) over the three replicate equilibrium molecular dynamics (MD) simulations.
The vertical blue lines represent one standard deviation. Note that glycosylation site S325 is only occupied in chain A, with no glycans present in this site in chains B and C, similarly to Casalino et al., 2020.
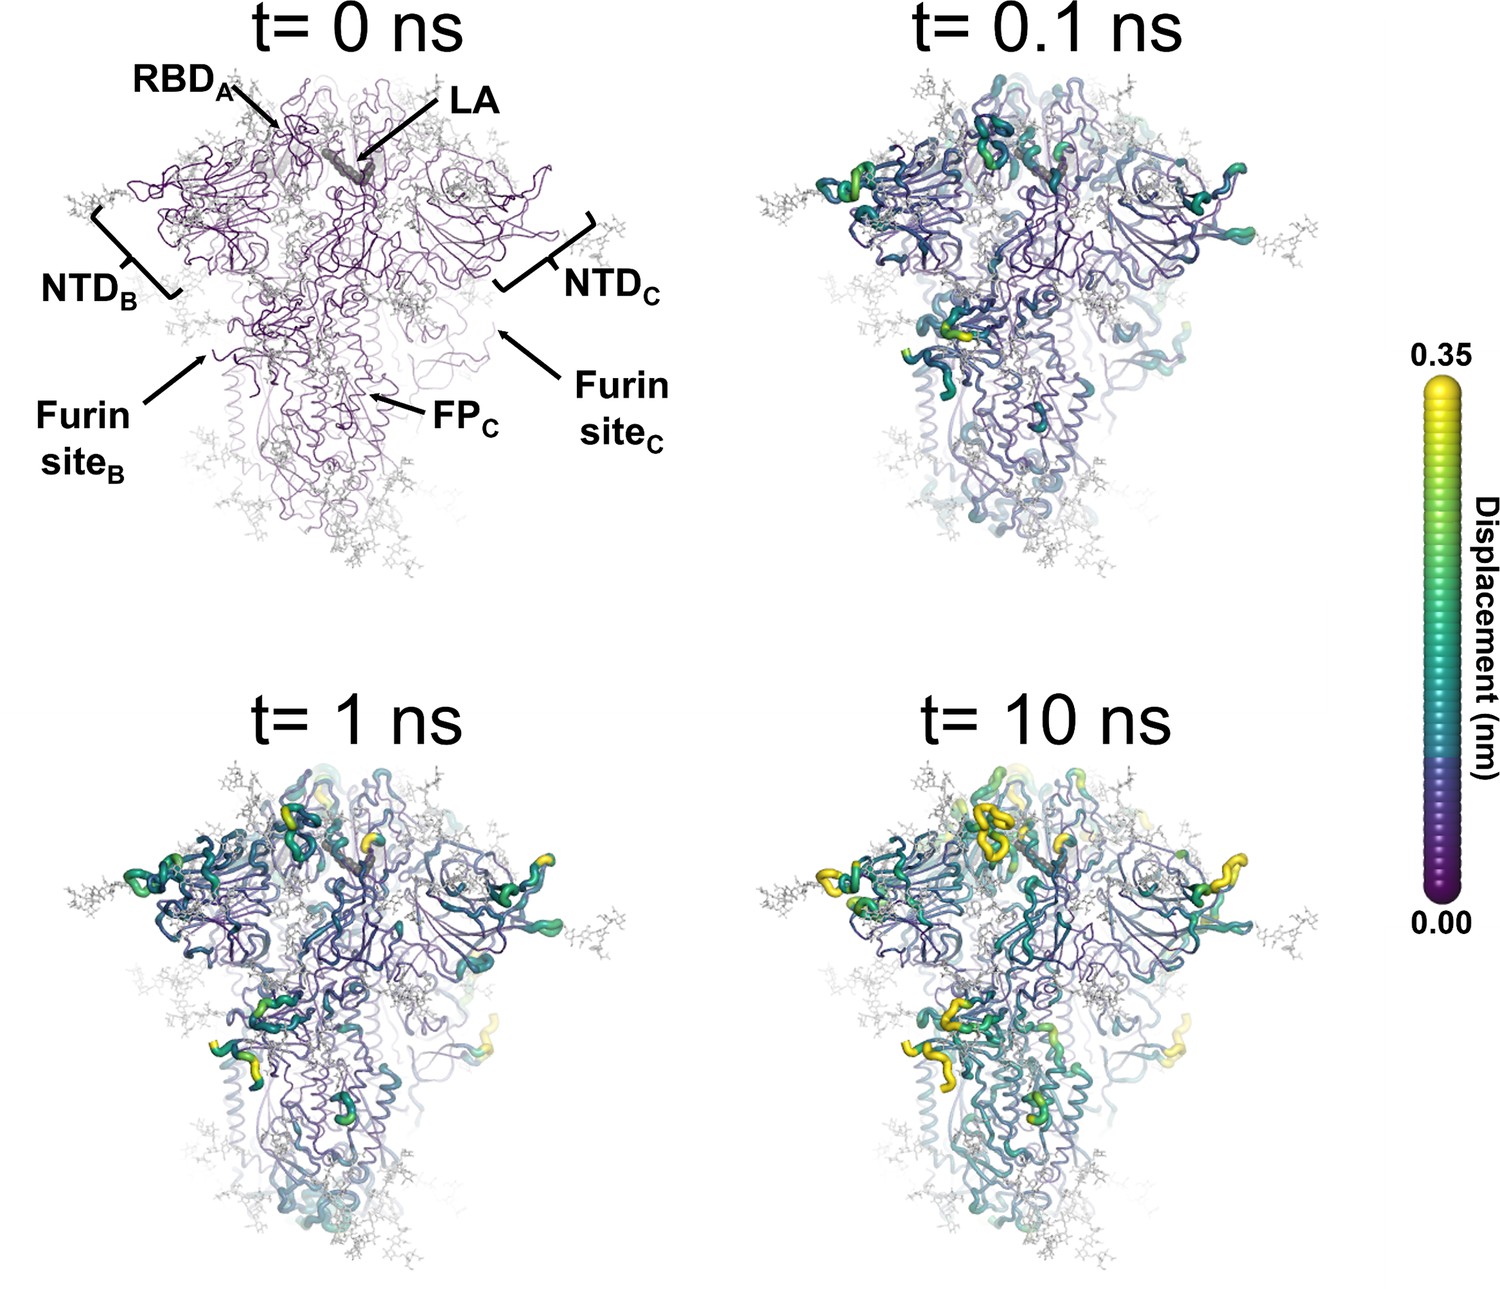
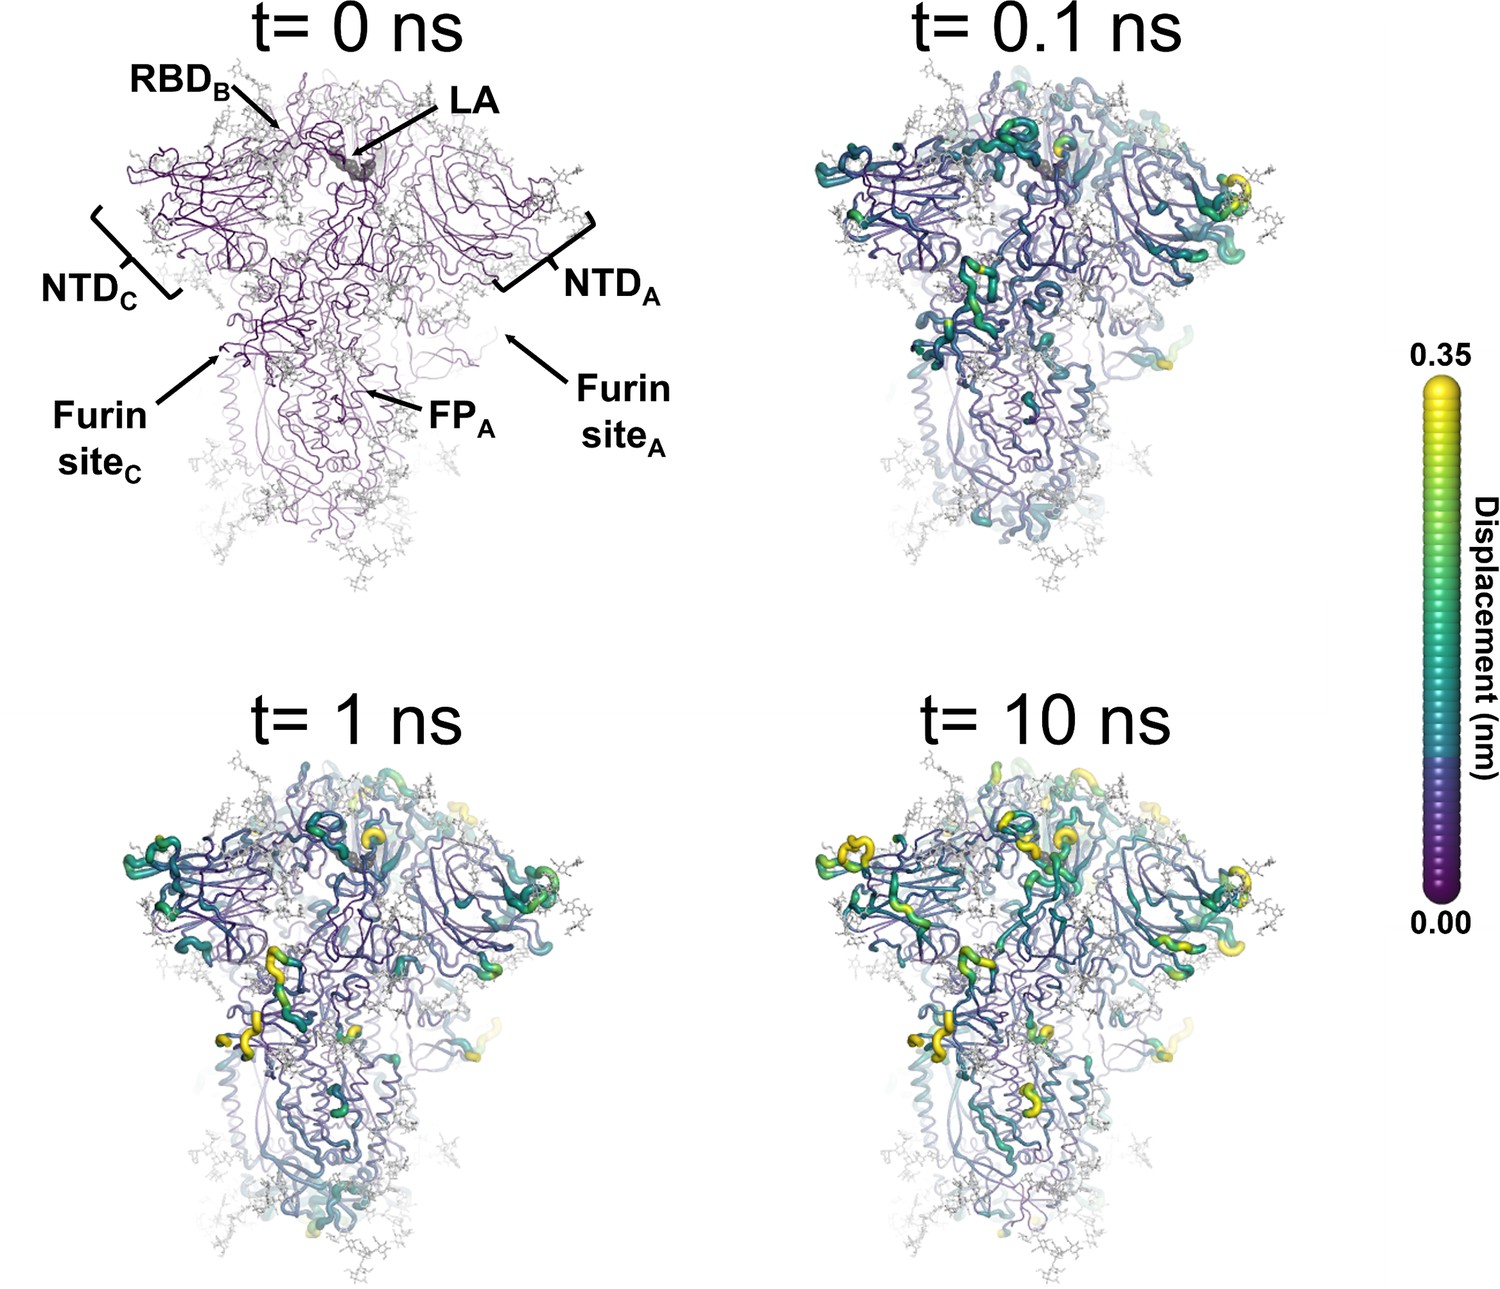
Figure 3 with 8 supplements
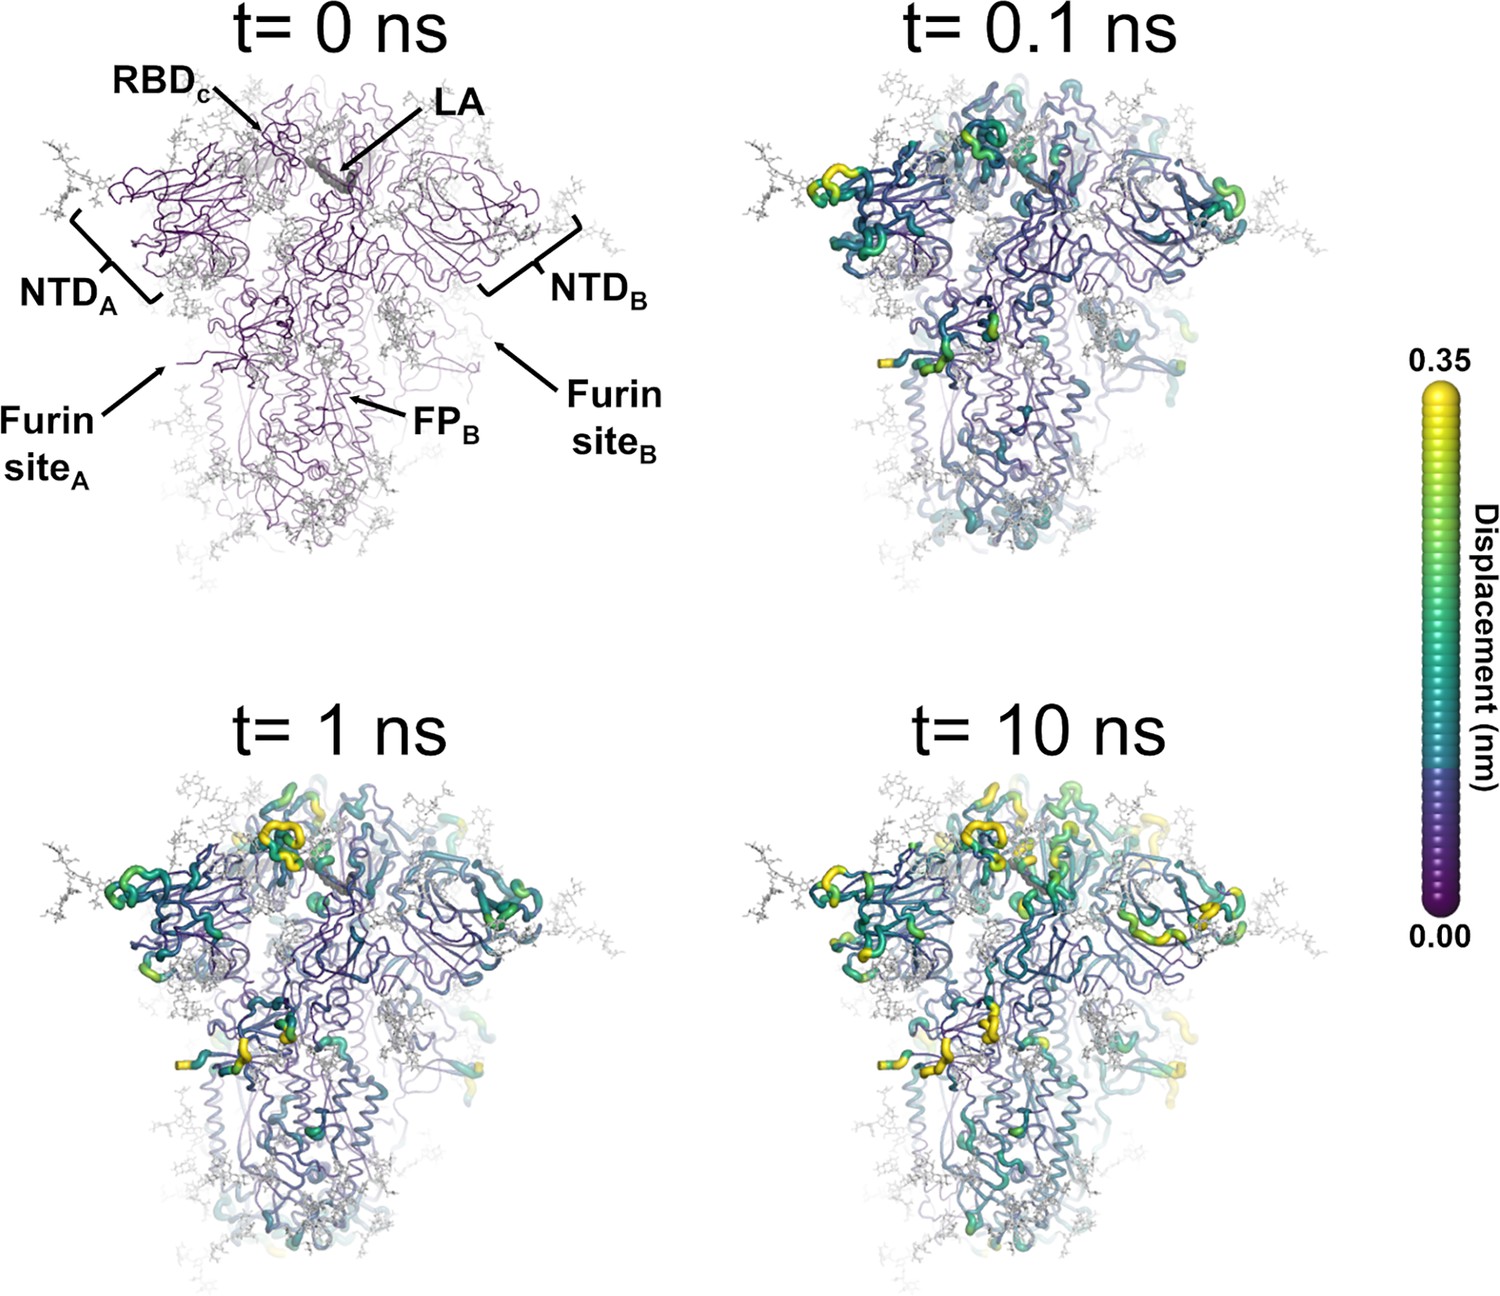
Structural response of the glycosylated spike to linoleate (LA) removal.
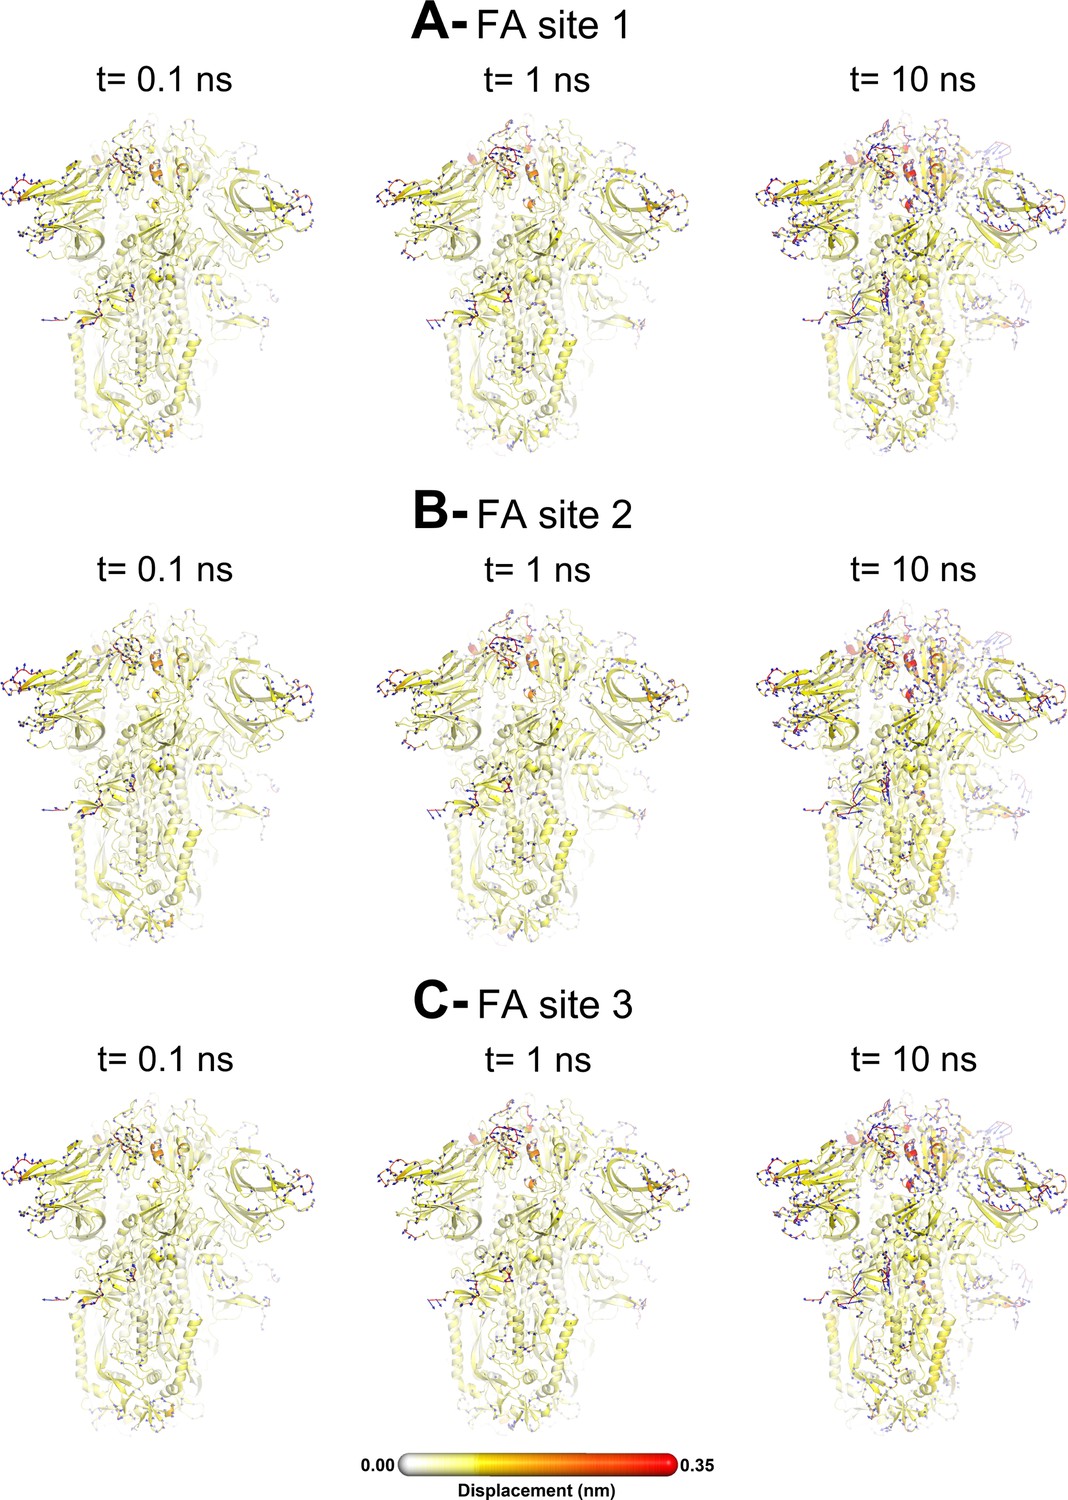
The average Cα displacements 0.1, 1, and 10 ns after LA removal from the fatty acid (FA) binding sites are shown, mapped onto the starting structure for the equilibrium simulations. The norm of the average Cα displacement vector between the dynamical nonequilibrium molecular dynamics (D-NEMD) apo and equilibrium LA-bound simulations was calculated for each residue using the Kubo-Onsager relation (Oliveira et al., 2021a; Ciccotti and Ferrario, 2016; Ciccotti et al., 1979; Ciccotti, 1991). The final displacement values are the averages obtained over the 210 pairs of simulations (Figure 3—figure supplement 1, Figure 3—figure supplement 2, Figure 3—figure supplement 3). The cartoon thickness and structure colours (scale on the right) indicate the average Cα-positional displacement. Each receptor-binding domain (RBD), N-terminal domain (NTD), furin site, and fusion peptide (FP) are subscripted with their chain ID (A, B, or C). Glycans are shown as light grey sticks, whereas the dark grey spheres highlight the position of the LA molecule. The FA site shown in this figure is FA site 1, which is located at the interface between chains C and A (see Figure 3—figure supplement 5, Figure 3—figure supplement 6 for the protein responses from the viewpoint of FA sites 2 and 3, respectively). The responses of all three FA sites are qualitatively similar, with the same motifs and sequence of events observed.
Figure 3—figure supplement 1
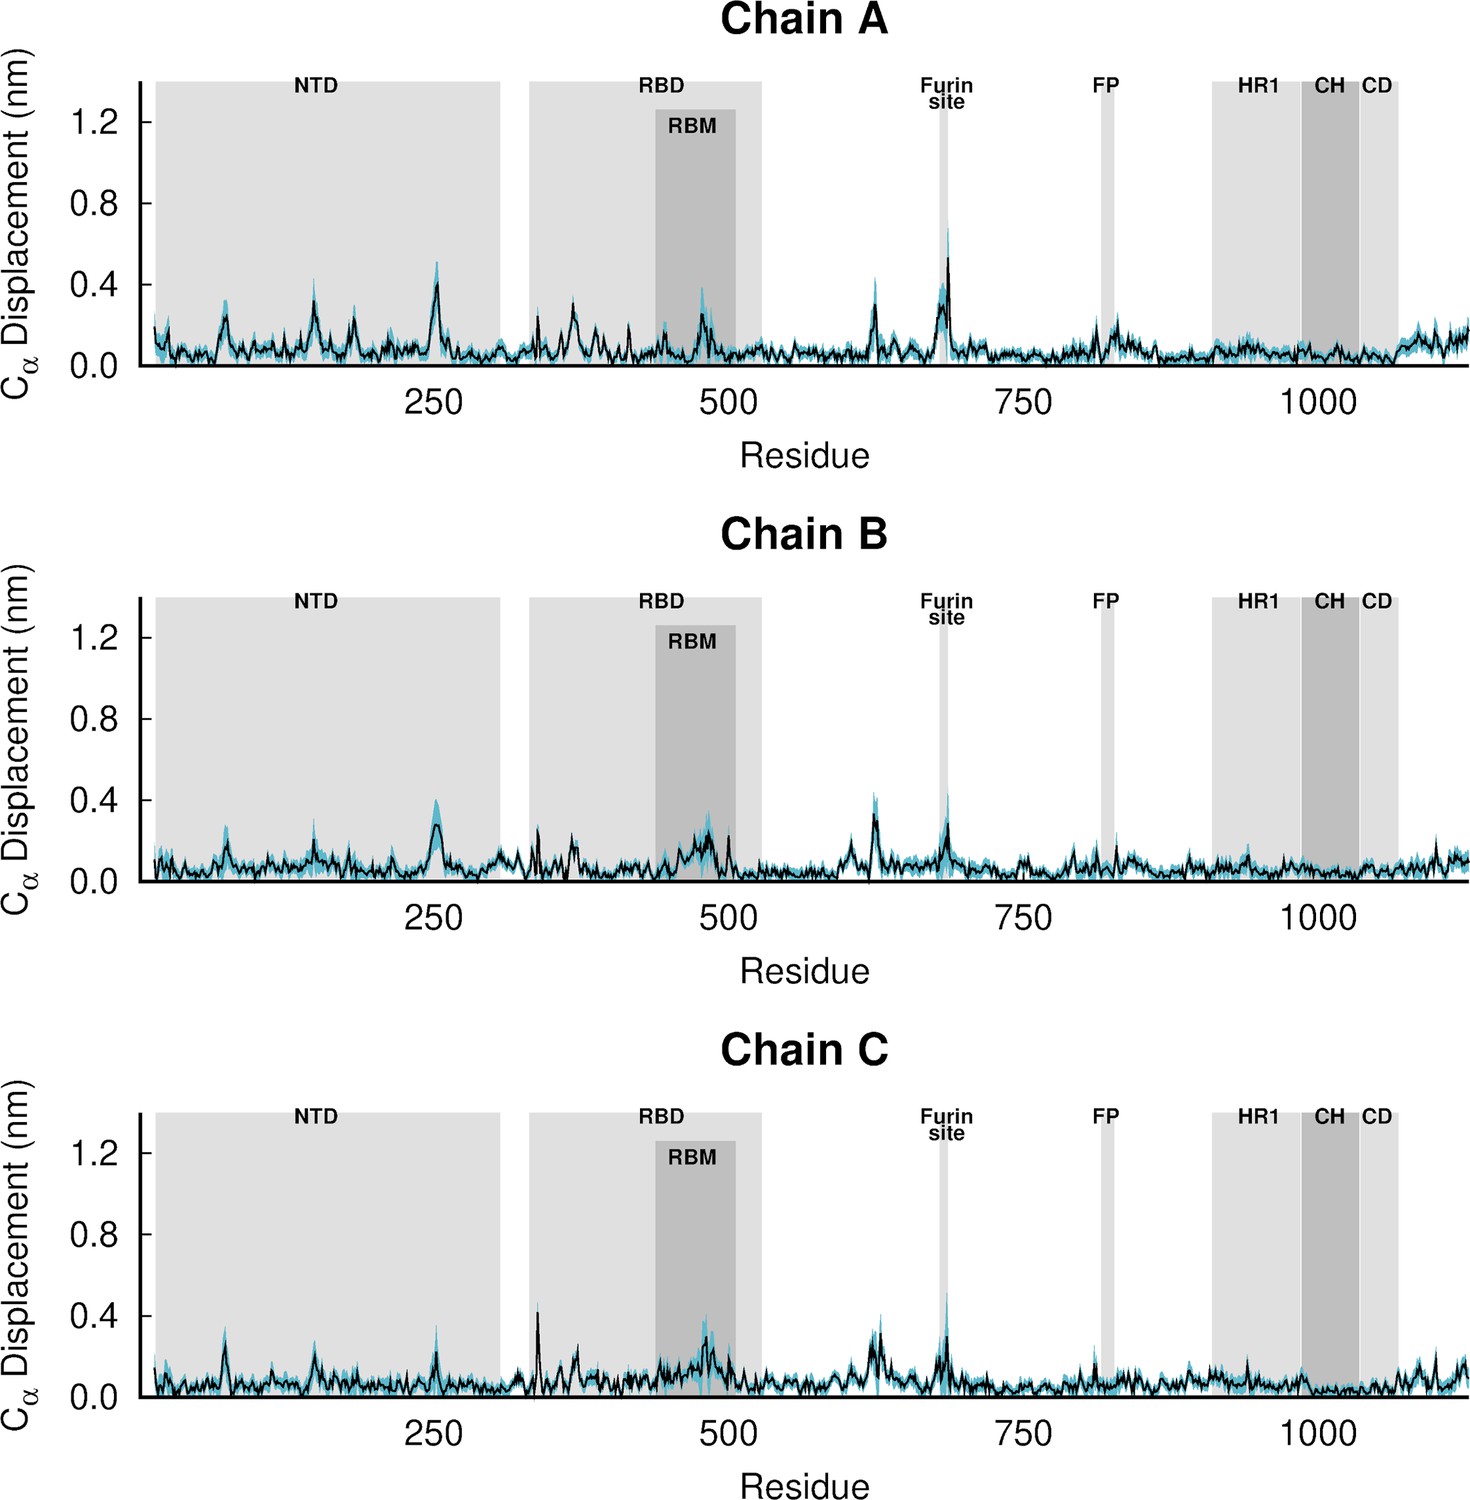
Dynamical nonequilibrium molecular dynamics (D-NEMD) average Cα-positional displacement and corresponding standard errors 0.1 ns after linoleate (LA) removal from the fatty acid (FA) sites.
The average deviations were determined using the Kubo-Onsager relation (Oliveira et al., 2021a; Ciccotti and Ferrario, 2016; Ciccotti et al., 1979; Ciccotti, 1991) for the pairwise comparison between the nonequilibrium apo and equilibrium LA-bound simulations. The averages were calculated over the 210 pairs of simulations. The light blue shaded region represents the standard error of the mean. The positions of some key structural motifs are highlighted in grey, namely the N-terminal domain (NTD), receptor-binding domain (RBD), receptor-binding motif (RBM), fusion peptide (FP), heptad repeat 1 (HR1), central helix (CH), connector domain (CD). Please note that the fusion-peptide proximal region (FPPR) is situated immediately before the FP. Please zoom in on the image for detailed visualisation.
Figure 3—figure supplement 2
Dynamical nonequilibrium molecular dynamics (D-NEMD) average Cα-positional displacement and corresponding standard errors 1 ns after linoleate (LA) removal from the fatty acid (FA) sites.
The average deviations were determined using the Kubo-Onsager relation (Oliveira et al., 2021a; Ciccotti and Ferrario, 2016; Ciccotti et al., 1979; Ciccotti, 1991) for the pairwise comparison between the nonequilibrium apo and equilibrium LA-bound simulations. The averages were calculated over the 210 pairs of simulations. The light blue shaded region represents the standard error of the mean. The positions of some key structural motifs are highlighted in grey, namely the N-terminal domain (NTD), receptor-binding domain (RBD), receptor-binding motif (RBM), fusion peptide (FP), heptad repeat 1 (HR1), central helix (CH), connector domain (CD). Please note that the fusion-peptide proximal region (FPPR) is situated immediately before the FP. Please zoom in on the image for detailed visualisation.
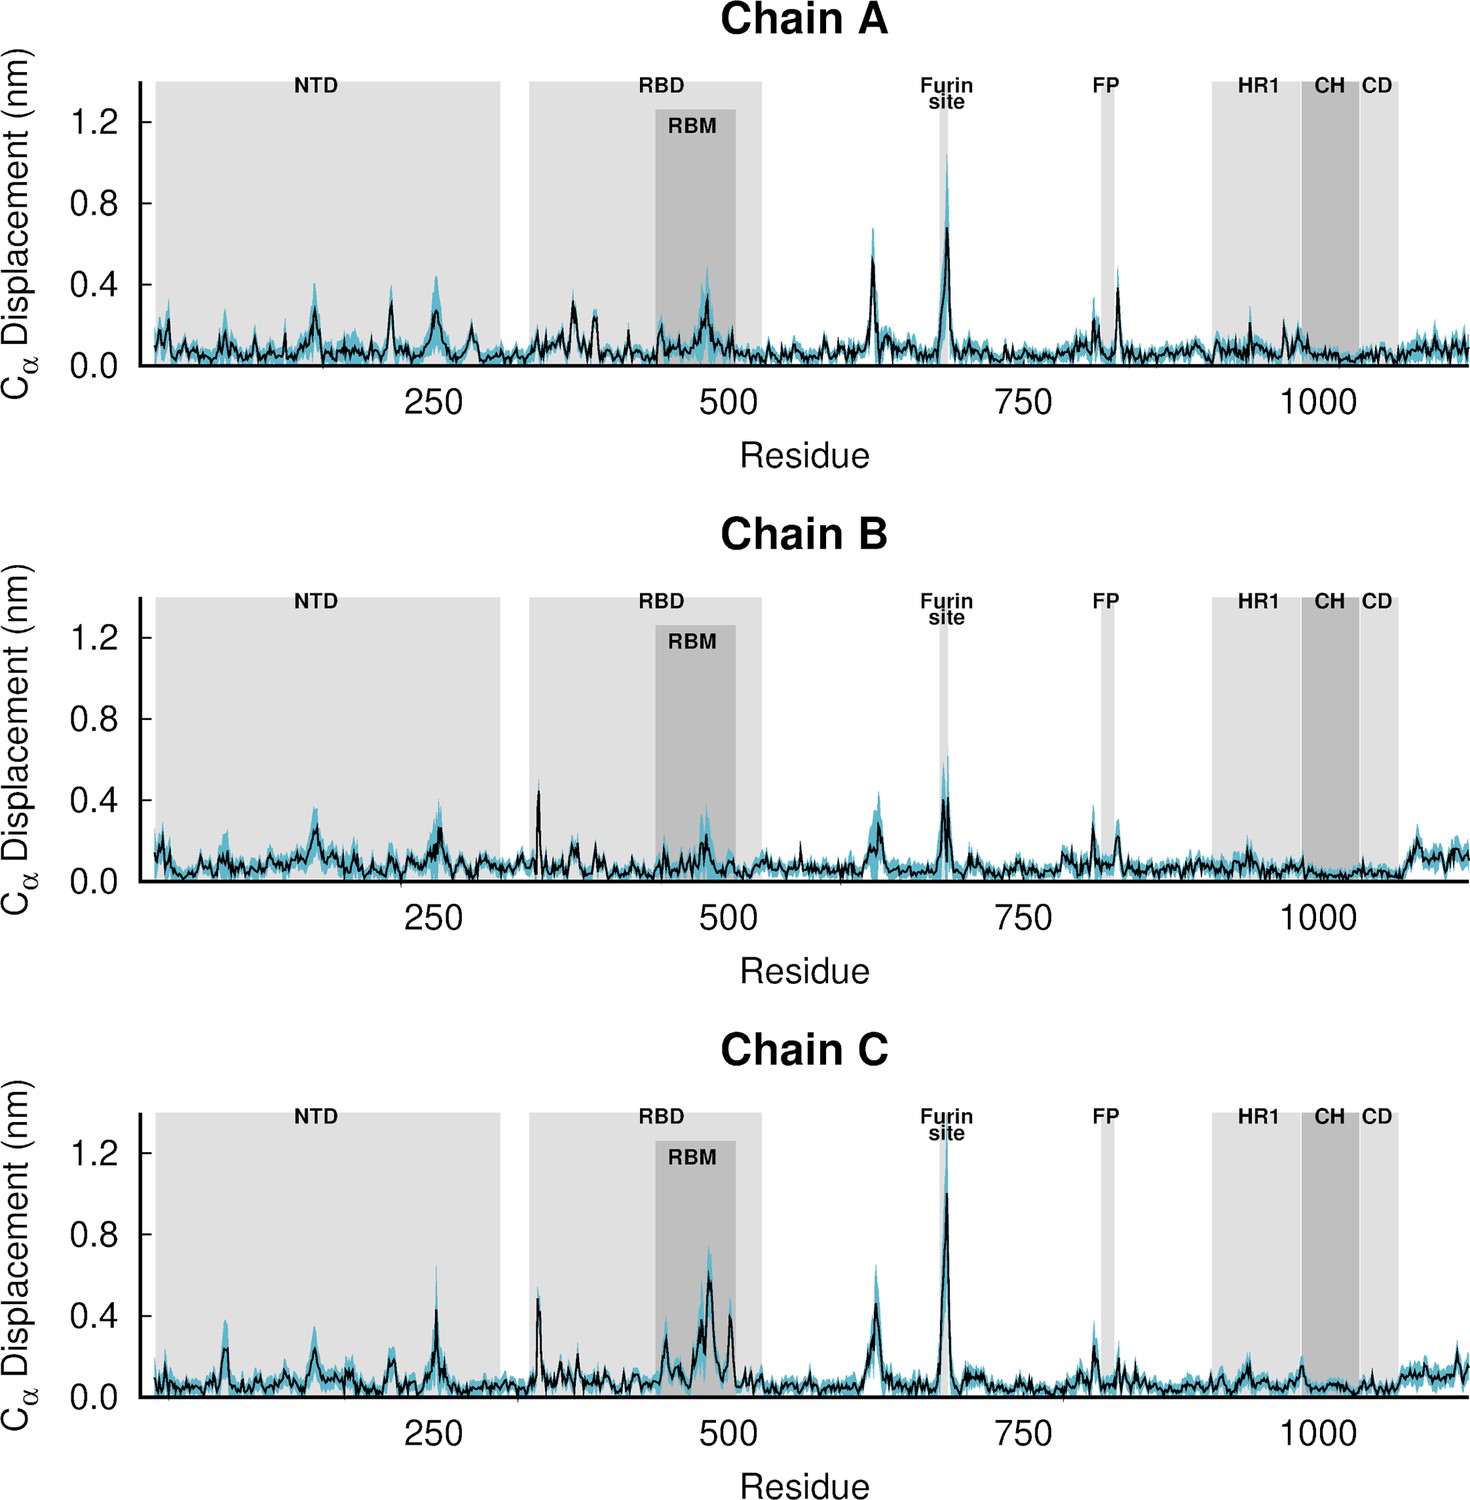
Figure 3—figure supplement 3
Dynamical nonequilibrium molecular dynamics (D-NEMD) average Cα-positional displacement and corresponding standard errors 10 ns after linoleate (LA) removal from the fatty acid (FA) sites.
The average deviations were determined using the Kubo-Onsager relation (Oliveira et al., 2021a; Ciccotti and Ferrario, 2016; Ciccotti et al., 1979; Ciccotti, 1991) for the pairwise comparison between the nonequilibrium apo and equilibrium LA-bound simulations. The averages were calculated over the 210 pairs of simulations. The light blue shaded region represents the standard error of the mean. The positions of some key structural motifs are highlighted in grey, namely the N-terminal domain (NTD), receptor-binding domain (RBD), receptor-binding motif (RBM), fusion peptide (FP), heptad repeat 1 (HR1), central helix (CH), connector domain (CD). Please note that the fusion-peptide proximal region (FPPR) is situated immediately before the FP. Please zoom in on the image for detailed visualisation.
Figure 3—figure supplement 4
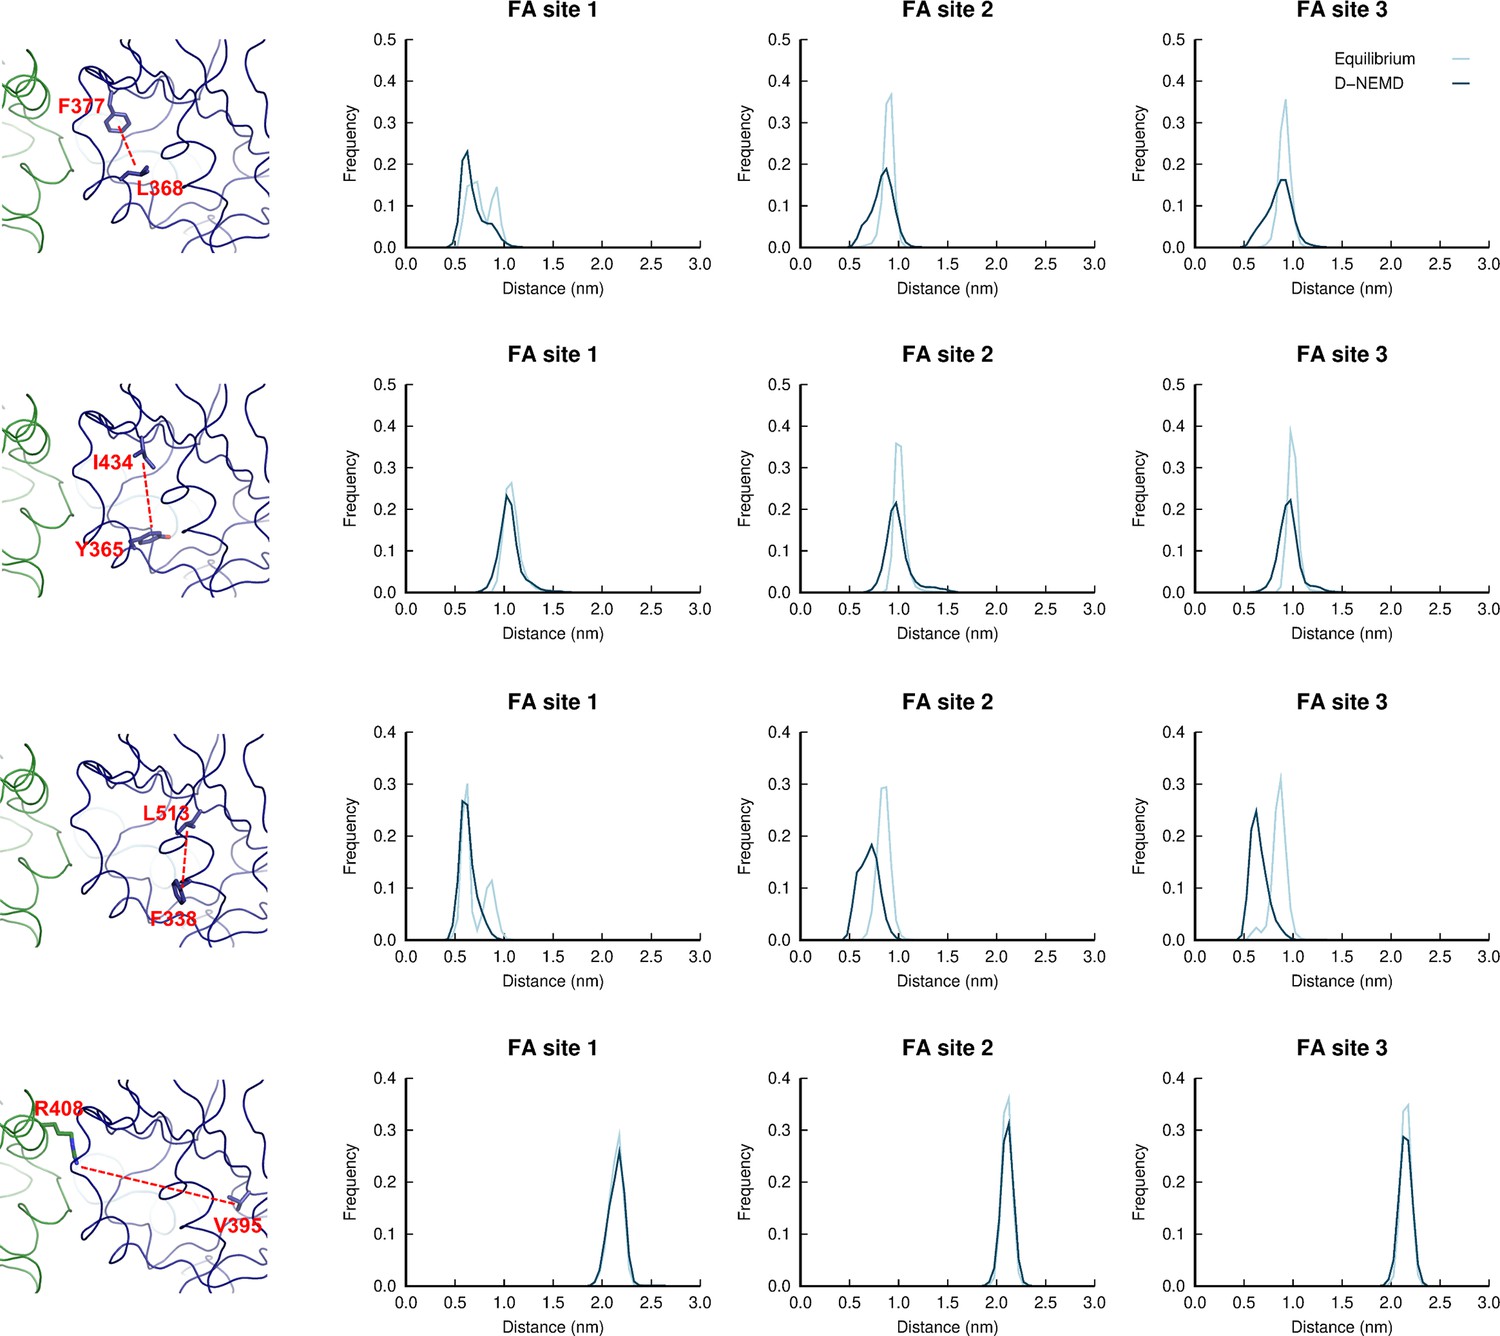
Distributions of distances between: L368-F377; Y365-I434; F338-L513; and R408-V395 in the equilibrium linoleate (LA)-bound and dynamical nonequilibrium molecular dynamics (D-NEMD) apo simulations.
Histogram of the distance between the centre of mass of the sidechains of: L368 and F377; Y365 and I434; F338 and L513; and R408 and V395 in the equilibrium and D-NEMD simulations. The equilibrium histogram (light blue line) displays distance data from the three equilibrium trajectories from 0 to 750 ns. The D-NEMD histogram (dark blue line) contains the distance data from all 210 D-NEMD trajectories. The images of the fatty acid (FA) site shown on the left show example conformations of the residues shown in the histograms on the right.
Figure 3—figure supplement 5
Structural response of spike to the removal of linoleate (LA).
This figure shows the protein’s response from the viewpoint of fatty acid (FA) site 2, which is located at the interface between chains A and B. Chain ID (A, B, or C) is indicated in subscript for each receptor-binding domain (RBD), N-terminal domain (NTD), furin site, and fusion peptide (FP). Mapping of the average Cα-positional displacement after LA removal from the FA binding sites. The norm of the average Cα displacement vector between the dynamical nonequilibrium molecular dynamics (D-NEMD) apo and equilibrium LA-bound simulations was calculated for each residue. The final displacement values correspond to the average obtained over the 210 pairs of simulations. The Cα average displacements at t=0, 0.1, 1, and 10 ns are mapped onto the starting structure for the equilibrium simulations. Structure colours indicate the average Cα-positional displacement (according to the scale on the right). Glycans are shown as light grey sticks, and the dark grey spheres highlight the FA binding site. The displacements in this figure can be compared with those shown in the main text Figure 3 (showing the changes from the FA site 1 side).
Figure 3—figure supplement 6
Structural response of spike to the removal of linoleate (LA).
This figure shows the protein’s response from the viewpoint of fatty acid (FA) site 3, which is located at the interface between chains B and C. Chain ID (A, B, or C) is indicated in subscript for each receptor-binding domain (RBD), N-terminal domain (NTD), furin site, and fusion peptide (FP). Mapping of the average Cα-positional displacement after LA removal from the FA binding sites. The norm of the average Cα displacement vector between the dynamical nonequilibrium molecular dynamics (D-NEMD) apo and equilibrium LA-bound simulations was calculated for each residue. The final displacement values correspond to the average obtained over the 210 pairs of simulations. The Cα average displacements at t=0, 0.1, 1, and 10 ns are mapped onto the starting structures for the equilibrium simulations. Structure colours indicate the average Cα-positional displacement (according to the scale on the right). Glycans are shown as light grey sticks, and dark grey spheres highlight the FA binding site. The displacements in this figure can be compared with those shown in the main text Figure 3 (showing the changes from the FA site 1 side).
Figure 3—figure supplement 7
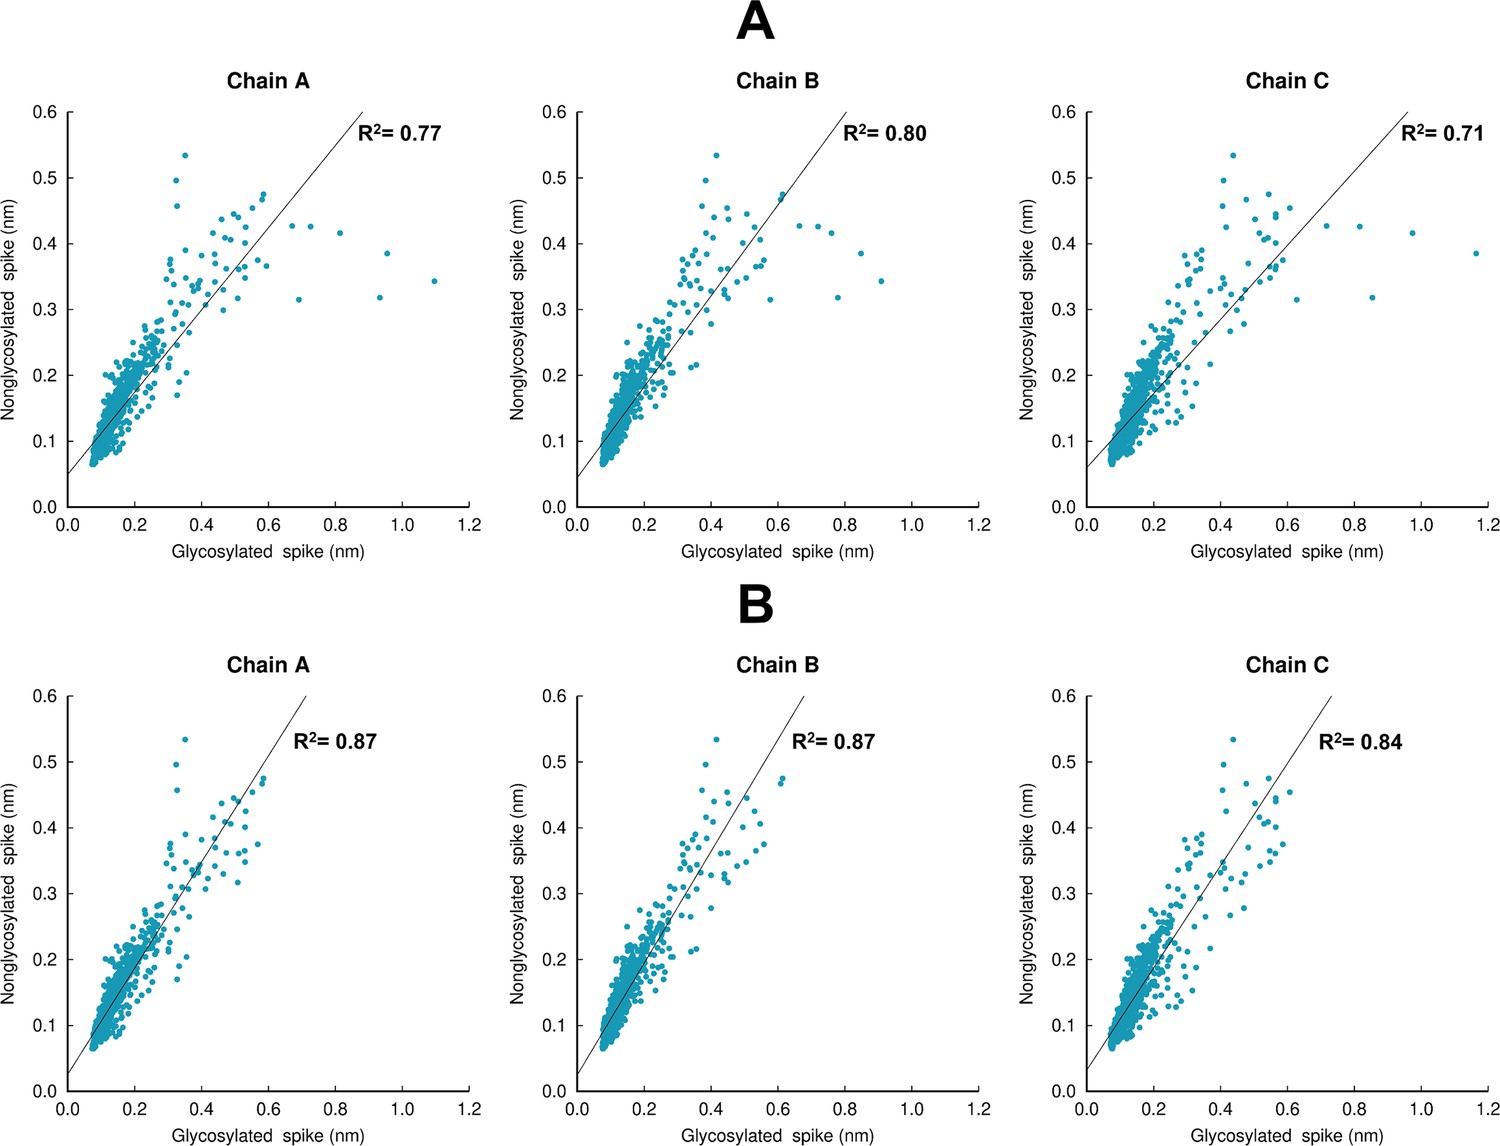
Structural response of the glycosylated spike compared to the non-glycosylated protein.
(A) Scatter plots comparing the responses for the complete head region of the spike (residues 13–1140). (B) Scatter plots comparing the protein response excluding the residues around the furin recognition site (residues 680–690). Panels A and B show the values for the average Cα-positional deviations 10 ns after linoleate (LA) removal from the fatty acid (FA) sites. The average deviations for the non-glycosylated ancestral spike are taken from our previous work (Oliveira et al., 2023). To properly compare the responses, the average Cα-positional deviations for the glycosylated spike was calculated using the same approach as in Oliveira et al., 2023. The coefficient of determination value for the linear regression for each chain is shown. The comparison between the coefficient values for panels A and B shows that the largest differences in the response between the glycosylated and non-glycosylated spikes are located in the furin recognition site at the S1/S2 interface, which is cleaved in the glycosylated protein here and uncleaved in the non-glycosylated spike in previous simulations (Oliveira et al., 2023); this difference should be noted in comparing the responses here.
Figure 3—figure supplement 8
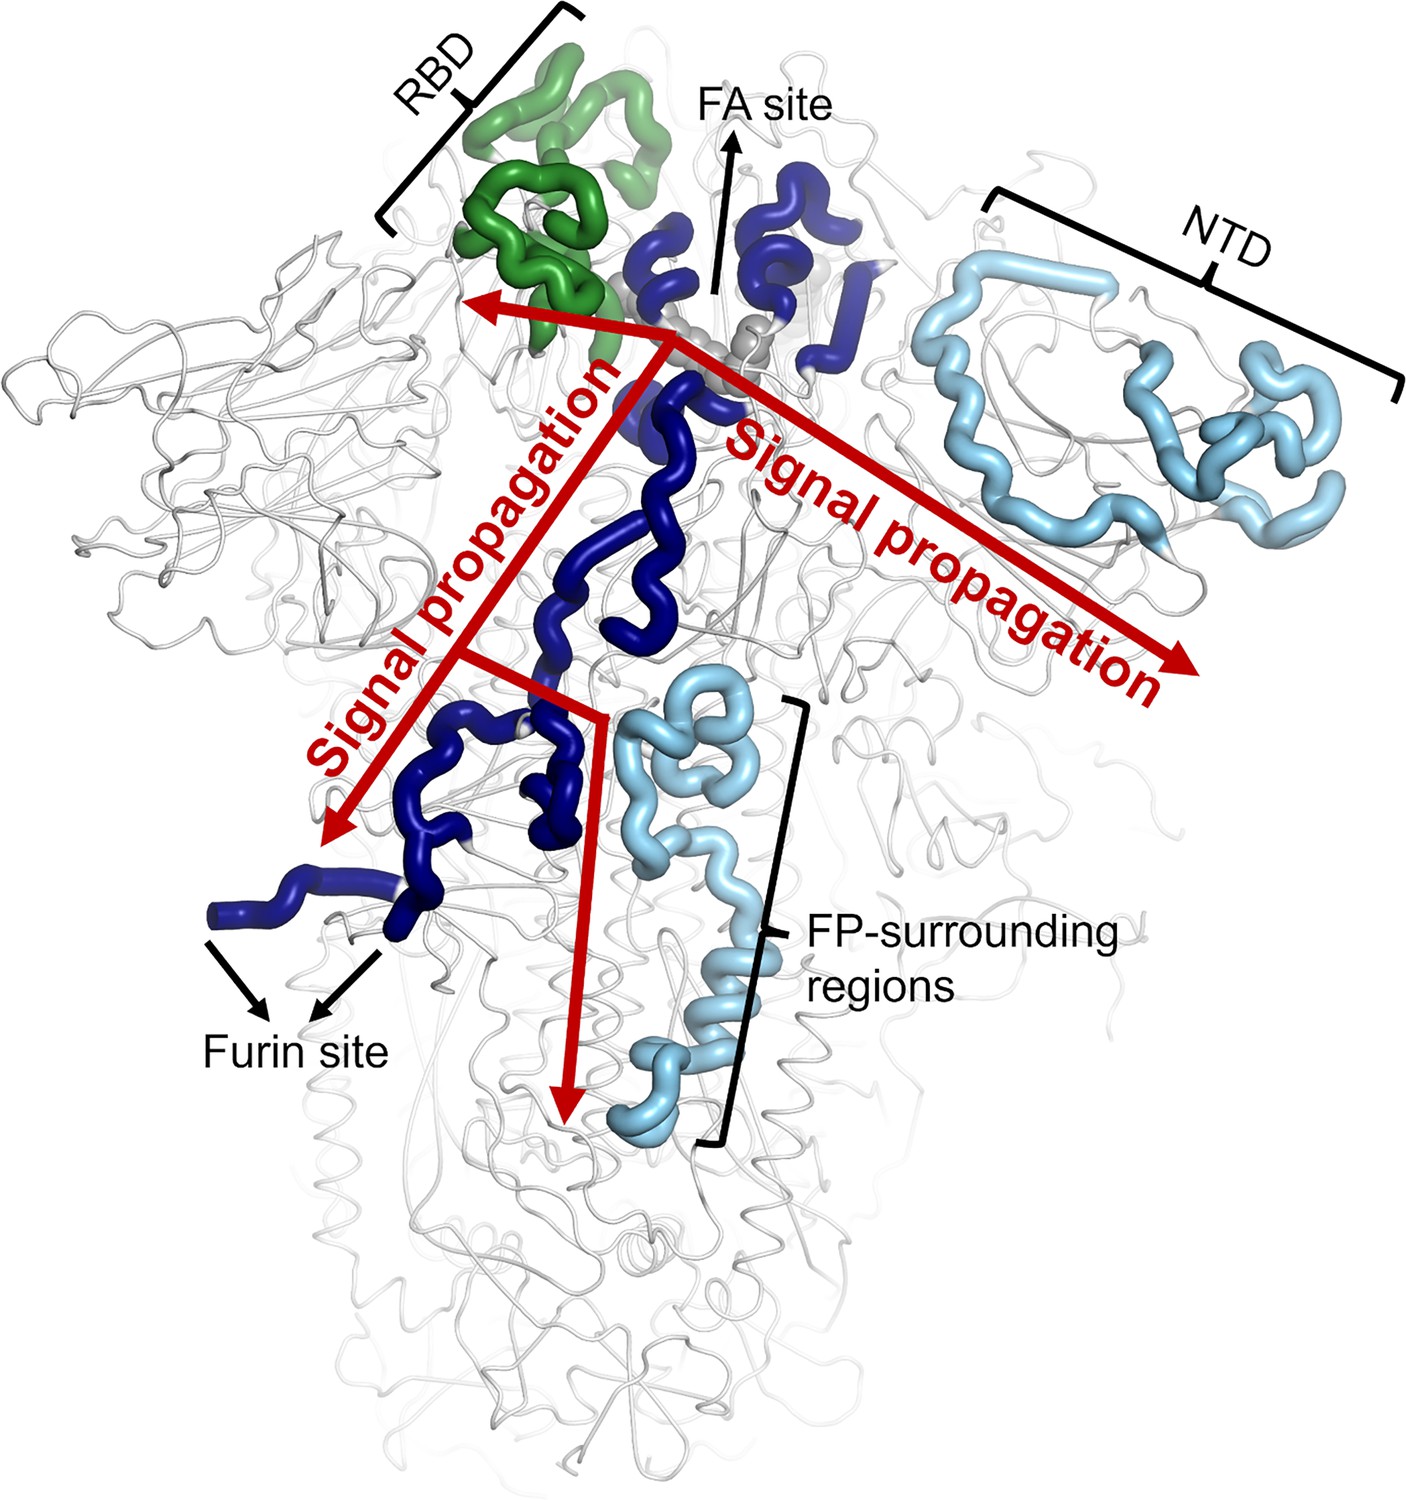
Scheme representing the pathways identified by D-NEMD connecting the FA site to the RBD, NTD and FP-surrounding regions.
The regions of the pathways belonging to chains A, B and C (which correspond to regions responding to LA removal in Figure 3 in the main manuscript) are coloured in dark blue, light blue and green, respectively. The LA molecule bound to FA site 1 is shown with grey spheres. Note that similar communication pathways are observed from the FA sites 2 and 3.
Figure 4 with 7 supplements
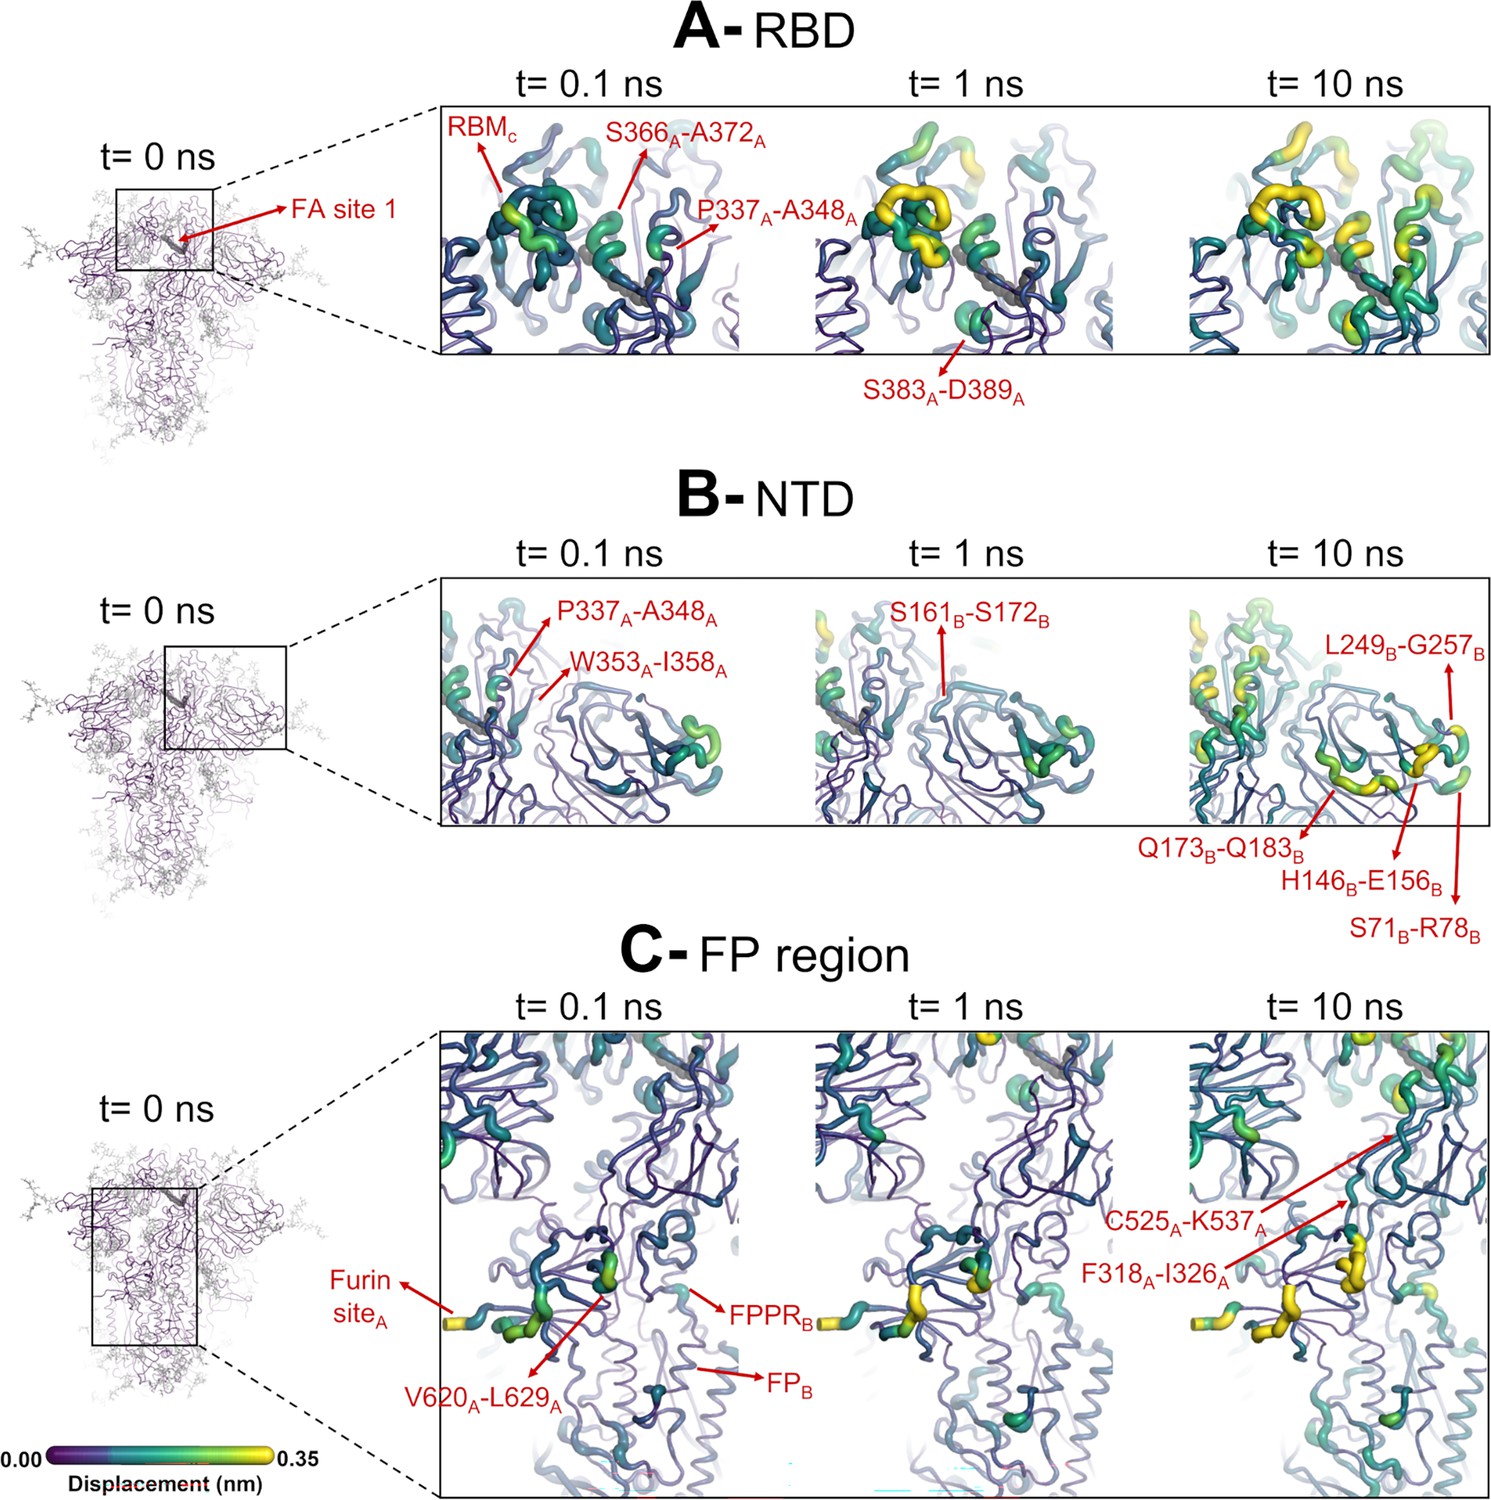
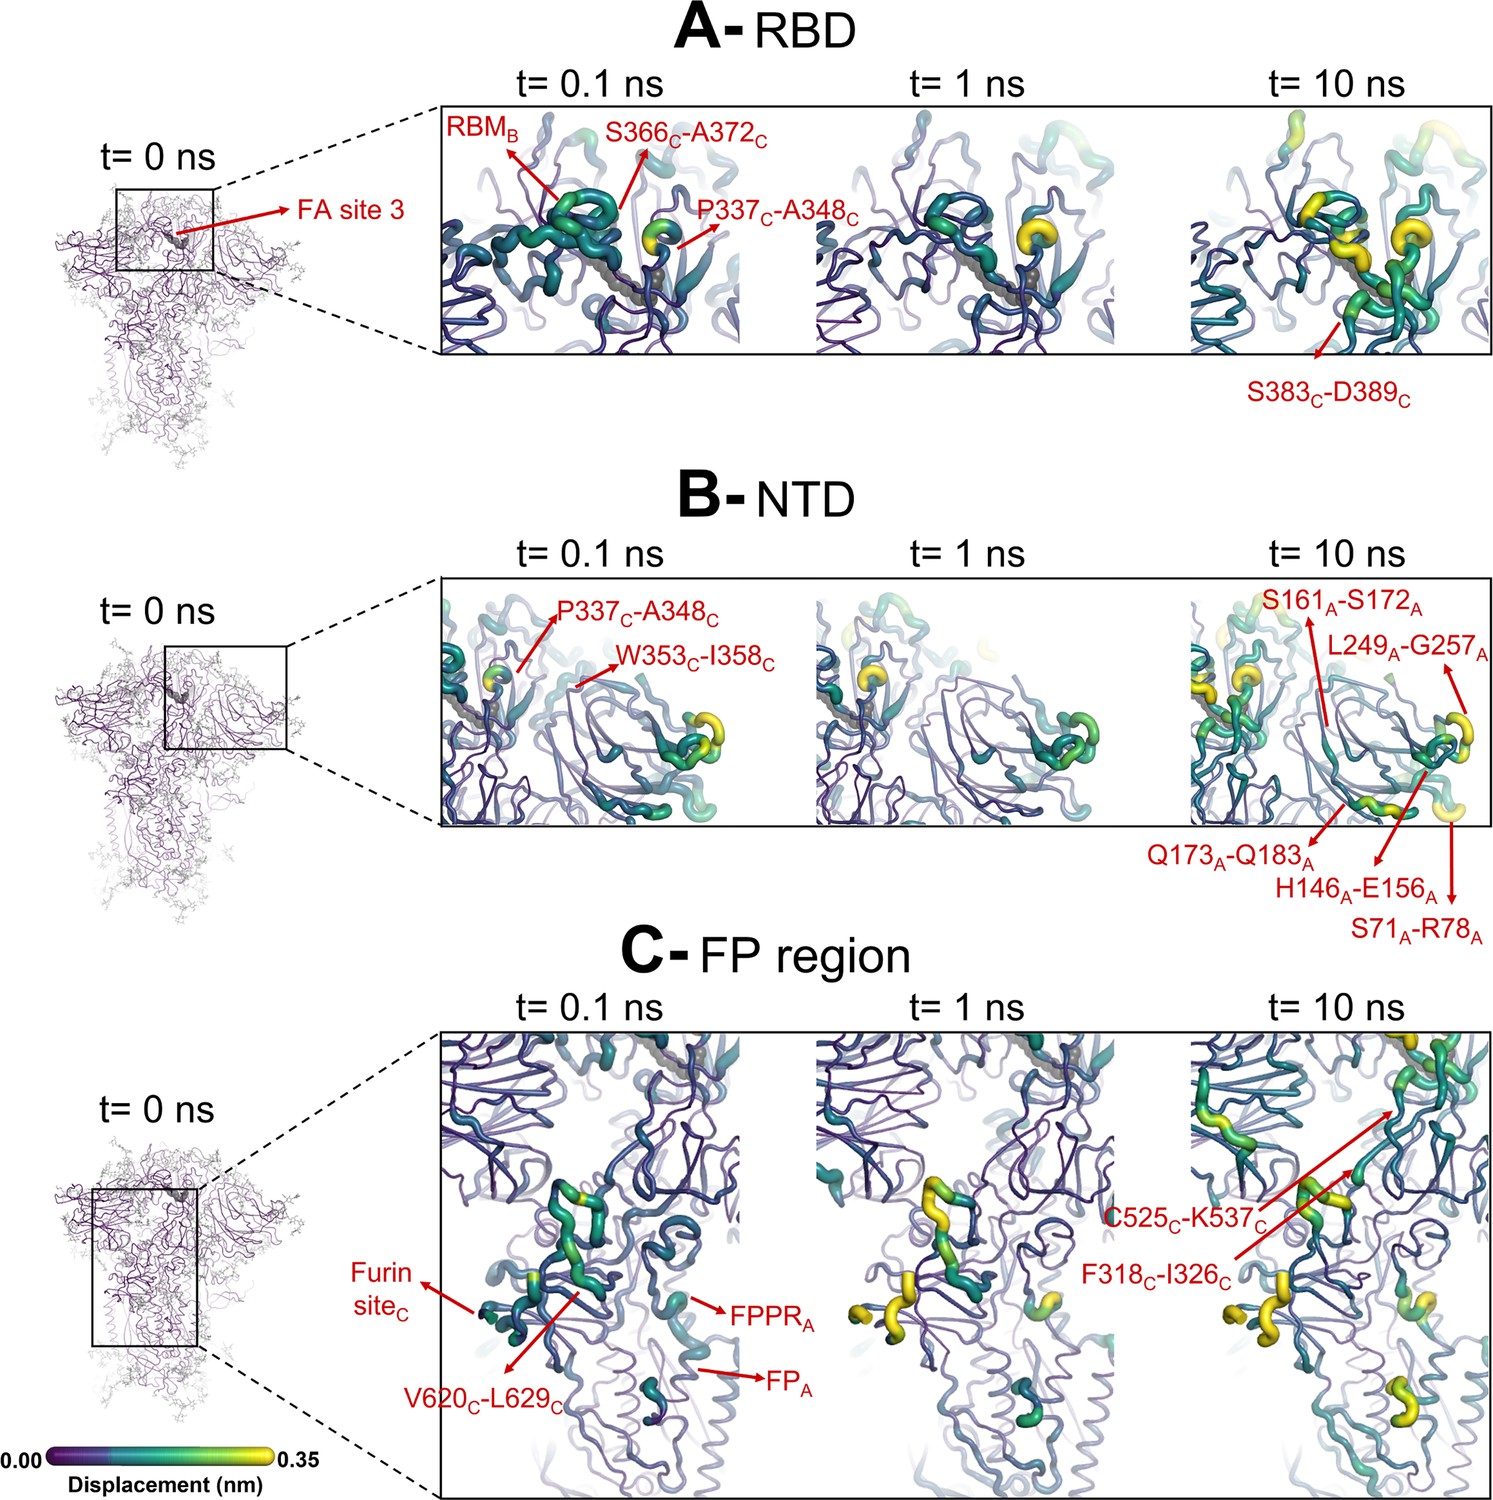
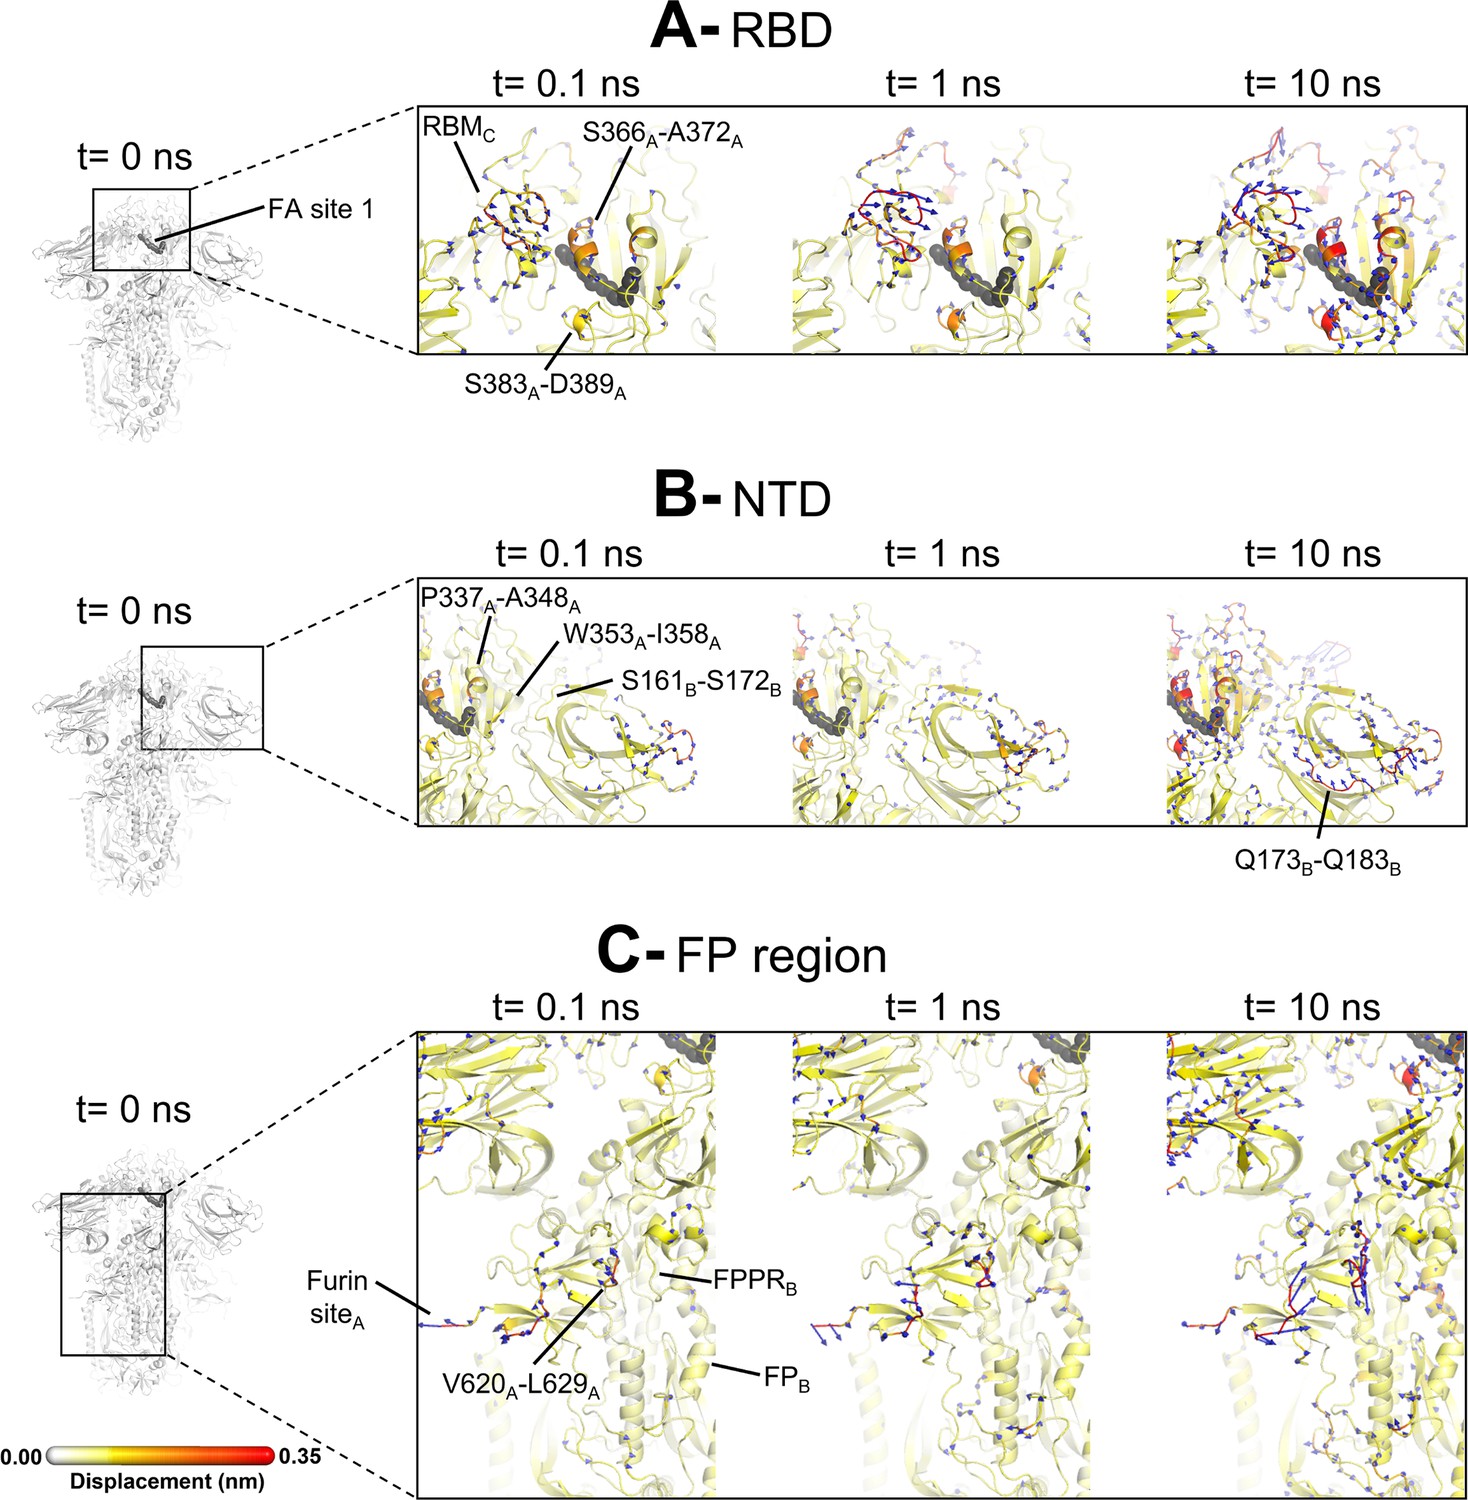
Structural responses of functional regions of the spike.
Close-up view of the structural response of the receptor-binding domain (RBD) (A), N-terminal domain (NTD) (B), and fusion peptide (FP) surrounding regions (C) to linoleate (LA) removal. The fatty acid (FA) site shown here is FA site 1, located at the interface between chains C and A (see Figure 4—figure supplement 1, Figure 3—figure supplement 2 for the responses of the other two FA sites, which are similar). Structure colours and cartoon thickness indicate the average Cα displacement values. Each region is subscripted with its chain ID (A, B, or C). The dark grey spheres show the FA binding site. In the images representing the spike at t=0 ns (left side images A, B, and C), the glycans are shown as light grey sticks. Glycans were omitted from the figures showing the responses at t=0.1, 1, and 10 ns to facilitate visualisation. For more details, see the legend of Figure 3.
Figure 4—figure supplement 1
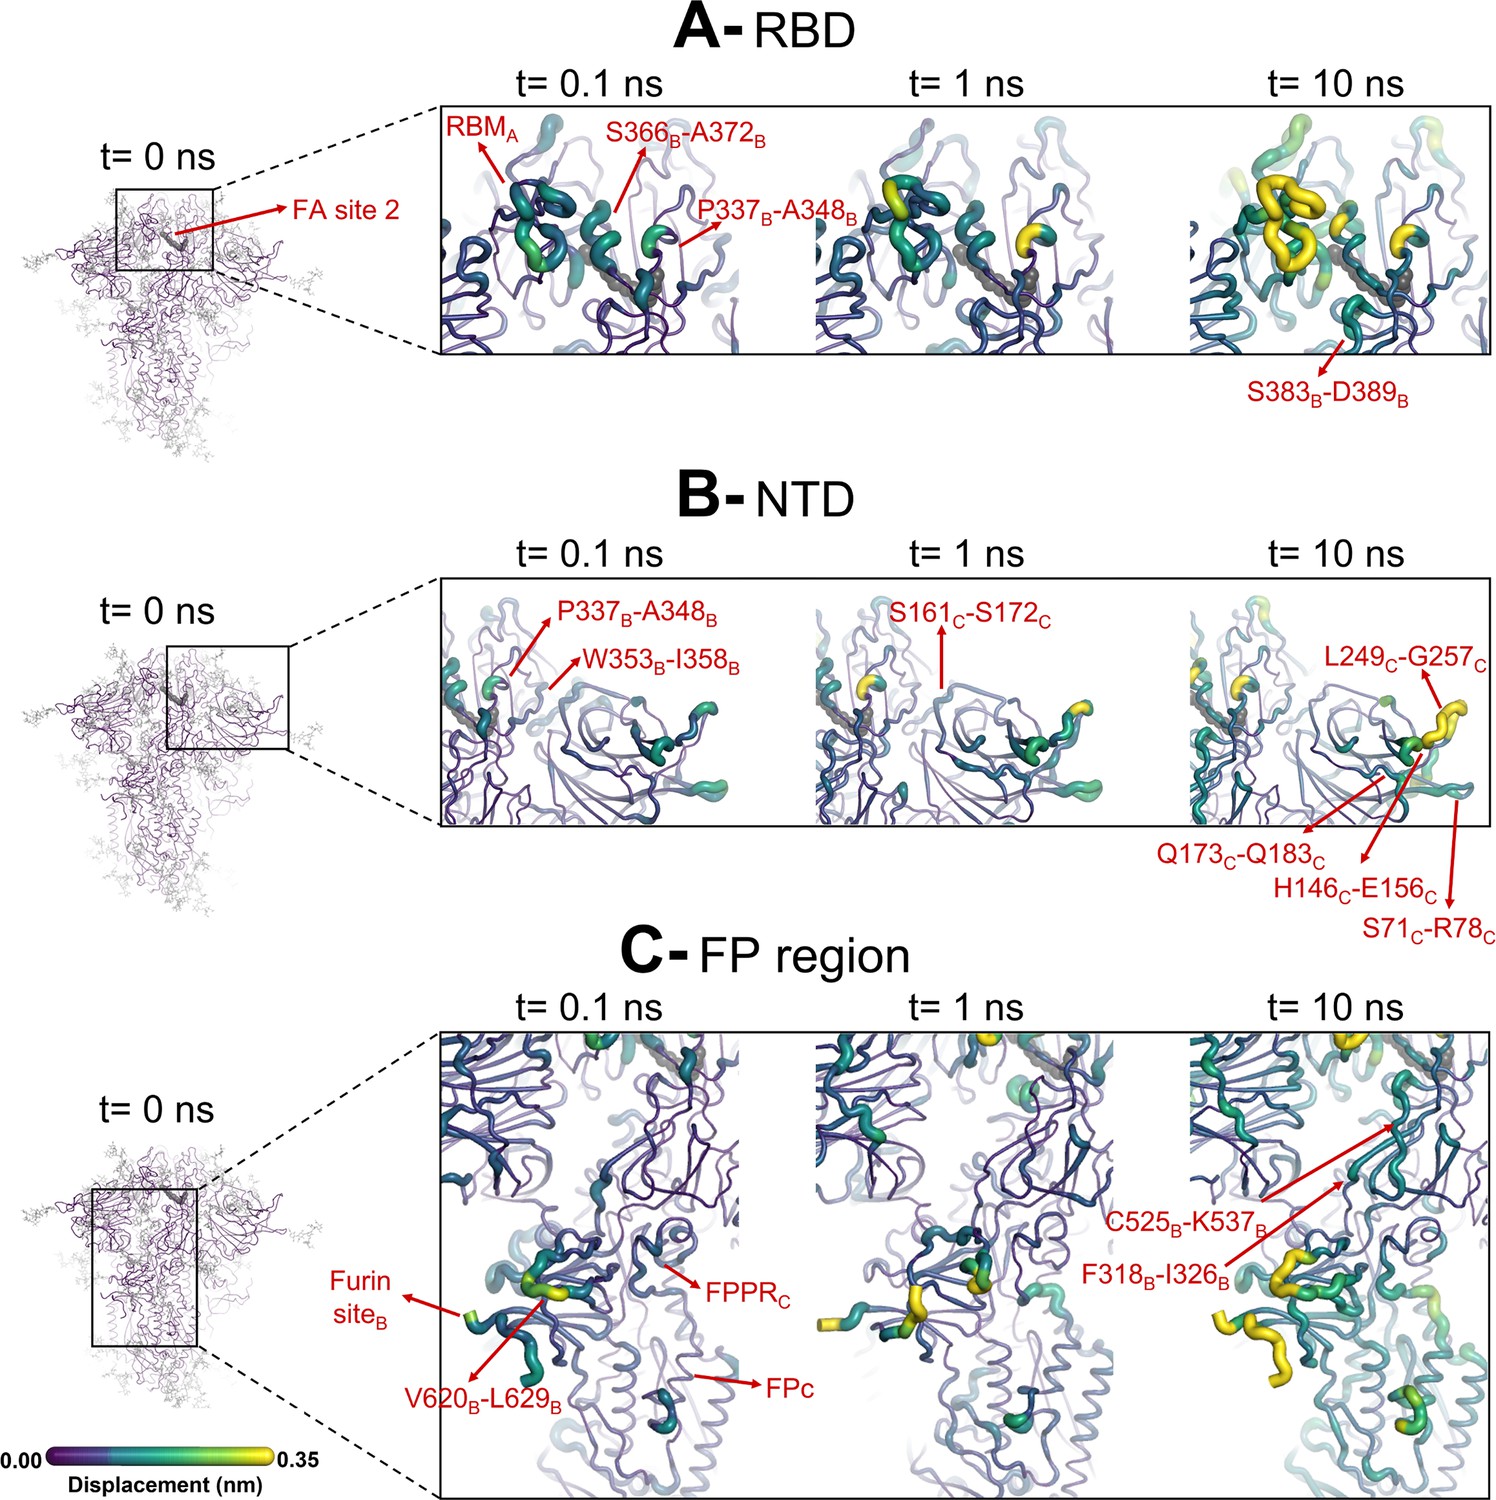
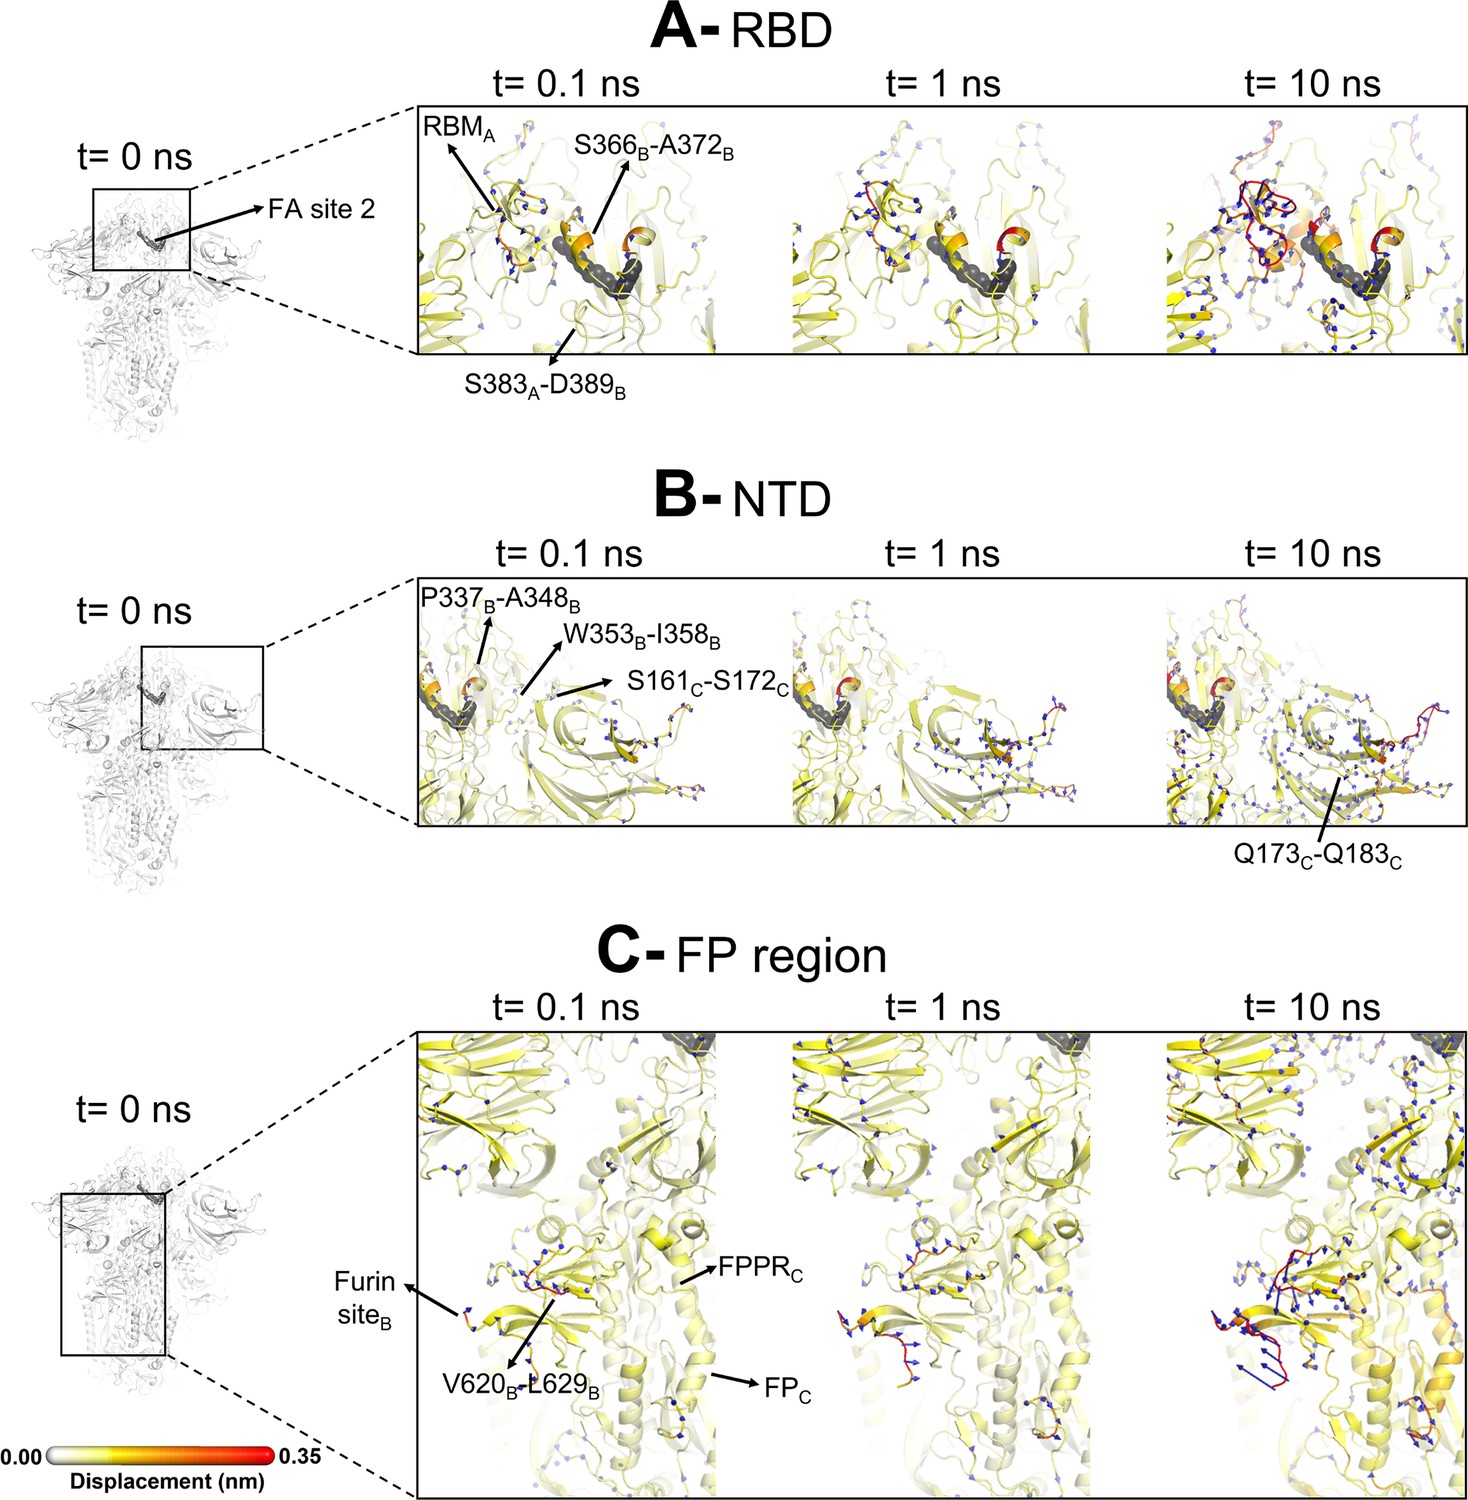
Evolution of the dynamical nonequilibrium molecular dynamics (D-NEMD) structural response from the viewpoint of fatty acid (FA) site 2 (located at the interface between chains A and B) to linoleate (LA) removal.
Close-up view of the structural response of the RBDAB (A), NTDC (B), and FPC surrounding regions (C) to LA removal. Chain ID (A, B, or C) is indicated in subscript. The average Cα displacements at t=0, 0.1, 1, and 10 ns after LA removal are mapped onto the starting structure for the equilibrium simulations. The structure colours, and cartoon thickness, indicate the average Cα-displacement values. The dark grey spheres highlight the FA binding site. The glycans are omitted from the panels showing the responses at t=0.1, 1, and 10 ns.
Figure 4—figure supplement 2
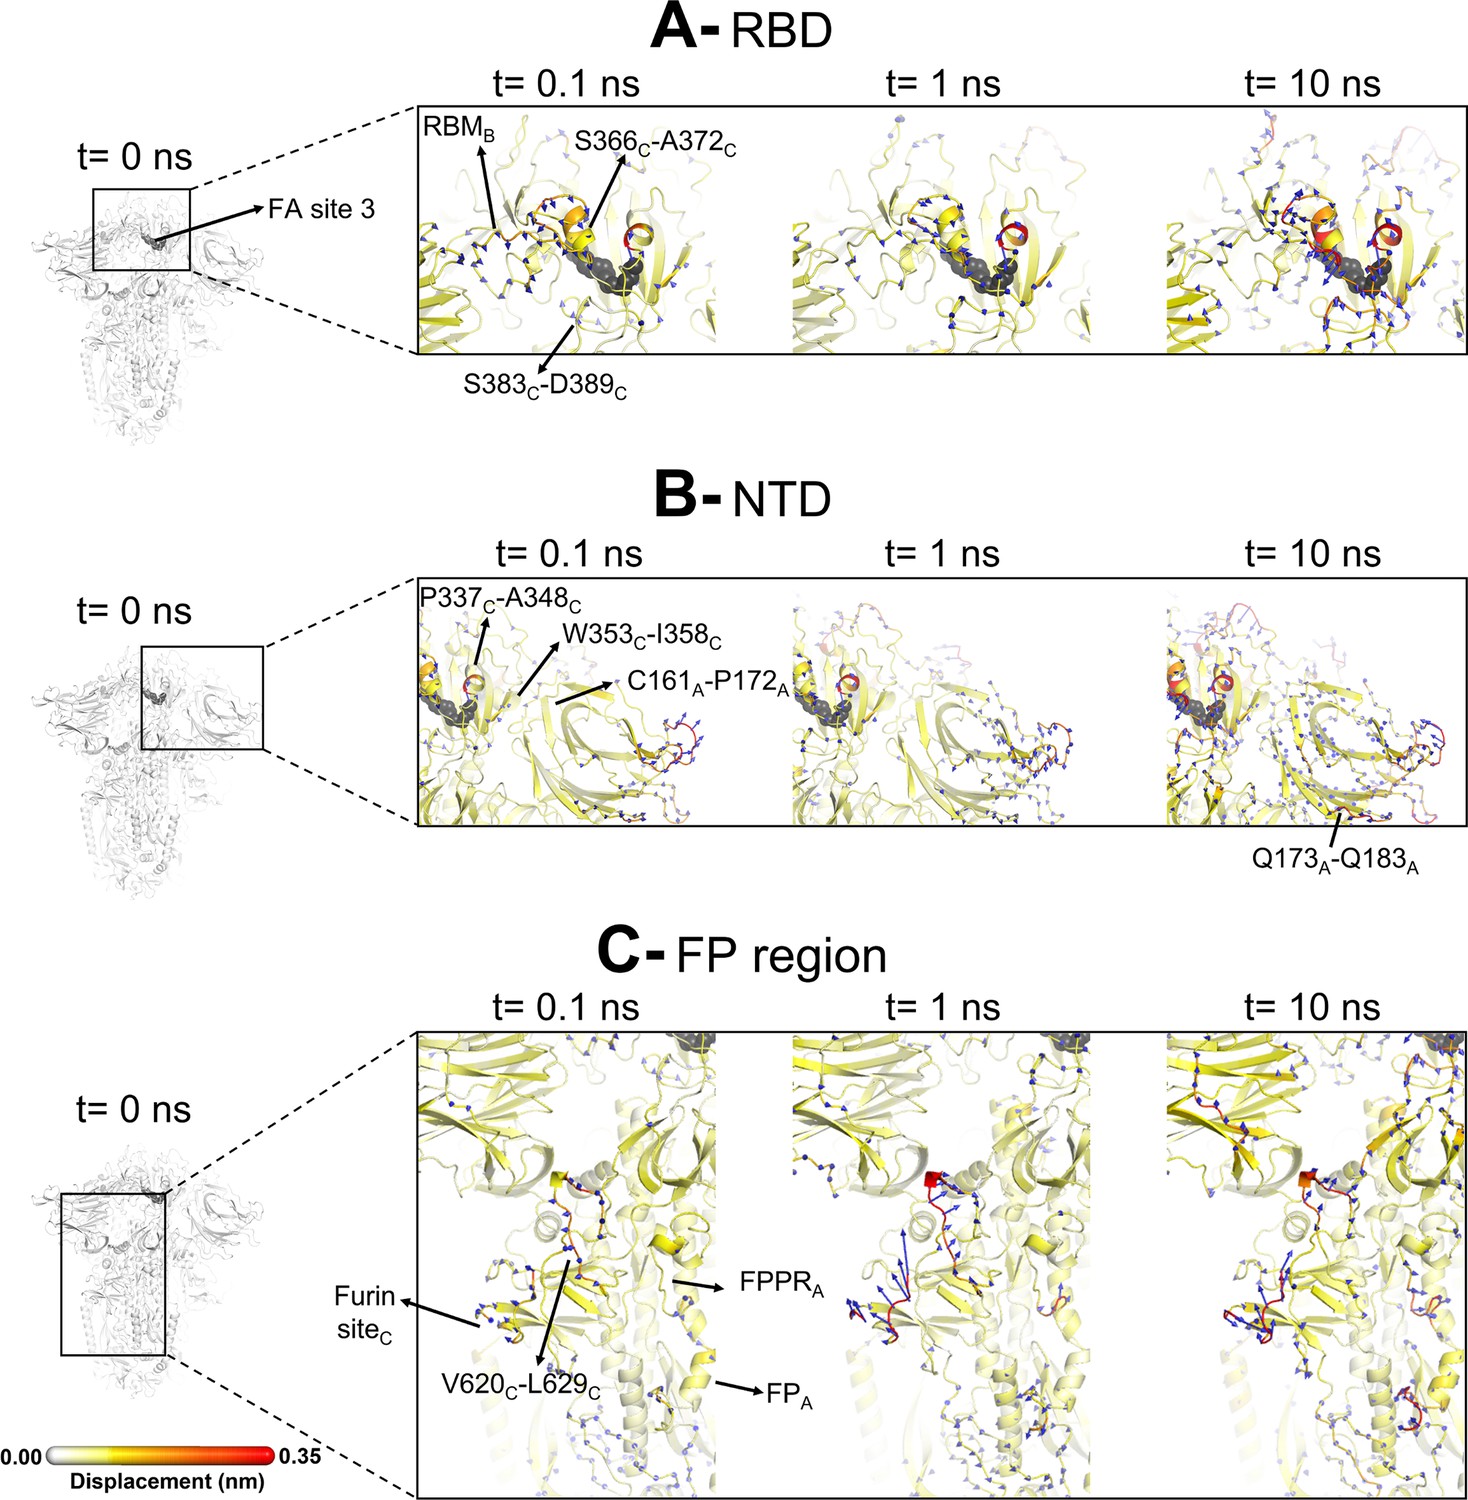
Evolution of the dynamical nonequilibrium molecular dynamics (D-NEMD) structural response from the viewpoint of fatty acid (FA) site 3 (between chains B and C) to linoleate (LA) removal.
Close-up view of the structural response of the RBDBC (A), NTDA (B), and FPA surrounding regions (C) to LA removal. Chain ID (A, B, or C) is indicated in subscript. The average Cα displacements at t=0, 0.1, 1, and 10 ns after LA removal are mapped onto the starting structure for the equilibrium simulations. The structure colours and cartoon thickness indicate the average Cα-displacement values. The dark grey spheres highlight the FA binding site. The glycans are omitted from the panels showing the responses at t=0.1, 1, and 10 ns.
Figure 4—figure supplement 3
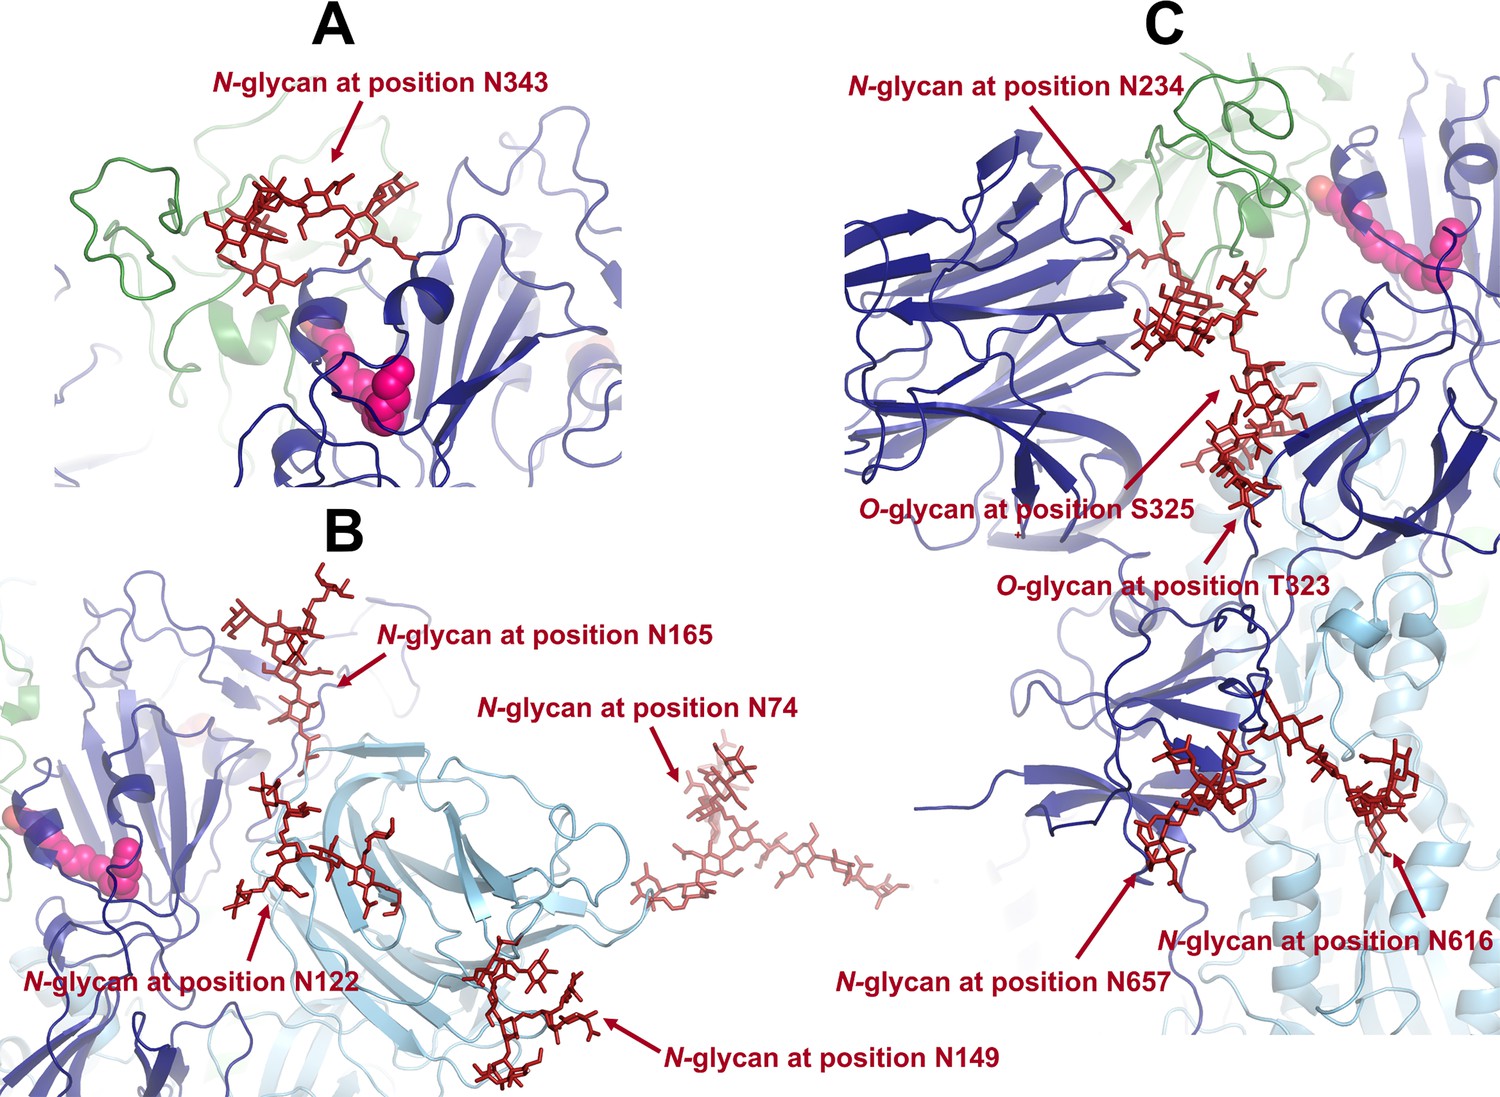
Example of a conformation showing the position of the glycans located in or close to the allosteric pathways connecting the fatty acid (FA) site to the.
(A) receptor-binding motif (RBM), (B) N-terminal domain (NTD), and (C) furin cleavage site and fusion peptide (FP)-surrounding regions (including the fusion-peptide proximal region [FPPR] and the S2’ cleavage site).
Each monomer in the protein is shown in a different colour: dark blue, light blue, and green. Glycans are shown with the dark red sticks, and linoleate (LA) molecules are highlighted with magenta spheres.
Figure 4—figure supplement 4
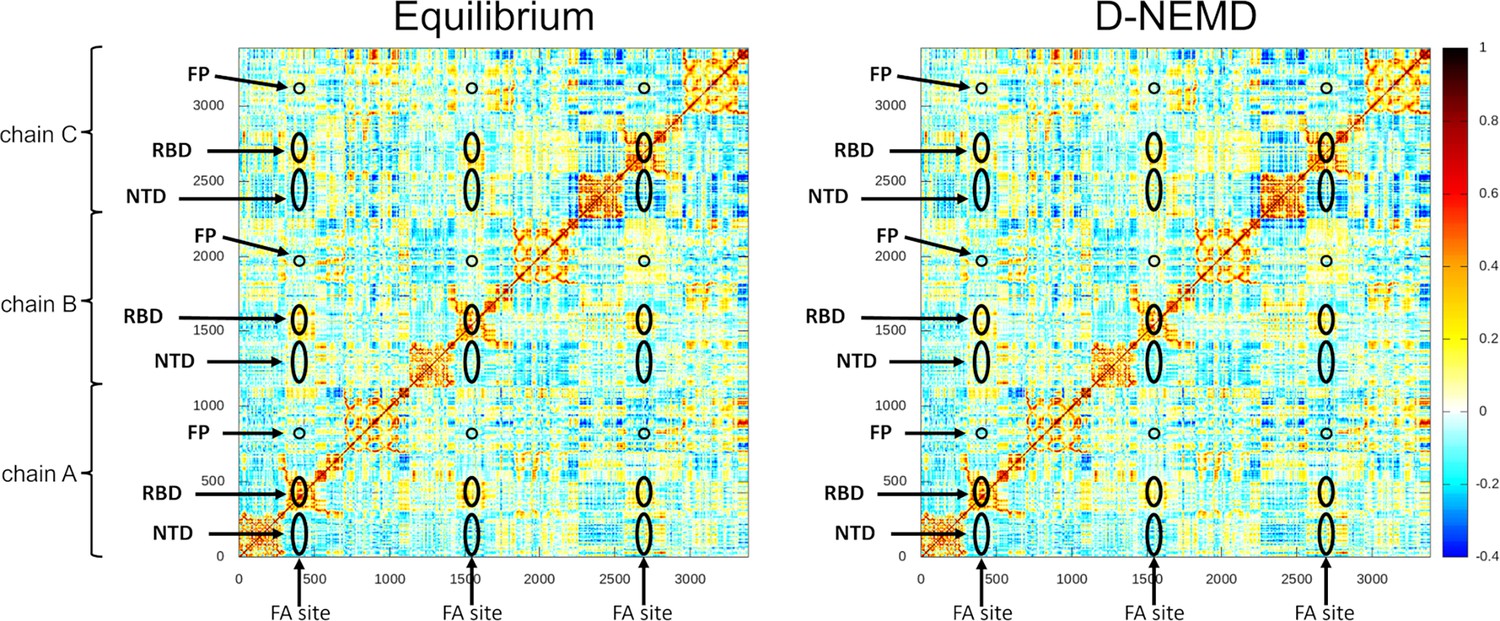
Cross-correlation maps for the equilibrium (linoleate [LA]-bound) and the dynamical nonequilibrium molecular dynamics (D-NEMD) simulations.
For the equilibrium map (left panel), the correlations were calculated for all Cα atoms over the three equilibrium trajectories, whereas for the D-NEMD maps (right panel), the correlations were determined using all 210 D-NEMD simulations performed. Atoms that systematically move in the same direction have a correlation value higher than zero, while those moving in opposite directions have a correlation value lower than 0. White regions indicate no correlation. Yellow, orange, and red colours indicate low, moderate, and significant positive correlations, while cyan and dark blue represent moderate and significant negative correlations, respectively. The positions of some key structural features are highlighted in black, namely the N-terminal domain (NTD), receptor-binding domain (RBD), and the fusion peptide (FP). Please zoom in on the image for detailed visualisation.
Figure 4—figure supplement 5
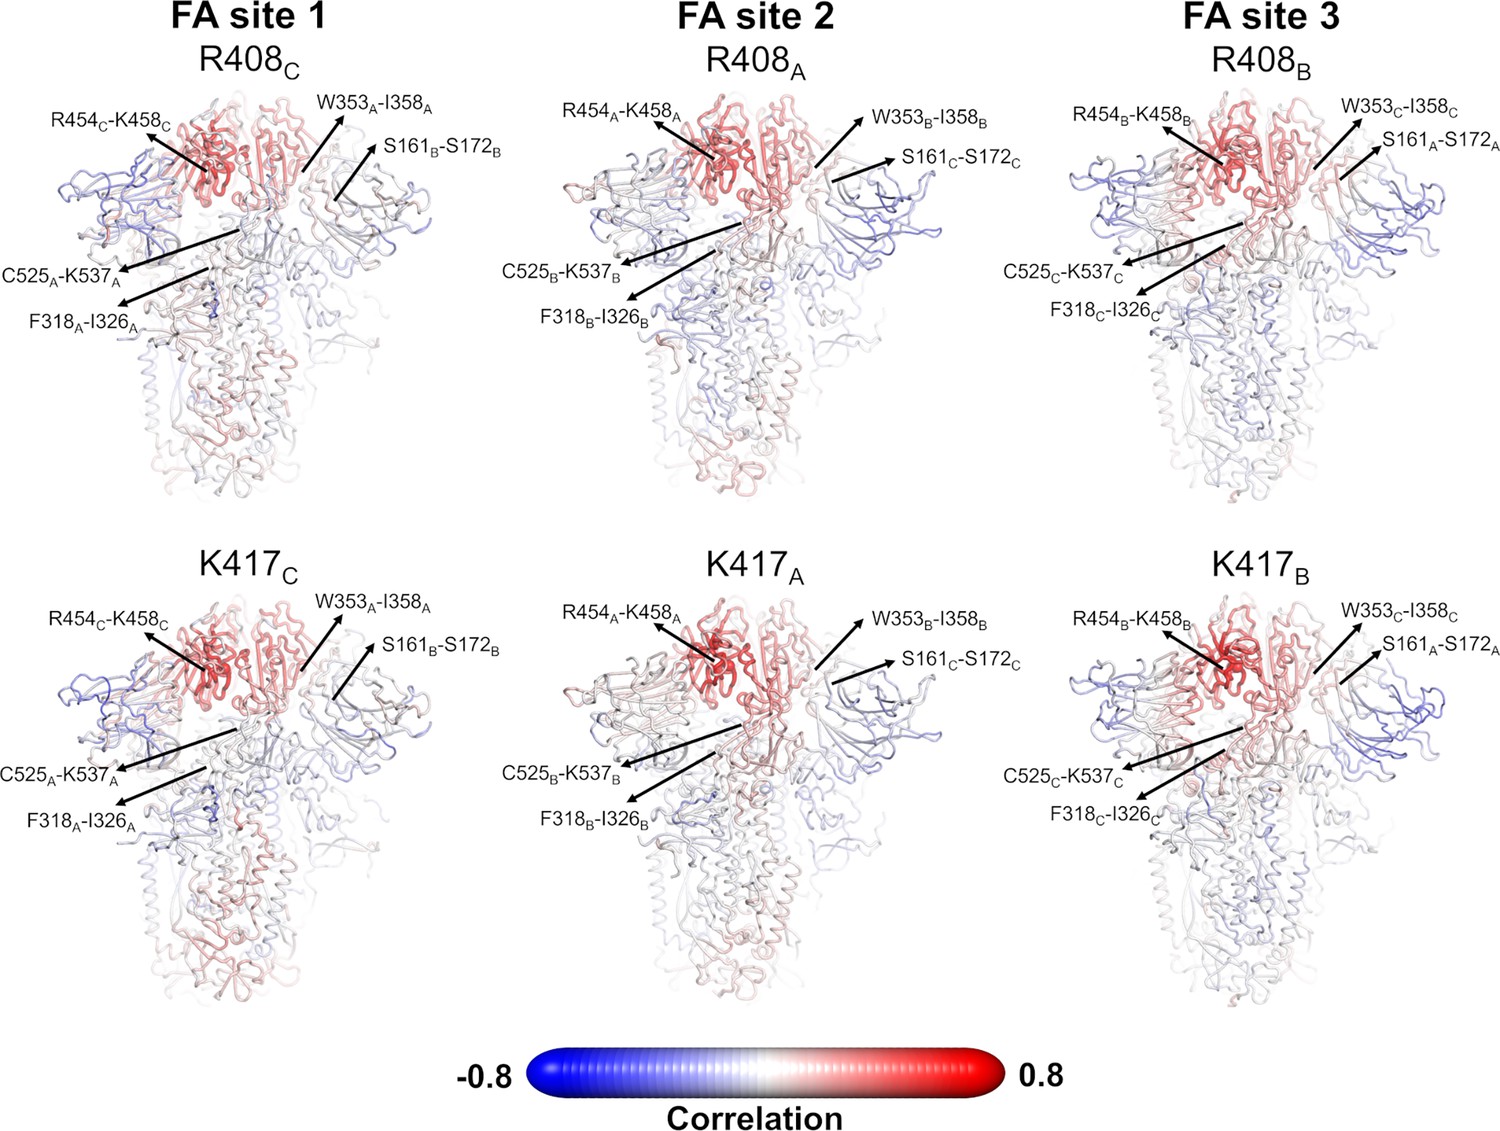
Pearson correlations for the Cα atom of R408 and K417 from the equilibrium simulations.
R408 and K417 are located in the fatty acid (FA) site (see main text Figure 1) and can directly interact with the carboxylate headgroup of linoleate (LA). The correlations between the Cα atom of R408 and K417 and all the remaining Cα atoms are shown. Note that similar correlation profiles were observed for R408 and K417 using the dynamical nonequilibrium molecular dynamics (D-NEMD) trajectories. Atoms that systematically move in the opposite direction to R408 or K417 have strong negative correlation values, whereas those systematically moving in the same direction show strong positive correlations. Atoms whose movements relative to each residue are uncorrelated present a correlation value of 0. The location of R408 (top panel) and K417 (bottom panel) is highlighted with a sphere. Each residue/region is subscripted with its chain ID (A, B, or C). Please zoom in on the image for detailed visualisation.
Figure 4—figure supplement 6
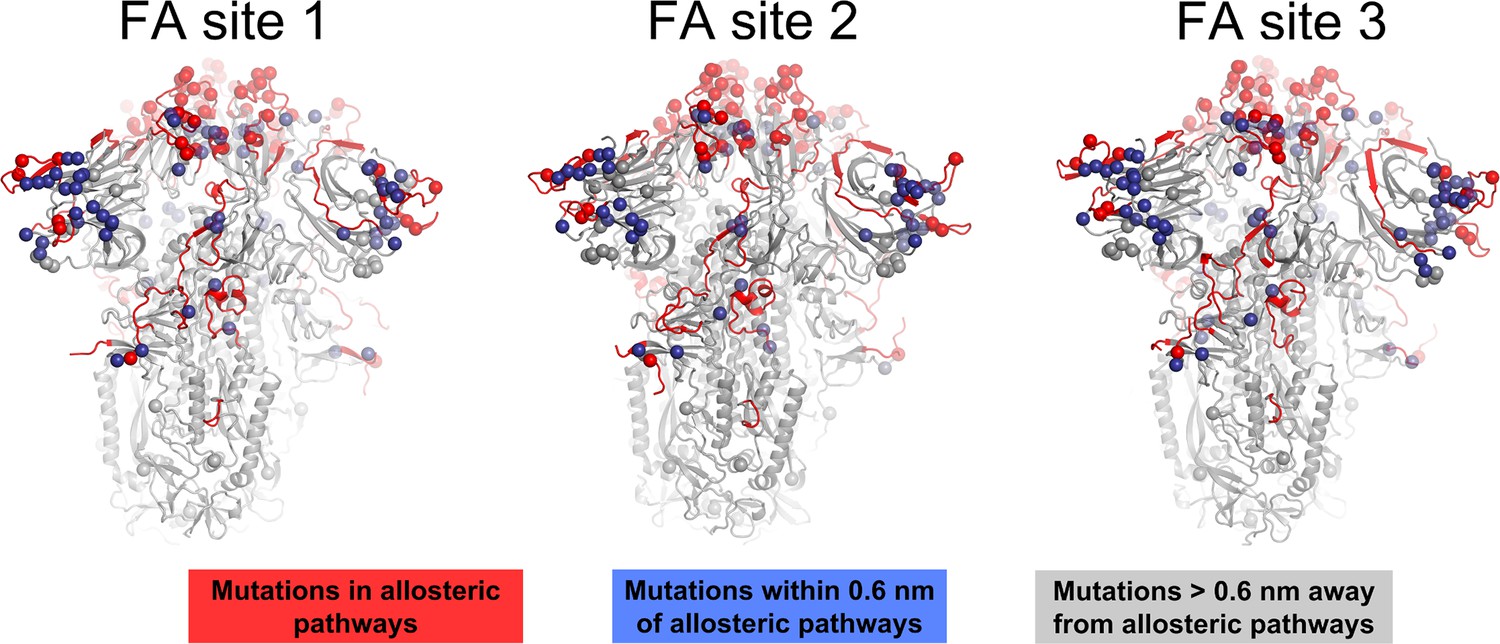
Location of substitutions, deletions, and insertions reported for several variants of concern and their relationship to the allosteric pathways identified by dynamical nonequilibrium molecular dynamics (D-NEMD) here.
The spheres highlight the position of the substitutions, deletions, and insertions reported for Alpha (outbreak.info SARS-CoV-2 Alpha), Beta (outbreak.info SARS-CoV-2 Beta), Gamma (outbreak.info SARS-CoV-2 Gamma), Delta (outbreak.info SARS-CoV-2 Delta), and several Omicron sub-variants, namely BA.1.1 (outbreak.info SARS-CoV-2 Omicron BA.1.1), BA.2 (outbreak.info SARS-CoV-2 Omicron BA.2), BA.4.1 (outbreak.info SARS-CoV-2 Omicron BA.4.1), BA.5 (outbreak.info SARS-CoV-2 Omicron BA.5), BQ.1.1 (outbreak.info SARS-CoV-2 Omicron BQ.1.1), and XBB.1.5 (outbreak.info SARS-CoV-2 Omicron XBB.1.5) (Gangavarapu et al., 2023). The red spheres correspond to mutations, deletions, and insertions located in the allosteric pathways identified using D-NEMD simulations and the blue spheres correspond to the changes directly contacting these pathways (within 0.6 nm of any atom forming the paths). The grey spheres show changes with no direct contact to the pathways. The protein is shown in light grey, with the allosteric pathways captured by D-NEMD connecting the fatty acid (FA) site (Figure 4 in the main manuscript) to important functional regions of the spike coloured in red.
Figure 4—figure supplement 7
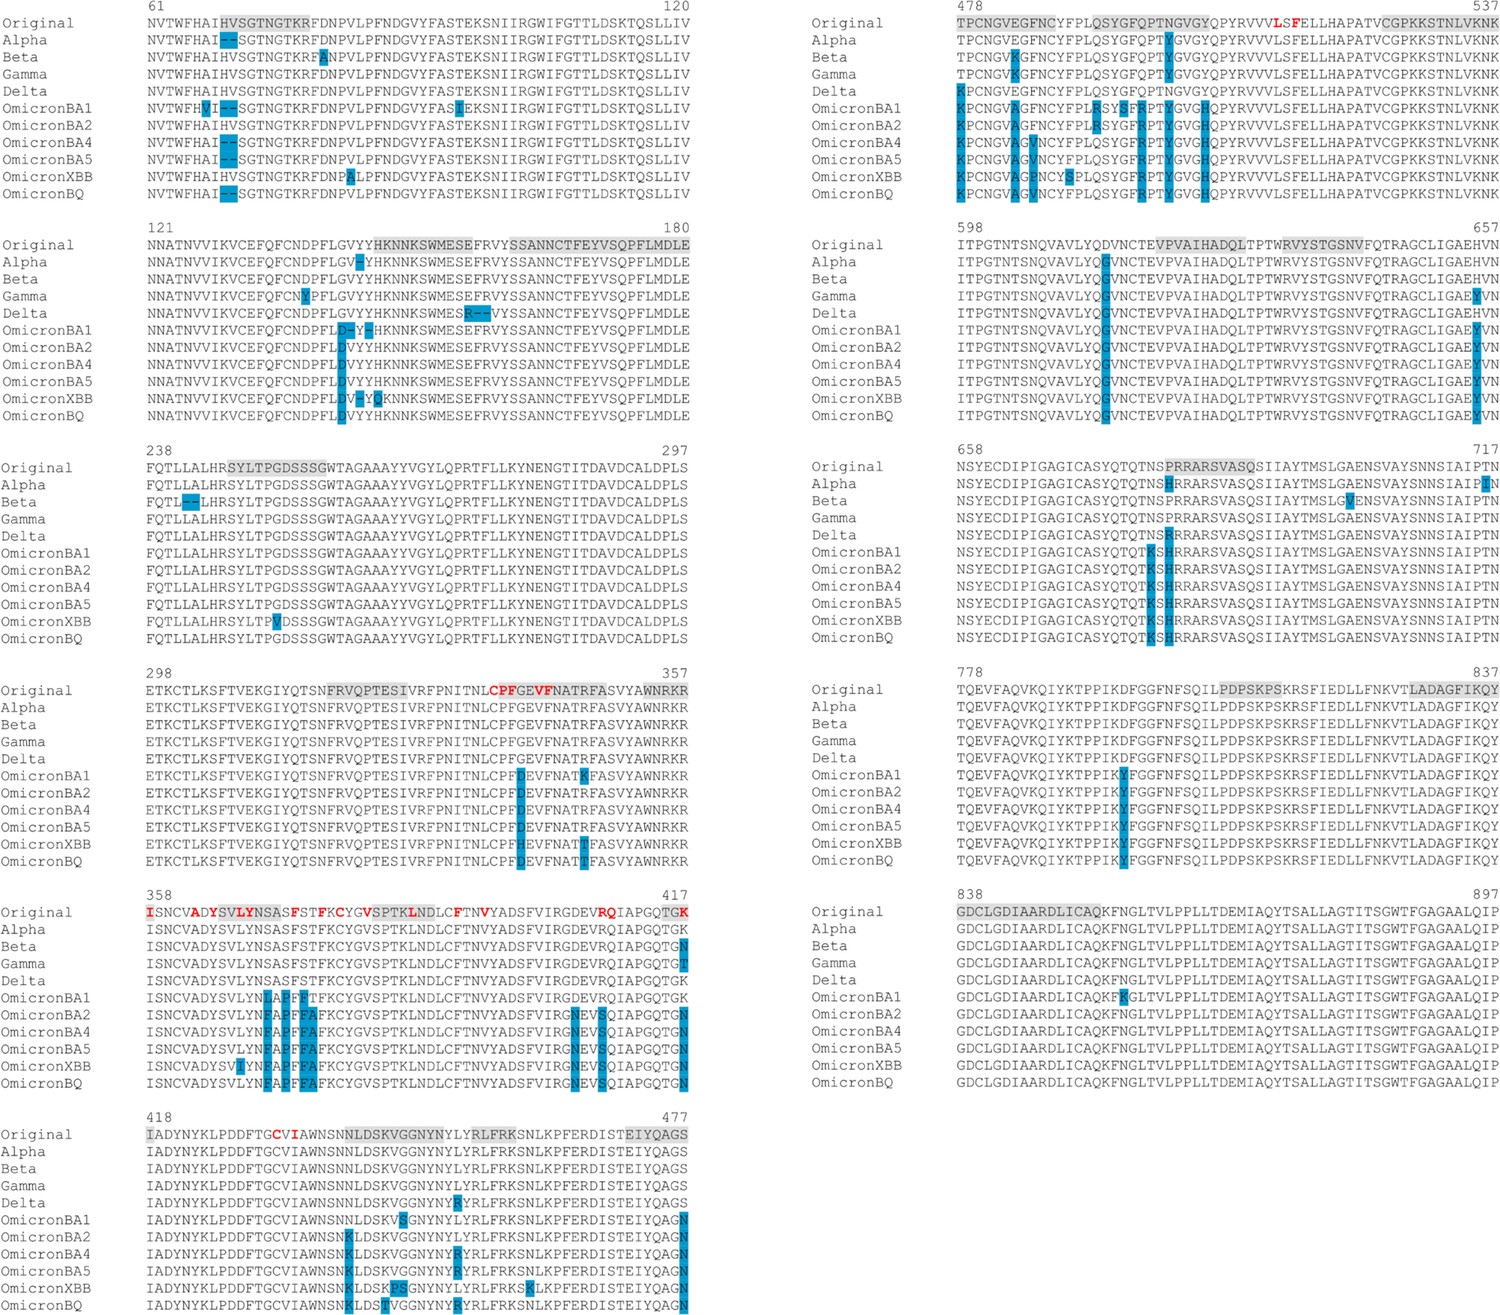
Sequence alignments for the regions connected to the fatty acid (FA) site.
The residues lining the FA site in the original protein are shown in red. The blue boxes represent the location of the substitutions, deletions, and insertions reported for Alpha (SARS-CoV-2 Alpha), Beta (SARS-CoV-2 Beta), Gamma (SARS-CoV-2 Gamma), Delta (SARS-CoV-2 Delta), and several Omicron sub-variants, namely BA.1.1 (SARS-CoV-2 Omicron BA.1.1), BA.2 (SARS-CoV-2 Omicron BA.2), BA.4.1 (SARS-CoV-2 Omicron BA.4.1), BA.5 (SARS-CoV-2 Omicron BA.5), BQ.1.1 (SARS-CoV-2 Omicron BQ.1.1), and XBB.1.5 (SARS-CoV-2 Omicron XBB.1.5) (Gangavarapu et al., 2023). The grey boxes highlight the regions in the original spike shown to respond to the removal of linoleate (LA) from the FA sites. Please zoom in on the image for detailed visualisation.
Figure 5 with 4 supplements
Directions of the structural responses of the receptor-binding domain (RBD) and fusion peptide (FP)-surrounding regions to linoleate (LA) removal.
The average Cα displacement vectors at t=10 ns are shown. These vectors were determined by averaging Cα displacement vectors between the equilibrium and nonequilibrium trajectories over the 210 replicas. Vectors with a length ≥0.1 nm are displayed as blue arrows with a scale-up factor of 10. The average displacement magnitudes are represented on a white-yellow-orange-red scale. The dark grey spheres represent the fatty acid (FA) site. This figure shows the directions of the responses around FA site 1, which is located at the interface between chains C and A (see Figure 5—figure supplement 3, Figure 5—figure supplement 4 for the direction of the motions around the other two FA sites).
Figure 5—figure supplement 1
Average displacement vectors from dynamical nonequilibrium molecular dynamics (D-NEMD) simulations.
Full view of the protein with the average displacement vectors at time 0.1, 1, and 10 ns. The vectors shown were determined by averaging Cα displacement vectors between the equilibrium and nonequilibrium trajectories over the 210 replicas. Vectors with length ≥0.1 nm are displayed as blue arrows with a scale-up factor of 10. Displacement magnitudes are represented on a white-yellow-orange-red scale. Please zoom in on the image for a detailed visualisation.
Figure 5—figure supplement 2
Direction of the motions from dynamical nonequilibrium molecular dynamics (D-NEMD) in response to linoleate (LA) removal.
Close-up view of the direction of the responses of the RBDCA (A), NTDB (B), and FPB surrounding regions (C). Chain ID (A, B, or C) is indicated in subscript. The average Cα displacement vectors at times 0.1, 1, and 10 ns are shown. These vectors were determined by averaging Cα displacement vectors between the equilibrium and nonequilibrium trajectories over the 210 replicas. Vectors with a length ≥0.1 nm are displayed as blue arrows with a scale-up factor of 10. The average displacement magnitudes are represented on a white-yellow-orange-red scale. The dark grey spheres represent the fatty acid (FA) site. This figure shows the direction of the responses around FA site 1, which is located at the interface between chains C and A. Please zoom in on the image for a detailed visualisation.
Figure 5—figure supplement 3
Direction of the motions from dynamical nonequilibrium molecular dynamics (D-NEMD) in response to linoleate (LA) removal.
Close-up view of the direction of the responses of the RBDAB (A), NTDC (B), and FPC surrounding regions (C). Chain ID (A, B, or C) is indicated in subscript. The average Cα displacement vectors at times 0.1, 1, and 10 ns are shown. These vectors were determined by averaging Cα displacement vectors between the equilibrium and nonequilibrium trajectories over the 210 replicas. Vectors with a length ≥0.1 nm are displayed as blue arrows with a scale-up factor of 10. The average displacement magnitudes are represented on a white-yellow-orange-red scale. The dark grey spheres represent the fatty acid (FA) site. This figure shows the direction of the responses around FA site 2, which is located at the interface between chains A and B.
Figure 5—figure supplement 4
Direction of the motions from dynamical nonequilibrium molecular dynamics (D-NEMD) in response to linoleate (LA) removal.
Close-up view of the direction of the responses of the RBDBC (A), NTDA (B), and FPA surrounding regions (C). Chain ID (A, B, or C) is indicated in subscript. The average Cα displacement vectors at times 0.1, 1, and 10 ns are shown. These vectors were determined by averaging Cα displacement vectors between the equilibrium and nonequilibrium trajectories over the 210 replicas. Vectors with a length ≥0.1 nm are displayed as blue arrows with a scale-up factor of 10. The average displacement magnitudes are represented on a white-yellow-orange-red scale. The dark grey spheres represent the fatty acid (FA) site. This figure shows the direction of the responses around FA site 3, which is located at the interface between chains B and C.
Figure 6 with 1 supplement
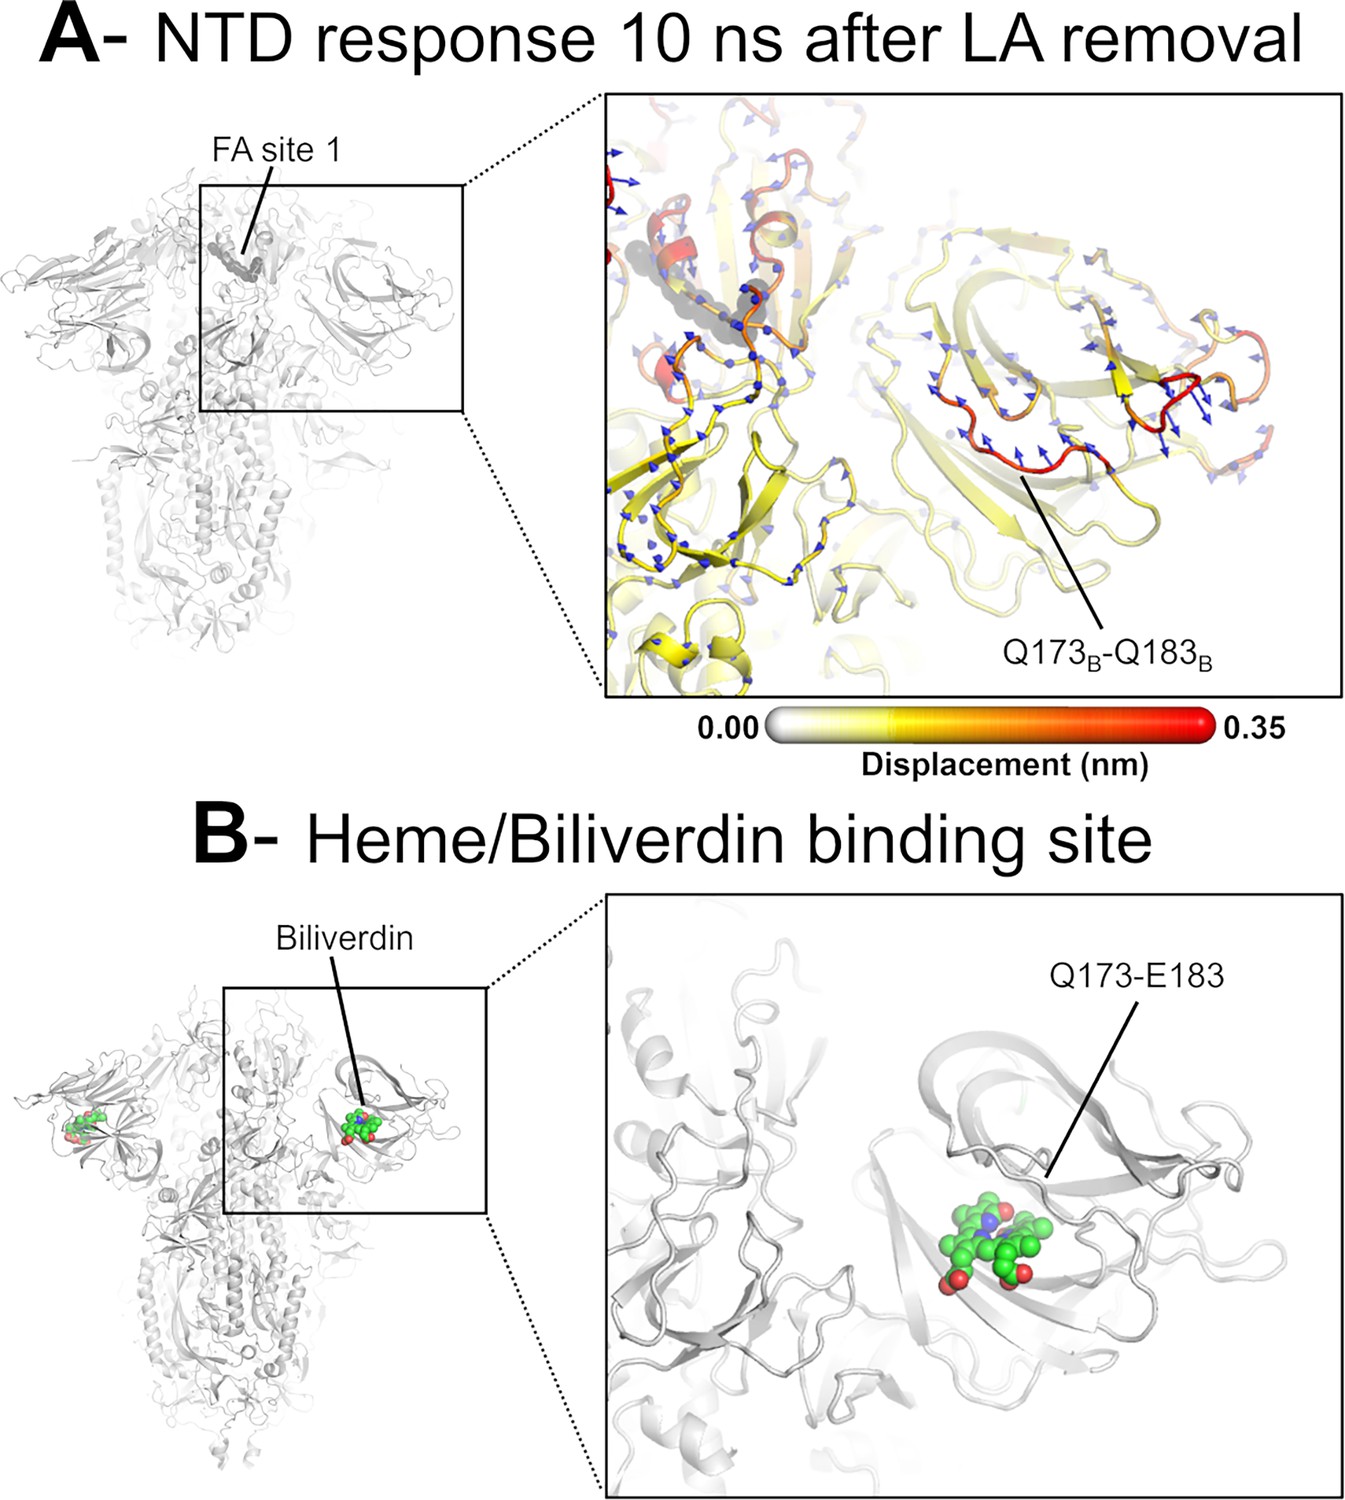
Dynamical nonequilibrium molecular dynamics (D-NEMD) displacement vectors show a connection between the fatty acid (FA) site and the heme/biliverdin binding site in the N-terminal domain (NTD).
(A) View of the NTD 10 ns after linoleate (LA) removal, focusing on the heme/biliverdin binding site (Freeman et al., 2023; Rosa et al., 2021) (which is not occupied in the simulations here). Note that the Q173-Q183 segment, which contains residues forming the heme/biliverdin binding site, shows an outward motion upon LA removal. The magnitudes of the displacements are represented on a white-yellow-orange-red colour scale. Vectors with a length ≥0.1 nm are displayed as blue arrows with a scale-up factor of 10. The dark grey spheres represent the FA site. This figure shows the direction of the structural responses around FA site 1 (see Figure 6—figure supplement 1 for the direction of the motions in the other two FA sites). (B) Cryo-EM structure showing the heme/biliverdin binding site in the NTD (PDB code: 7NT9) (Rosa et al., 2021). The protein is coloured in grey. The biliverdin molecules are shown with spheres.
Figure 6—figure supplement 1
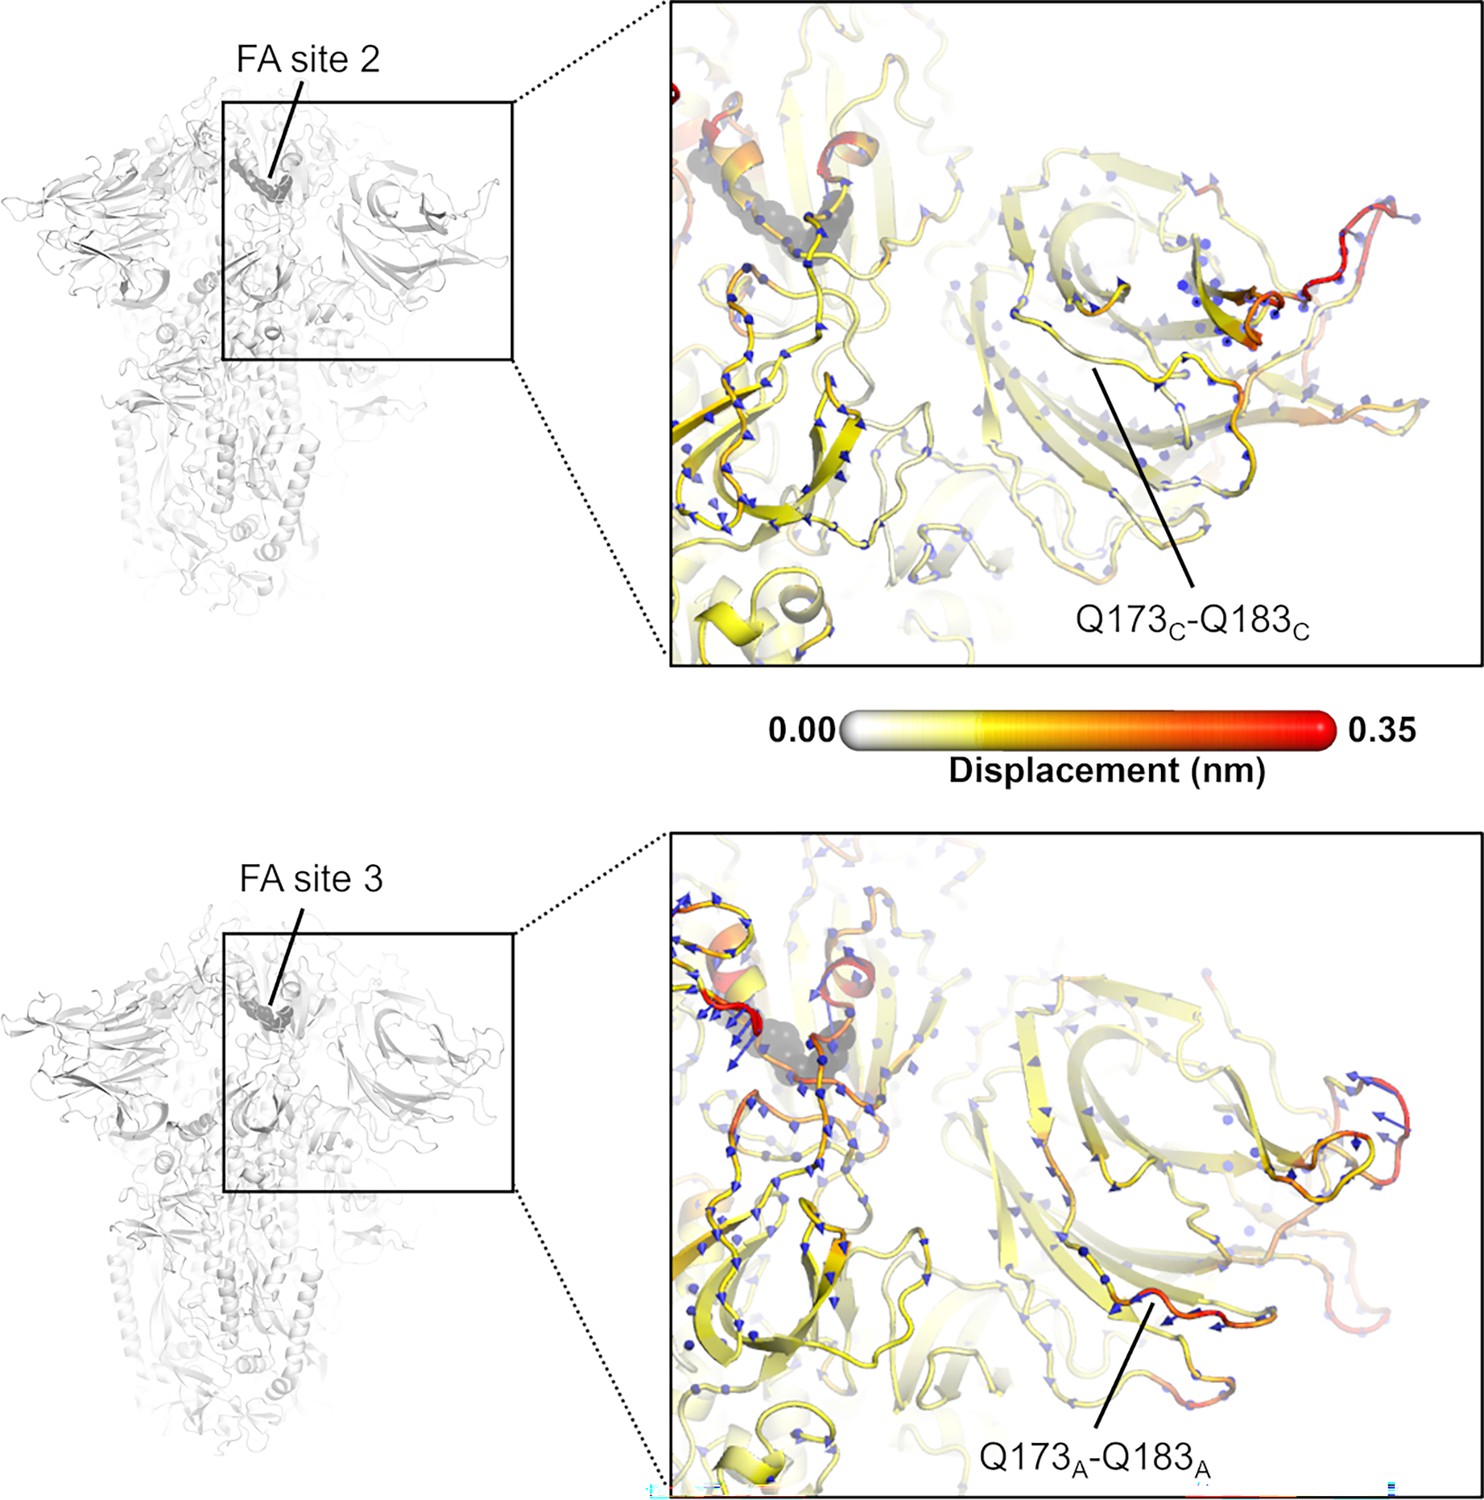
Direction of the dynamical nonequilibrium molecular dynamics (D-NEMD) structural responses of NTDC (top panel) and NTDA (bottom panel) at t=10 ns.
Similarly to the responses of NTDB (in main text Figure 6), the Q173-Q183 region in NTDA (situated closer to fatty acid [FA] site 3) shows an outward motion upon linoleate (LA) removal. The magnitudes of the displacements are represented on a white-yellow-orange-red. Vectors with a length ≥0.1 nm are displayed as blue arrows with a scale-up factor of 10. The dark grey spheres represent the FA site.
Figure 7 with 1 supplement
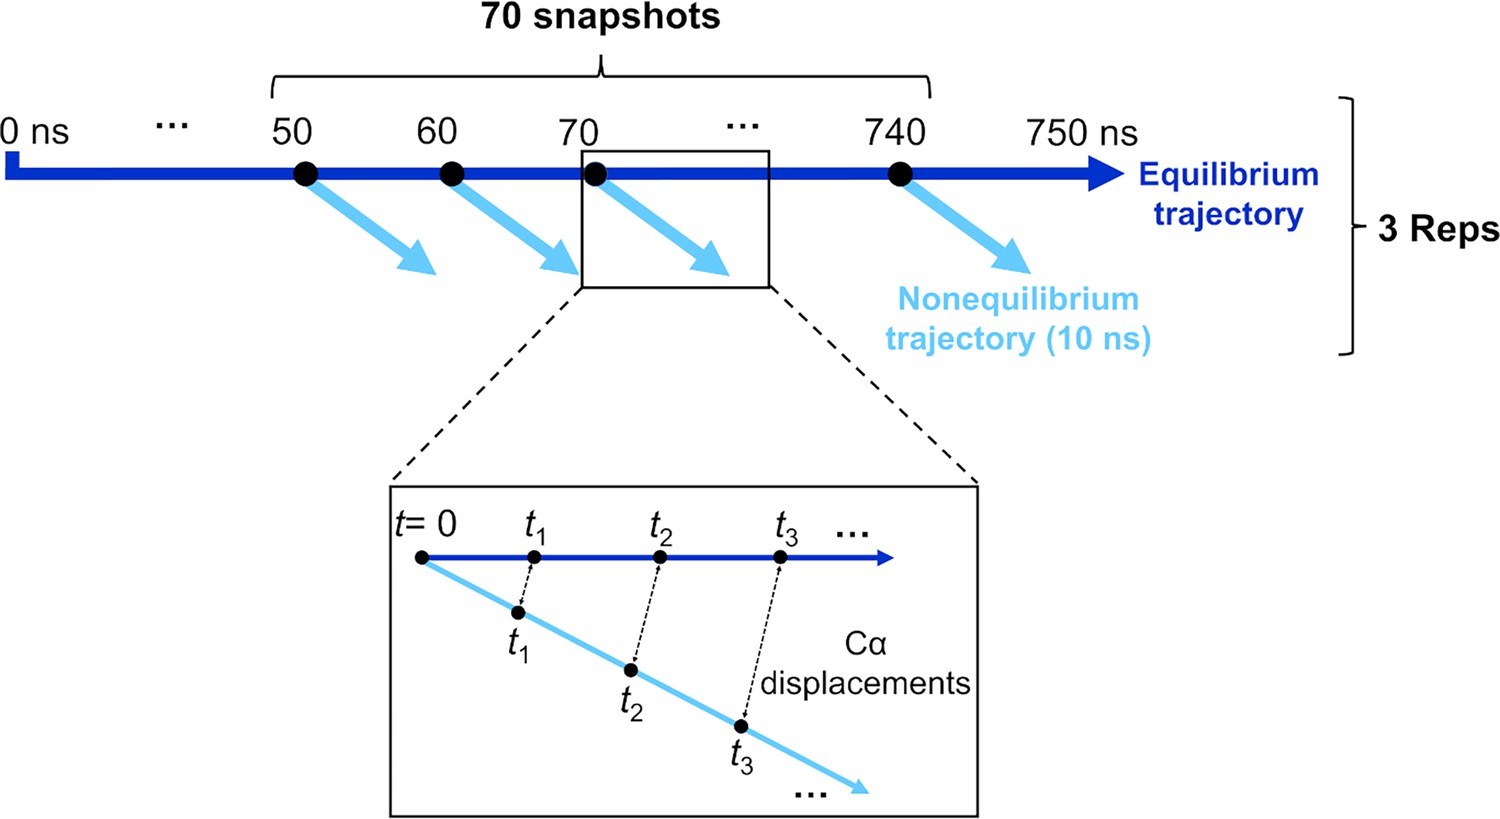
Schematic of the procedure used to set up and analyse the dynamical nonequilibrium molecular dynamics (D-NEMD) simulations here.
Three equilibrium MD simulations, 750 ns each, were performed for the fully glycosylated, cleaved (with cleavage at the S1/S2 interface) spike in the closed state. These equilibrium trajectories were then used to generate starting structures for the short apo nonequilibrium simulations. From the equilibrated part of each linoleate (LA)-bound simulation (from 50 to 750 ns), conformations were extracted every 10 ns, and the perturbation was introduced. Each D-NEMD simulation was run for 10 ns. The Kubo-Onsager (Oliveira et al., 2021a; Ciccotti and Ferrario, 2016; Balega et al., 2024; Ciccotti et al., 1979; Ciccotti, 1991) relation was used to extract the response of the system to LA annihilation from the fatty acid (FA) pockets: for each pair of equilibrium LA-bound and D-NEMD apo trajectories, the displacement of each Cα at equivalent times (namely 0, 0.1, 1, and 10 ns) was determined and averaged over all 210 pairs of simulations.
Figure 7—figure supplement 1

Schematic representation of the dynamical nonequilibrium molecular dynamics (D-NEMD) approach.
Equilibrium MD trajectories (dark blue line) provide the initial distribution of conformations for the nonequilibrium simulations at time t=0 (light blue lines).
Additional files
Download links
A two-part list of links to download the article, or parts of the article, in various formats.
Downloads (link to download the article as PDF)
Open citations (links to open the citations from this article in various online reference manager services)
Cite this article (links to download the citations from this article in formats compatible with various reference manager tools)
Allosteric modulation by the fatty acid site in the glycosylated SARS-CoV-2 spike
eLife 13:RP97313.
https://doi.org/10.7554/eLife.97313.3


