Exploring the repository of de novo-designed bifunctional antimicrobial peptides through deep learning
- Frontiers Science Center for Synthetic Biology (Ministry of Education), Tianjin Key Laboratory of Function and Application of Biological Macromolecular Structures, School of Life Sciences, Faculty of Medicine, Tianjin University, China
- Center for Quantitative Biology, Academy for Advanced Interdisciplinary Studies, Peking University, China
- Department of Microbiology, School of Basic Medicine, Fourth Military Medical University, China
- Department of Microbiology, Second Military Medical University, China
- State Key Laboratory of Trauma and Chemical Poisoning, Institute of Combined Injury of PLA, College of Preventive Medicine, Third Military Medical University (Army Medical University), China
- Tianjin Cancer Hospital Airport Hospital, China
- School of Computer Science and Engineering, Central South University, China
Figures
Figure 1 with 3 supplements
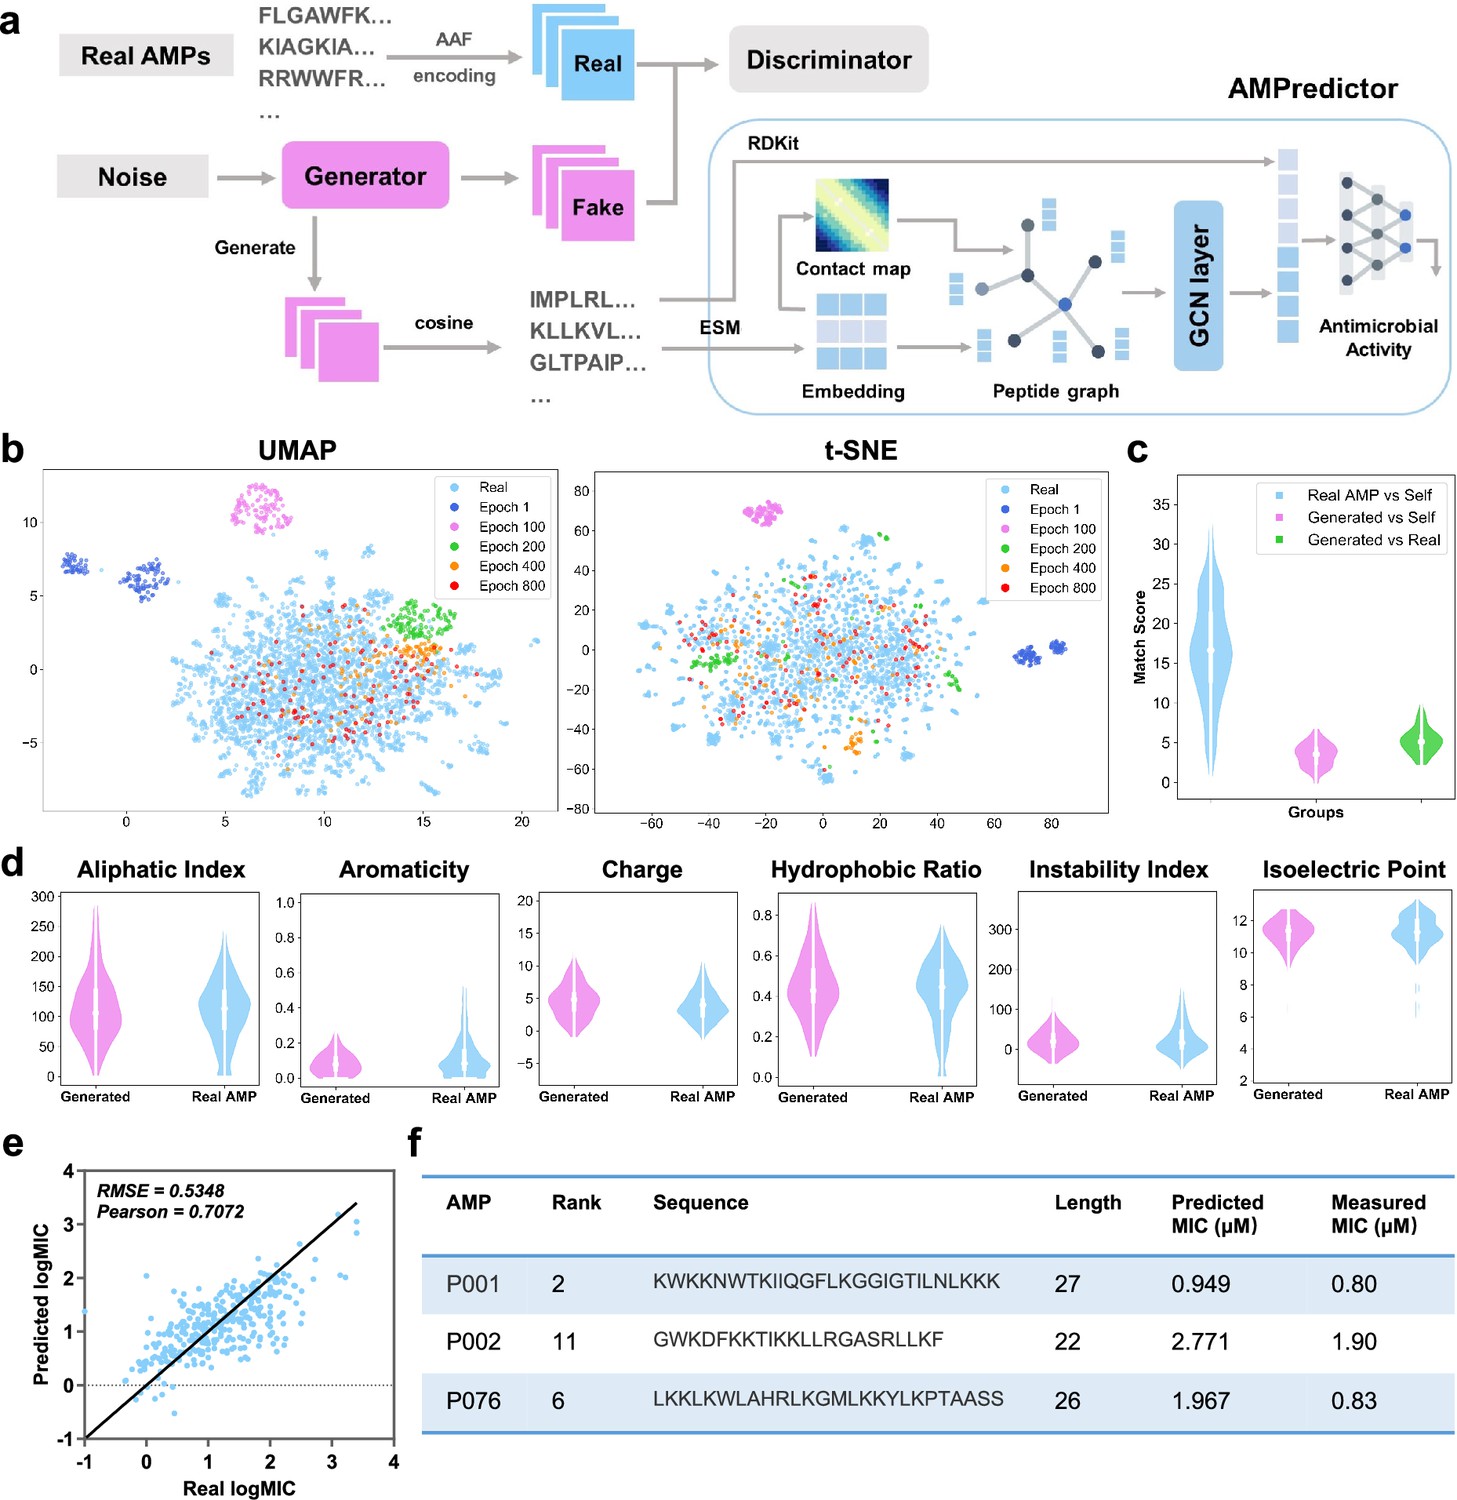
Deep learning-based design of novel antimicrobial peptides.
(a) The overall framework of generative adversarial network (GAN) generator and antimicrobial activity predictor (AMPredictor). (b) Visualization of GAN training process via uniform manifold approximation and projection (UMAP) and t-distributed stochastic neighbor embedding (t-SNE). The newly generated sequences fit the distribution of known antimicrobial peptide (AMP) space gradually. (c) Global alignment match scores between the generated sequences and itself and AMPs in the training set. (d) Six physiochemistry properties of generated peptides and real AMP sets. (e) Regression results of AMPredictor model on its test set. (f) The sequences of three selected peptides as well as their predicted and experimentally validated minimal inhibitory concentration (MIC) values against E. coli ATCC 25922.
Figure 1—figure supplement 1
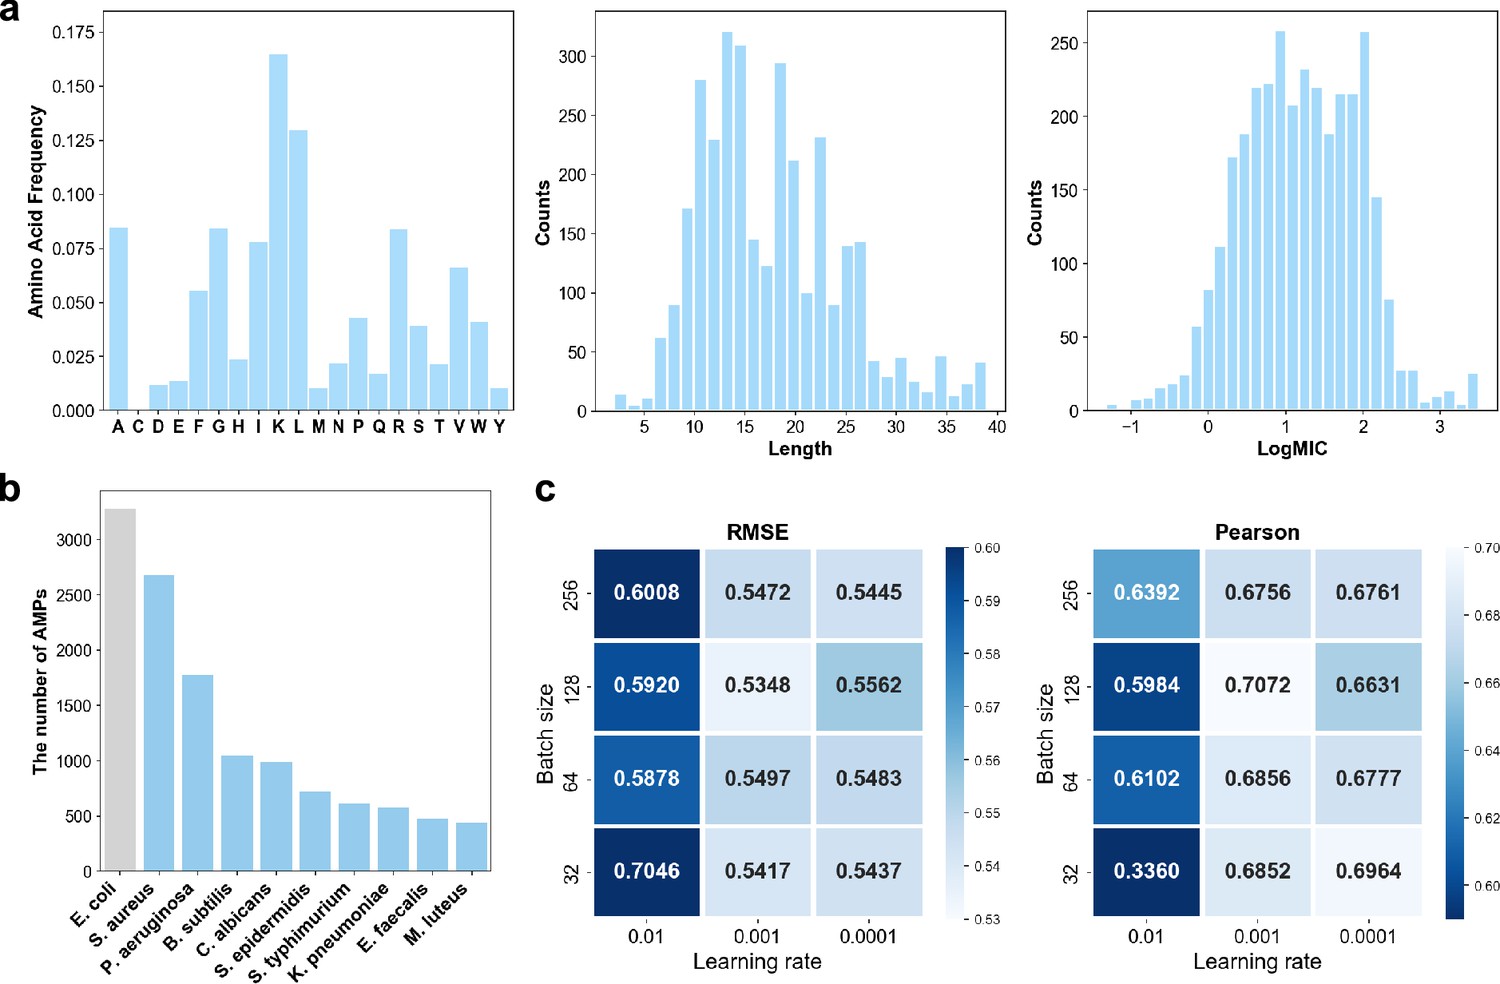
Dataset and hyperparameter settings of antimicrobial activity predictor (AMPredictor).
(a) Distributions of amino acid compositions, sequence length, and antimicrobial activity numeric labels (logMIC). (b) Top 10 kinds of microbes related to the AMPs in training set and the number of AMPs. (c) Grid search results of the batch size and learning rate, measured with root mean squared error (RMSE) and Pearson correlation coefficient.
Figure 1—figure supplement 2
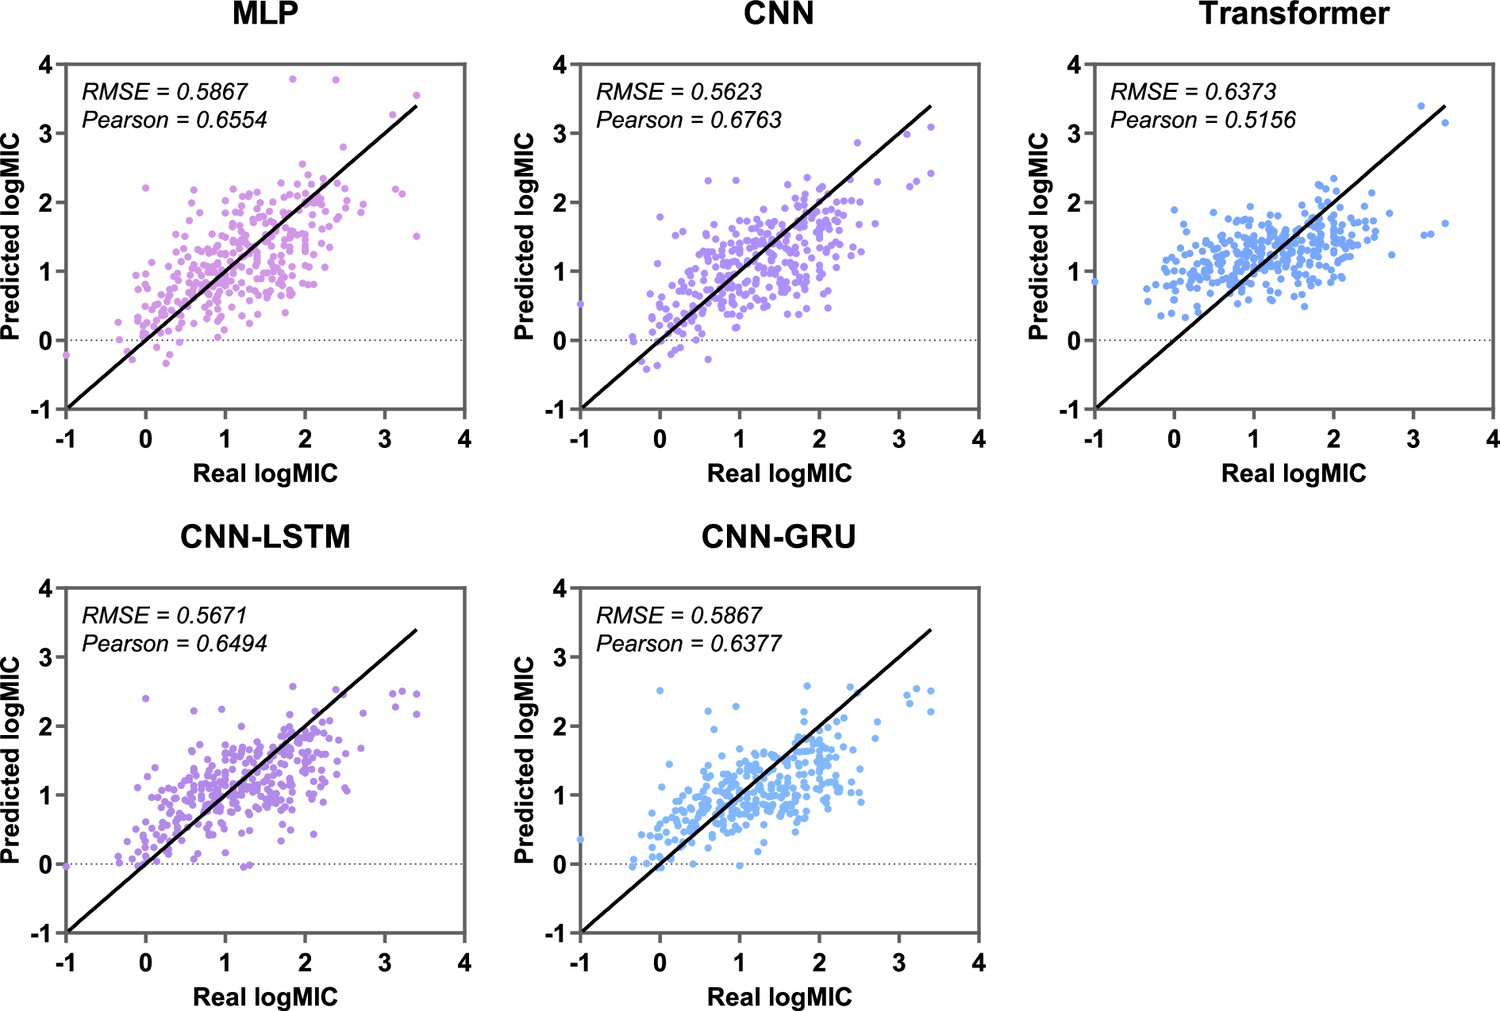
Antimicrobial activity regression results on test set of five baseline models.
Figure 1—figure supplement 3
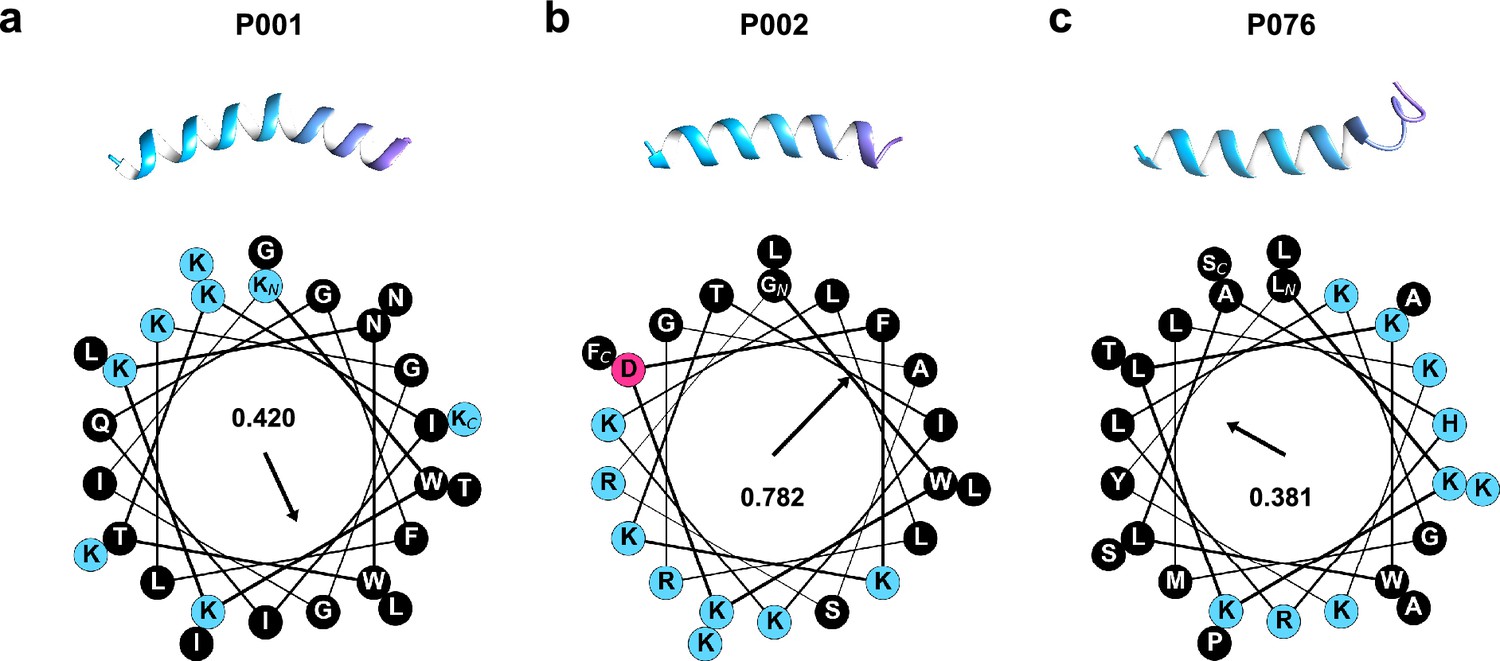
Predicted structures and the helical wheel projection of three selected peptides.
Structures are predicted by AlphaFold2 (single-sequence version). Helical wheels are plotted with modlAMP package, and the Eisenberg hydrophobic moments are calculated and shown in the center. (a) P001; (b) P002; (c) P076.
Figure 2 with 25 supplements
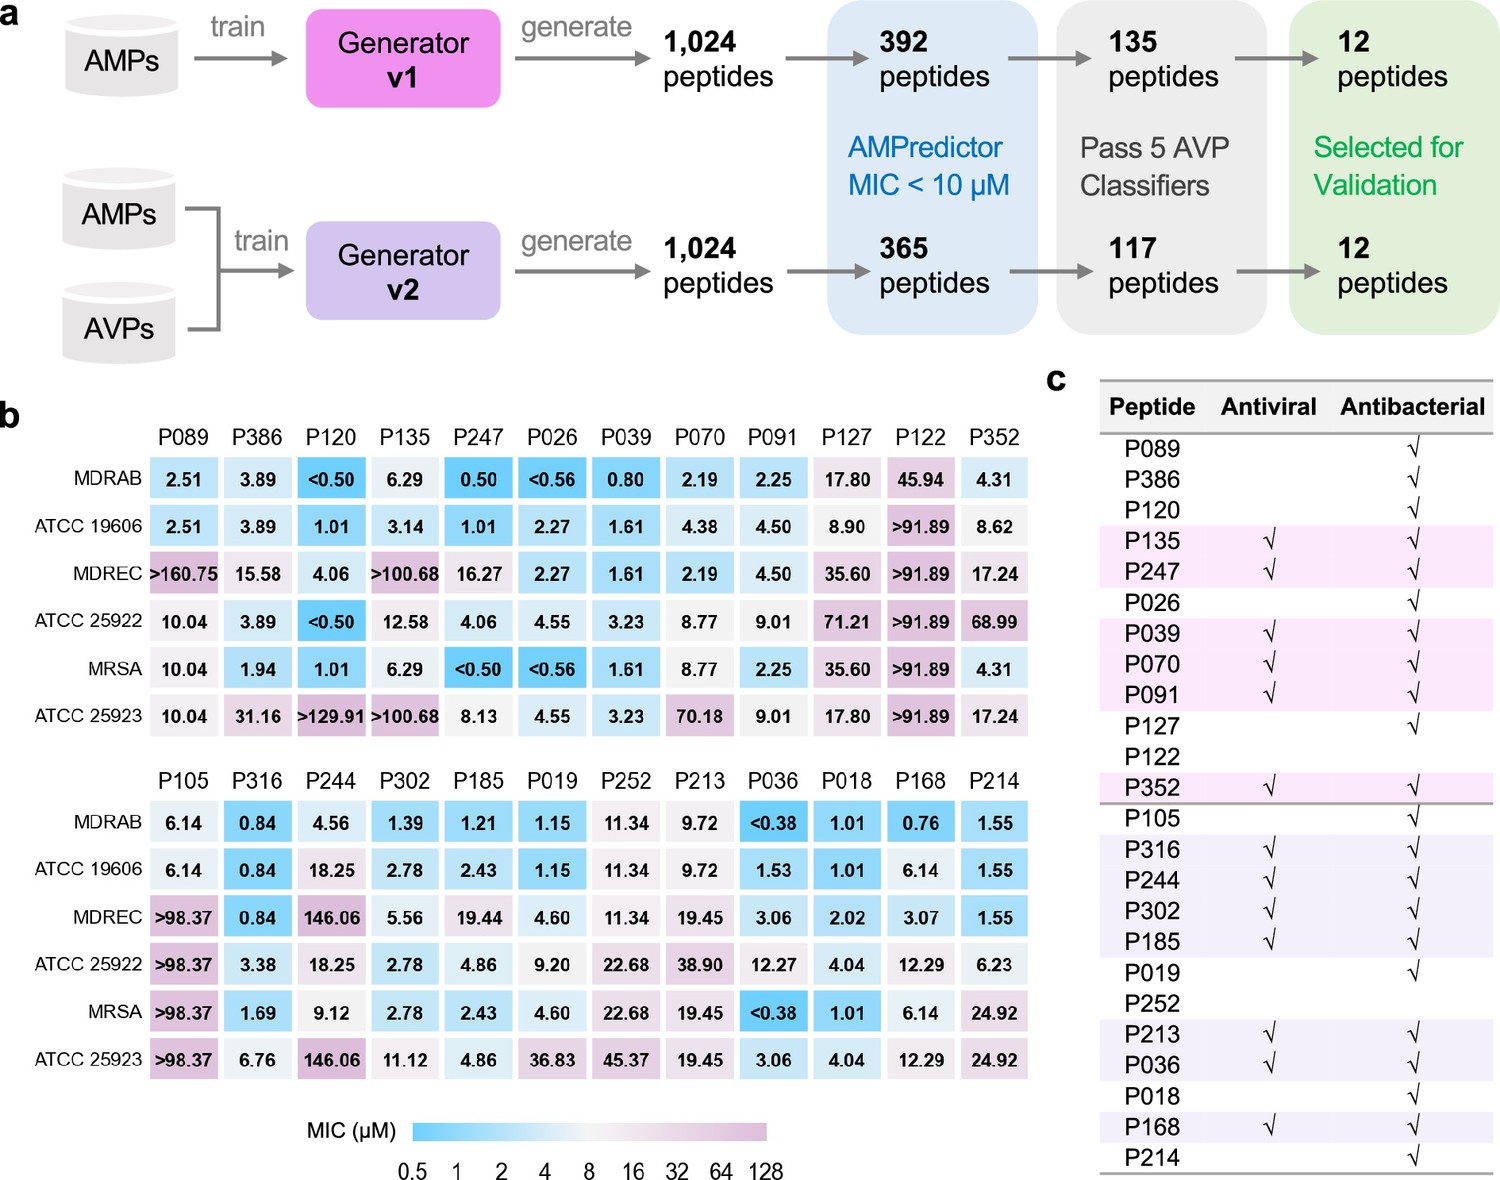
Large-scale design and validation of bifunctional antimicrobial peptides (AMPs).
(a) Schemes of designing bifunctional AMPs from two versions of generators. 12 designed peptides from each generator were selected for experimental validation. (b) Minimal inhibitory concentration (MIC) test of 24 designed peptides against six bacterial strains. The first group included 12 peptides from generator v1, and the other 12 peptides were from generator v2. (c) Antiviral and antibacterial results for bifunctional peptides. The rows with pink or purple backgrounds are bifunctional AMPs acquired from generators v1 or v2, respectively.
Figure 2—figure supplement 1

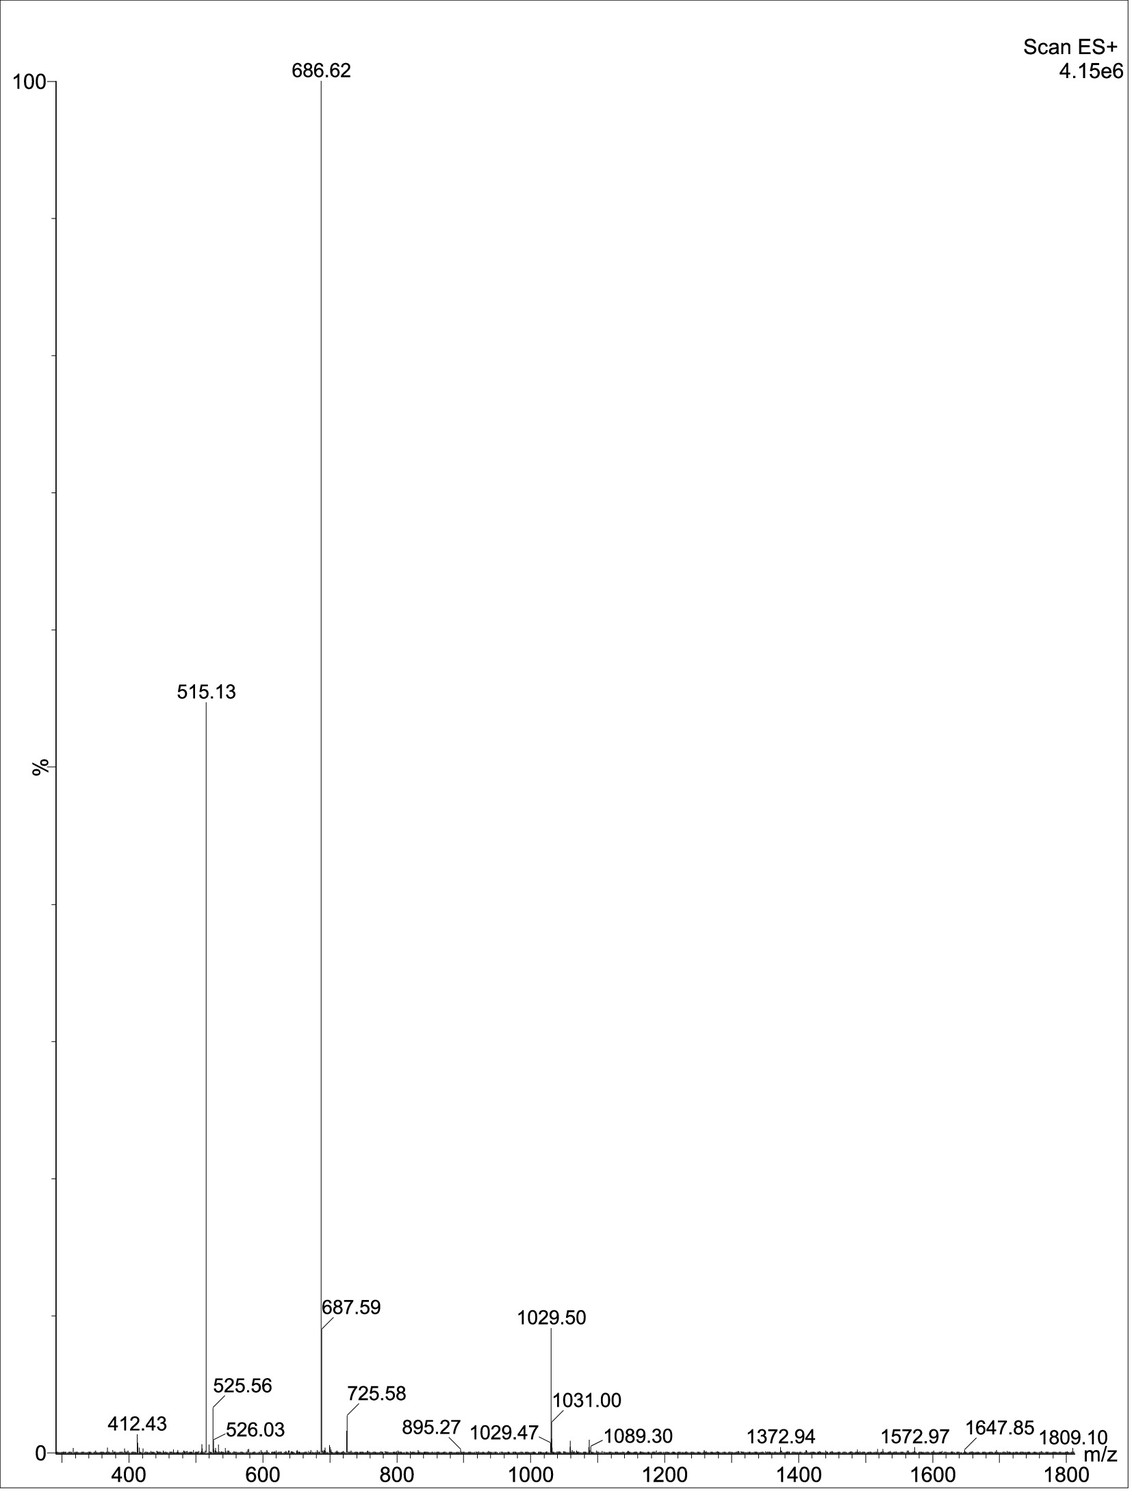
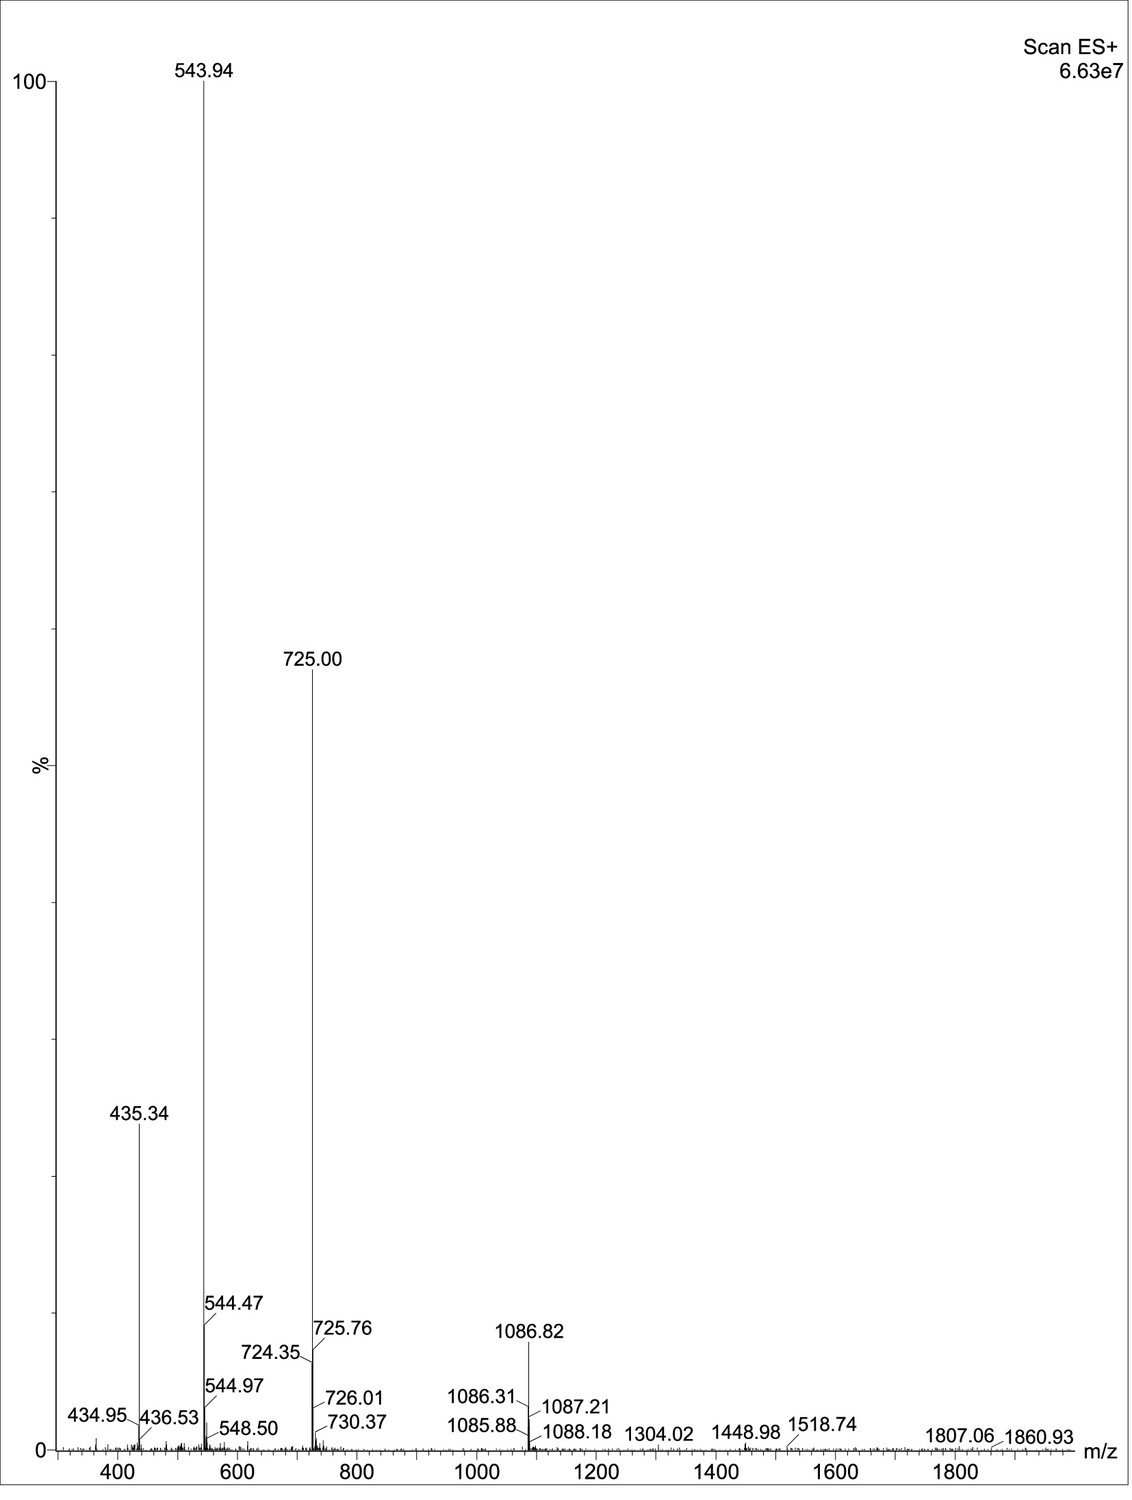
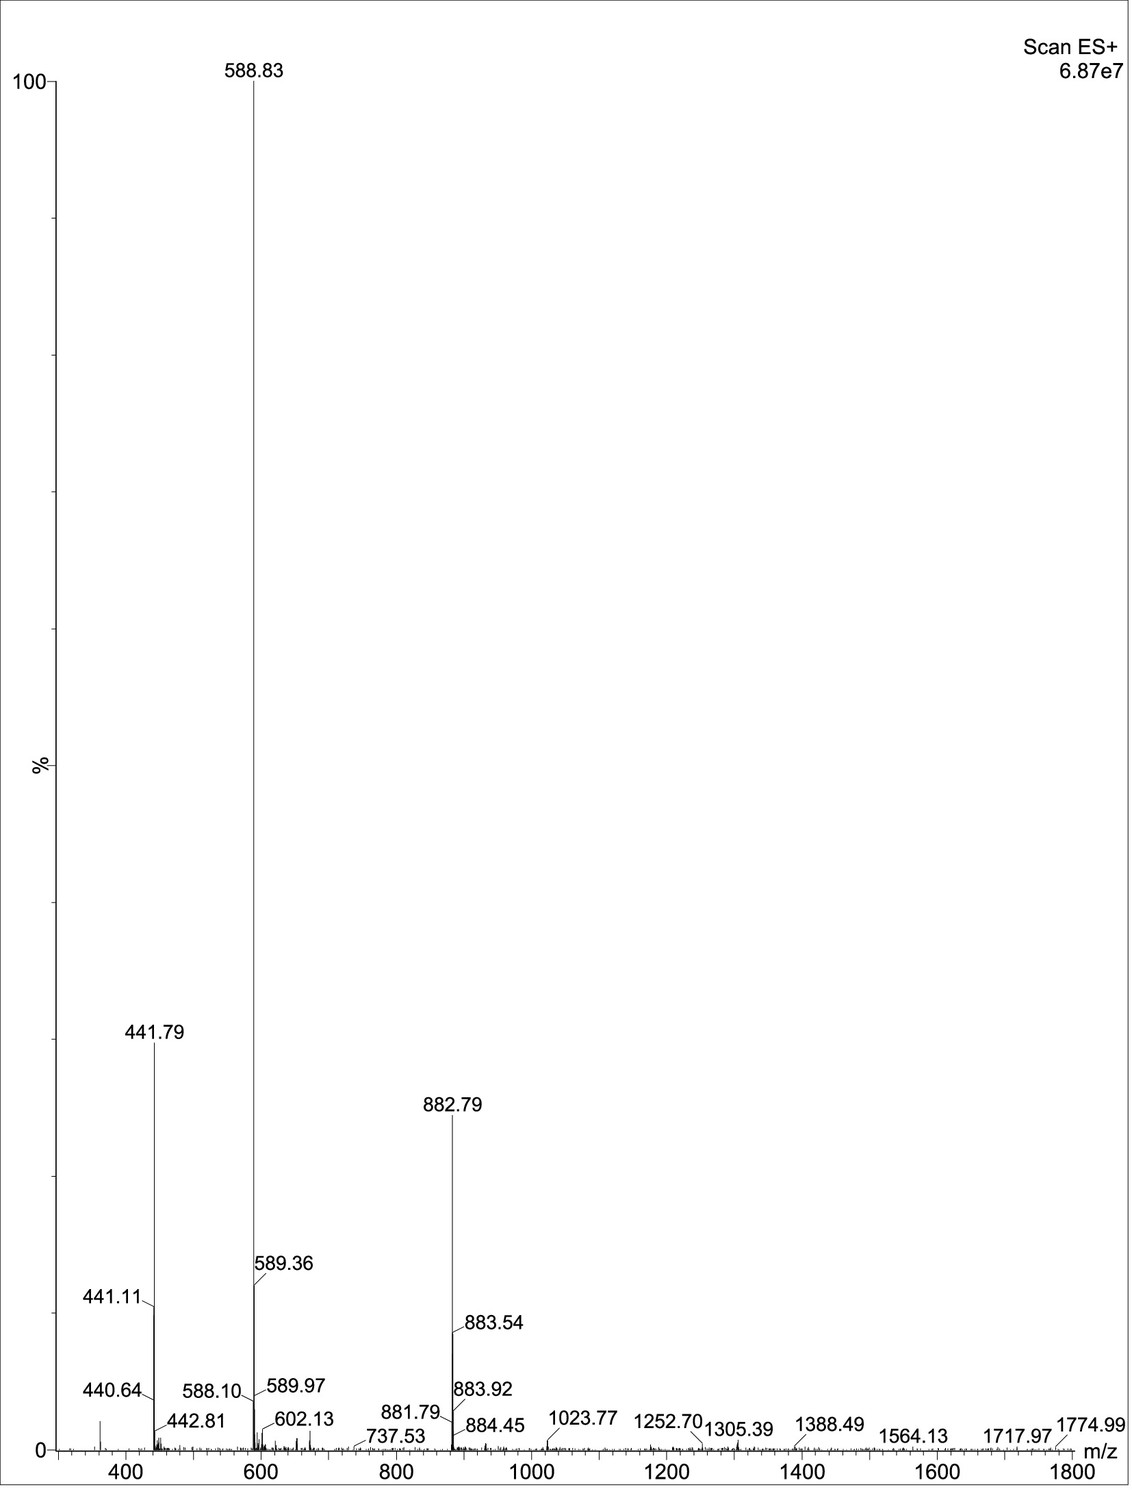
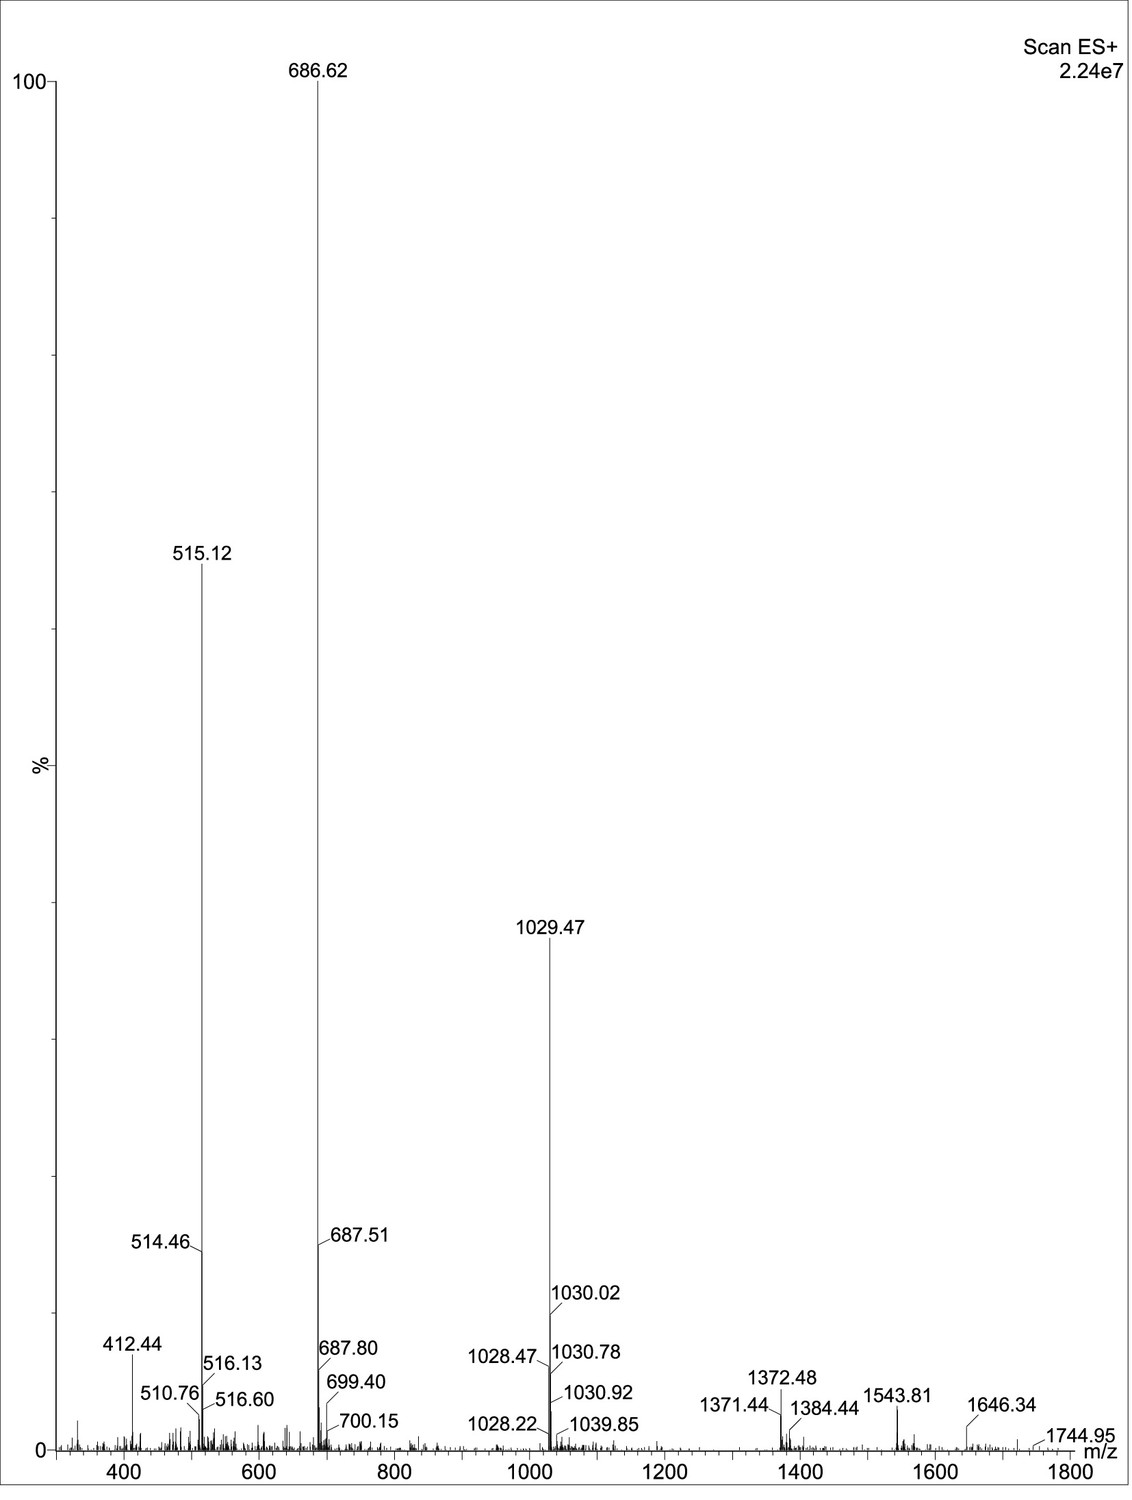
Mass spectrometry analysis.
(a) P001; (b) P002; (c) P076.
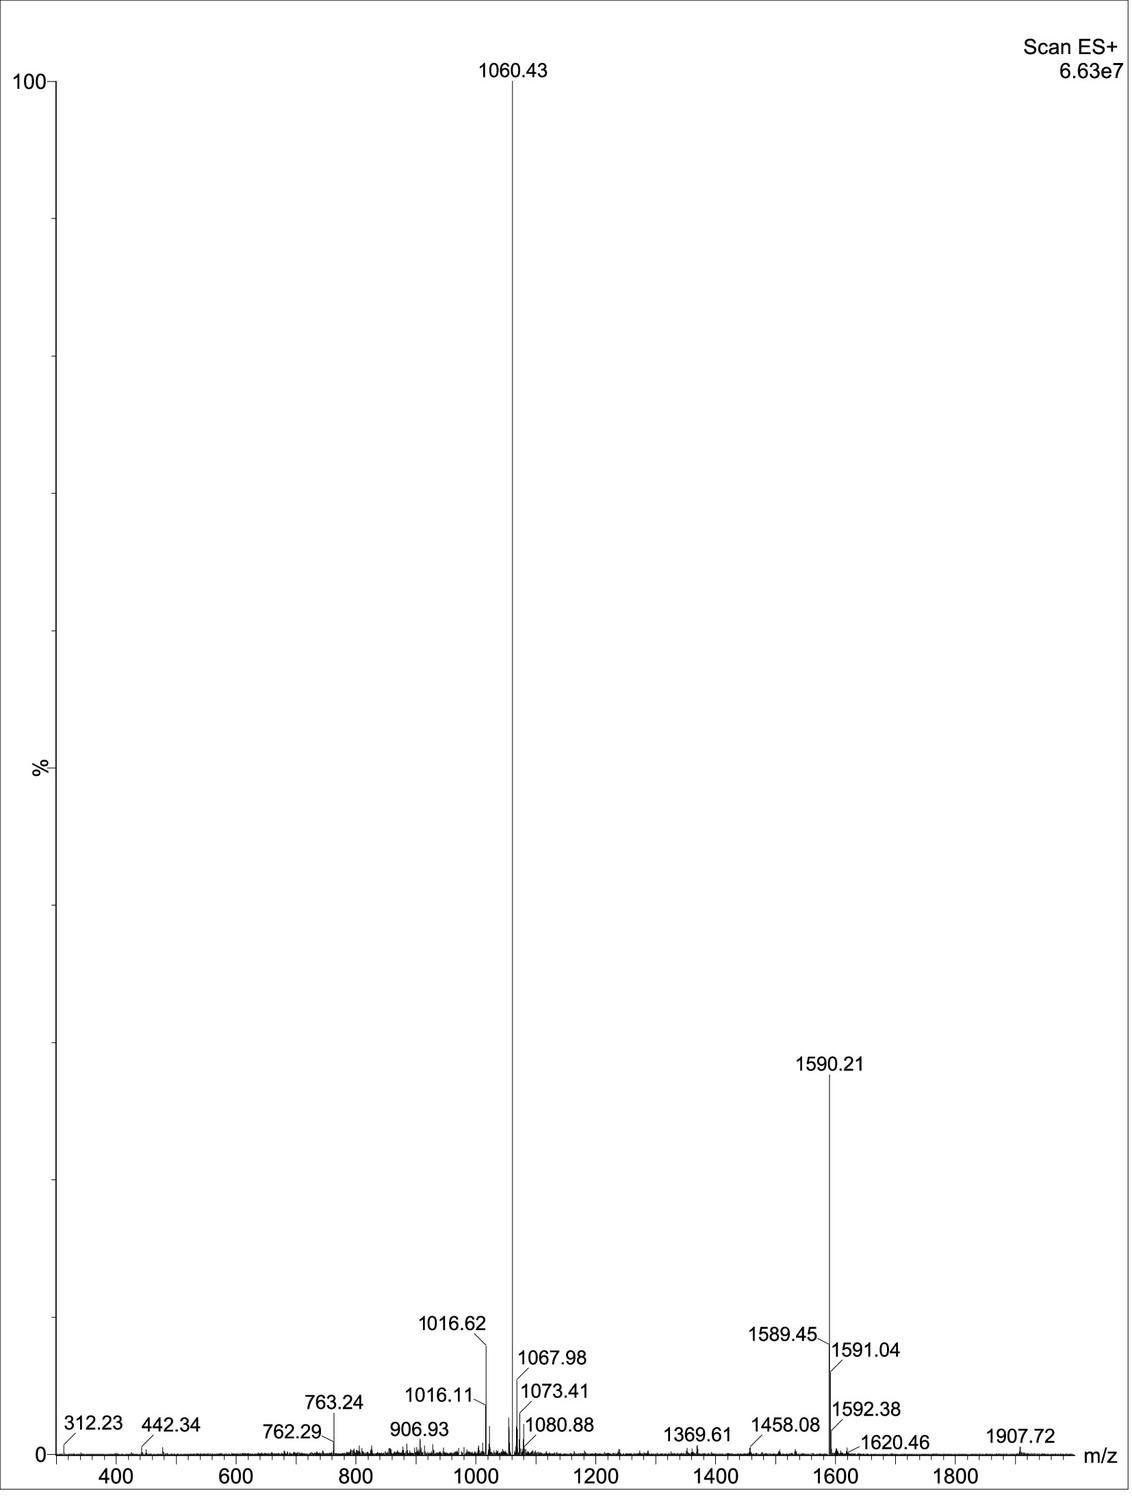
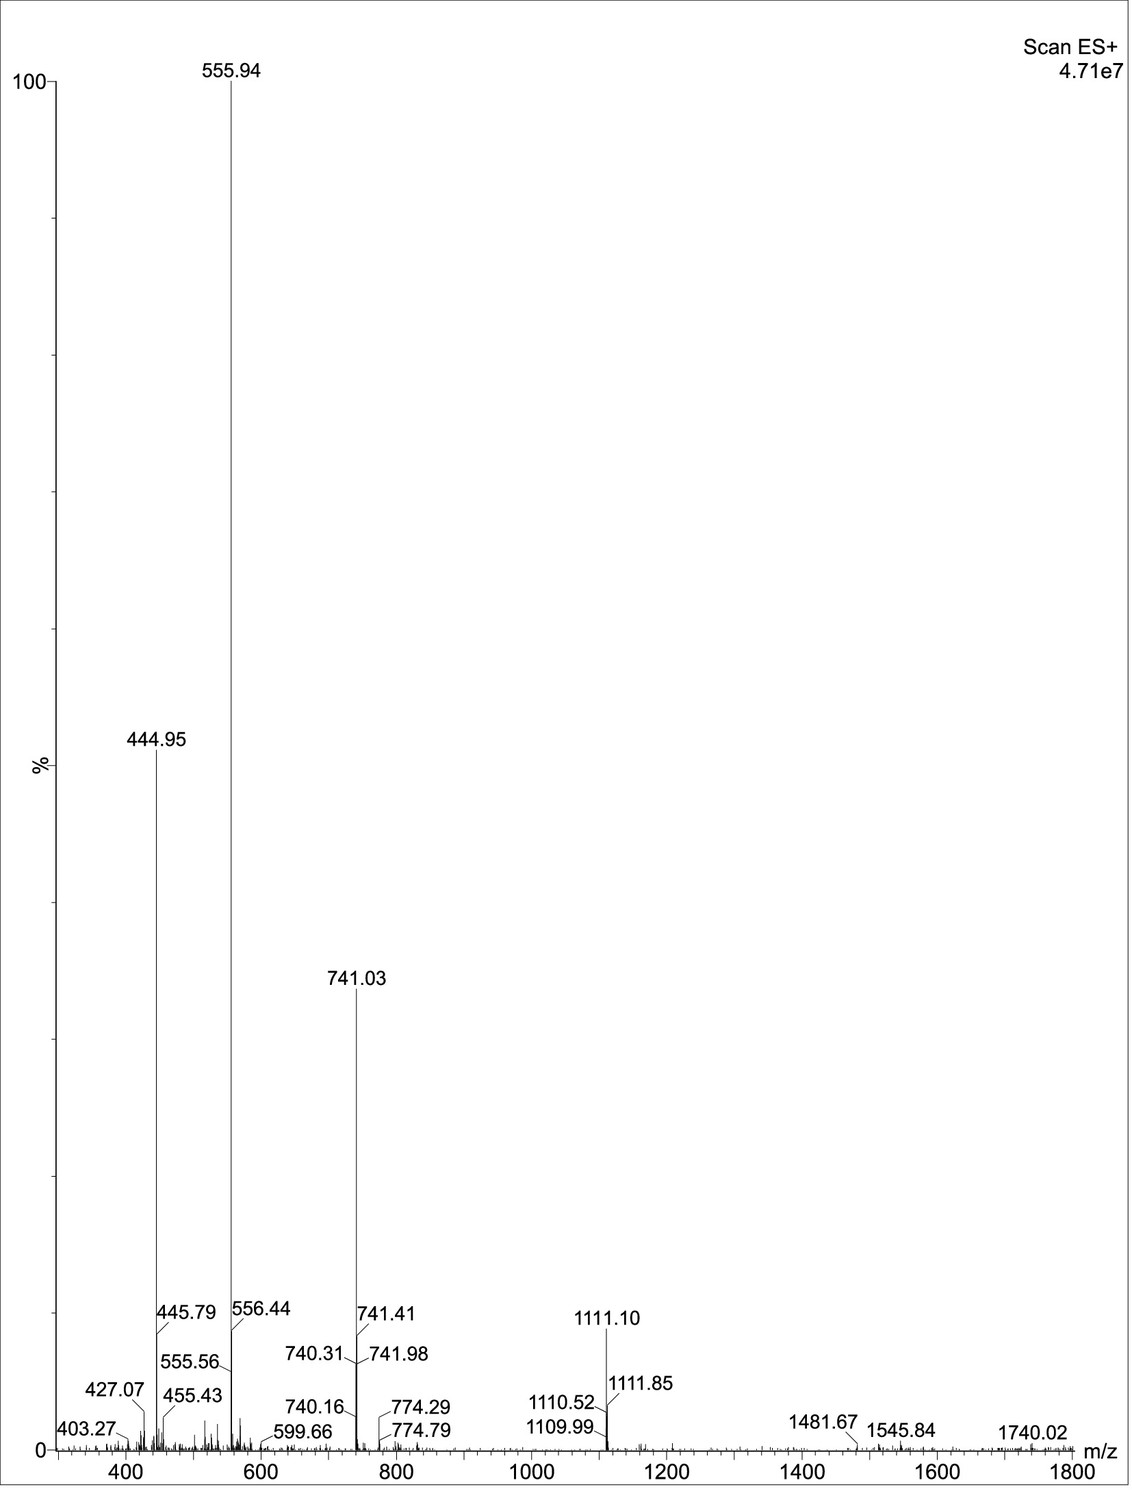
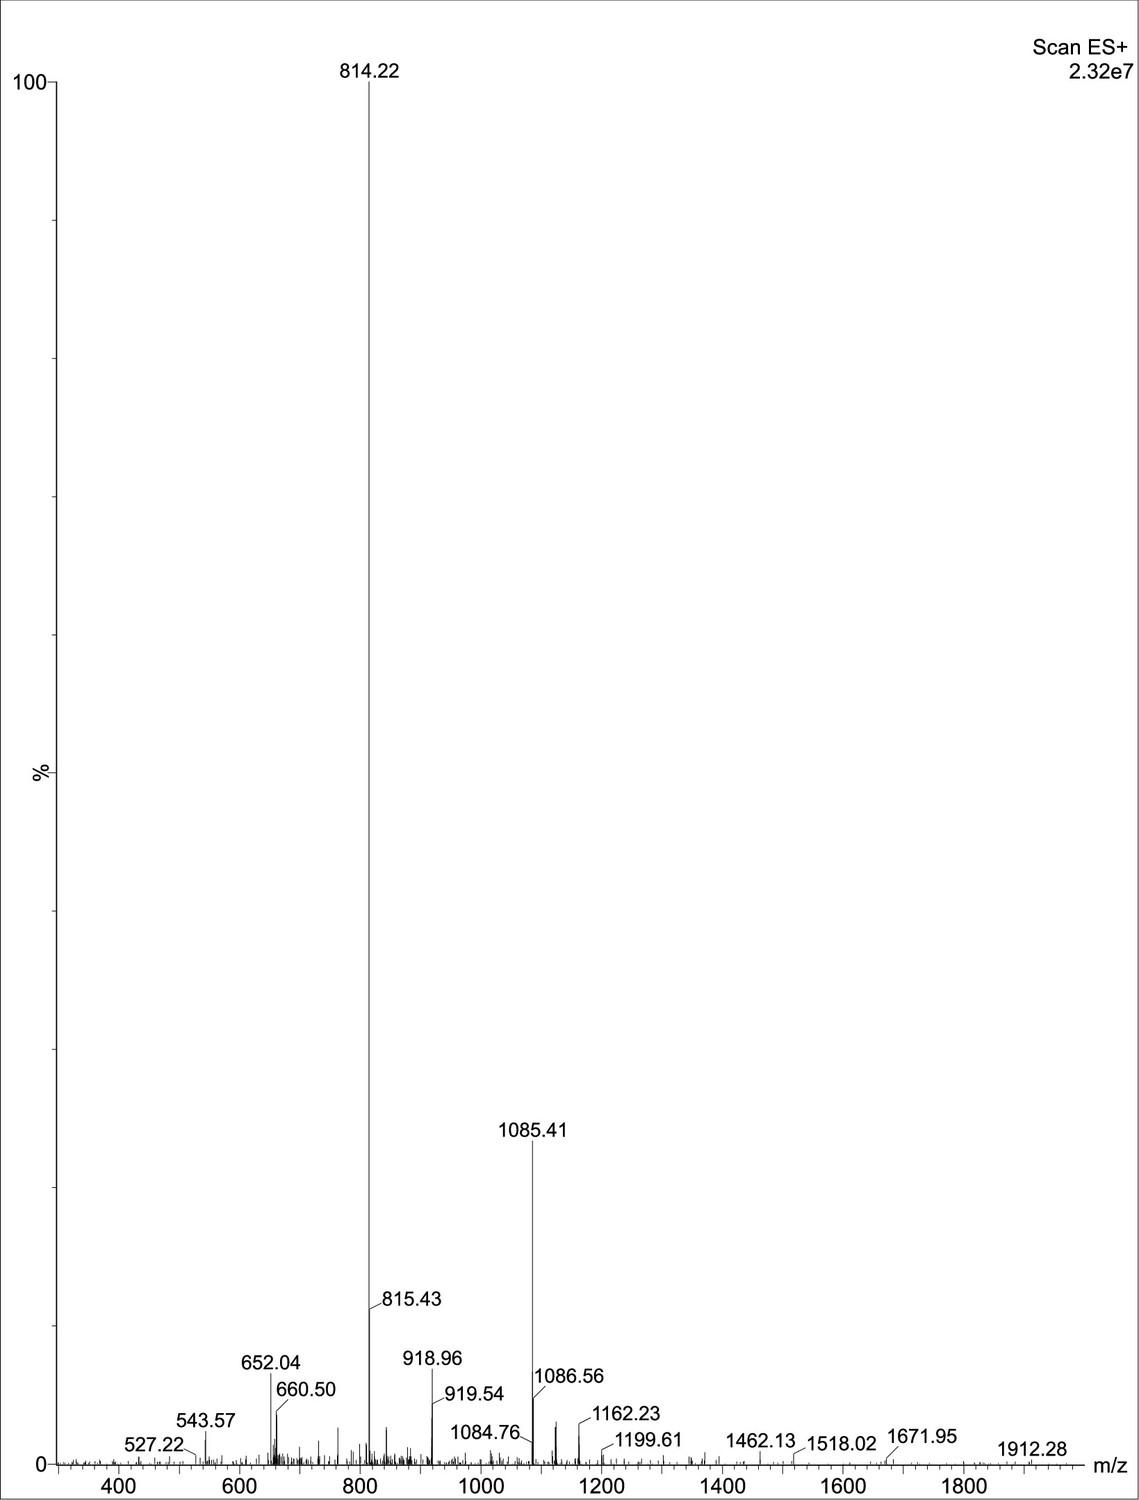
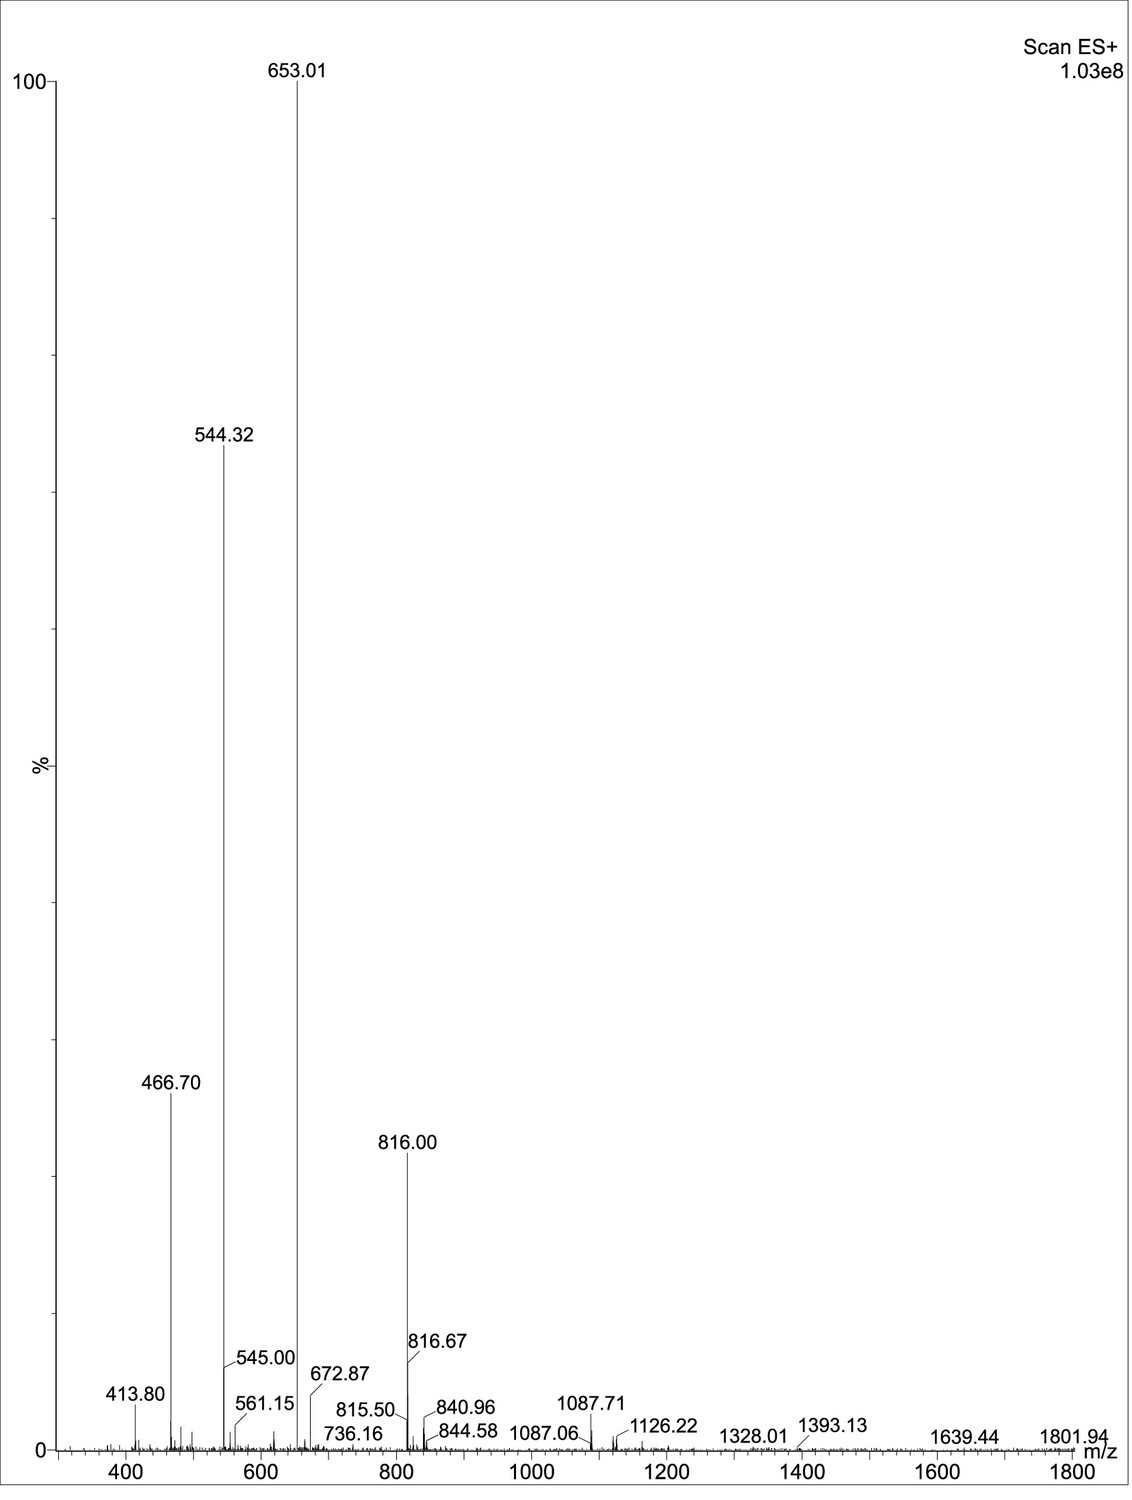
Figure 2—figure supplement 2
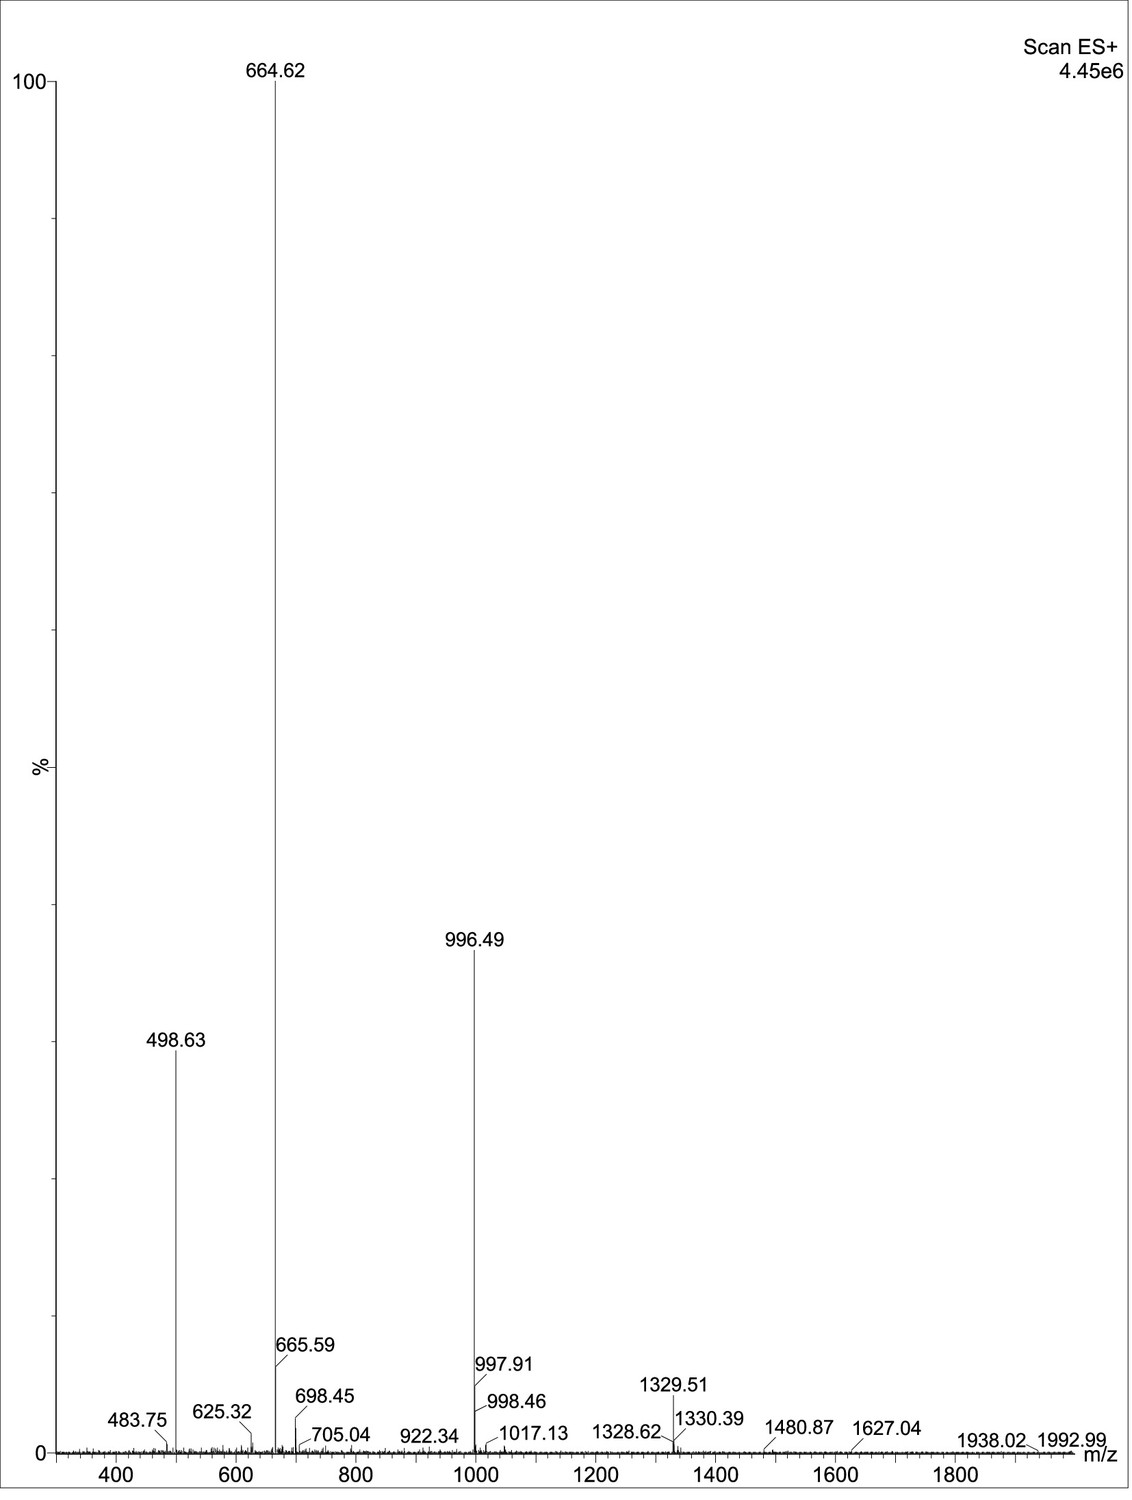
Mass spectrometry of P089.
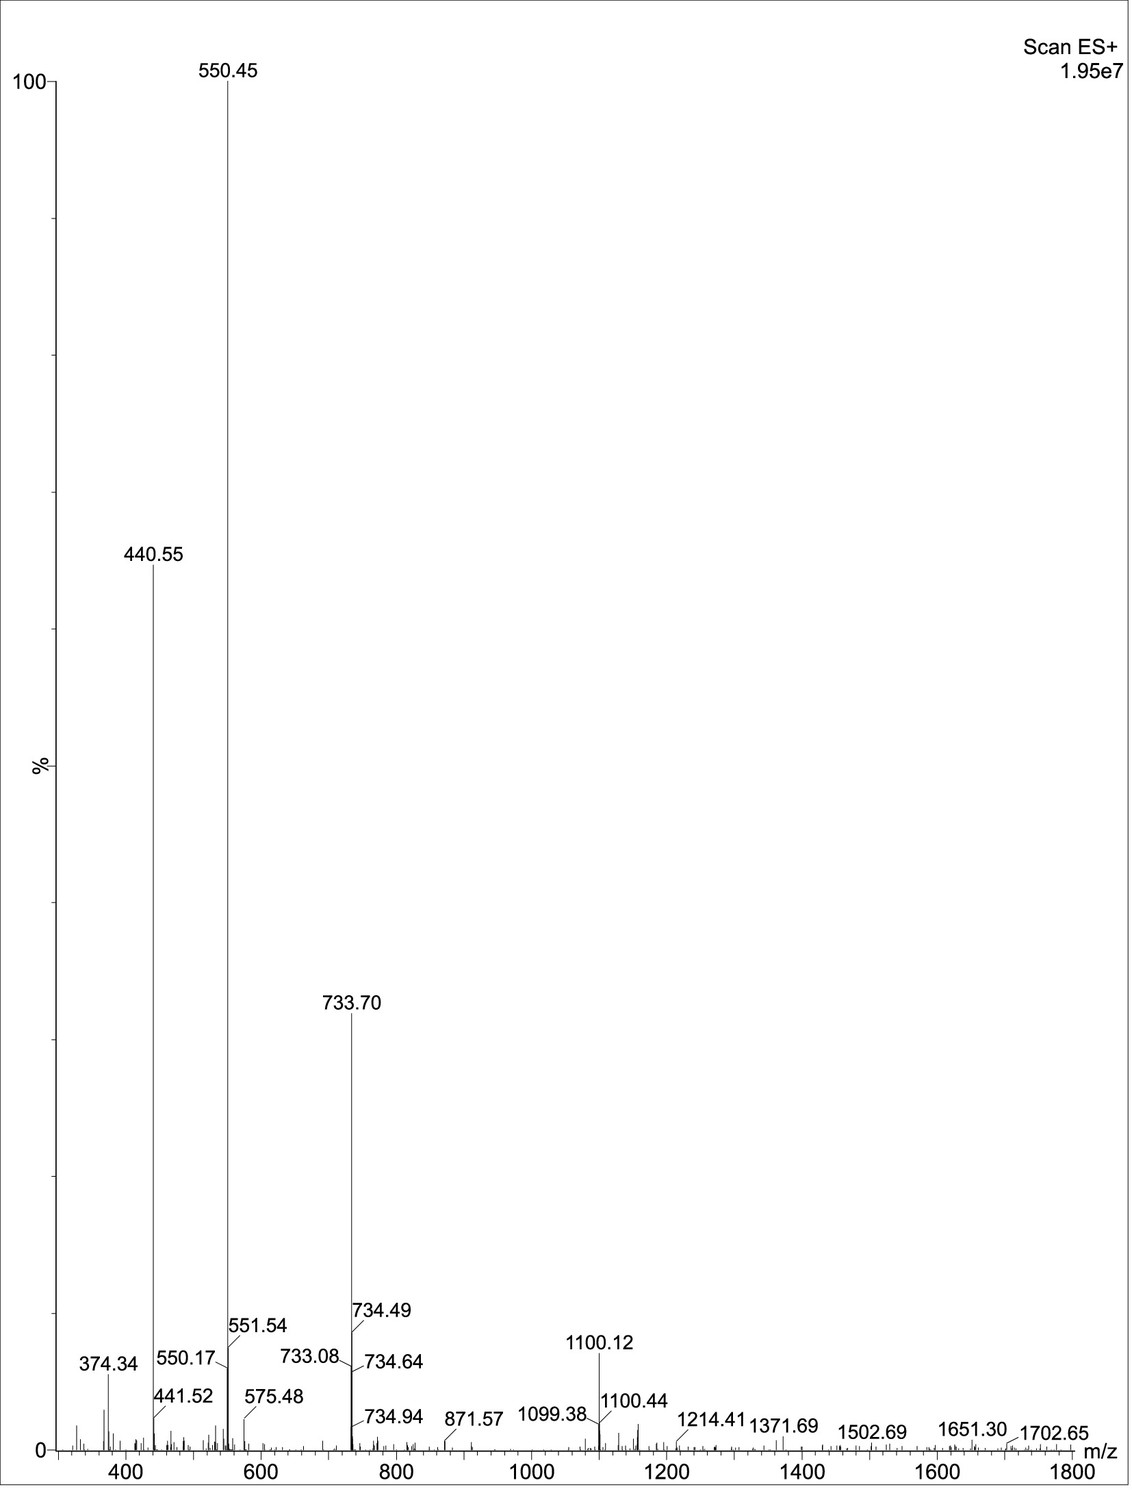
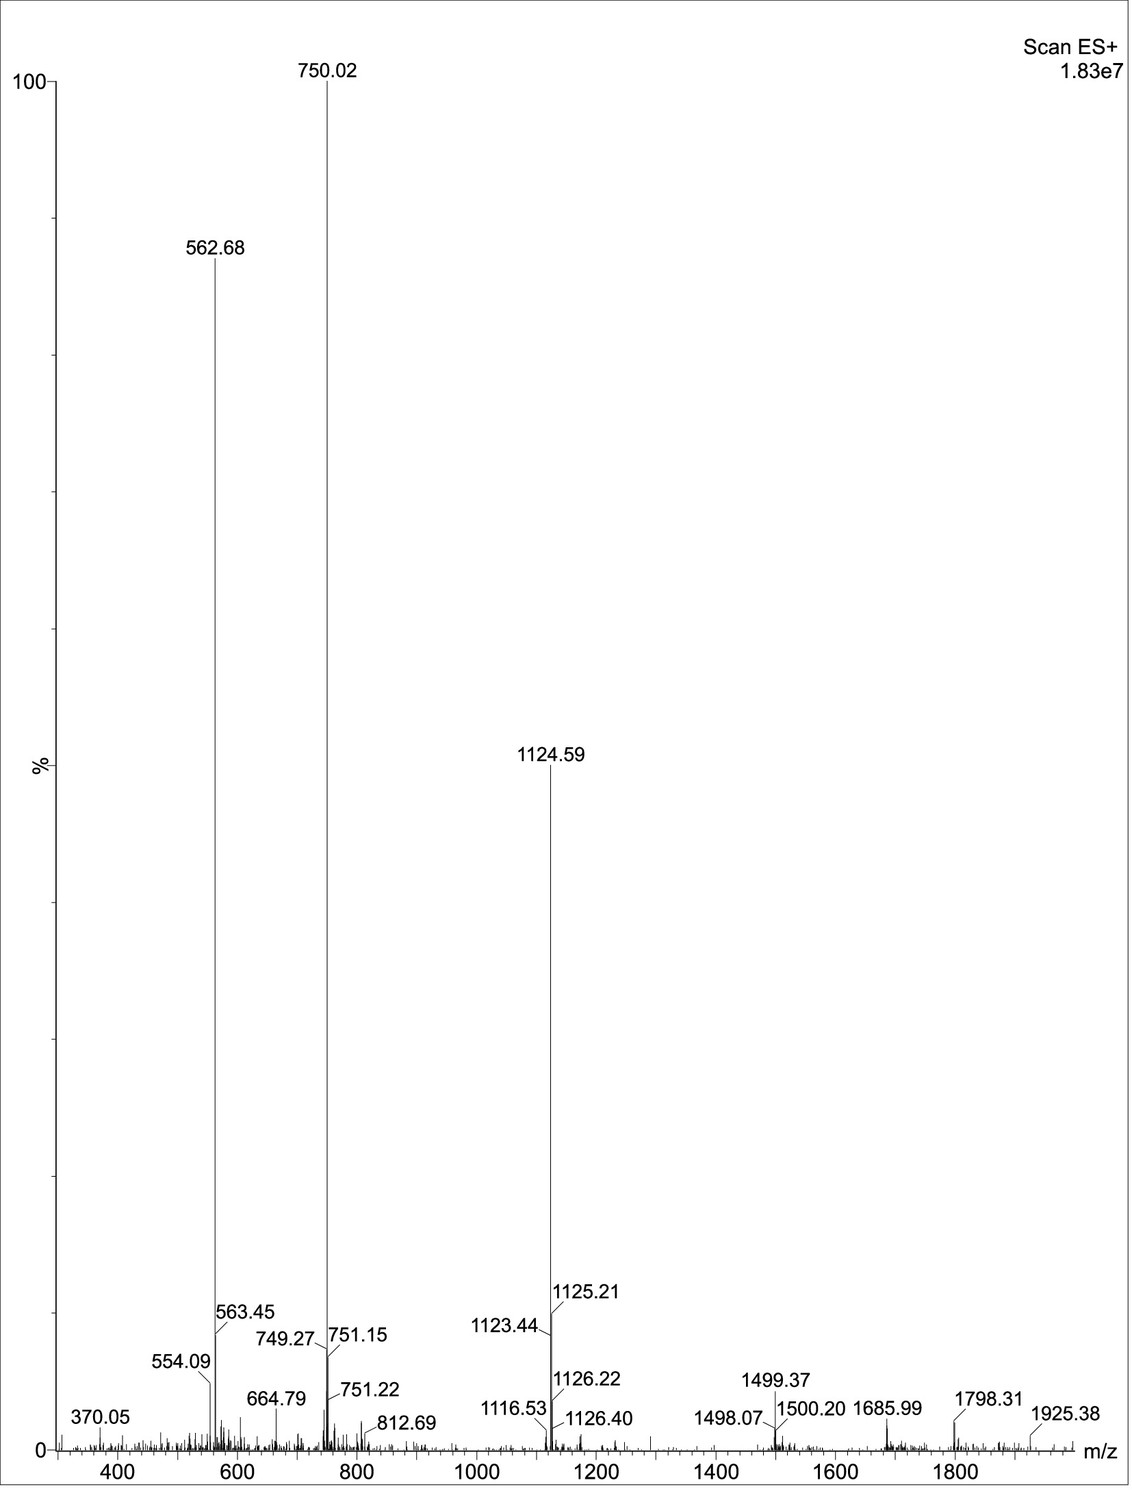
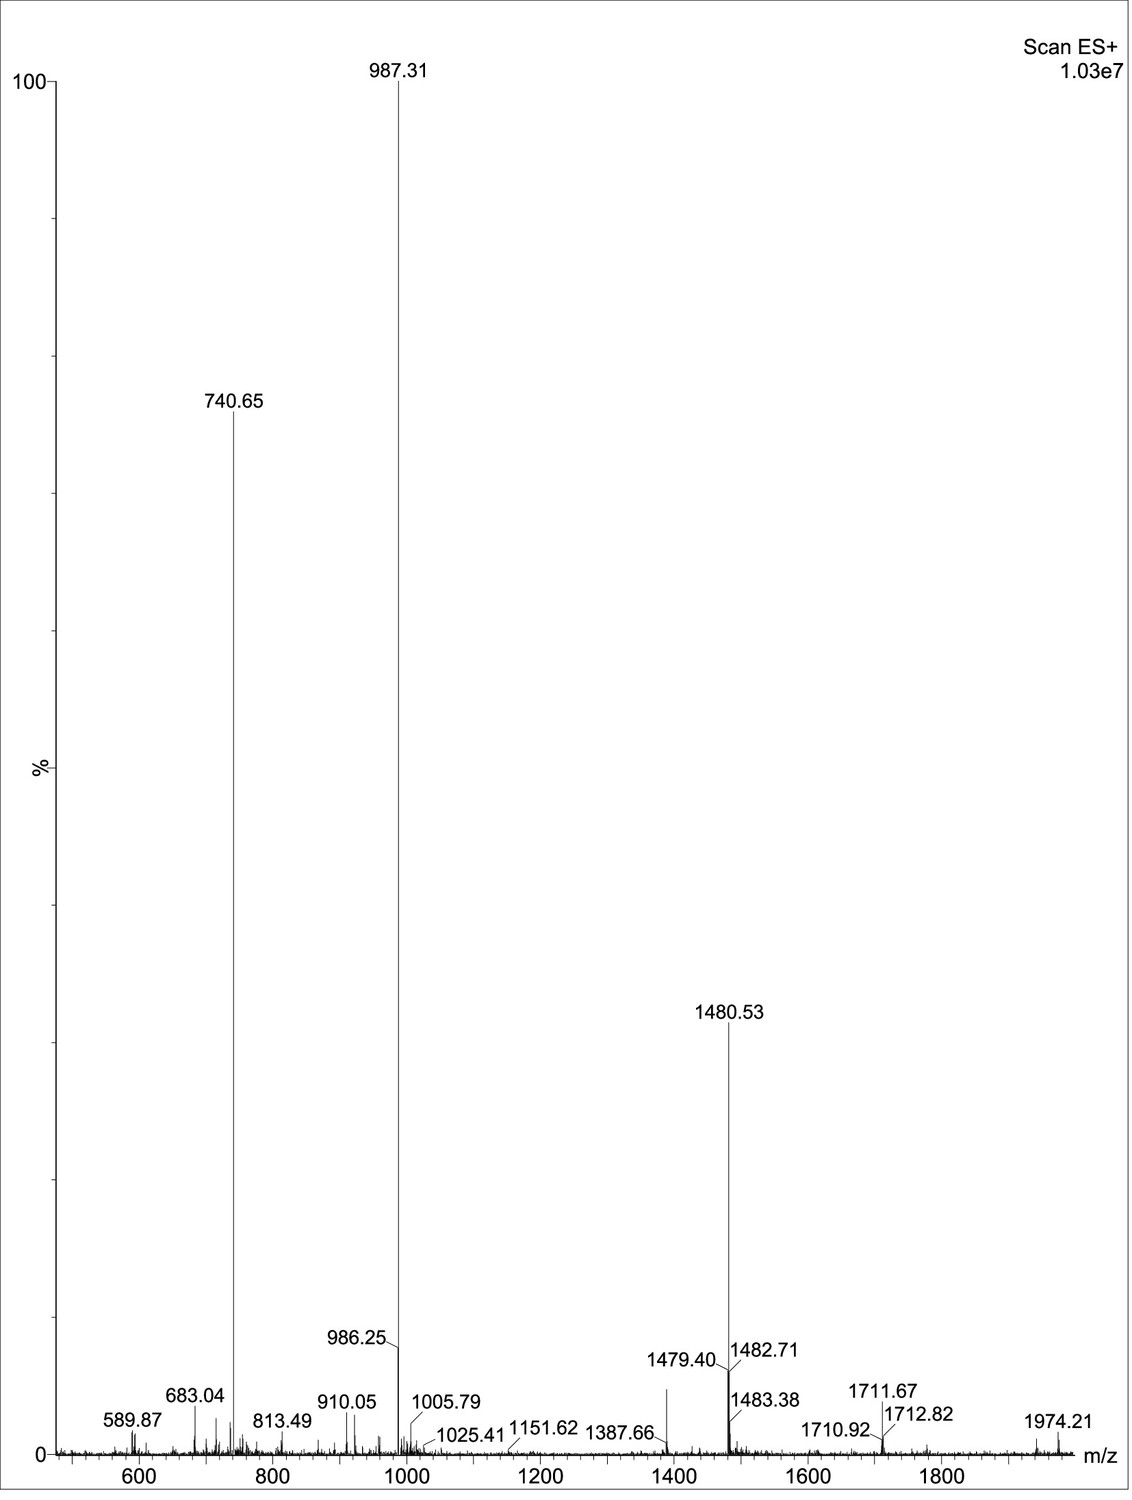
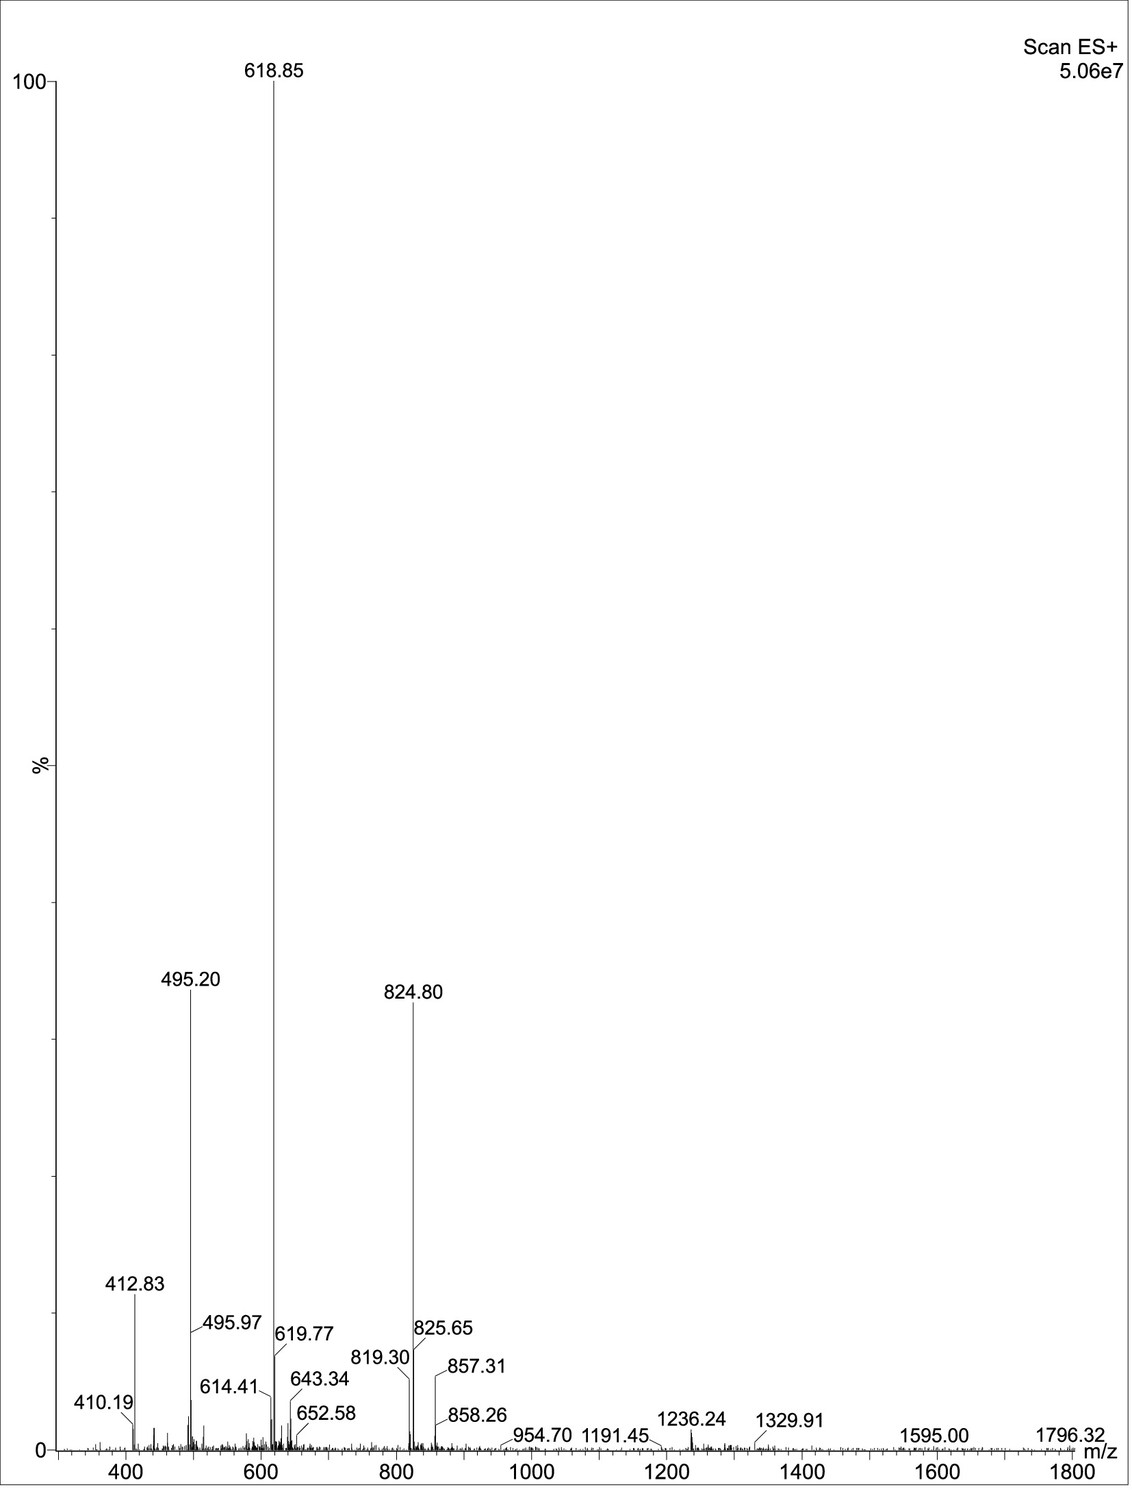
Figure 2—figure supplement 3
Mass spectrometry of P386.
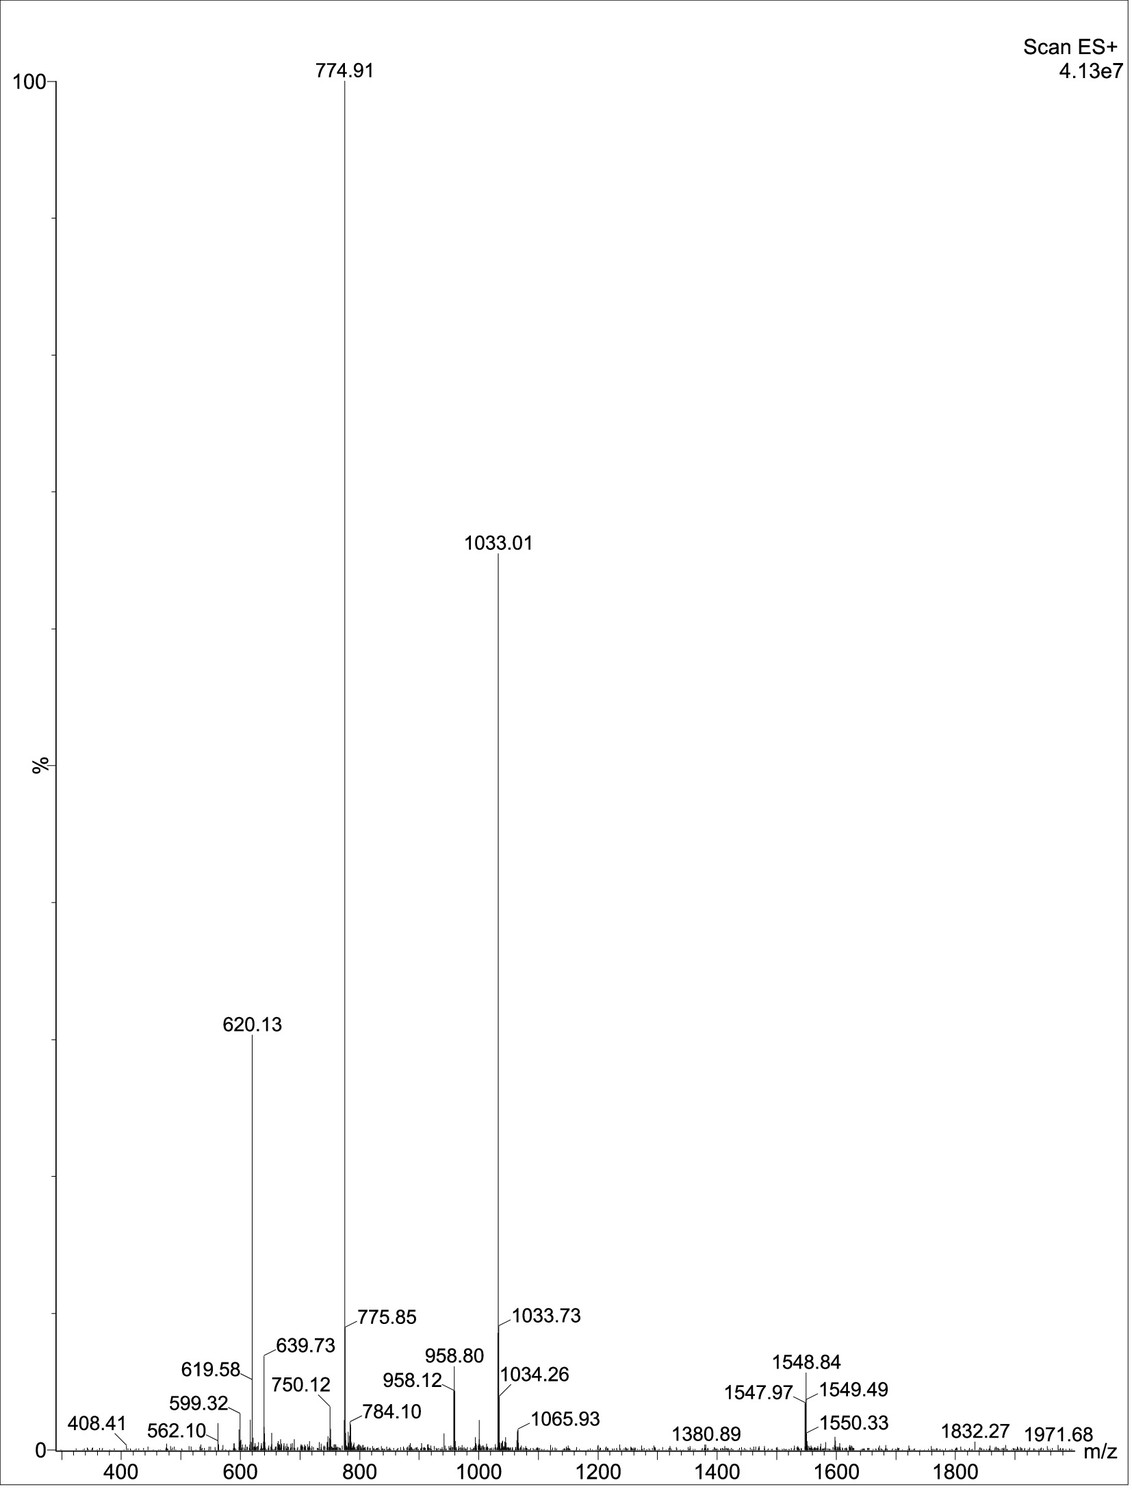
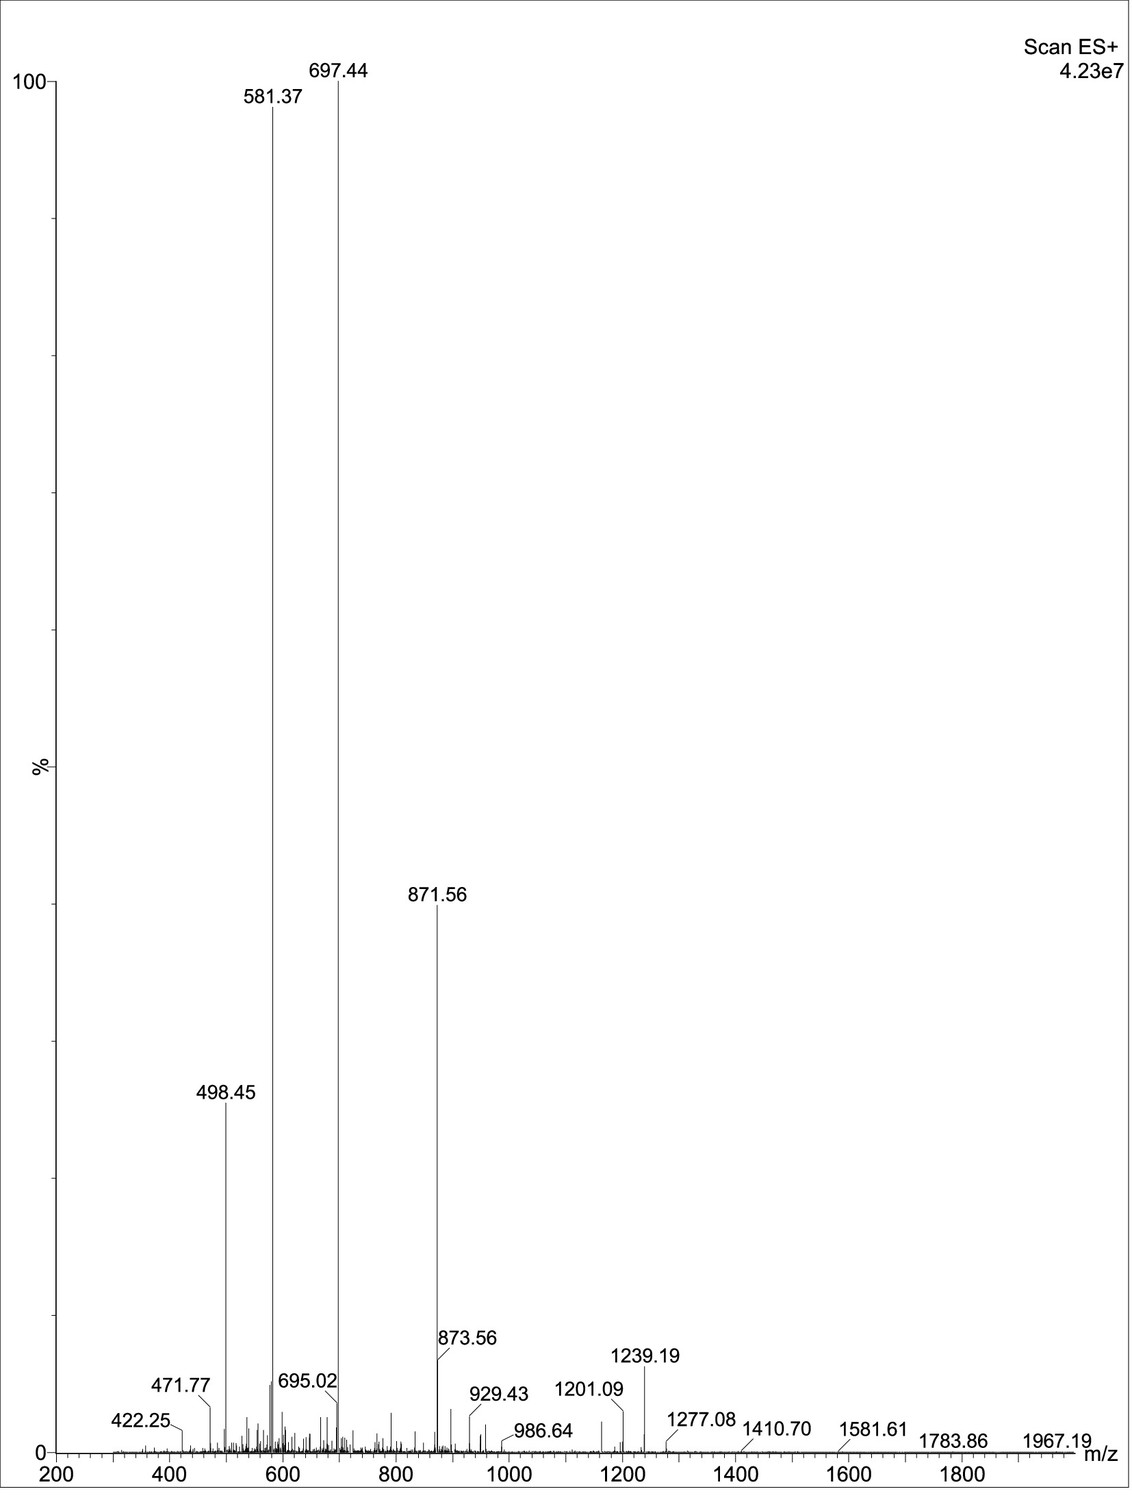
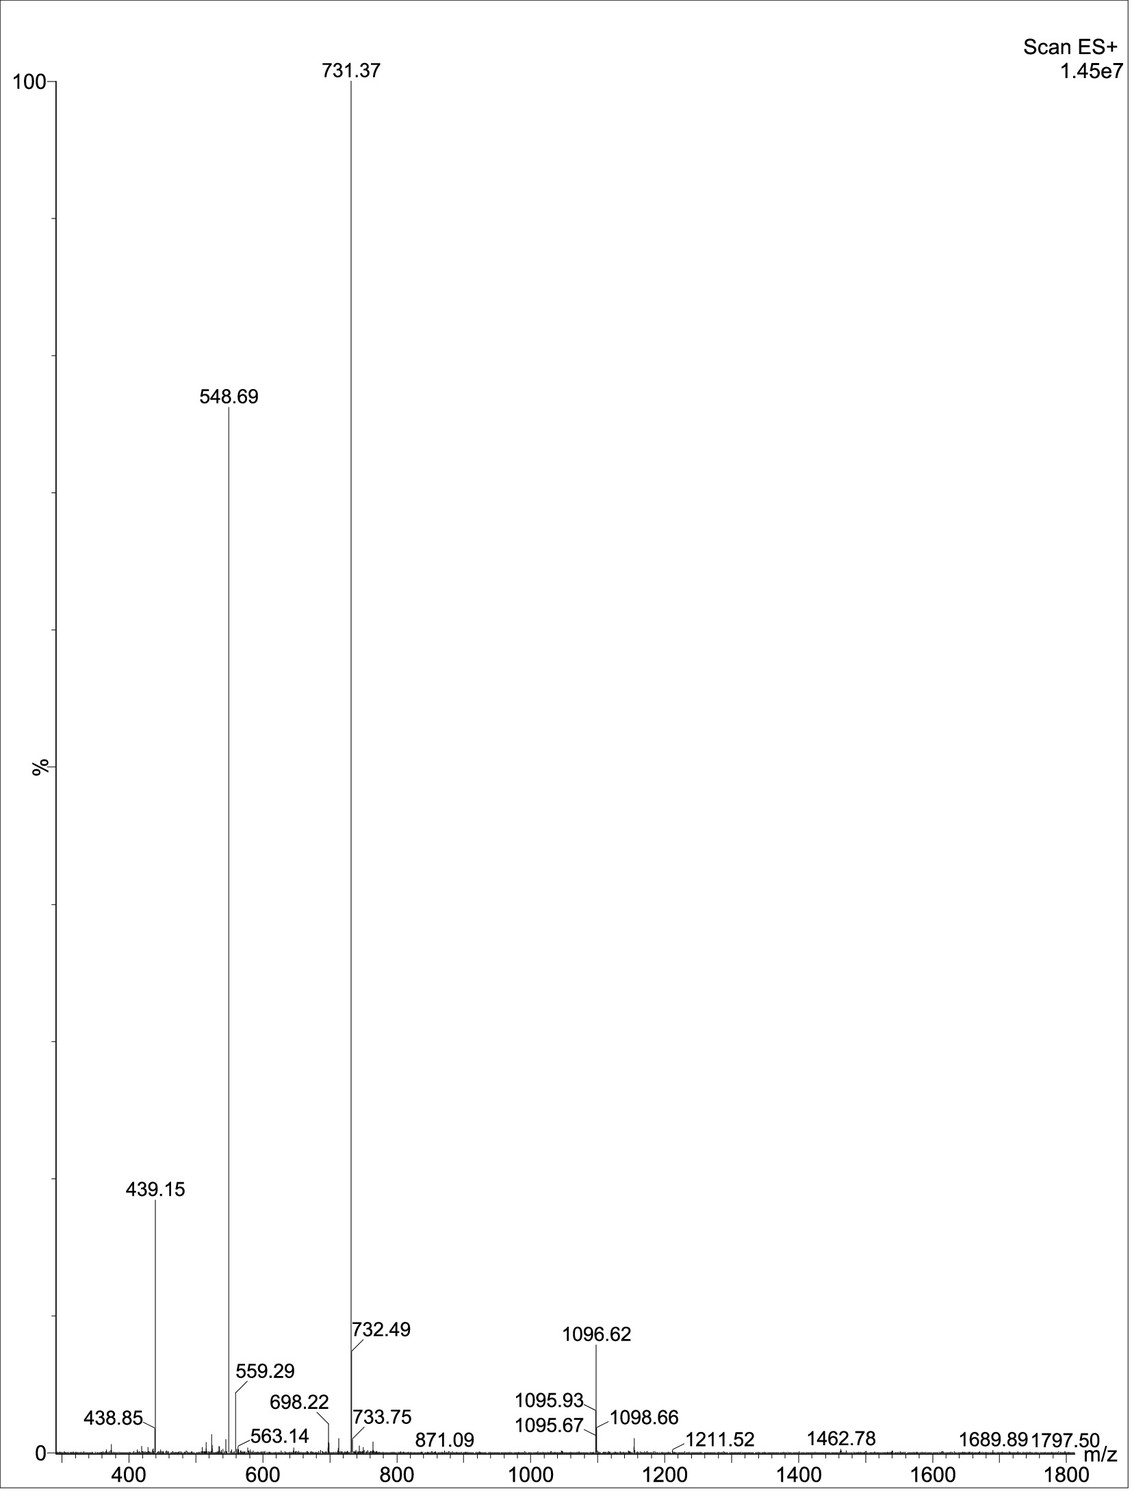
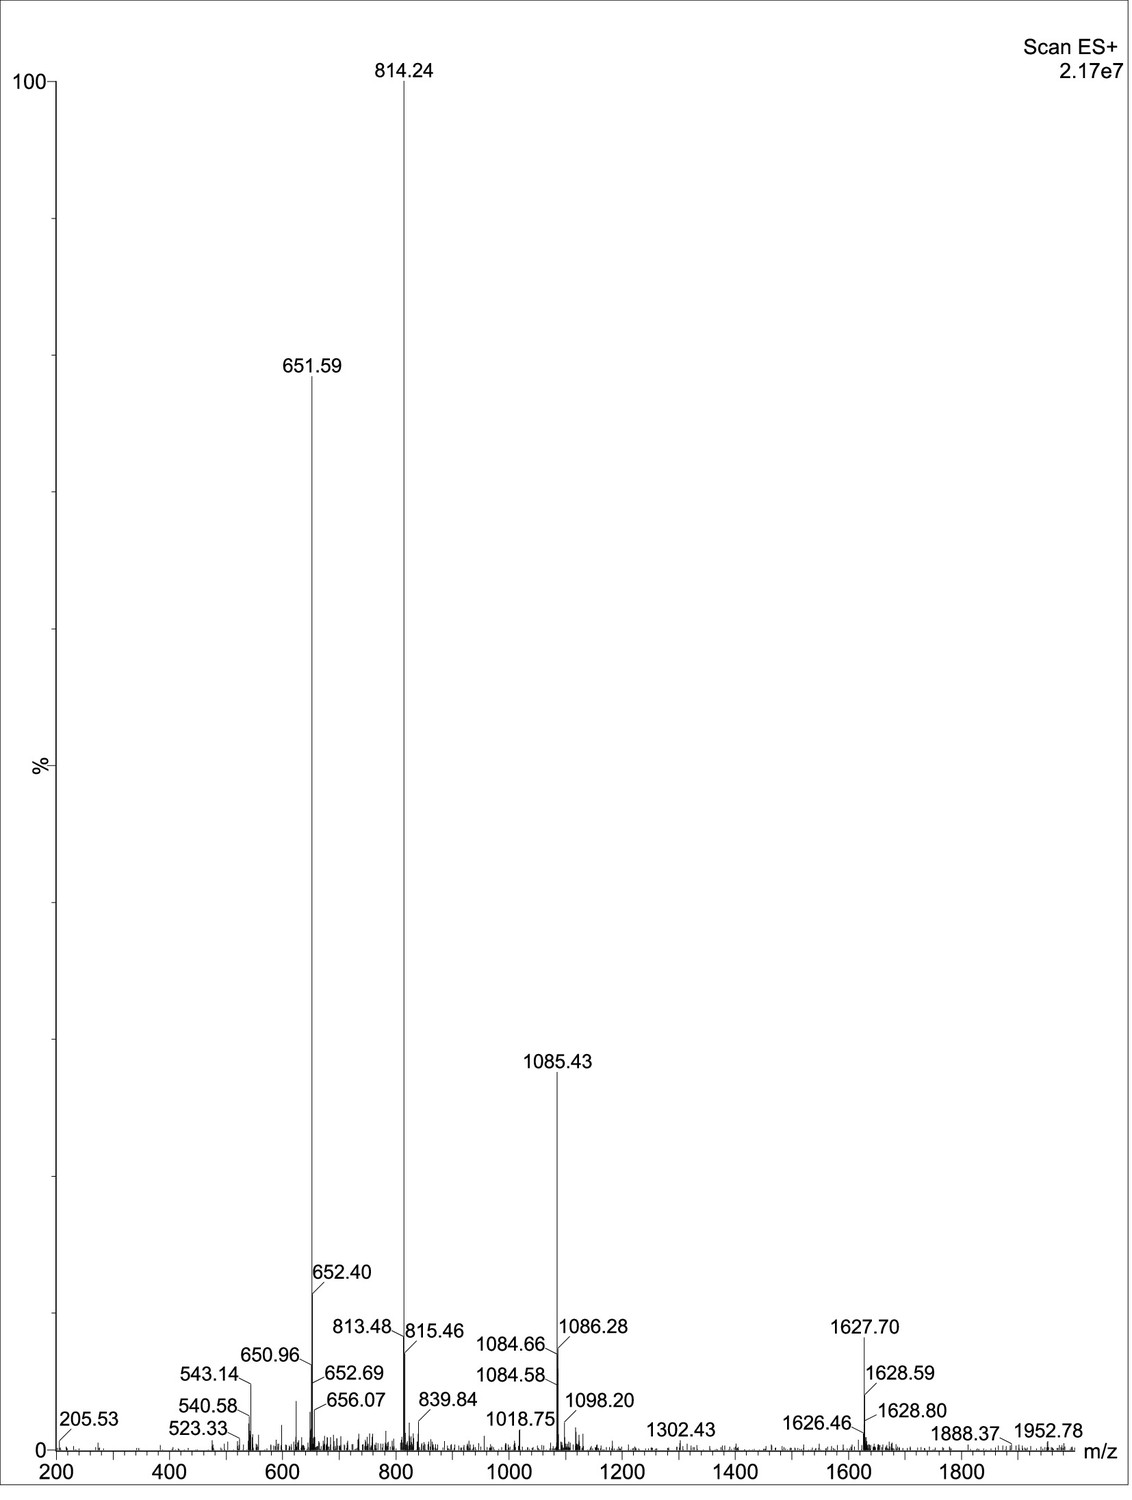
Figure 2—figure supplement 4
Mass spectrometry of P120.
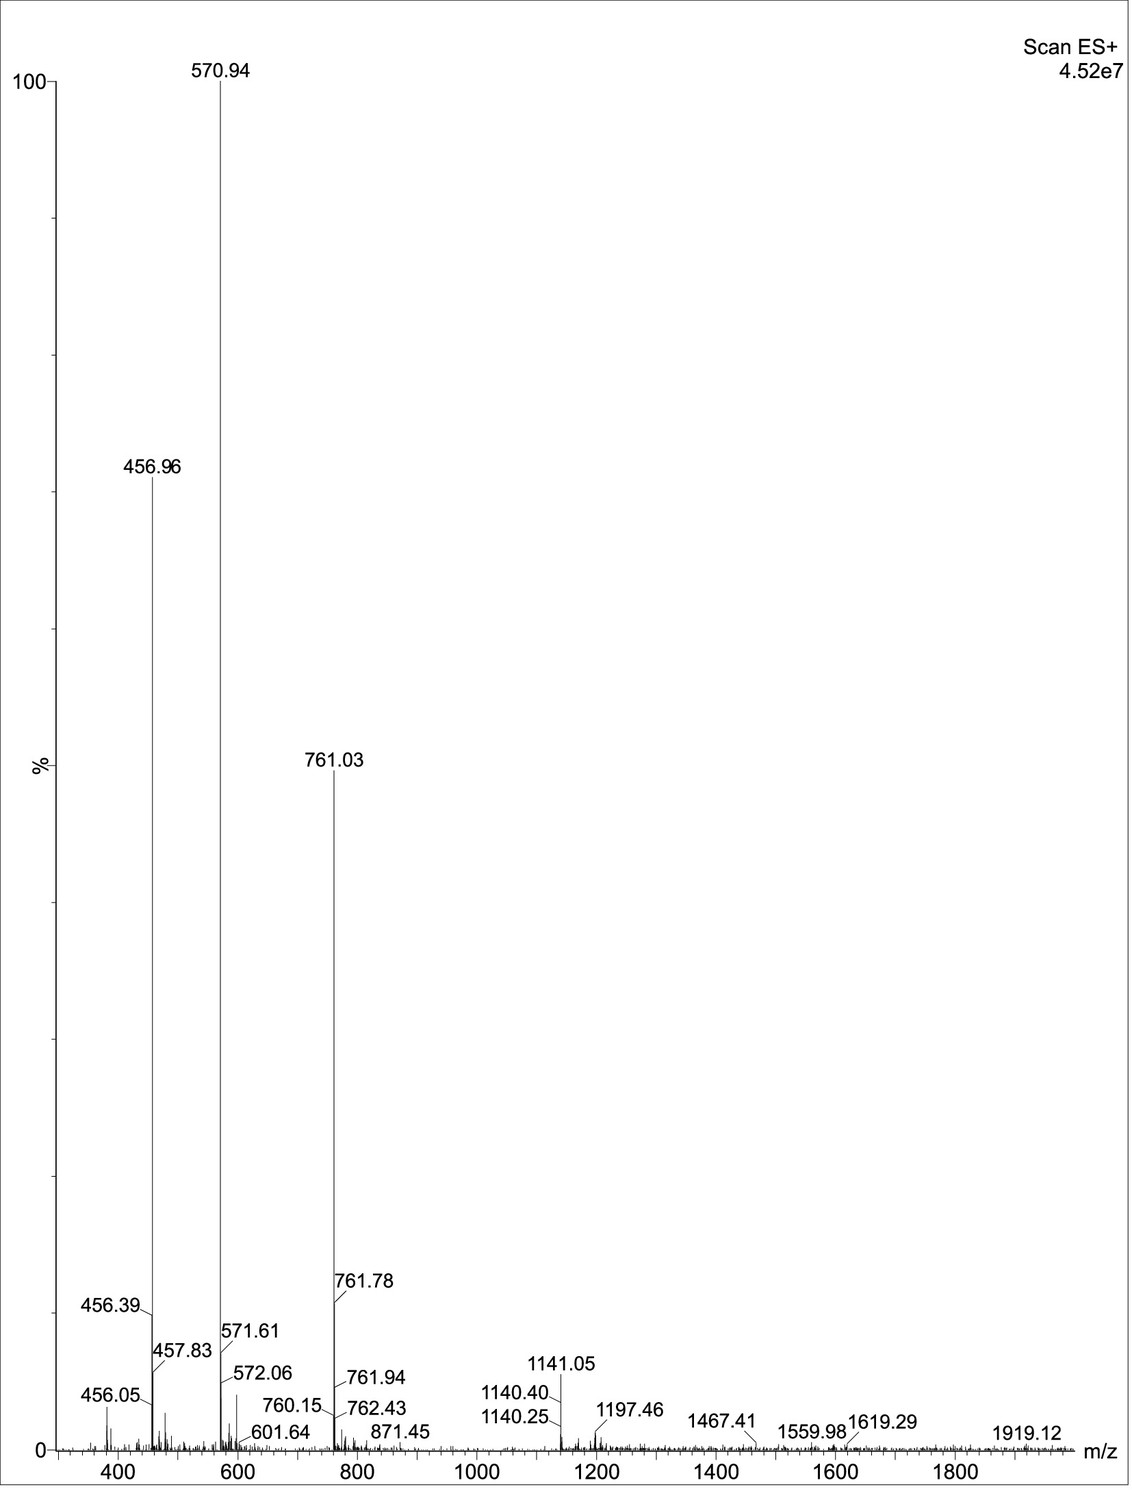
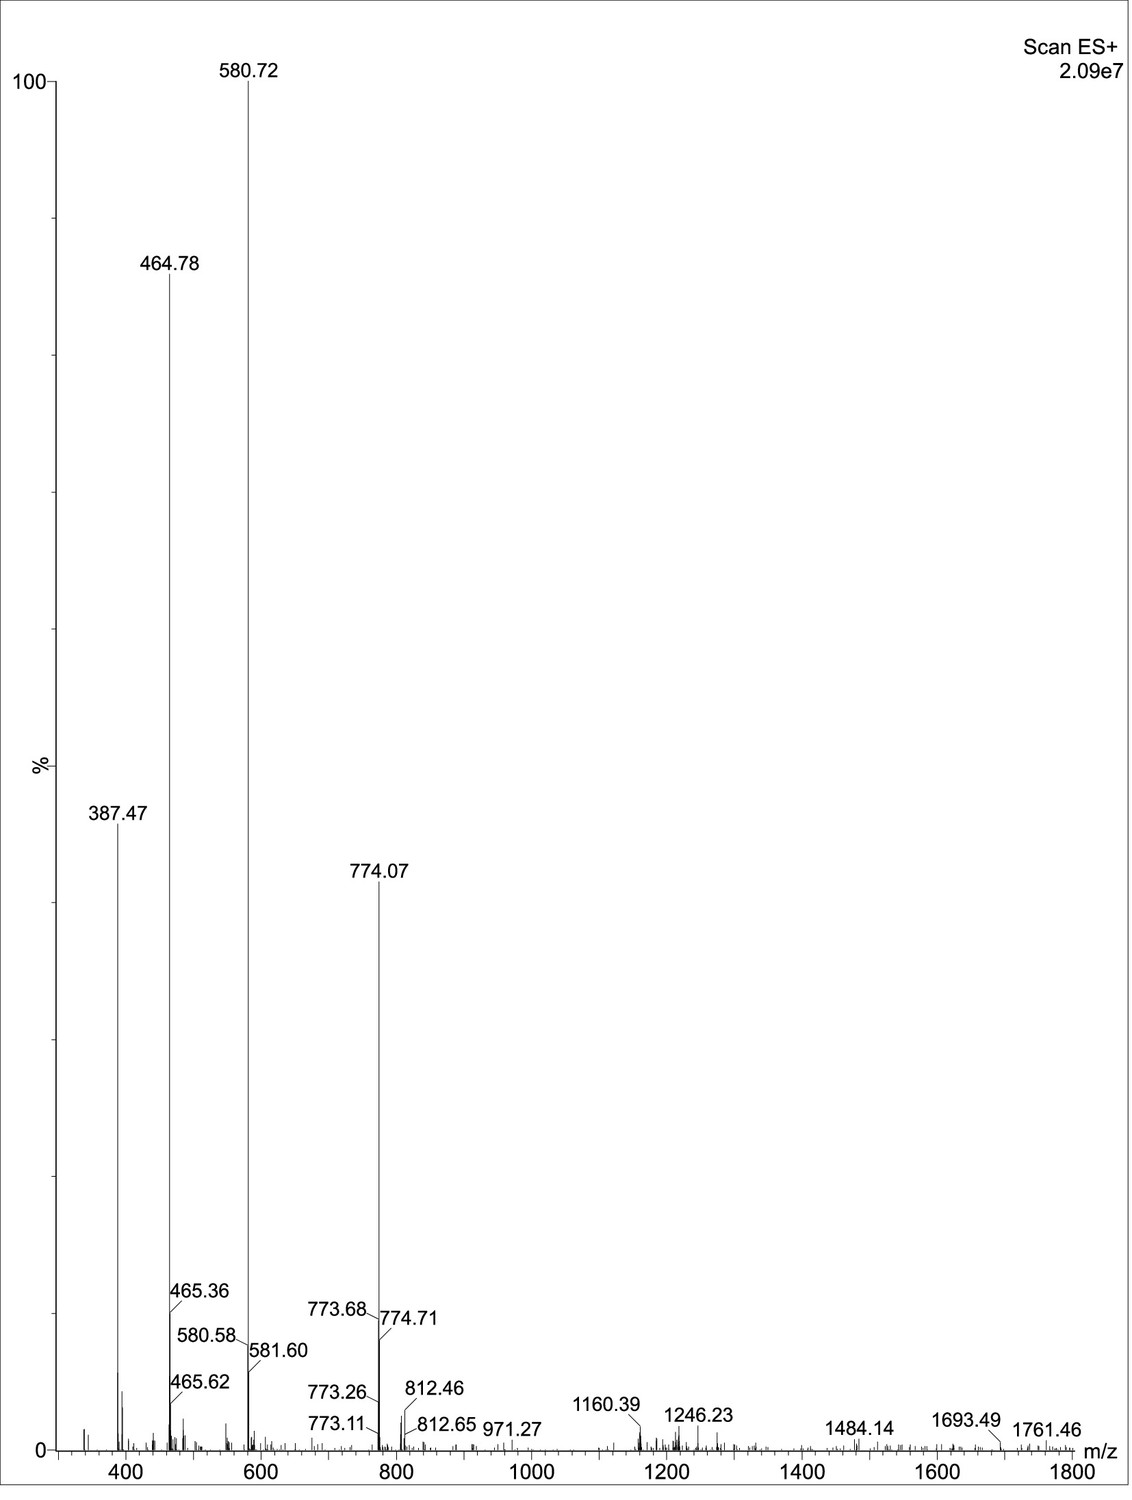
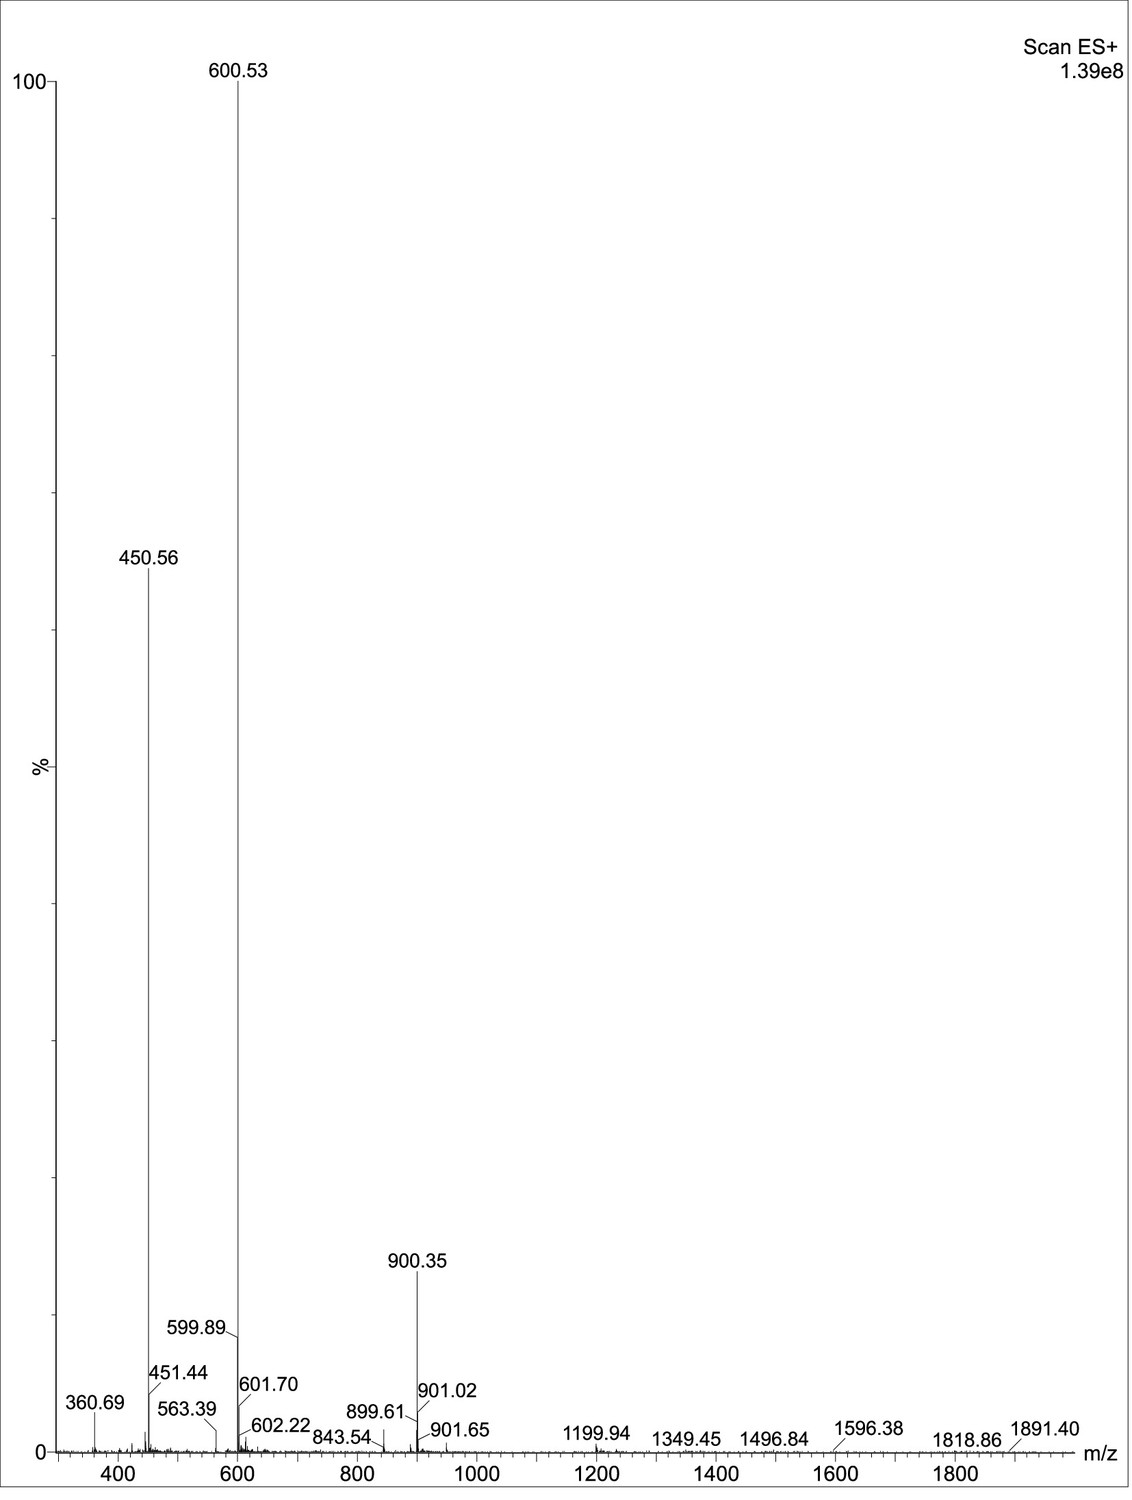
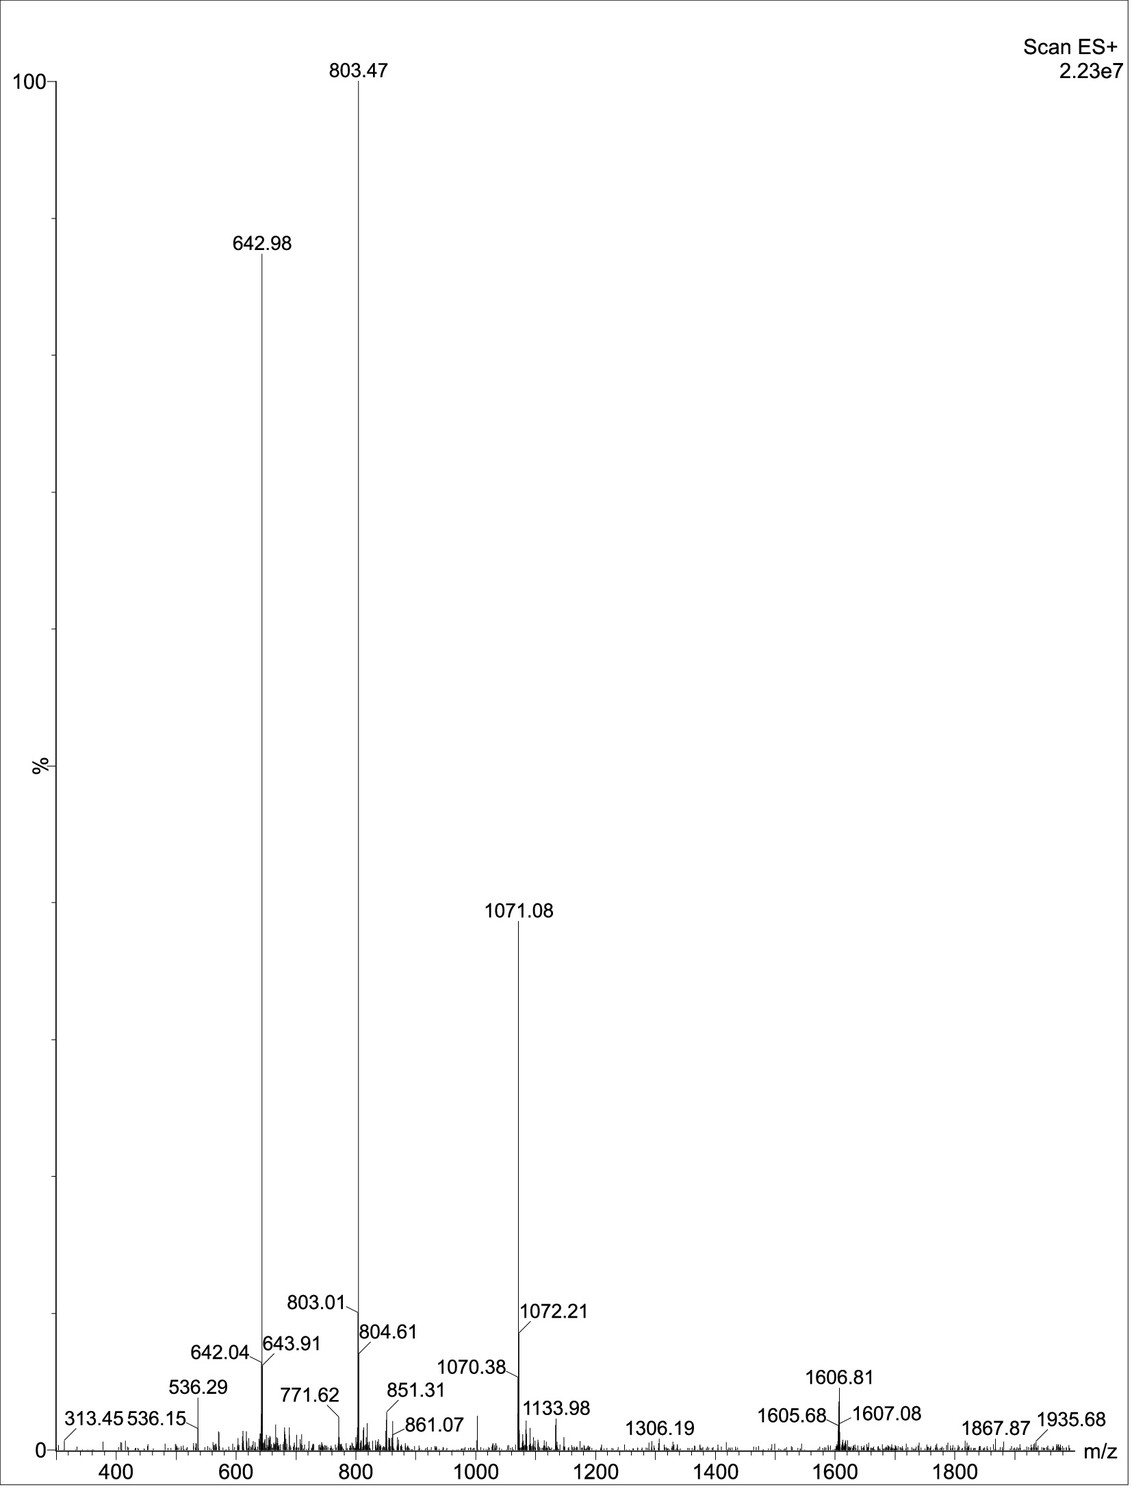
Figure 2—figure supplement 5
Mass spectrometry of P135.
Figure 2—figure supplement 6

Mass spectrometry of P247.
Figure 2—figure supplement 7
Mass spectrometry of P026.
Figure 2—figure supplement 8
Mass spectrometry of P039.
Figure 2—figure supplement 9
Mass spectrometry of P070.
Figure 2—figure supplement 10
Mass spectrometry of P091.
Figure 2—figure supplement 11
Mass spectrometry of P127.
Figure 2—figure supplement 12
Mass spectrometry of P122.
Figure 2—figure supplement 13
Mass spectrometry of P352.
Figure 2—figure supplement 14
Mass spectrometry of P105.
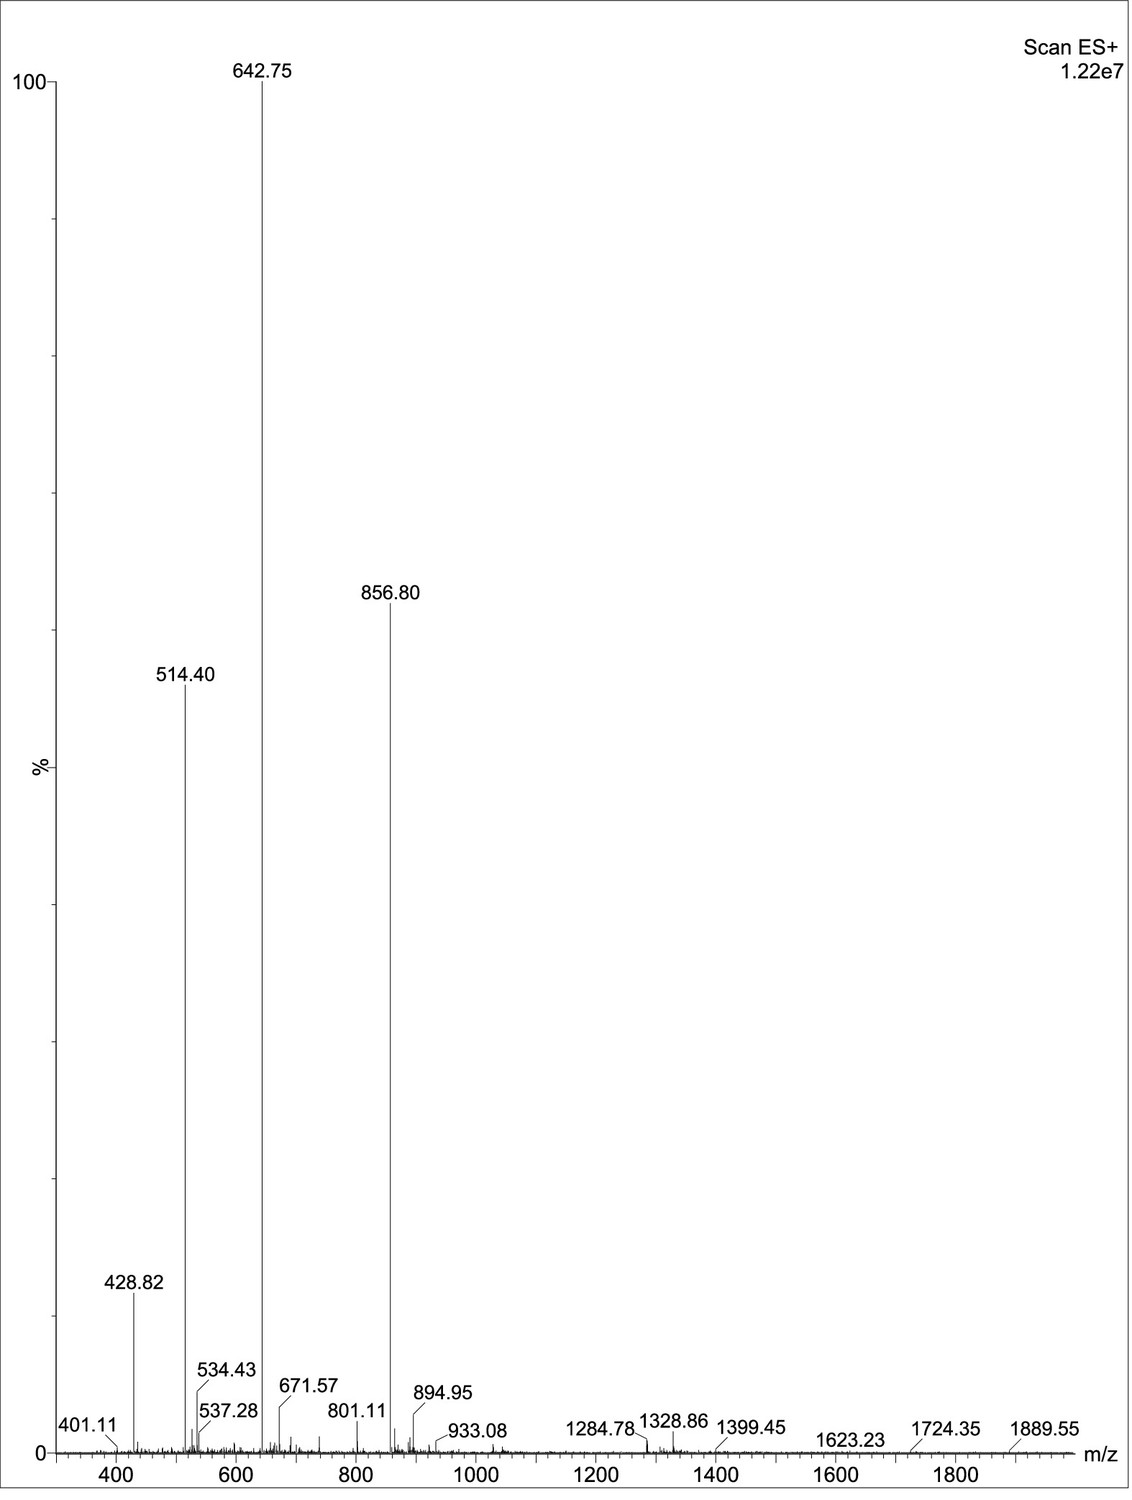
Figure 2—figure supplement 15
Mass spectrometry of P316.
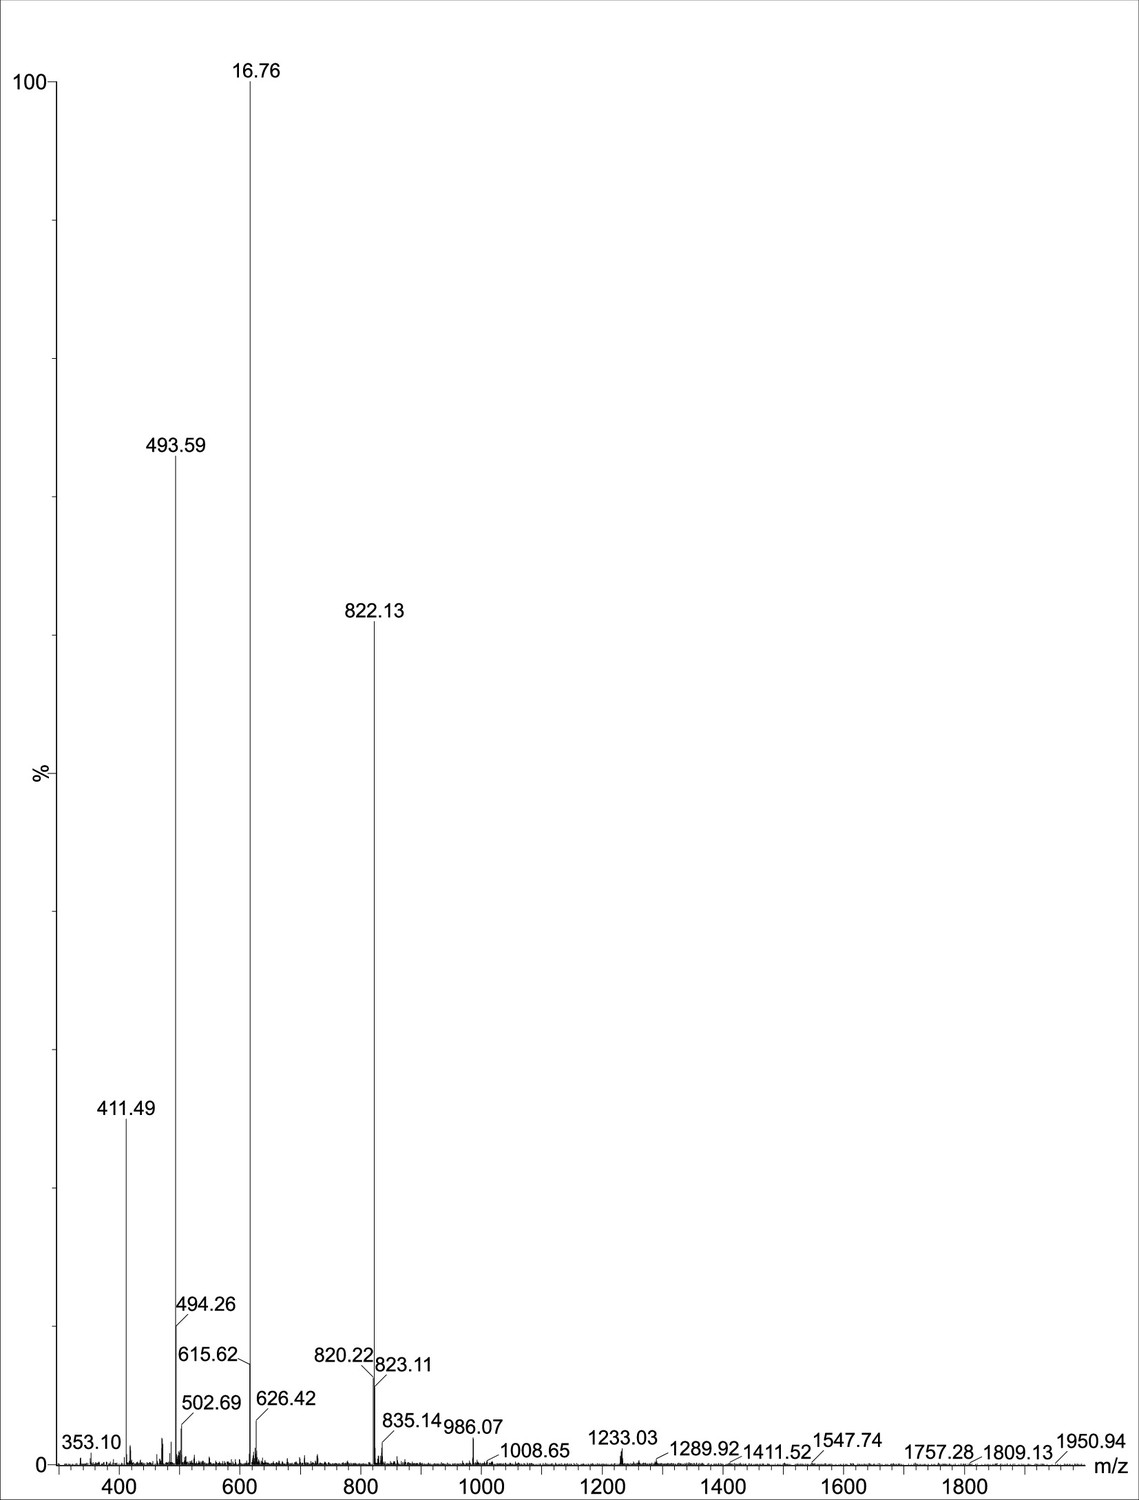
Figure 2—figure supplement 16
Mass spectrometry of P244.
Figure 2—figure supplement 17
Mass spectrometry of P302.
Figure 2—figure supplement 18
Mass spectrometry of P185.
Figure 2—figure supplement 19
Mass spectrometry of P019.
Figure 2—figure supplement 20
Mass spectrometry of P252.
Figure 2—figure supplement 21
Mass spectrometry of P213.
Figure 2—figure supplement 22
Mass spectrometry of P036.
Figure 2—figure supplement 23
Mass spectrometry of P018.
Figure 2—figure supplement 24
Mass spectrometry of P168.
Figure 2—figure supplement 25
Mass spectrometry of P214.
Figure 3 with 1 supplement
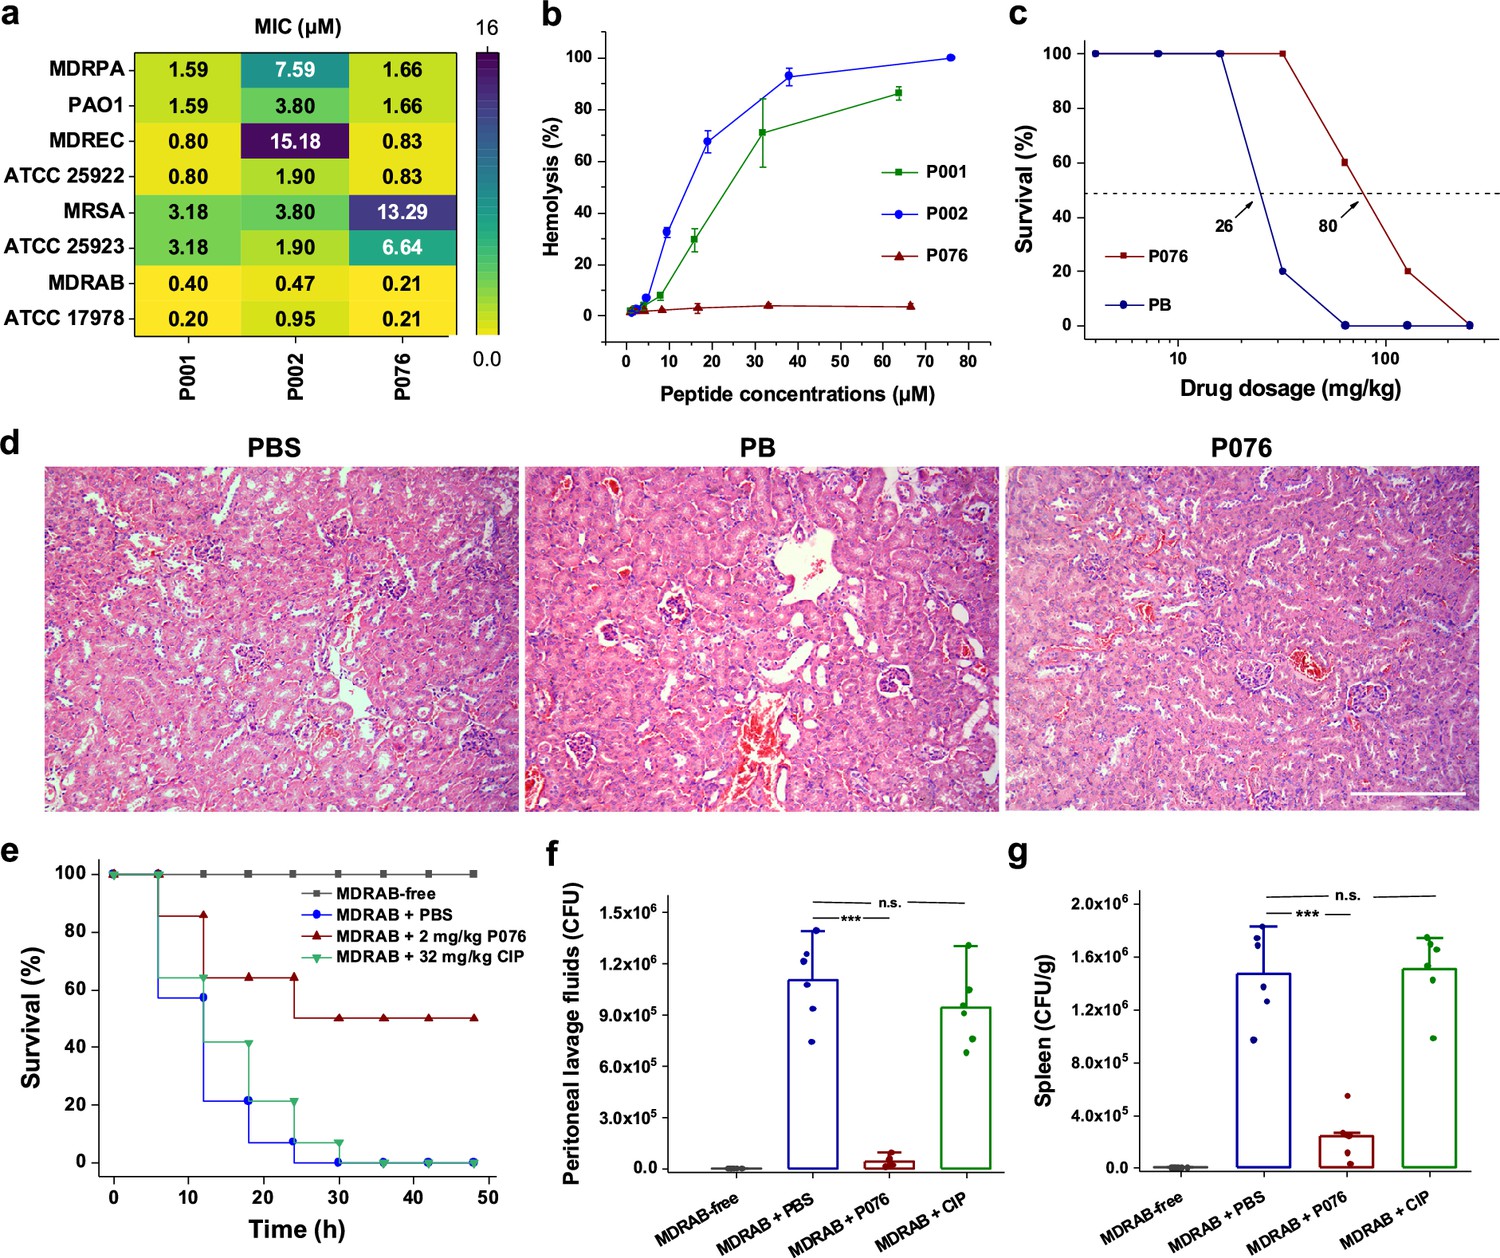
Antibacterial and toxicological evaluations of P076 peptide.
(a) In vitro antibacterial assessment of peptides by determination of minimal inhibitory concentrations (MICs). (b) Hemolysis of increasing concentrations of peptides. Results are shown as the means ± SDs. (c) Survival curves of mice given P076 and polymyxin B (PB). Arrows indicate the drug concentration inducing a 50% death. (d) H&E staining of mouse kidneys. The scale bar indicates 200 μm. (e) Survival of infected mice treated with P076 and ciprofloxacin (CIP). (f, g) Bacterial colonization of multidrug-resistant A. baumannii (MDRAB) in mouse peritoneal lavage fluid and spleen. Results are shown as the means ± SDs. ***p<0.001. n.s., no significance.
Figure 3—figure supplement 1
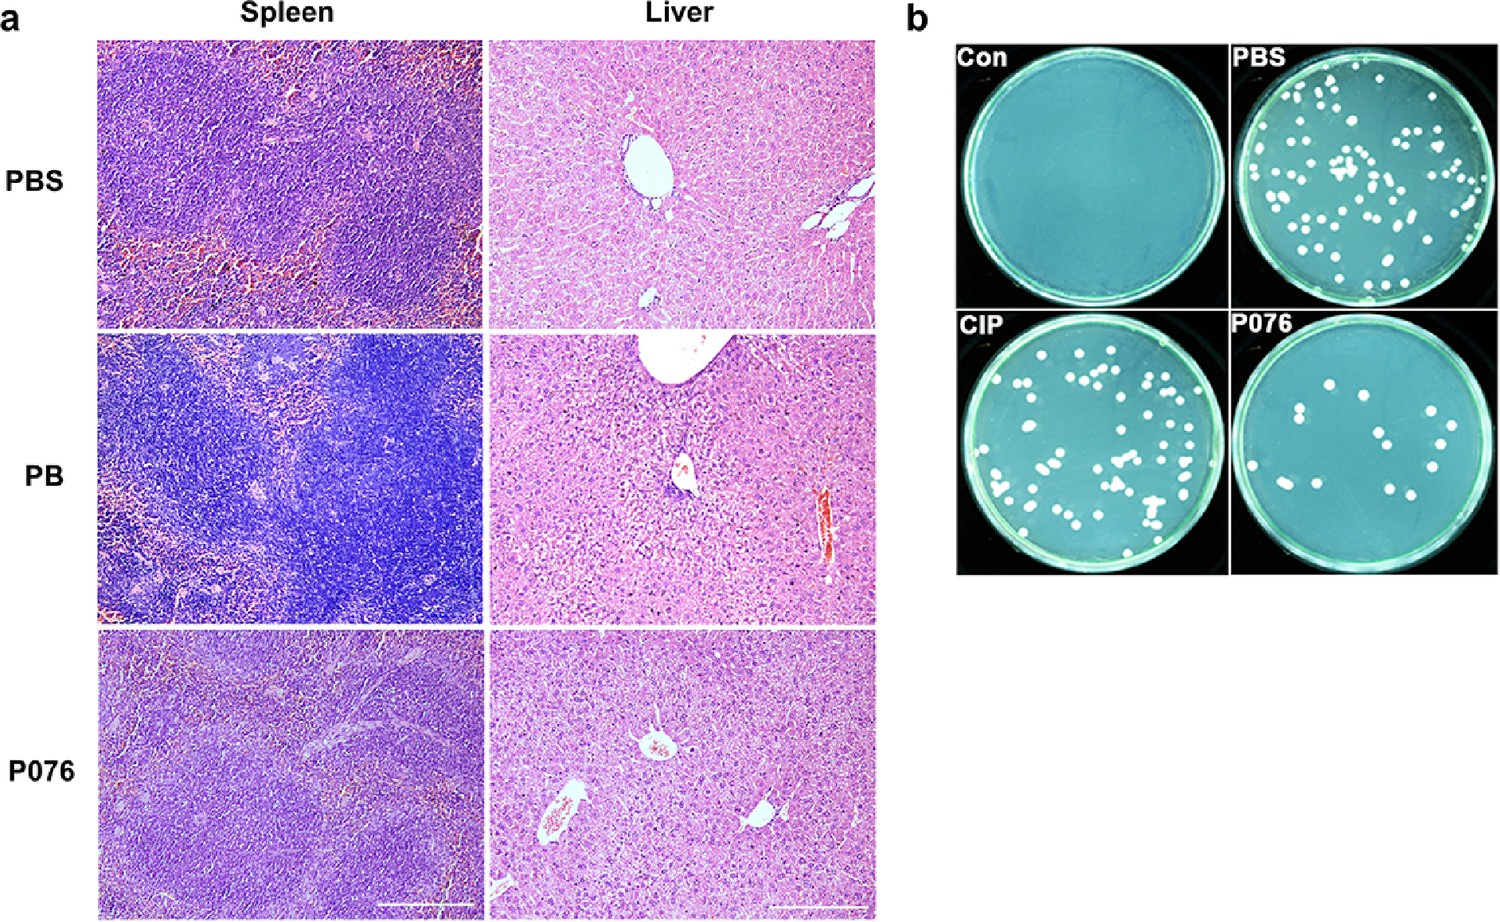
Additional results for in vivo antibacterial evaluations of P076.
(a) H&E staining of mouse spleens and livers. The scale bar is 200 μm. (b) The bacterial colony on Meller–Hinton broth (MHB) plates with mouse spleen suspension.
Figure 4 with 5 supplements
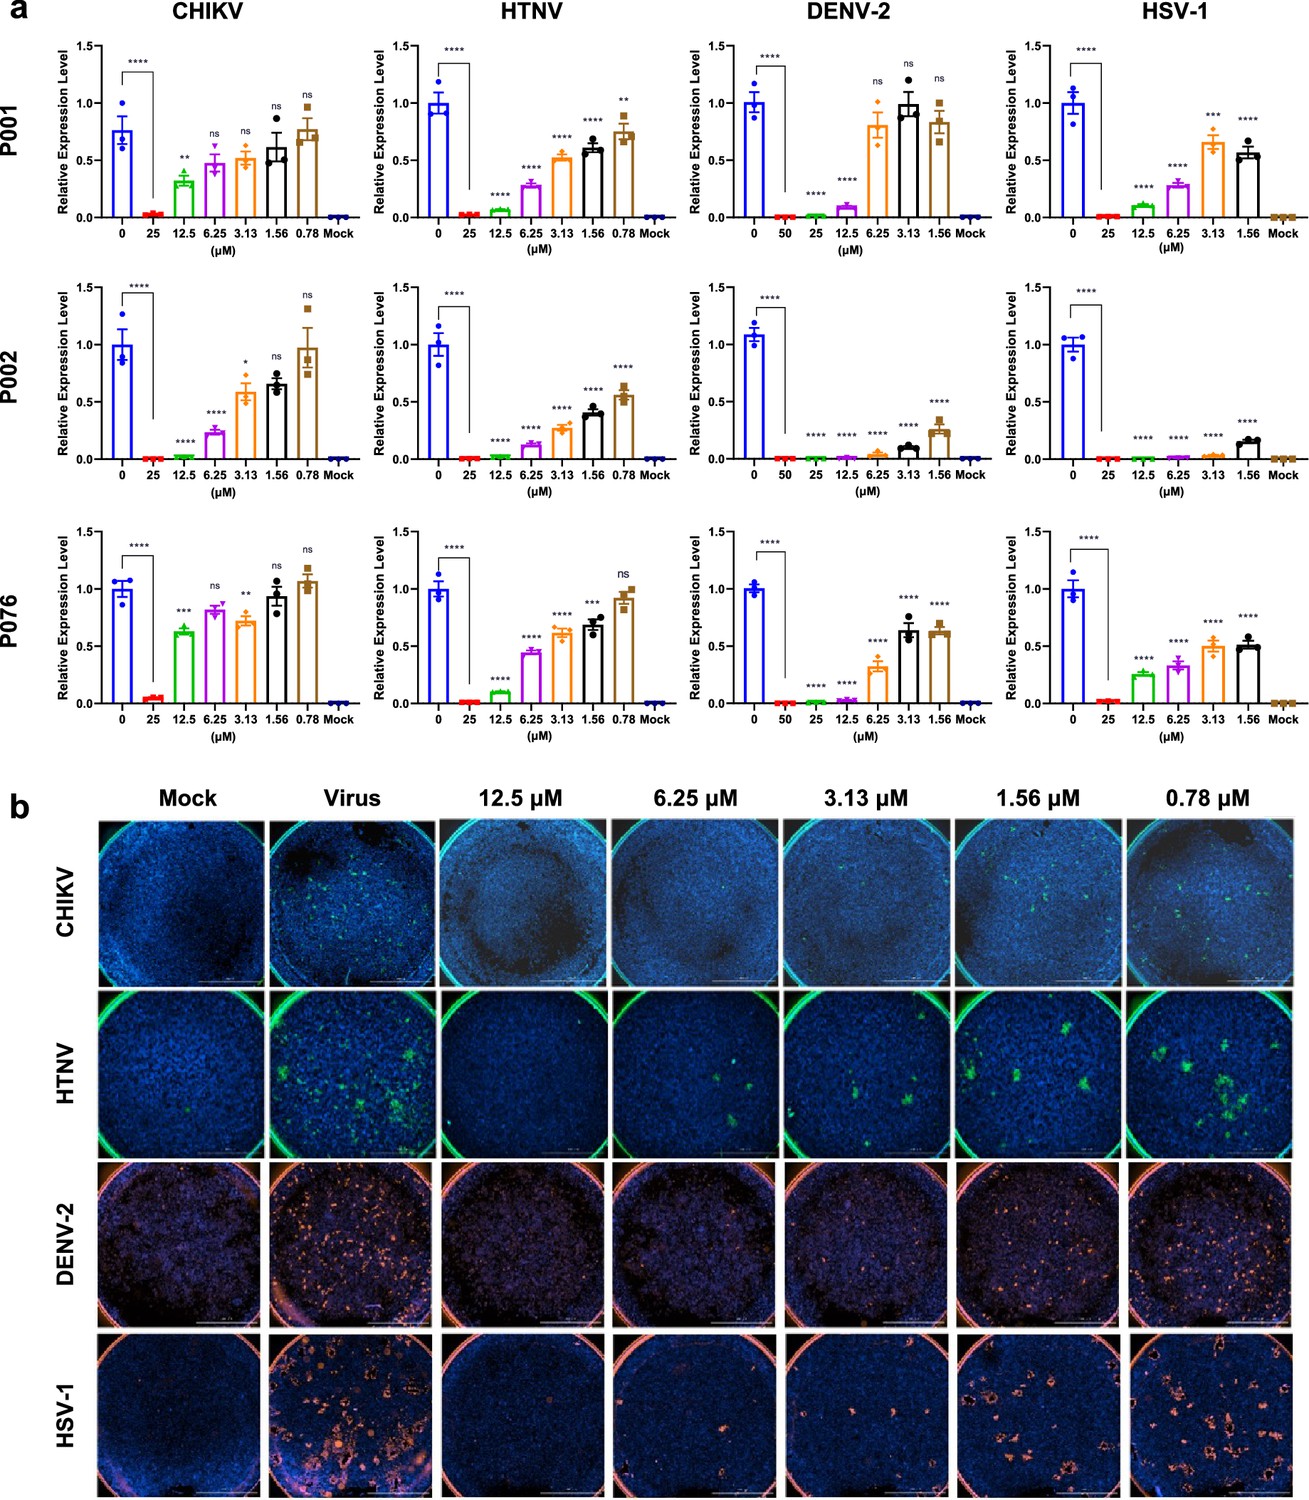
Antiviral assays of antimicrobial peptides (AMPs) against Chikungunya virus (CHIKV), Hantaan virus (HTNV), Dengue virus 2 (DENV-2), and Herpes simplex virus 1 (HSV-1).
(a) Quantitative real-time PCR of virus RNA with gradient concentrations of P001, P002, and P076. (b) Immunofluorescence results of four viruses with gradient concentrations of P002. Scale bar = 2000 μm. All experiments are performed in triplicates. Column bars are means ± SEMs. *p<0.05, **p<0.01, ***p<0.001, ****p<0.0001. ns, no significance.
Figure 4—figure supplement 1
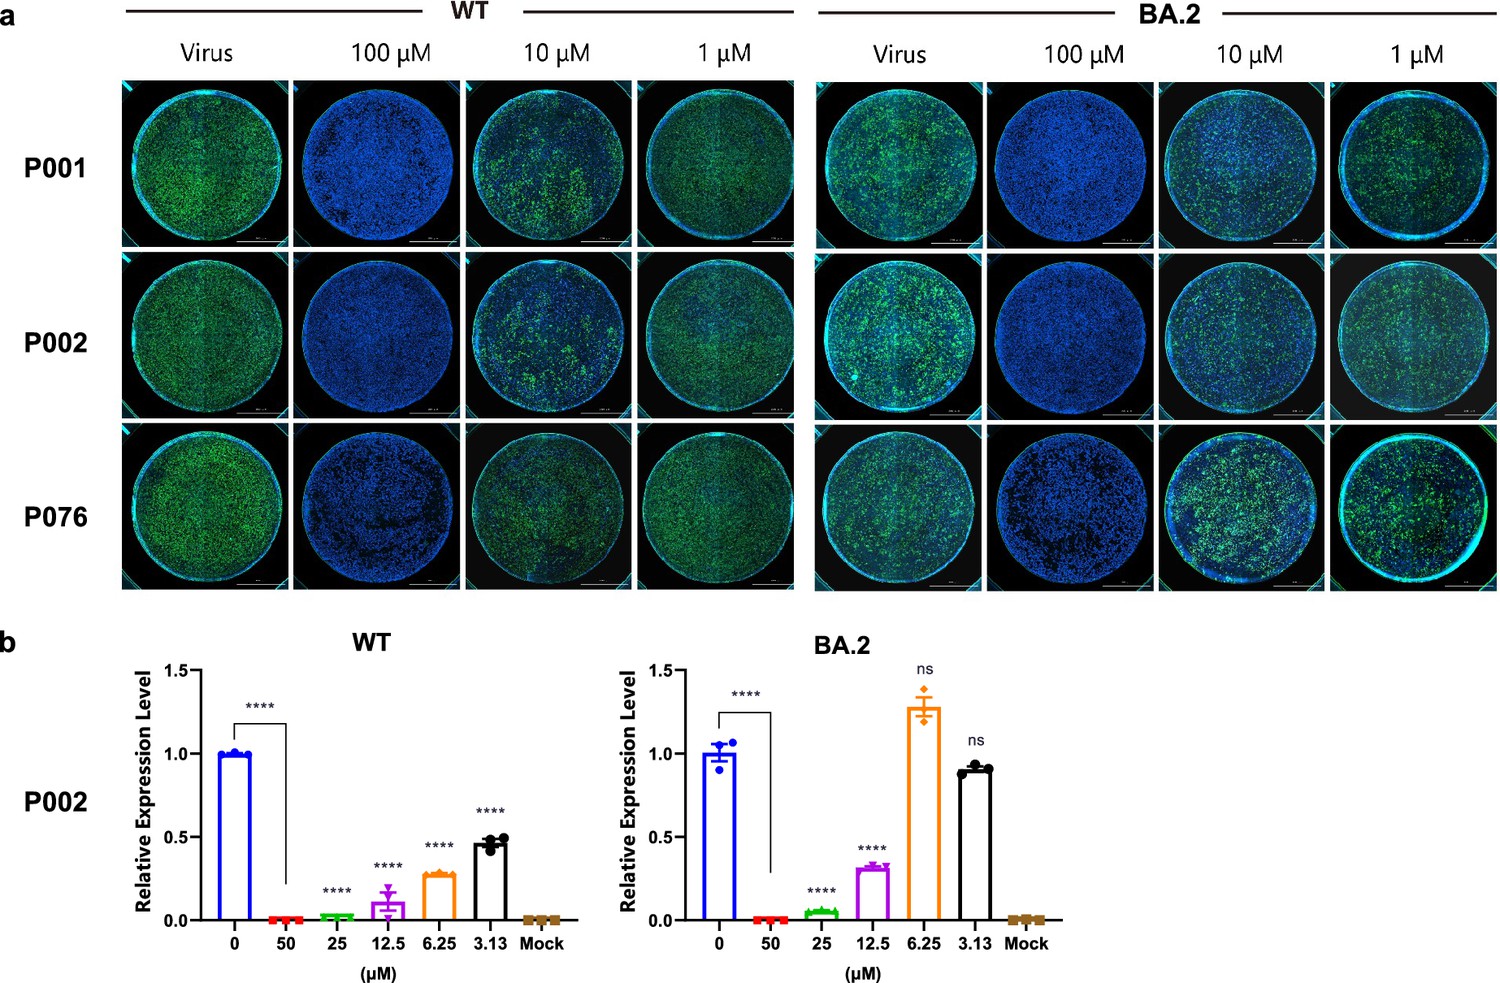
Antiviral assays of peptides against SARS-CoV-2 wild-type and BA.2 strains.
(a) Immunofluorescence assays of P001, P002, and P076. Scale bar = 2000 μm. (b) qRT-PCR of P002. All experiments are performed in triplicates. Column bars are means ± SEMs. ****p<0.0001. ns, no significance.
Figure 4—figure supplement 2
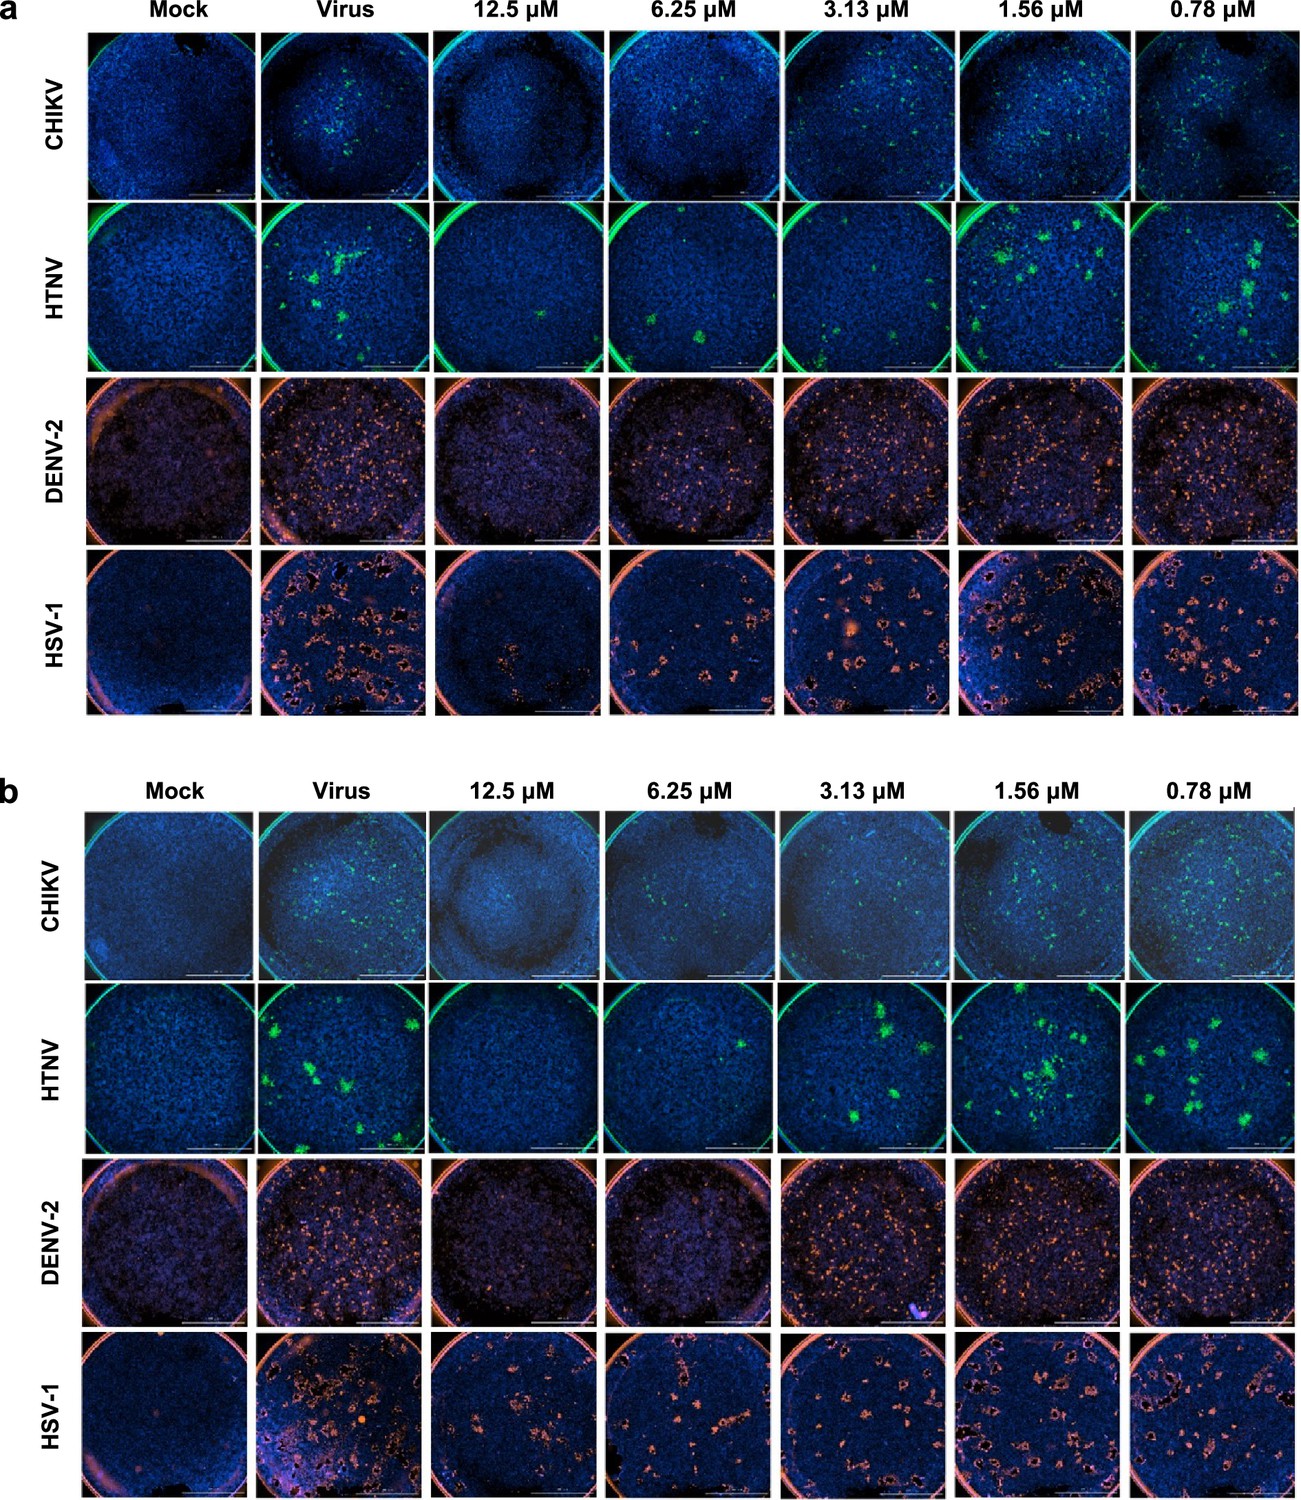
Immunofluorescence assays of P001 and P076 inhibiting Chikungunya virus (CHIKV), Hantaan virus (HTNV), Dengue virus 2 (DENV-2), and Herpes simplex virus 1 (HSV-1).
All experiments are performed in triplicates. Scale bar = 2000 μm. (a) P001. (b) P076.
Figure 4—figure supplement 3
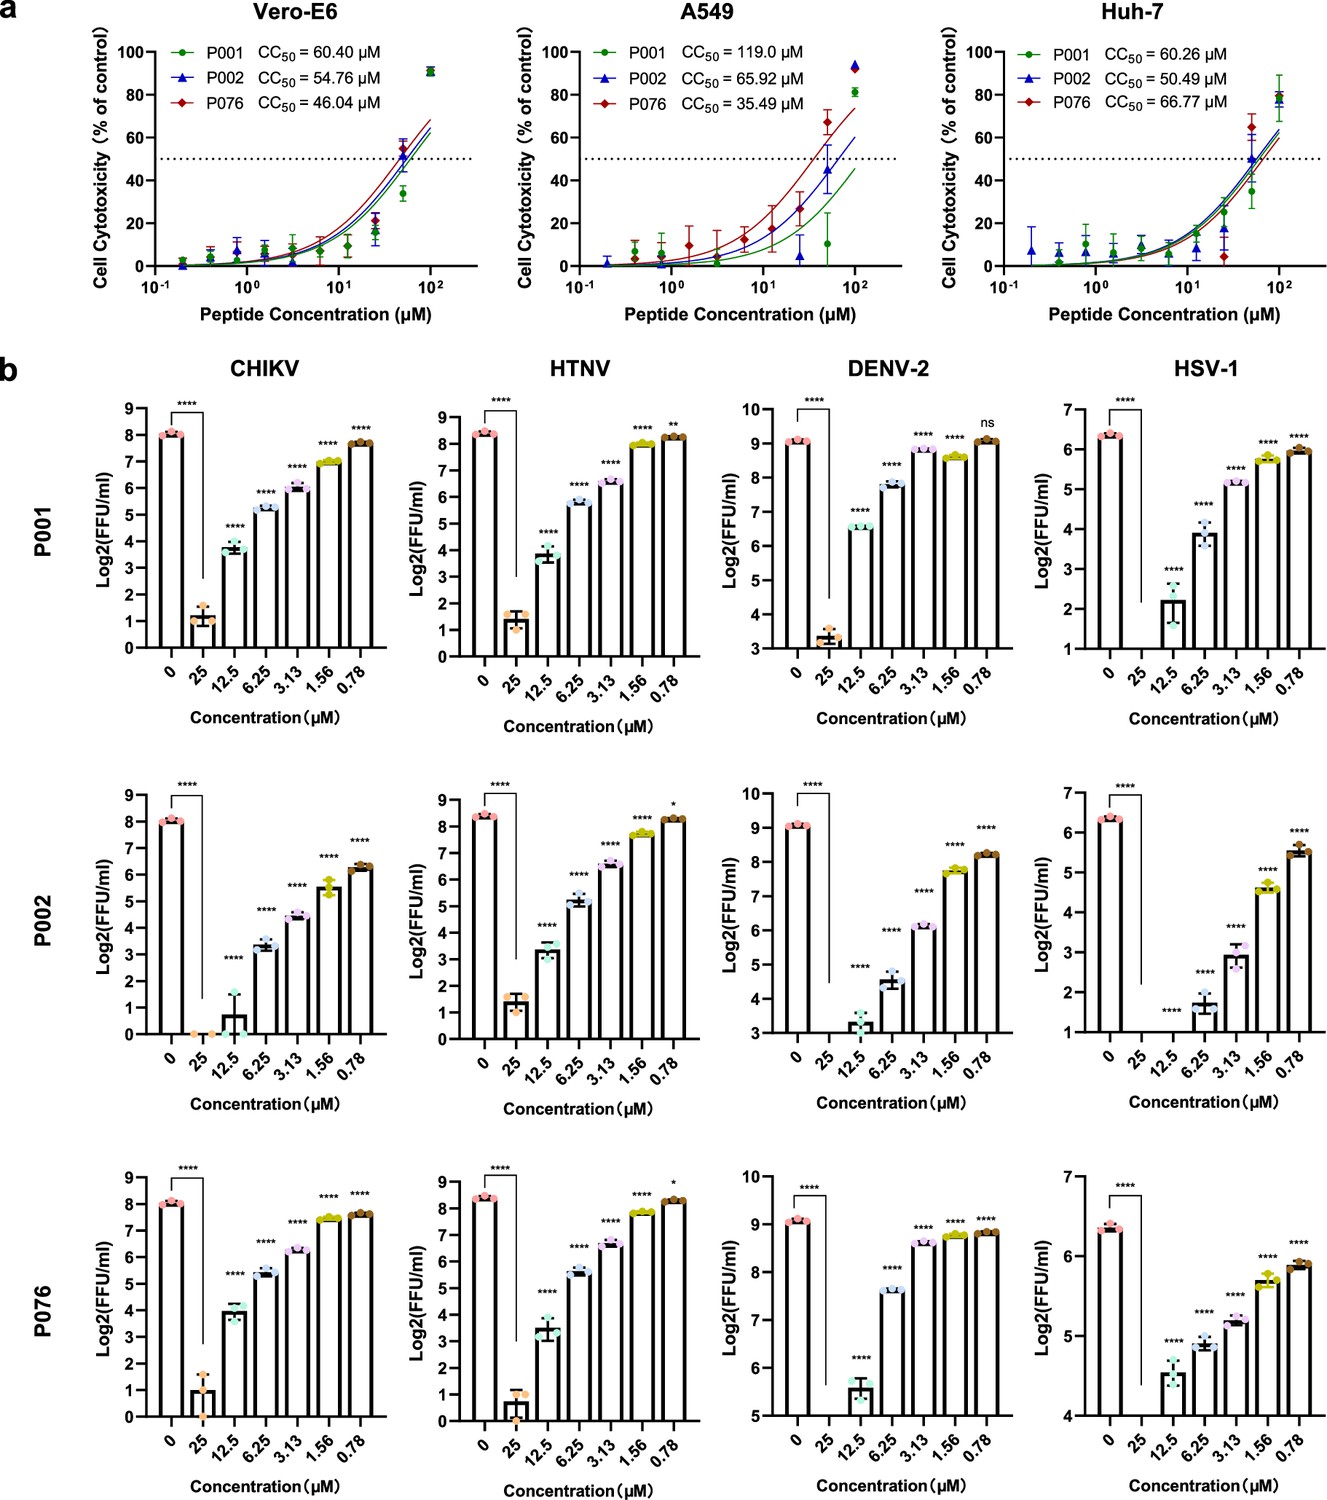
Cytotoxicity and quantitative immunofluorescence results.
(a) Cytotoxicity curve of P001, P002, and P076 against Vero-E6, A549, and Huh-7 cells. (b) Quantification of immunofluorescence assay for three antimicrobial peptides (AMPs) against four viruses. All experiments are performed in triplicates. Column bars are means ± SEMs. *p<0.05, **p<0.01, ***p<0.001, ****p<0.0001. ns, no significance.
Figure 4—figure supplement 4
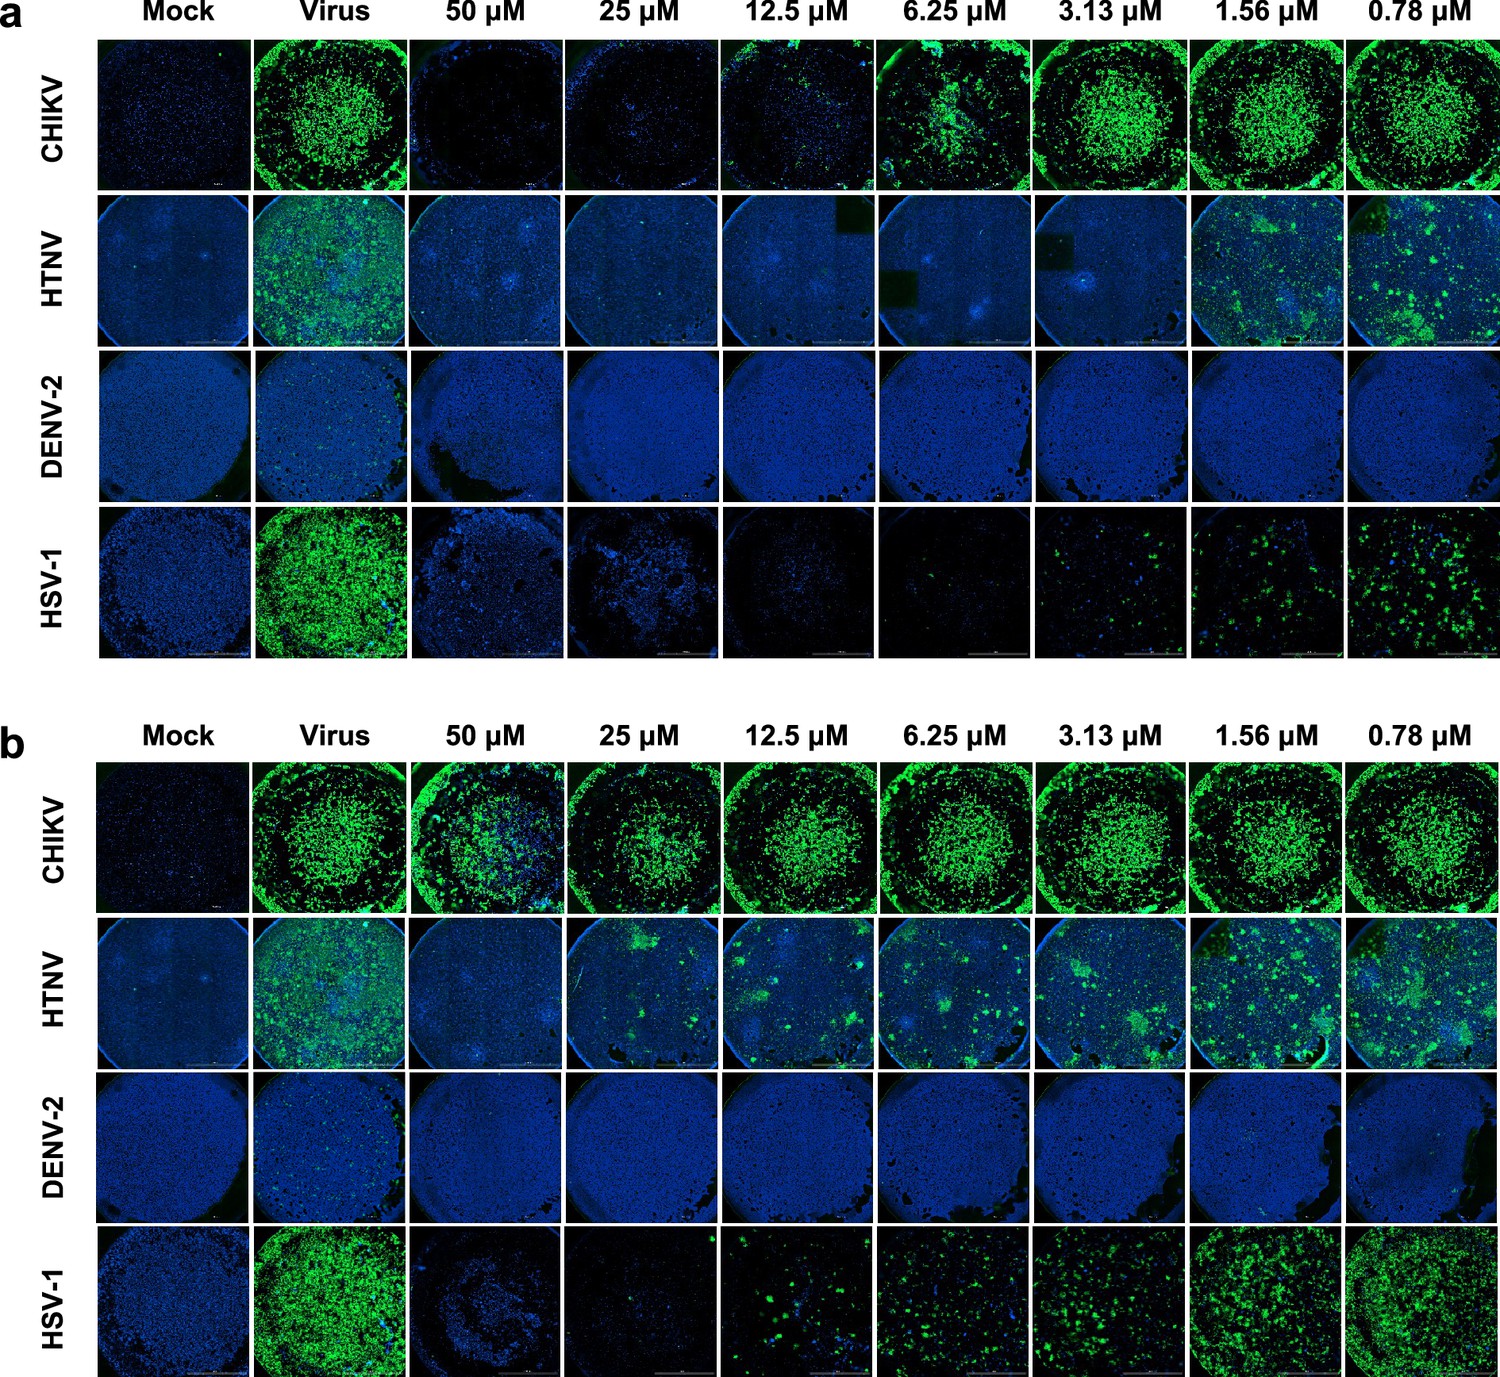
Immunofluorescence assays of P135 and P244 inhibiting Chikungunya virus (CHIKV), Hantaan virus (HTNV), Dengue virus 2 (DENV-2), and Herpes simplex virus 1 (HSV-1).
All experiments are performed in triplicates. Scale bar = 2000 μm. (a) P135. (b) P244.
Figure 4—figure supplement 5
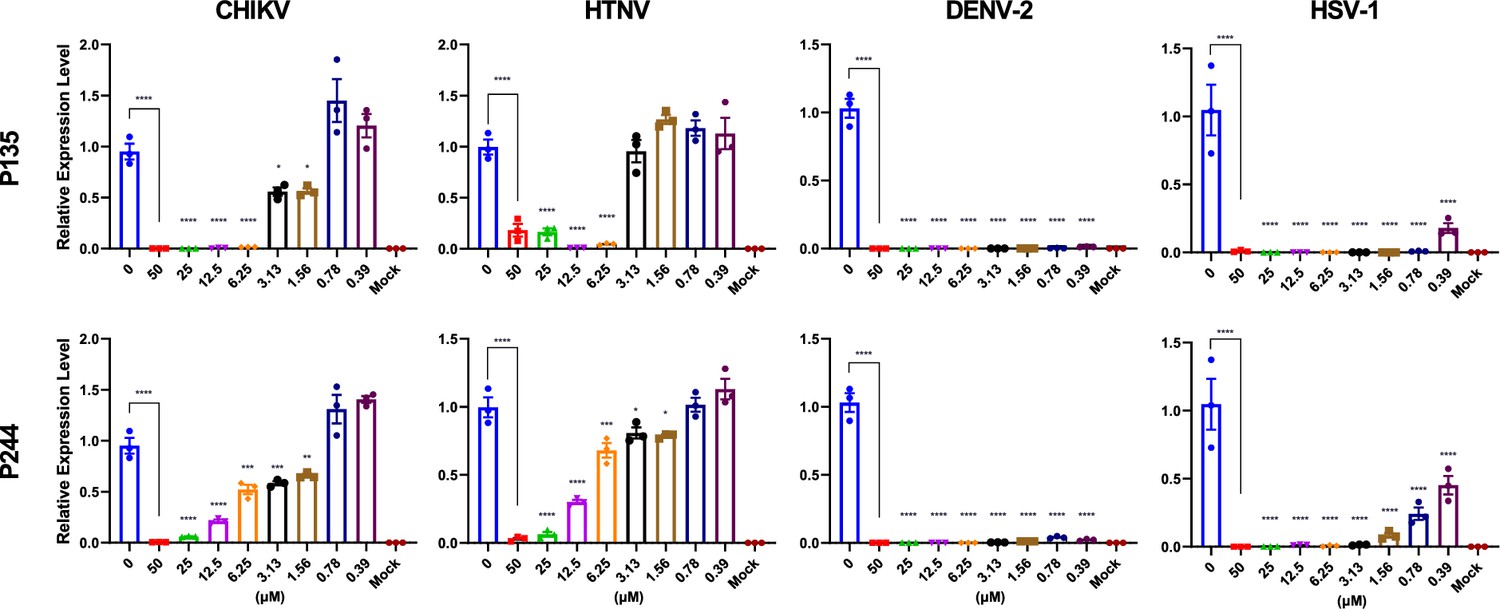
Quantitative real-time PCR of virus RNA with gradient concentrations of P135 and P244 inhibiting Chikungunya virus (CHIKV), Hantaan virus (HTNV), Dengue virus 2 (DENV-2), and Herpes simplex virus 1 (HSV-1).
All experiments are performed in triplicates. *p<0.05, **p<0.01, ***p<0.001, ****p<0.0001.
Figure 5 with 1 supplement
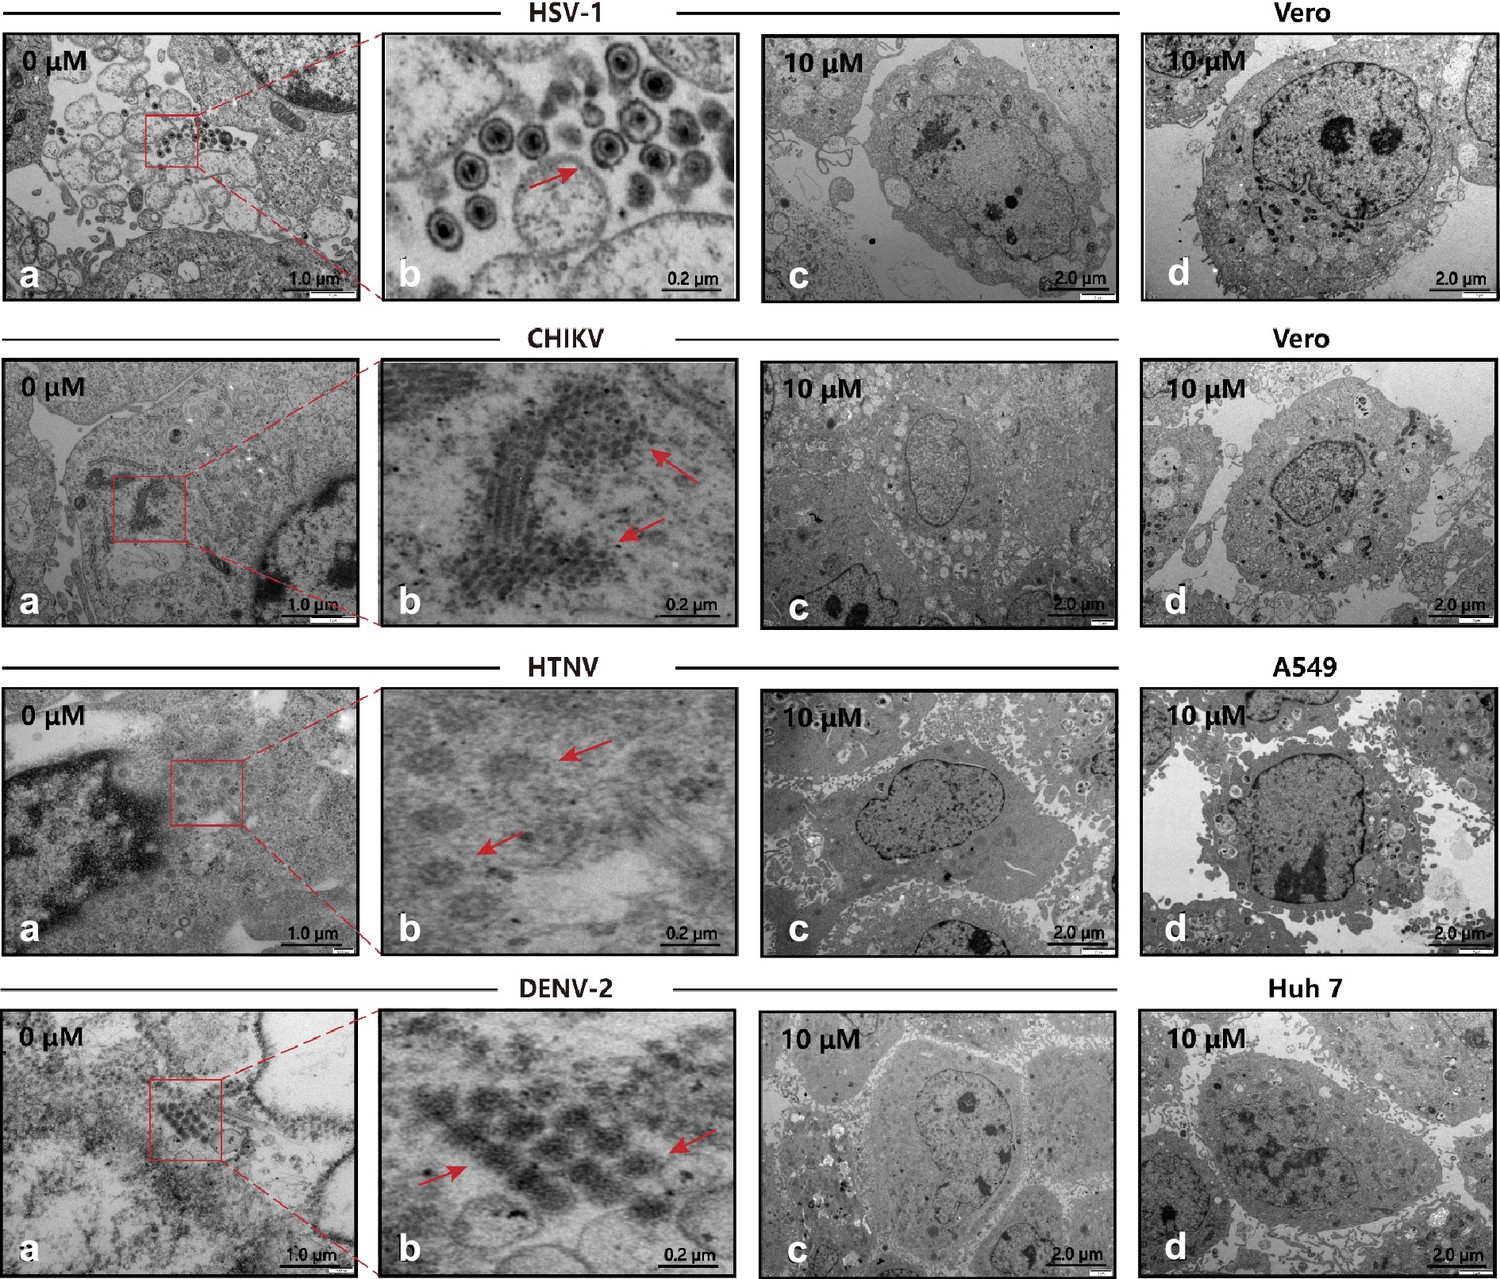
Transmission electron microscopy (TEM) of viral infection with P002.
(a, b) Cells infected with virus, where the red arrows mark the viral particles. (c) Cells are treated with 10 μM P002 and infected with virus (multiplicity of infection [MOI] = 1), where no viral proliferation is observed. (d) Control of intact cells with 10 μM P002. All experiments are performed in triplicates.
Figure 5—figure supplement 1
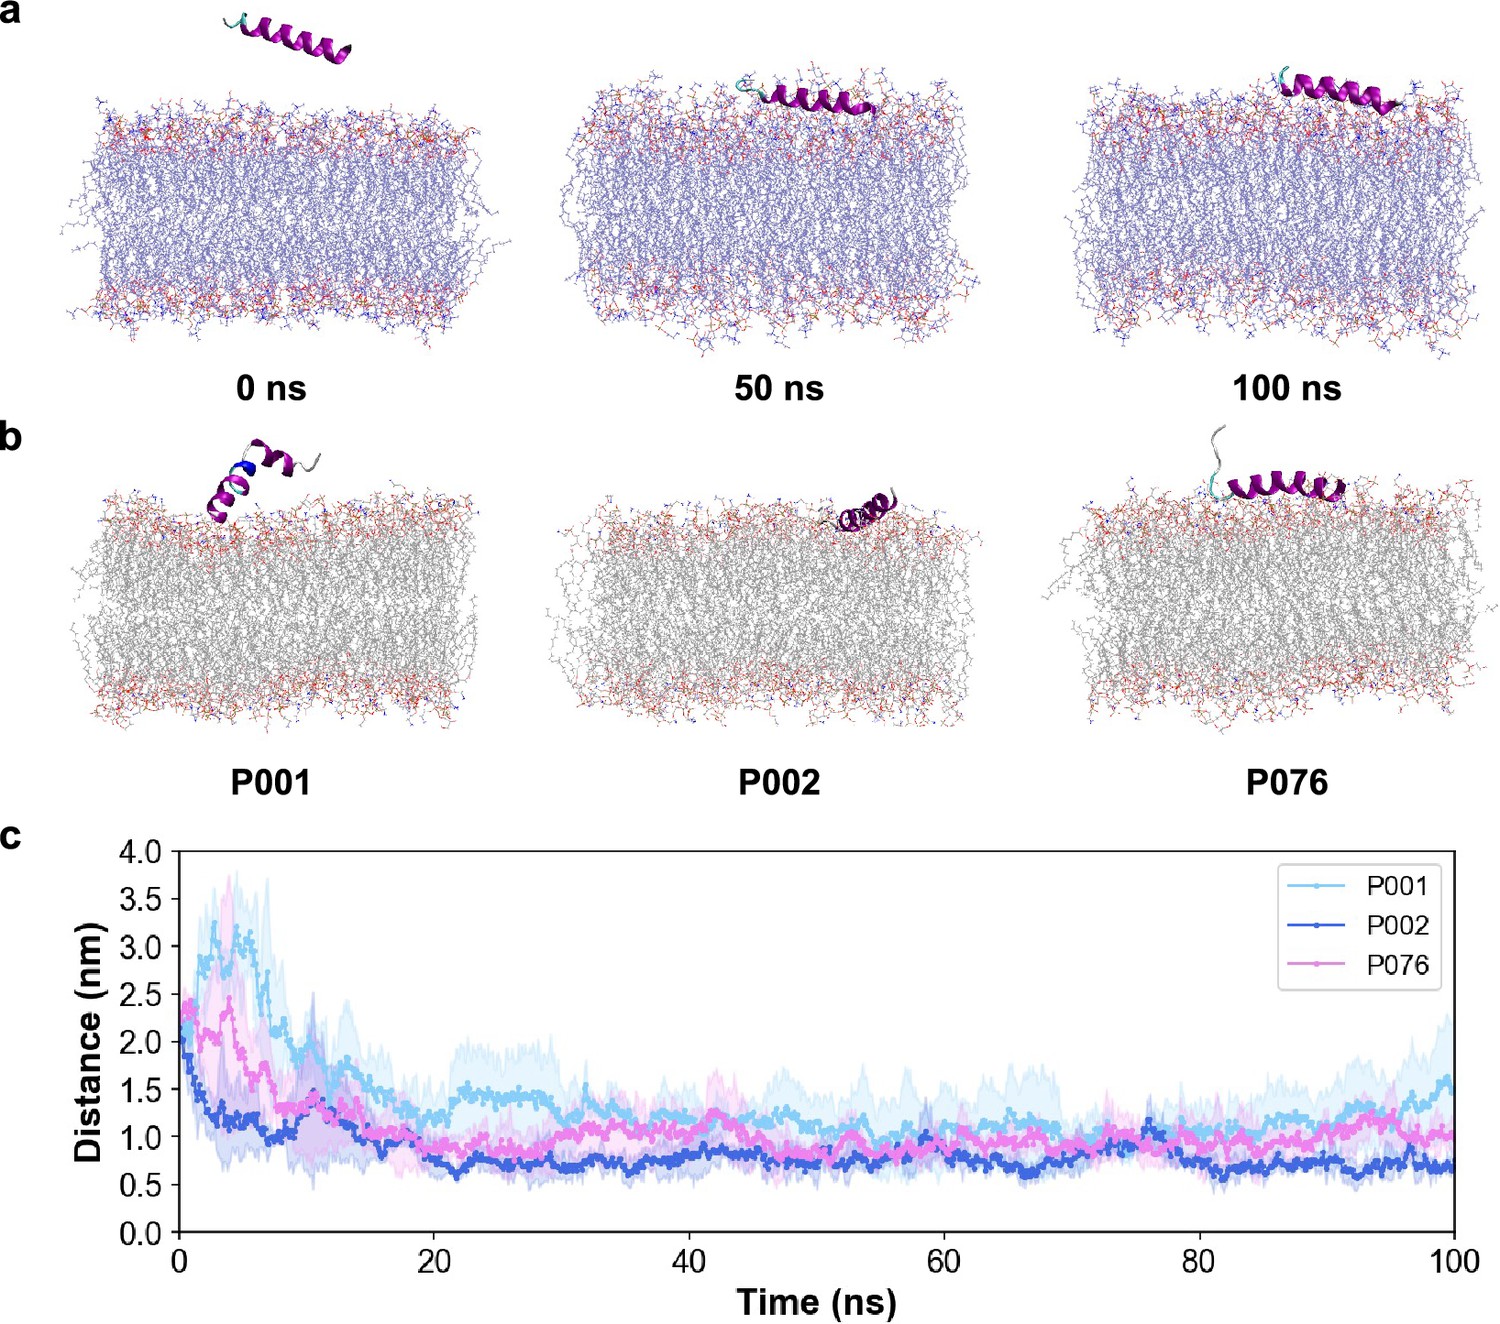
Molecular dynamics simulations for peptides and different lipid bilayers.
(a) Snapshots of P002 with viral envelopes at 0 ns, 50 ns, and 100 ns. (b) Snapshots of P001, P002, and P076 with G-inner membranes at 100 ns. (c) Distance between the peptides and the viral membrane surface in the trajectories.
Figure 6
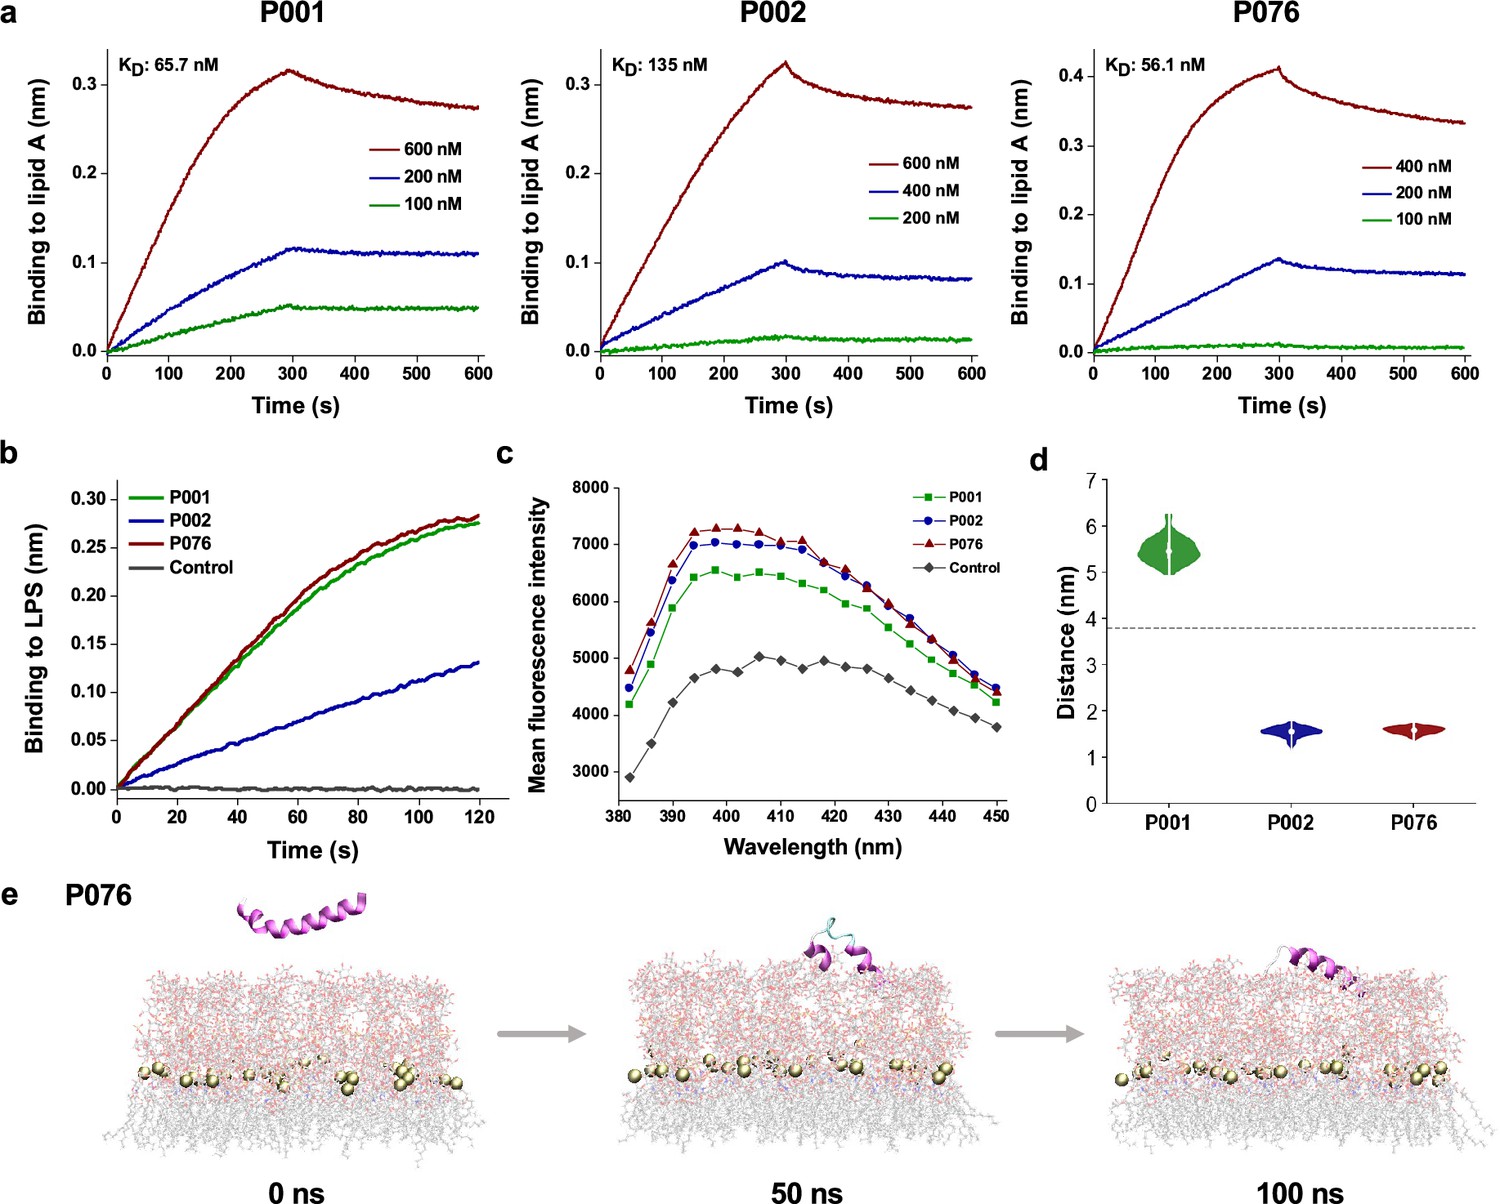
Bacterial membrane-acting assessment of antimicrobial peptides (AMPs).
(a) Binding kinetics of three AMPs to lipid A measured by biolayer interferometry. (b) Binding thicknesses of 500 nM AMPs to immobilized lipopolysaccharide (LPS) within 120 s. (c) Fluorescence intensity of 1-N-phenylnaphthylamine (NPN) after excitation at 350 nm. The maximum emission appeared at approximately 396 nm, where P001, P002, and P076 were detected higher intensity than control. (d) The distance between the center of mass (COM) of peptides and phosphorus atoms of lipid A (around the midplane of G-bacterial outer membranes) during the last 50 ns of the molecular dynamics (MD) simulation trajectories. The gray dashed line displays the initial distance at 0 ns. (e) Snapshots of P076 with G- bacterial outer membranes at 0 ns, 50 ns, and 100 ns. Only the top leaflet (LPS) is shown. Tan balls represent the phosphorus atoms of lipid A molecules.
Author response image 1

Alignments of three validated peptides.
Author response image 2

Site saturated mutagenesis of P001.
Color shows the change of predicted MIC against E. coli as predicted by AMPredictor (lower score is better).
Tables
Author response table 1
Results of AMPredictor with fingerprint on nodes.
| Model | RMSE | MSE | Pearson | CI |
|---|---|---|---|---|
| AMPredictor (ESM on nodes, FP after GNN) | 0.5348 | 0.2860 | 0.7072 | 0.7294 |
| ESM + FP on nodes | 0.5356 | 0.2869 | 0.7012 | 0.7265 |
Author response table 2
Results of AMPredictor with different graph edge encodings.
| Graph edge encoding | RMSE | MSE | Pearson | CI |
|---|---|---|---|---|
| Peptide Contact Map | 0.5348 | 0.2860 | 0.7072 | 0.7294 |
| Fully-connected | 0.5319 | 0.2828 | 0.6946 | 0.7250 |
Author response table 3
Results of AMPredictor with different ESM versions.
| ESM embedding | RMSE | MSE | Pearson | CI |
|---|---|---|---|---|
| esm1b_t33_650M_UR50S | 0.5348 | 0.2860 | 0.7072 | 0.7294 |
| esm2_t33_650M_UR50D | 0.5425 | 0.2943 | 0.6944 | 0.7563 |
| esm2_t36_3B_UR50D | 0.5581 | 0.3115 | 0.6774 | 0.7494 |
| esm2_t48_15B_UR50D | 0.5622 | 0.3160 | 0.6503 | 0.7093 |
Additional files
-
Supplementary file 1
Supplementary tables.
(a) Ablation study results of AMPredictor. Best metrics are marked in bold and second-best values are underlined. (b) Information about five used antiviral classifiers. (c) Sequences and novelty (BLAST E-value) of validated peptides. (d) The EC50 (μM) of AMPs inhibiting four enveloped viruses. (e) The selectivity index (SI) of three AMPs inhibiting four enveloped viruses. (f) Reported and predicted MICs of some recently mined AMPs. (g) Minimal inhibitory concentrations (μM) of P076-NH2 and P076. (h) The qRT-PCR primers. (i) System details of molecular dynamics simulations. (j) Binding free energy between peptides and the lipid bilayers.
- https://cdn.elifesciences.org/articles/97330/elife-97330-supp1-v1.docx
-
Supplementary file 2
Information of the generated 104 AMP sequences.
- https://cdn.elifesciences.org/articles/97330/elife-97330-supp2-v1.xlsx
-
MDAR checklist
- https://cdn.elifesciences.org/articles/97330/elife-97330-mdarchecklist1-v1.docx
Download links
A two-part list of links to download the article, or parts of the article, in various formats.
Downloads (link to download the article as PDF)
Open citations (links to open the citations from this article in various online reference manager services)
Cite this article (links to download the citations from this article in formats compatible with various reference manager tools)
Exploring the repository of de novo-designed bifunctional antimicrobial peptides through deep learning
eLife 13:RP97330.
https://doi.org/10.7554/eLife.97330.3


