Adventitial fibroblasts direct smooth muscle cell-state transition in pulmonary vascular disease
- Ludwig Boltzmann Institute for Lung Vascular Research, Austria
- Medical University of Graz, Lung Research Cluster, Austria
- Institute for Lung Health, Cardiopulmonary Institute, Member of the German Center for Lung Research, Justus-Liebig University Giessen, Germany
- Department of Medicine, Stanford University School of Medicine, United States
- Mass Spectrometry Laboratory, Stanford University School of Medicine, United States
- Medical University of Vienna, Austria
- Developmental Lung Biology and Cardiovascular Pulmonary Research Laboratories, University of Colorado, United States
Figures
Figure 1 with 2 supplements
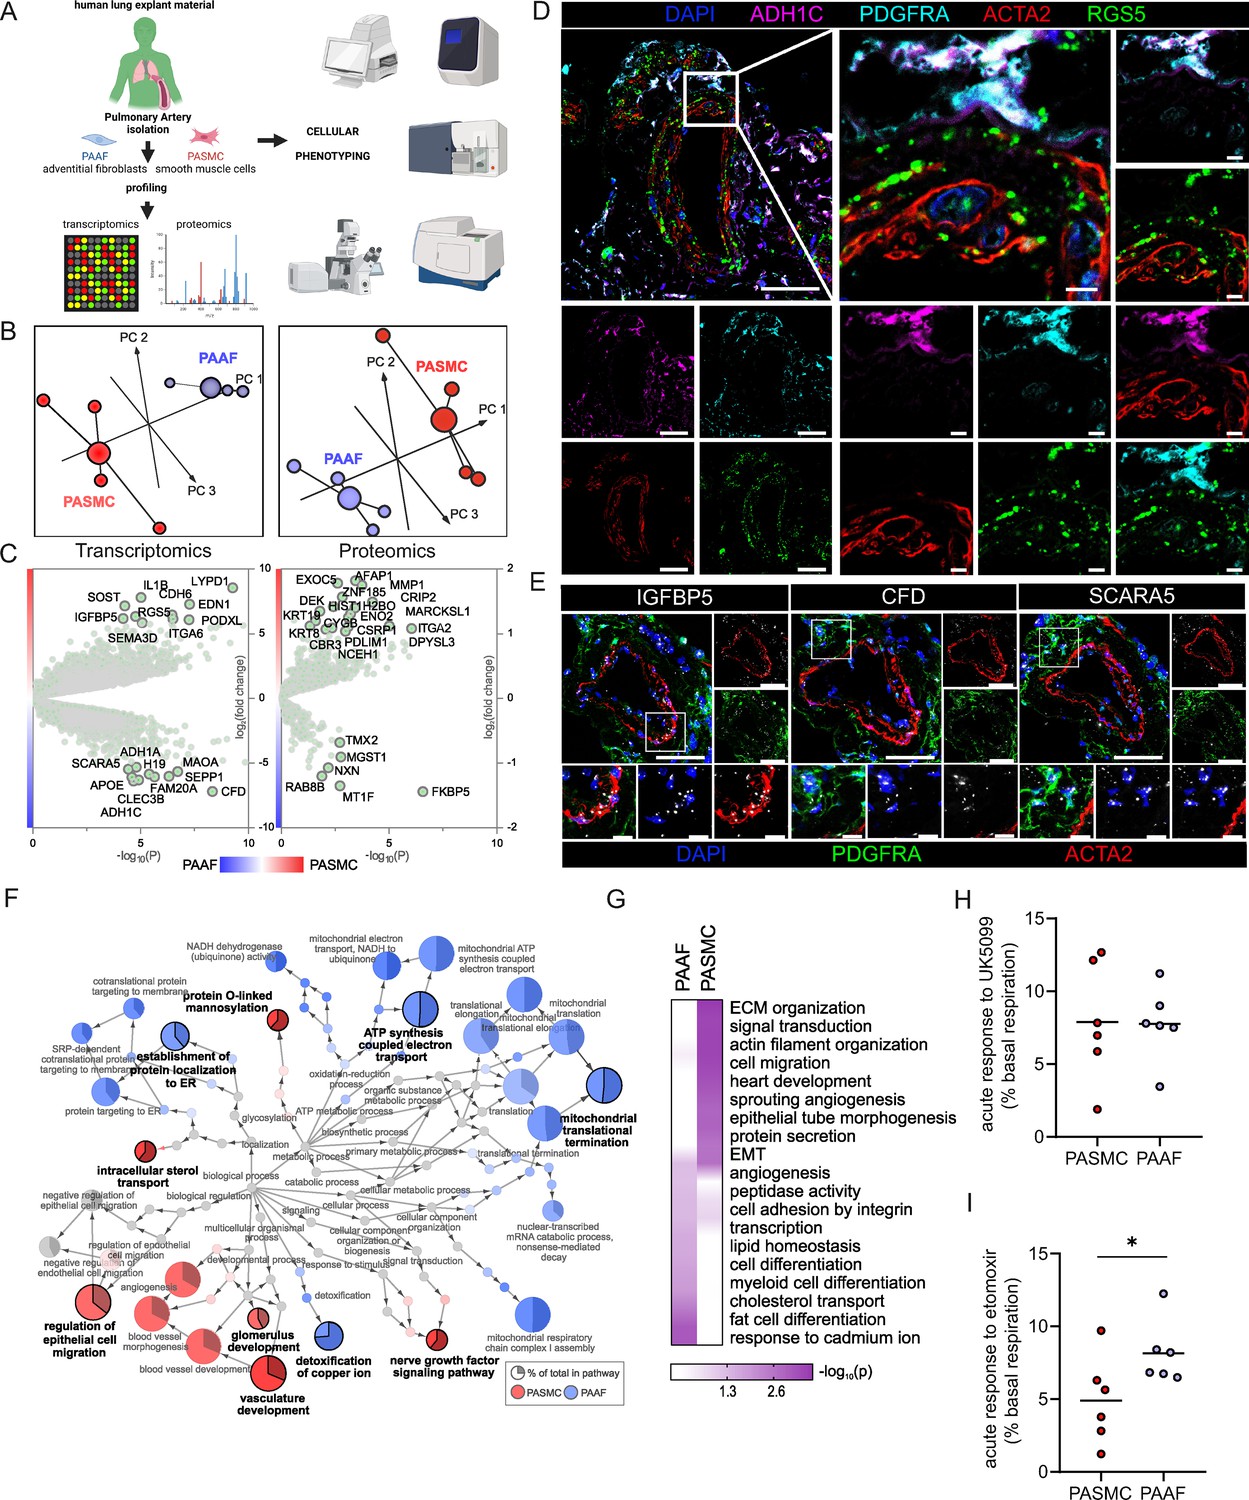
Omics-assisted phenotypic characterization of cell states in healthy human pulmonary artery smooth muscle (PASMC) and adventitial fibroblast (PAAF) lineages.
(A) Schematic representation of the experimental setup using early-passage cells (n = 4). Created with BioRender.com. (B) 3D score plots of principal component analyses (PCA), larger nodes represent gravity centers. (C) Volcano plots of log2 fold change between donor–PASMC and PAAF plotted against significance (−log10(p)). Genes names depicted for the top 20 transcriptomics hits and proteins above the threshold (−log10(p) >1.3 │LFC│>1). (D) Immunoflourescent localization of PASMC (ACTA2 and RGS5) and PAAF markers (PDGFRA and ADH1C) in normal human lungs (n = 5). (E) In situ hybridization localization of PASMC (IGFBP5) and PAAF markers (CFD and SCARA5). 4′,6-Diamidino-2-phenylindol (DAPI) as nuclear counterstaining. White bar depicting 50 μm (5 μm for zoomed in panels). (F) Gene set enrichment analysis (GSEA) of all significantly regulated transcriptomics and proteomics targets between donor–PASMC and PAAF using the gene ontology (GO) database. Parent-to-root node visualization (intermediate terms omitted) with node size reflecting significance. Highlighted nodes depict significantly altered GO overview terms being higher expressed in either PASMC or PAAF. (G) Top GO terms resulting from an overrepresentation analysis (ORA) of the omics dataset using more stringent cutoff values (−log10(p) >3 │LFC│>2 transcriptomics; −log10(p) >1.5 │LFC│>0.5 proteomics). (H) Calculated change in basal oxygen consumption rate upon addition of UK5099 (glucose/pyruvate mitochondrial uptake inhibitor) and (I) etomoxir (long chain fatty acid mitochondrial uptake inhibitor). Mann–Whitney test, ‘*’ denotes p < 0.05.
Figure 1—figure supplement 1
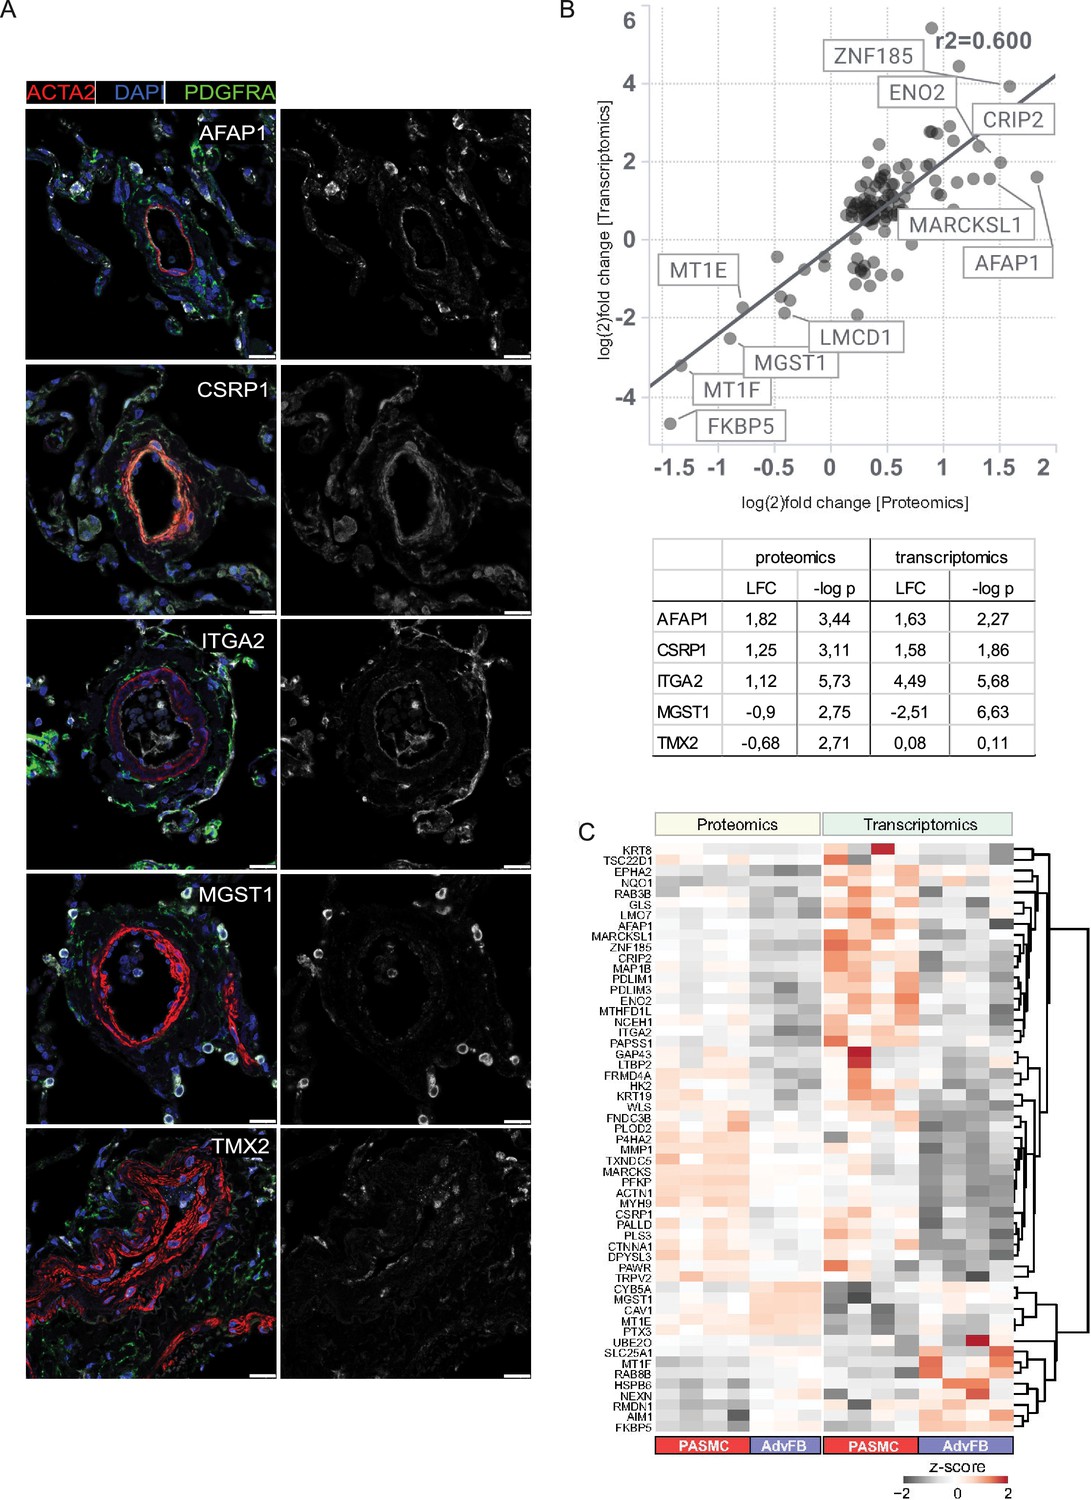
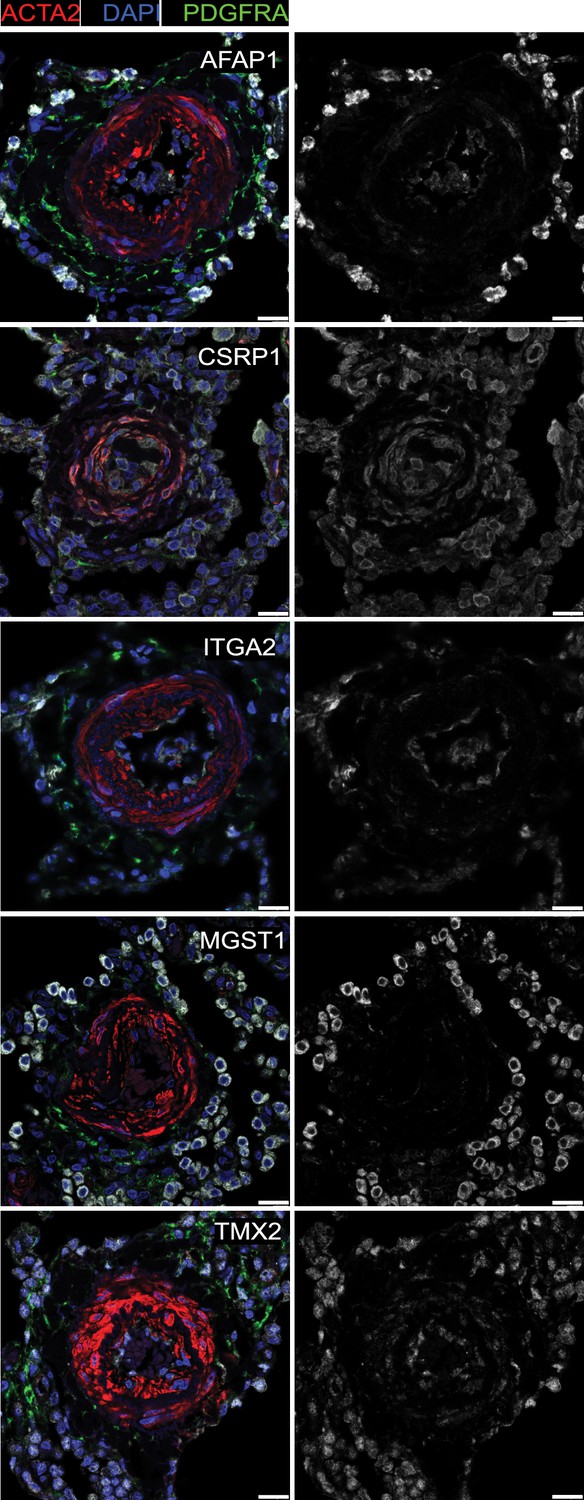
Validation and correlation between transcriptomics and proteomics.
(A) Representative immunofluorescent images of pulmonary artery smooth muscle cell (PASMC)-enriched (Actin Filament-Associated Protein 1 – AFAP1, Cysteine and Glycine Rich Protein 1 – CSRP1, Integrin Alpha 2 – ITGA2) and pulmonary artery adventitial fibroblast (PAAF)-enriched (Microsomal Glutathione S-Transferase 1 – MGST1, Thioredoxin-Related Transmembrane Protein 2 – TMX2) molecules on human donor pulmonary arteries. Co-staining with ACTA2 as PASMC marker and PDGFRA as fibroblast marker. 4′,6-Diamidino-2-phenylindol (DAPI) as nuclear counterstain. White bar depicting 20 μm. (B) Correlation plot displaying the linear relationship between the log2 fold change observed in transcriptomics and proteomics. Plotted are all genes that were significantly regulated between PASMC and PAAF in both -omics approaches −log10(p) >2 in the pair-wise comparison between donor–PASMC and PAAF and genes where significance was given by ANOVA −log10(p) >2 when comparing all four groups. The linear Pearson correlation is marked by the black line and the corresponding R2. (C) Heatmap showing the single expression values for the genes that were found to be significantly regulated between PASMC and PAAF in either transcriptomics or proteomics.
Figure 1—figure supplement 2
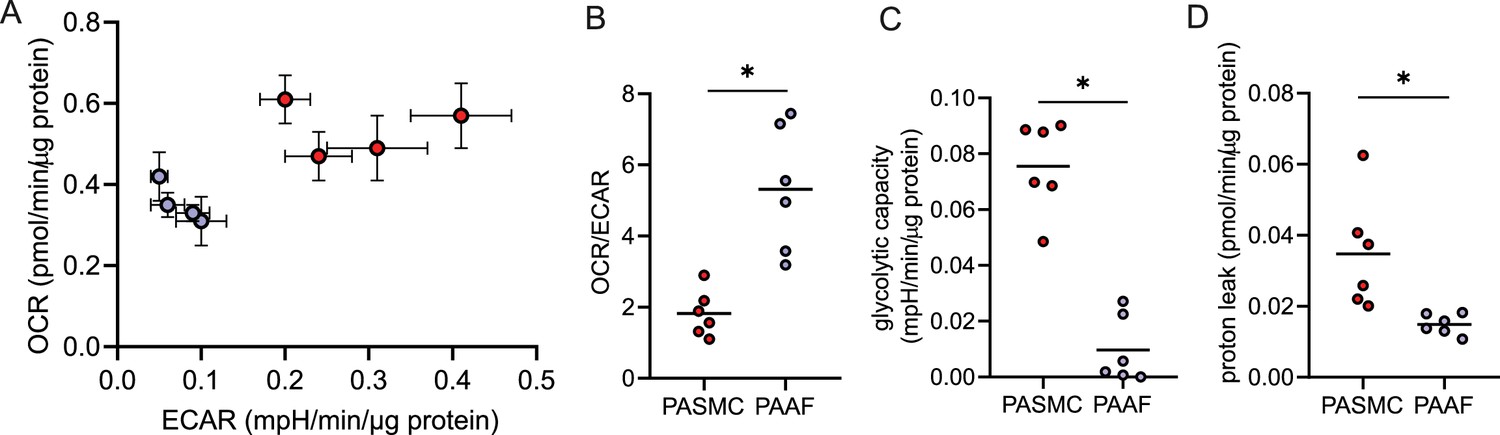
Real-time metabolic analysis between donor pulmonary artery smooth muscle cell (PASMC) and pulmonary artery adventitial fibroblast (PAAF).
(A) Representative energy map of oxygen consumption and extracellular acidification rate. (B) Ratio of oxygen consumption rate (OCR) to extracellular acidification rate (ECAR). (C) Measured glycolytic capacity (mpH/min) normalized to total protein content. (D) Calculated mitochondrial proton leak (pmol/min) normalized to total protein content. Mann–Whitney test, '*' denotes p < 0.05.
Figure 2 with 1 supplement
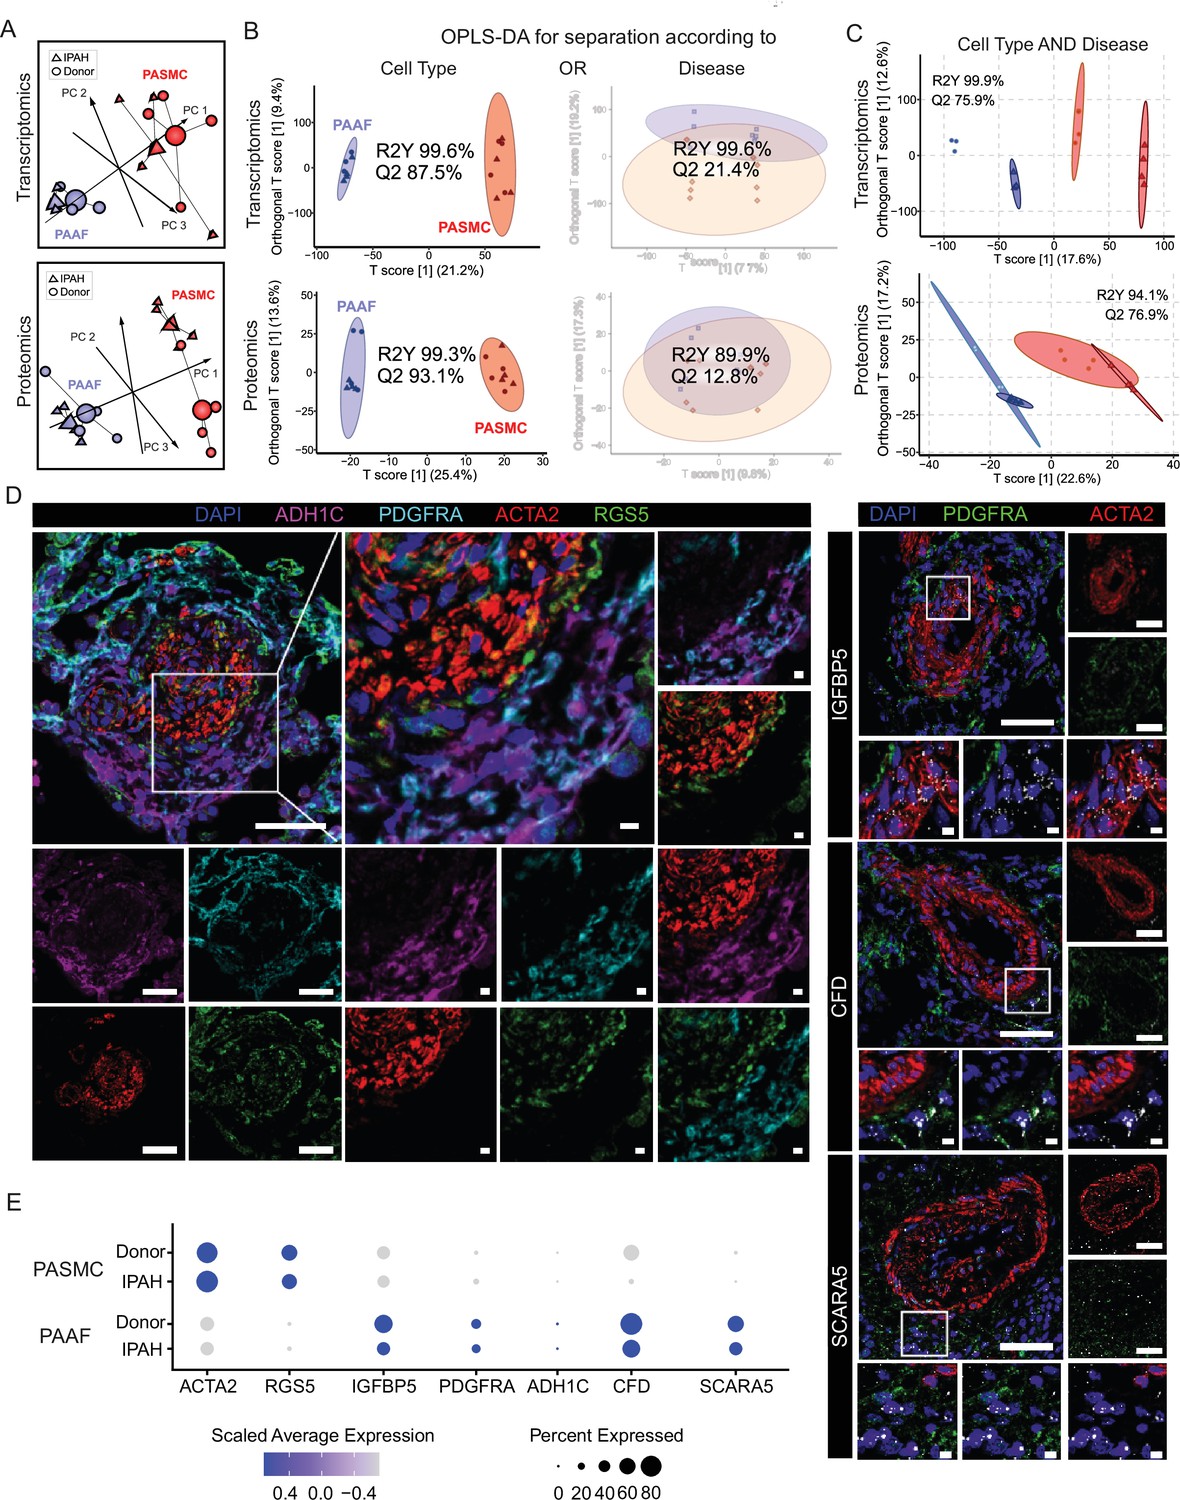
Preserved lineages and distinct pulmonary artery smooth muscle cell/pulmonary artery adventitial fibroblast (PASMC/PAAF) cell states in idiopathic pulmonary arterial hypertension (IPAH).
(A) 3D score plots of principal component analyses (PCA), larger nodes represent gravity centers. (B) Orthogonal projection to latent structures-discriminant analysis (OPLS-DA) T score plots separating predictive variability (x-axis), attributed to biological grouping, and non-predictive variability (technical/inter-individual, y-axis). Monofactorial OPLS-DA model for separation according to cell type or disease. (C) Bifactorial OPLS-DA model considering cell type and disease simultaneously. Ellipse depicting the 95% confidence region, Q2 denoting model’s predictive power (significance: Q2 >50%) and R2Y representing proportion of variance in the response variable explained by the model (higher values indicating better fit). (D) Immunoflourescent and in situ hybridization localization of PASMC (ACTA2, RGS5, and IGFBP5) and PAAF markers (PDGFRA, ADH1C, CFD, and SCARA5) in IPAH human lungs (n = 5). White bar depicting 50 μm (5 μm for zoomed in panels). (E) Dot plot showing relative expression of omics-identified PASMC/PAAF markers in published single-cell transcriptomics dataset of fresh human pulmonary arteries of donors and IPAH patients (GSE210248).
Figure 2—figure supplement 1
Validation of omics markers in idiopathic pulmonary arterial hypertension (IPAH).
Representative immunofluorescent images of pulmonary artery smooth muscle cell (PASMC)-enriched (AFAP1, CSRP1, and ITGA2) and pulmonary artery adventitial fibroblast (PAAF)-enriched (MGST1 and TMX2) molecules on human IPAH pulmonary arteries. Co-staining with ACTA2 as PASMC marker and PDGFRA as fibroblast marker. 4′,6-Diamidino-2-phenylindol (DAPI) as nuclear counterstain. White bar depicting 20 μm.
Figure 3
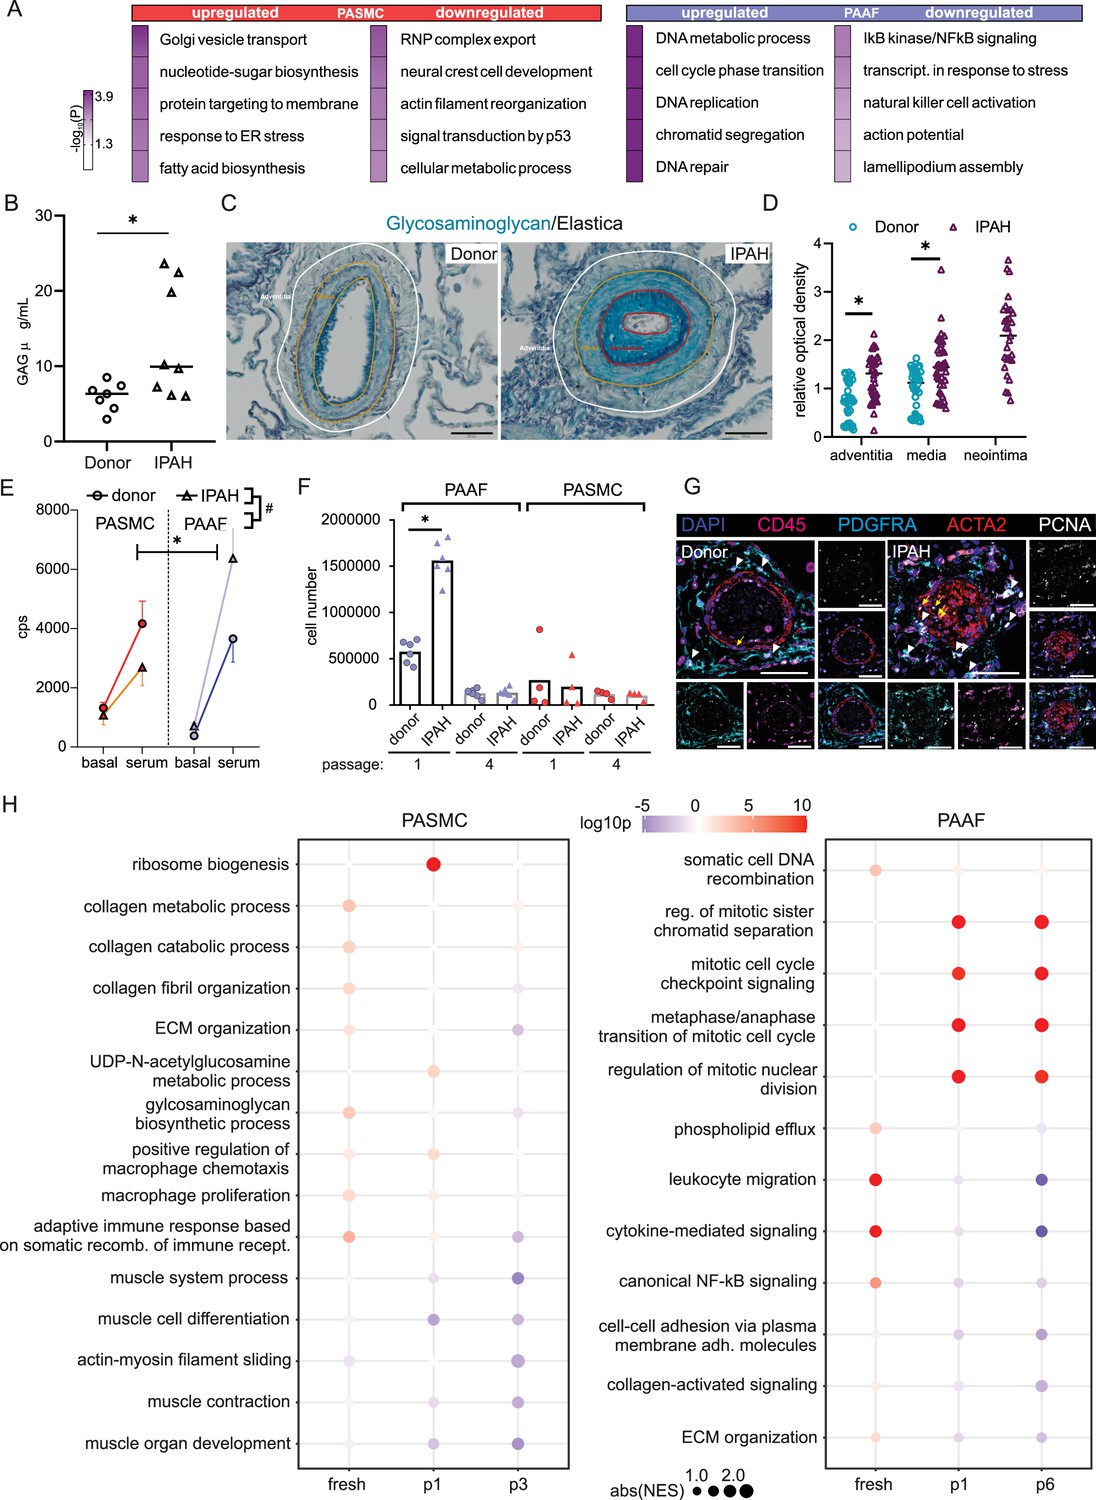
Phenotypic correlates of pulmonary artery smooth muscle cell/pulmonary artery adventitial fibroblast (PASMC/PAAF) cell state in idiopathic pulmonary arterial hypertension (IPAH).
(A) Top 5 biological process terms from the gene ontology enrichment analysis that are up- or downregulated in IPAH. (B) Dimethylmethylene blue (DMMB) assay for quantification of glycosaminoglycan content in isolated pulmonary arteries from donor (n = 7) or IPAH (n = 8) patients. Mann–Whitney test. (C) Representative Alcian blue (glycosaminoglycans – blue) with Verhoeff’s staining (elastic fibers – black/gray) of donor and IPAH lungs. Scale bar: 100 µm. Annotated regions depicting adventitia (white), media (yellow), and neointima (red). (D) Quantitative image analysis of Alcian blue staining intensities in adventitial, medial, and neointimal regions of pulmonary arteries from donors (n = 10) and IPAH patients (n = 10). Two-way ANOVA followed by Sidak’s multiple comparisons test (*p < 0.05). (E) Proliferative response of passage 3 cells measured by [3H]-thymidine incorporation assay upon serum stimulation. Dots represent mean values (n = 5–6 donors/IPAH) with bars showing standard errors of mean. Interaction effects of stimulation, cell type, and disease state on cellular proliferation were analyzed by three-way ANOVA. Significant interaction effects are indicated as follows: * for stimulation × cell type interactions and # for cell type × disease state interactions (both *, #p < 0.05). (F) Absolute cell counts measured after 24 hr growth. Mann–Whitney test, p < 0.05. (G) Representative immunofluorescent localization of proliferating (PCNA marker) PASMC (ACTA2, yellow arrow) and PAAF (PDGFRA, white arrowhead) in health (donor) and diseased (IPAH) lungs. Immune cells were identified through CD45 expression. 4′,6-Diamidino-2-phenylindol (DAPI) nuclear counterstain, 50 μm scale bar. (H) Comparison of gene expression changes in IPAH cells compared to healthy state in three conditions (fresh – GSE210248; passage 1 – GSE255669; and passage 3 – GSE144274 or passage 6 – GSE144932). Dot plot of gene set enrichment analysis for selected biological process terms with dot size depicting absolute value of the normalized enrichment score (absNES), color intensity showing significance level (log10p) and color coding for up- or downregulation of the biological process.
Figure 4
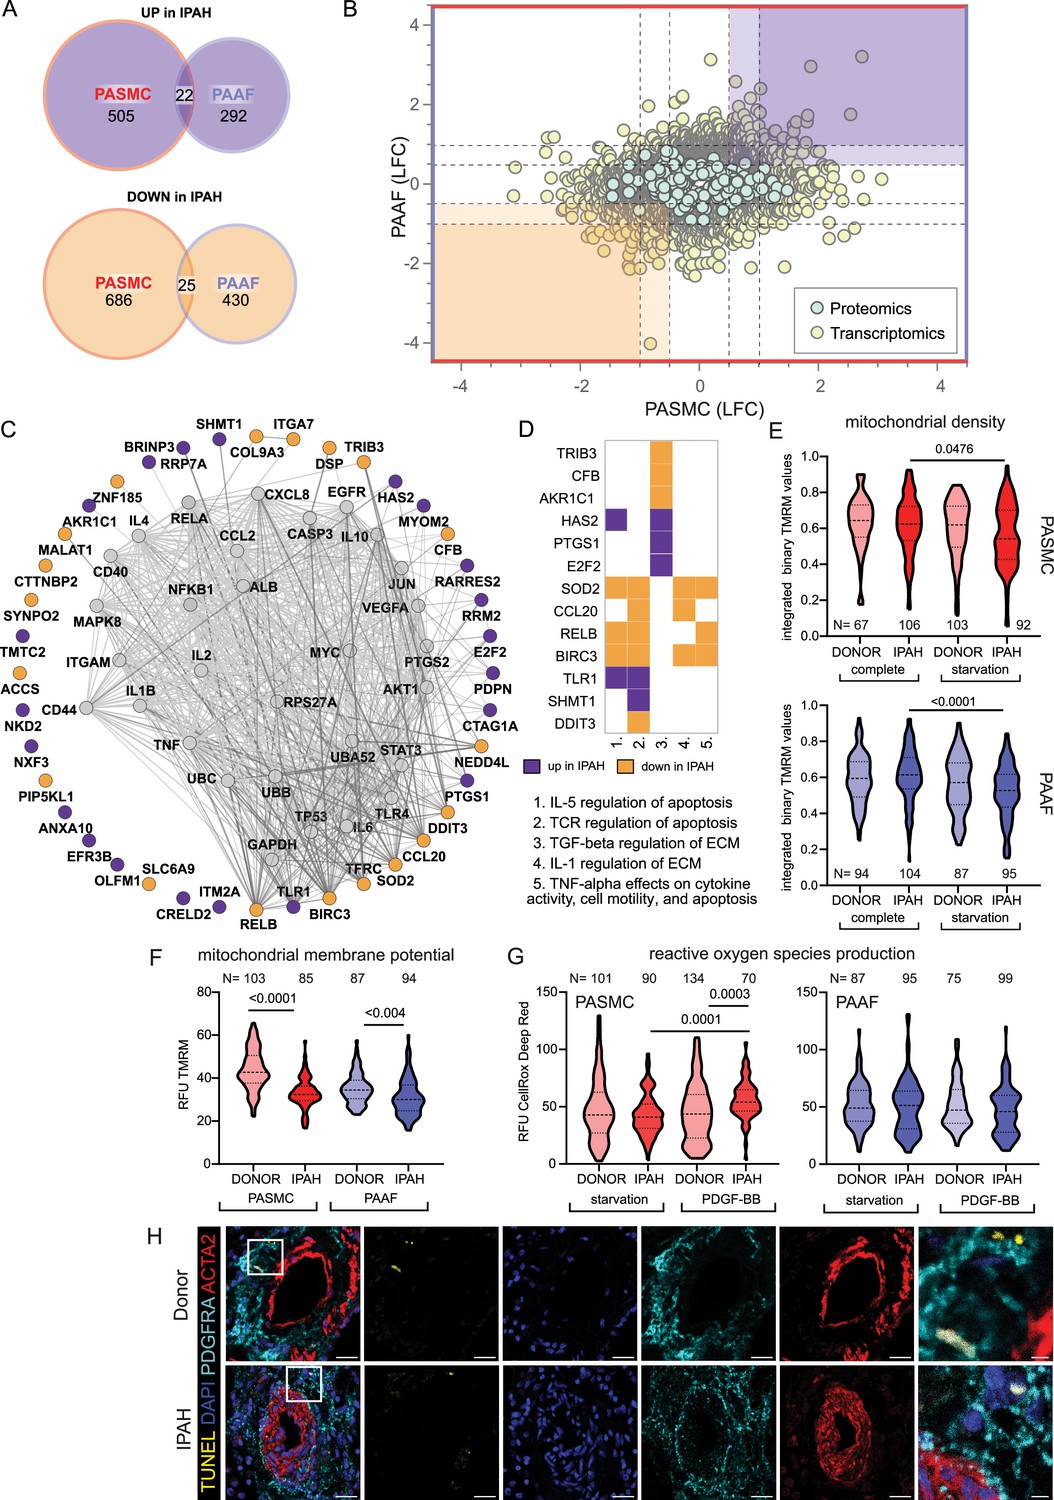
Mitochondrial dysfunction as an intersecting phenotypic characteristic of pulmonary artery smooth muscle cell (PASMC) and pulmonary artery adventitial fibroblast (PAAF) in idiopathic pulmonary arterial hypertension (IPAH).
(A) Euler diagram of the differentially expressed genes summarizing the overlaps and disjoints in regulation (criteria employed: −log10(p) >1.3; and LFC ±│1│for transcriptomics data and ±│0.5│for proteomics data). (B) Scatter plot graph of log2 fold changes between donor and IPAH in PASMC plotted against changes in PAAF, shaded areas highlighting commonly regulated genes/proteins. (C) Visualization of STRING-based interaction and regulatory network with gray nodes representing identified putative upstream regulators. (D) Pathway analysis performed in Enrichr using the BioPlanet database with a matrix annotating the main genes involved with color coding reflecting the IPAH dependent regulation. (E) Mitochondrial content measurement using tetramethylrhodamine methyl ester (TMRM) dye in complete or starvation (no serum) medium. (F) TMRM dye (quench mode)-based mitochondrial membrane potential measurement following starvation. (G) Basal and PDGF-BB-stimulated reactive oxygen species production (ROS) (40 min, 50 ng/ml) using CellRox DeepRed dye. Kruskal–Wallis test followed by Dunn’s multiple comparisons test. Cell numbers from each condition and cell type denoted by N on the graph (n = 3 independent donors/IPAH) (E–G). (H) Representative immunofluorescent localization of apoptotic cells (TUNEL marker). PASMC (ACTA2 marker) and PAAF (PDGFRA marker) in health (donor) and diseased (IPAH) lungs (n = 6). 4′,6-Diamidino-2-phenylindol (DAPI) nuclear counterstain, 25 μm scale bar (5 μm for zoomed in panel).
Figure 5
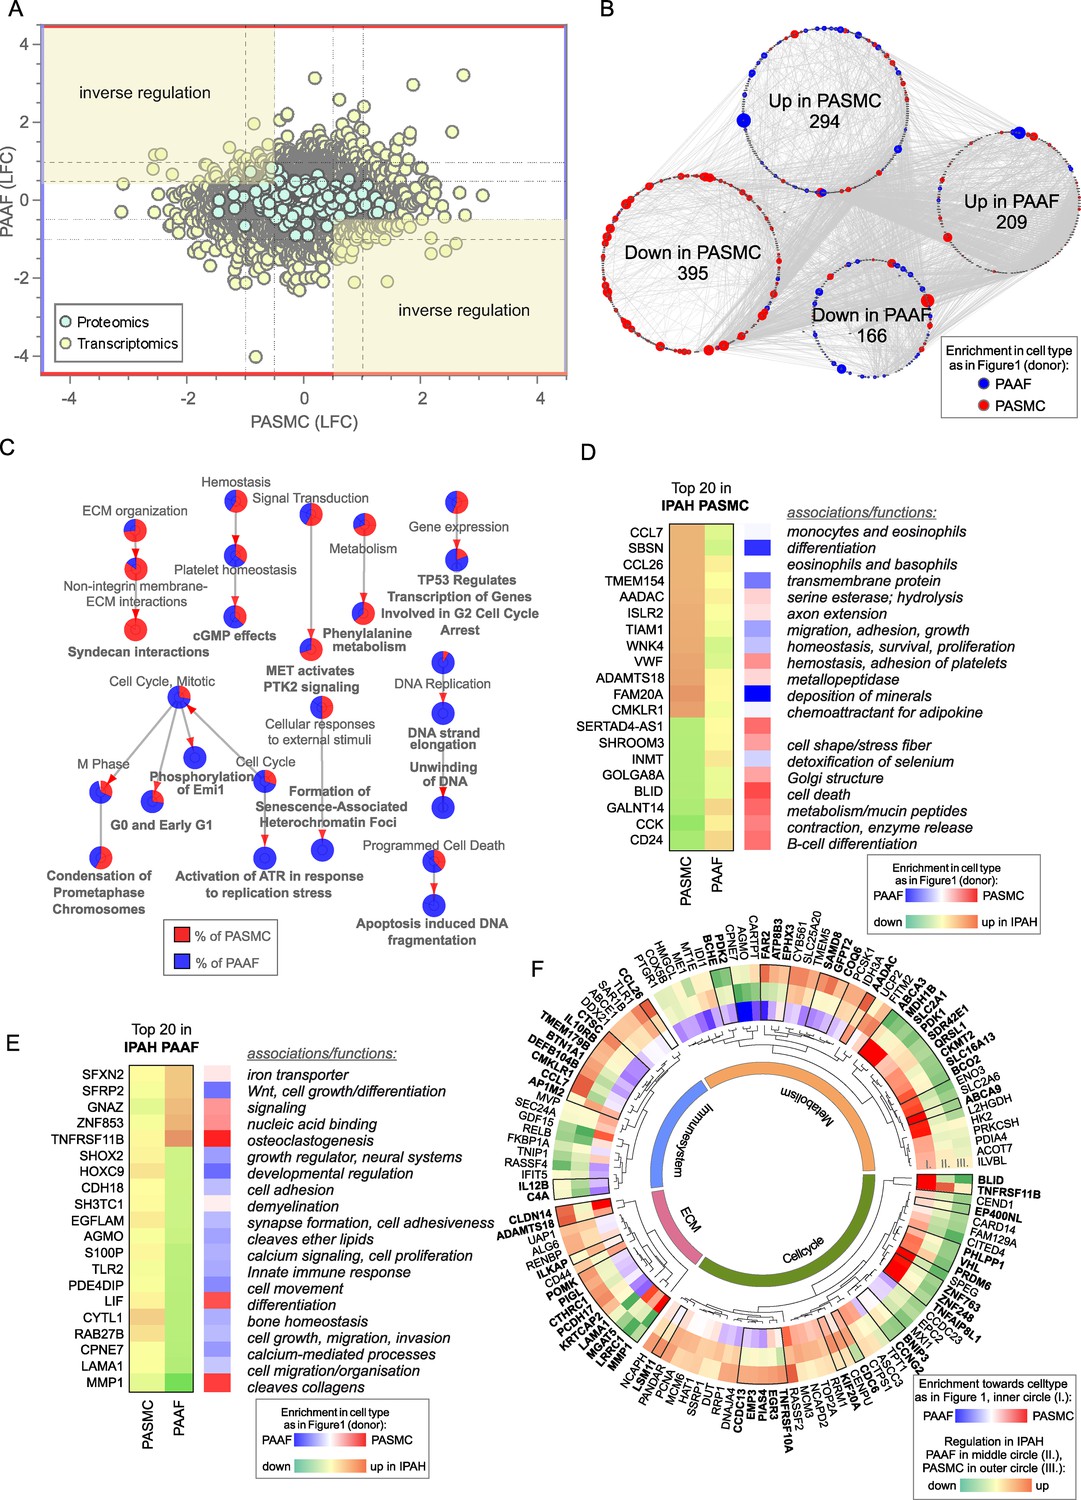
Cell-type-specific idiopathic pulmonary arterial hypertension (IPAH)-dependent transcriptomic and proteomic changes.
(A) Dot plot of log2 fold changes between donor and IPAH in pulmonary artery smooth muscle cell (PASMC) plotted against changes in pulmonary artery adventitial fibroblast (PAAF), shaded areas highlighting the inversely regulated genes/proteins (criteria employed: −log10(p) >1.3; and LFC ±│1│for transcriptomics data and ±│0.5│for proteomics data). (B) A synoptic view of the network analysis performed with all uniquely regulated elements (as highlighted in A), depicting their initial enrichment in donor cell type. (C) Significant terms resulting from a gene ontology enrichment analysis of uniquely regulated elements represented as nodes connecting to related nodes, reflecting which cell type mostly contributed to the changes observed. Color depicting significantly regulated elements in omics dataset. (D) Top 20 most significantly regulated genes in IPAH-PASMC and (E) IPAH-PAAF. Color coding reflects the IPAH dependent regulation, and initial enrichment in donor cell type. (F) Circular heatmap of IPAH-dependent regulation of metabolic, extracellular matrix, immune system, and cell cycle elements in PASMC and PAAF. The two outer rings give information of direction and intensity of change in IPAH-PASMC (ring panel III) and IPAH-PAAF (ring panel II), while the inner most ring (ring panel I) depicts initial cell-type enrichment at normal condition. Highlights (bold font) are given to significantly differing regulations between PASMC and PAAF under IPAH conditions. The functional association is performed based on data extracted from GeneCards, following a manual curation.
Figure 6 with 1 supplement
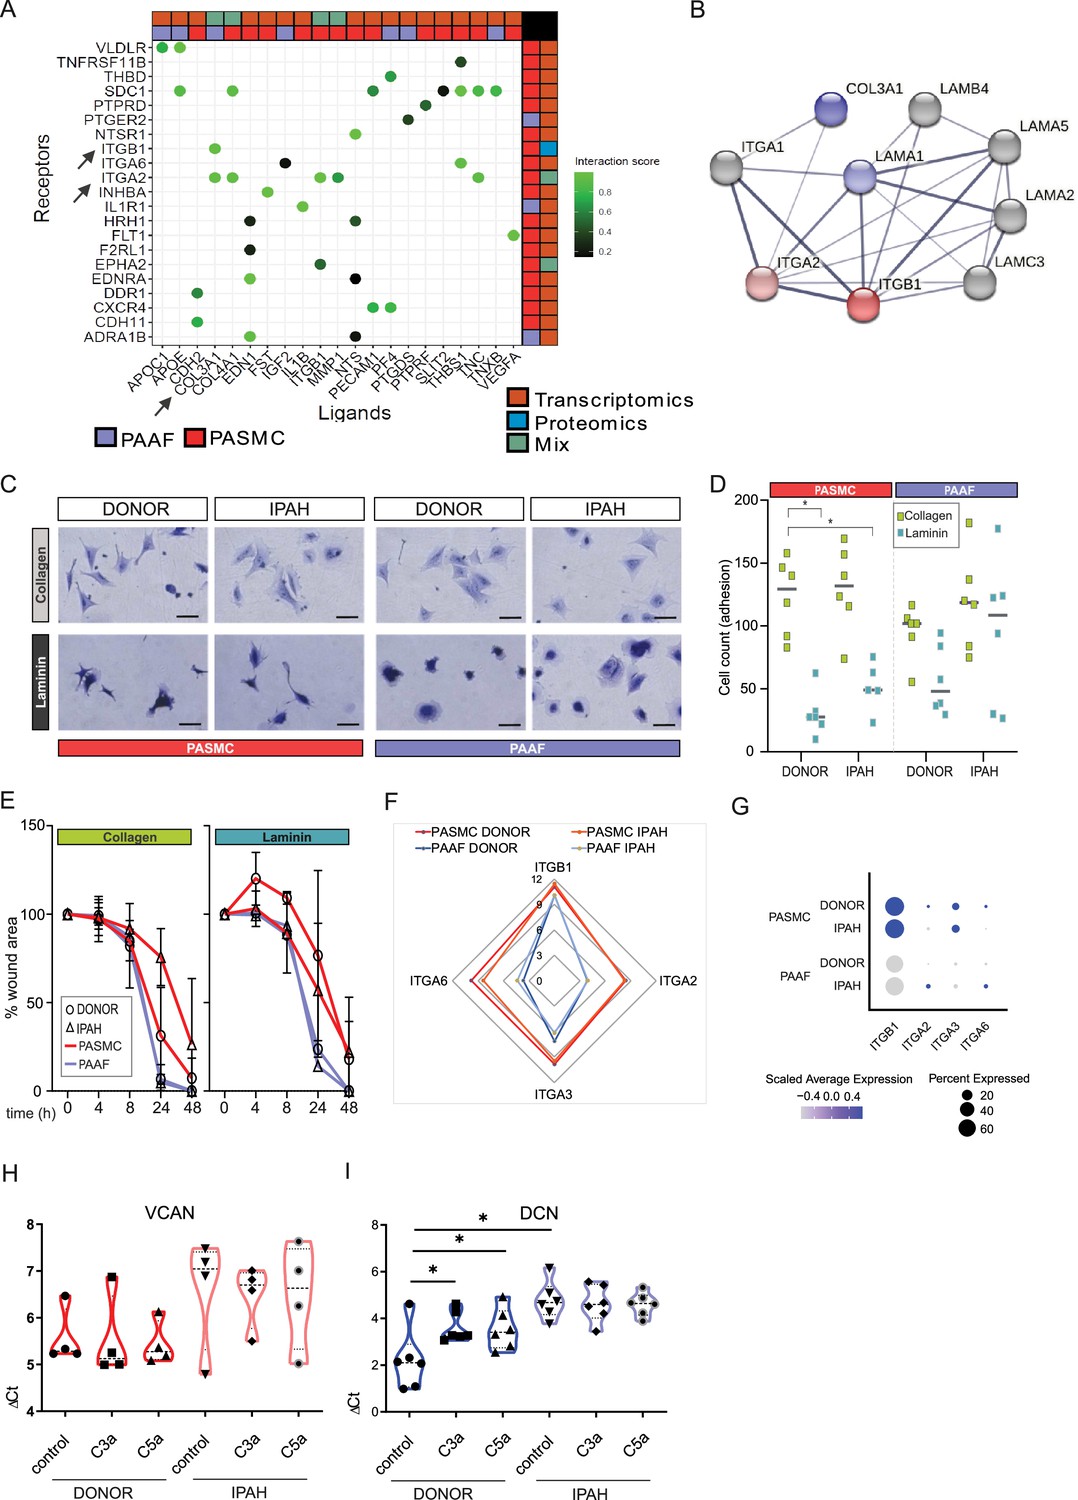
Idiopathic pulmonary arterial hypertension (IPAH)-dependent changes mediated through cell-type distinct extracellular matrix response.
(A) Ligand–receptor interaction analysis for pulmonary artery adventitial fibroblast (PAAF) and pulmonary artery smooth muscle cell (PASMC) based on transcriptomic and proteomic dataset. (B) STRING physical interaction network for PASMC expressed receptors (red, ITGA2 and ITGB1) and PAAF expressed ligands (blue, COL3A1 and LAMA1). Edge thickness indicating strength of data support. (C) Representative image of crystal violet-stained attached cells on collagen-I- or laminin-coated plates. 200 µm scale bar. (D) Attachment assay for donor and IPAH-PASMC and PAAF (n = 5–6) on collagen-I- and laminin-coated plates (n = 6 for each condition). Two-way ANOVA followed by Dunnett’s multiple comparisons test (*p < 0.05) for each cell type. (E) Gap closure assay on collagen-I (donor/IPAH-PASMC n = 3/5, donor/IPAH-PAAF n = 5/6)- or laminin-coated (donor/IPAH-PASMC n = 2/3, donor/IPAH-PAAF n = 6/6) plates. Mean values (presented as % of gap area) over time with standard error mean. (F) Mean gene expression values in p1 cells of integrin subunits functioning as collagen and laminin receptors (GSE255669, Source data 1). (G) Relative expression of integrin subunits in published single-cell transcriptomics dataset of fresh human pulmonary arteries of donors and IPAH patients (GSE210248). (H) Versican gene expression in PASMC stimulated 24 hr with active complement components C3a or C5a (100 ng/ml). (I) Decorin gene expression in PAAF stimulated 24 hr with active complement components C3a or C5a (100 ng/ml). Mann–Whitney test (*p < 0.05).
Figure 6—figure supplement 1
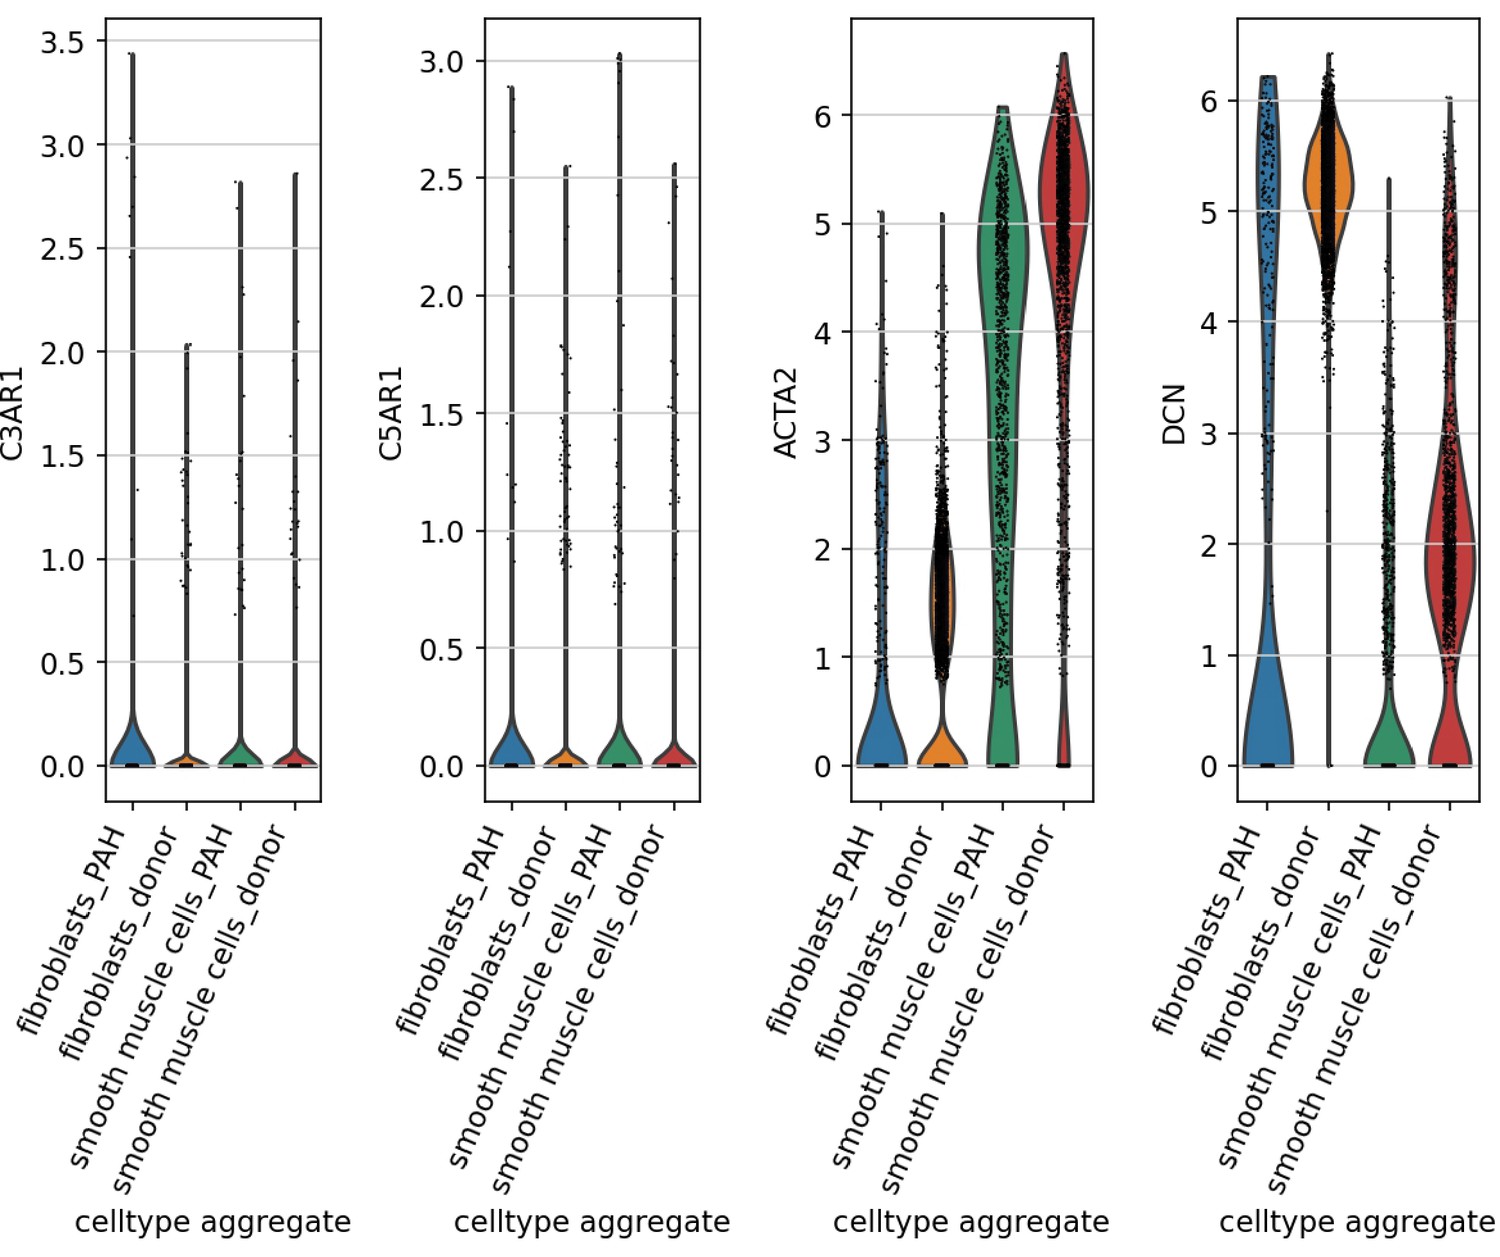
Pulmonary artery smooth muscle cell (PASMC) and pulmonary artery adventitial fibroblast (PAAF) expression of anaphylatoxin receptors.
Violin plots showing the expression of complement component 3a receptor 1 (C3AR1) and complement component 5a receptor 1 (C5AR1) in adventitial fibroblasts and smooth muscle cells clusters, identified by DCN and ACTA2 canonical marker expression, from human pulmonary arteries single-cell RNA-Seq dataset (GSE210248).
Figure 7 with 4 supplements
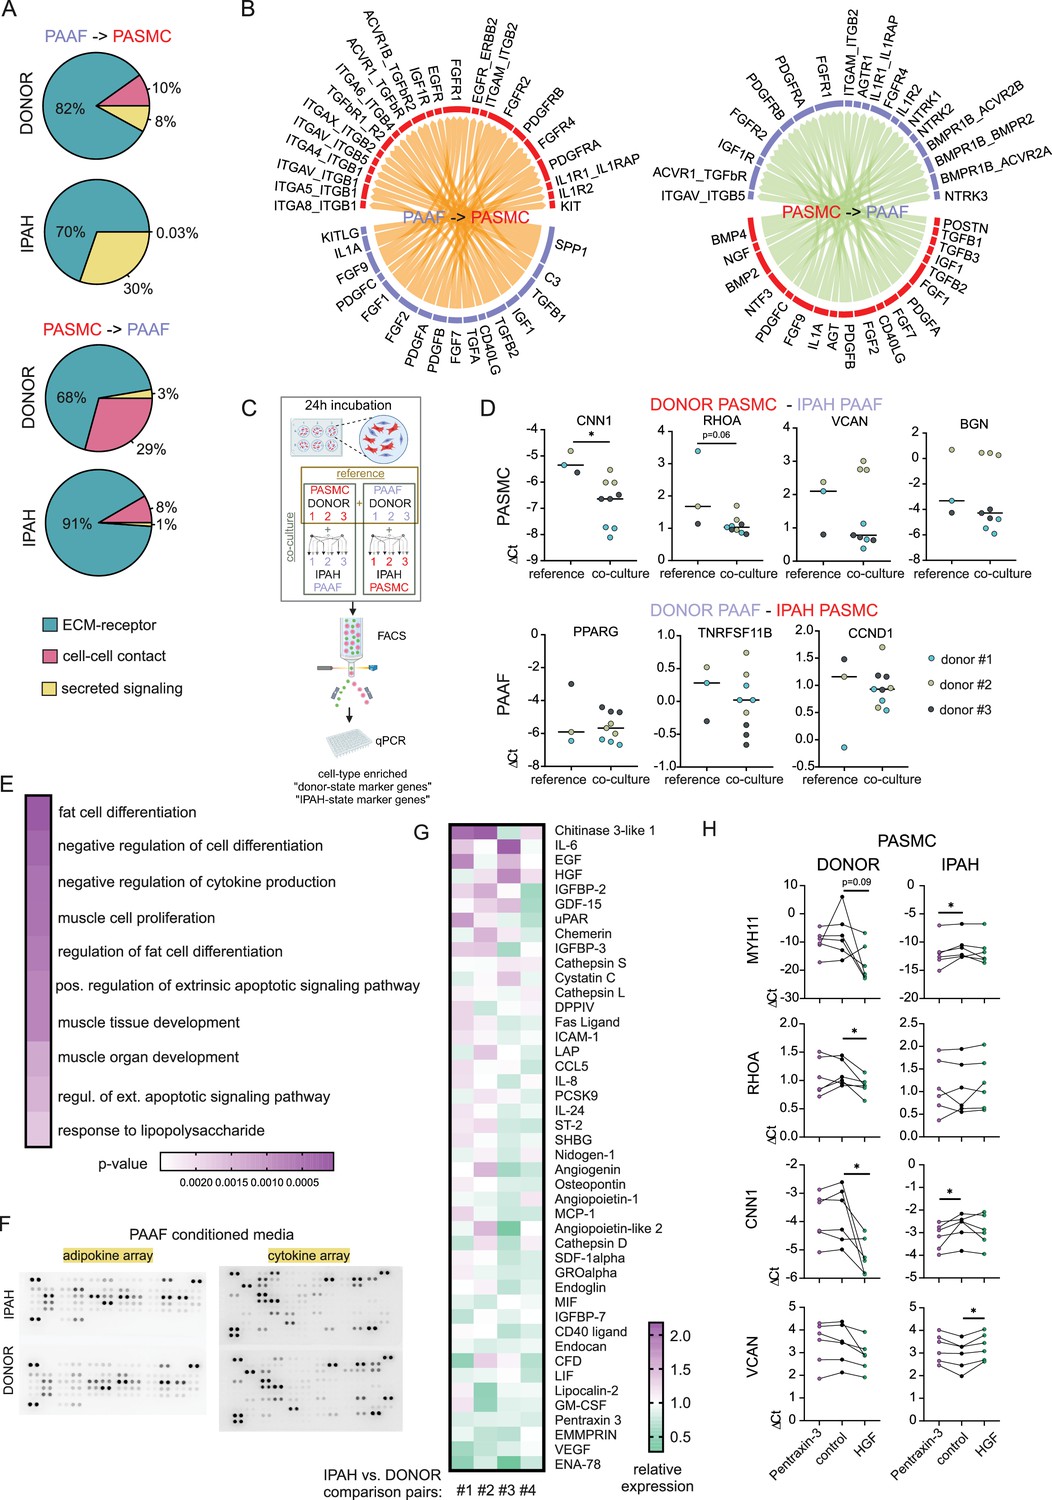
Skewed expression profile of pulmonary artery smooth muscle cell (PASMC)-state markers mediated by idiopathic pulmonary arterial hypertension (IPAH)-dependent changes in pulmonary artery adventitial fibroblast (PAAF) ligands.
(A) Ligand–receptor interaction analysis for PAAF and PASMC based on single-cell RNA sequencing dataset. (B) Circos plot showing consensus soluble ligand and cognate receptor pairs identified by CellChat and NicheNet analysis of PAAF or PASMC as sender (ligand-expressing) cell type. (C) Schematic representation of PASMC–PAAF co-culture experiment to determine the influence of IPAH cells on phenotypic marker expression in donor cells. Created wiht BioRender.com. (D) Gene expression of health (calponin: CNN1, Ras Homolog Family Member A: RHOA, peroxisome proliferator-activated receptor gamma: PPARG, osteoprotegerin: TNRFSF11B) and disease (versican: VCAN, biglycan: BGN, cyclin D1: CCDN1) state phenotypic markers in donor–PASMC (upper row) and donor–PAAF (lower row) following their co-culture with IPAH cells. (E) Top 10 gene ontology biological processes enriched in the set of significantly upregulated genes in donor–PASMC co-cultured with IPAH-PAAF compared to reference (source-matched donor–PAAF). (F) Representative protein array scans determining the content of soluble ligands secreted by donor or IPAH-PAAF over 24 hr in cell culture medium. (G) Heatmap of fold change expression of soluble ligands secreted by IPAH-PAAF compared to donor–PAAF (n = 4 for each condition). (H) Gene expression changes of cell-state markers in donor and IPAH-PASMC (n = 6) treated 24 hr with pentraxin-3 (5 μg/ml) or hepatocyte growth factor (HGF, 25 ng/ml). Smooth muscle myosin heavy chain: MHY11. Friedman test followed by Dunn’s multiple comparisons test (*p < 0.05).
Figure 7—figure supplement 1
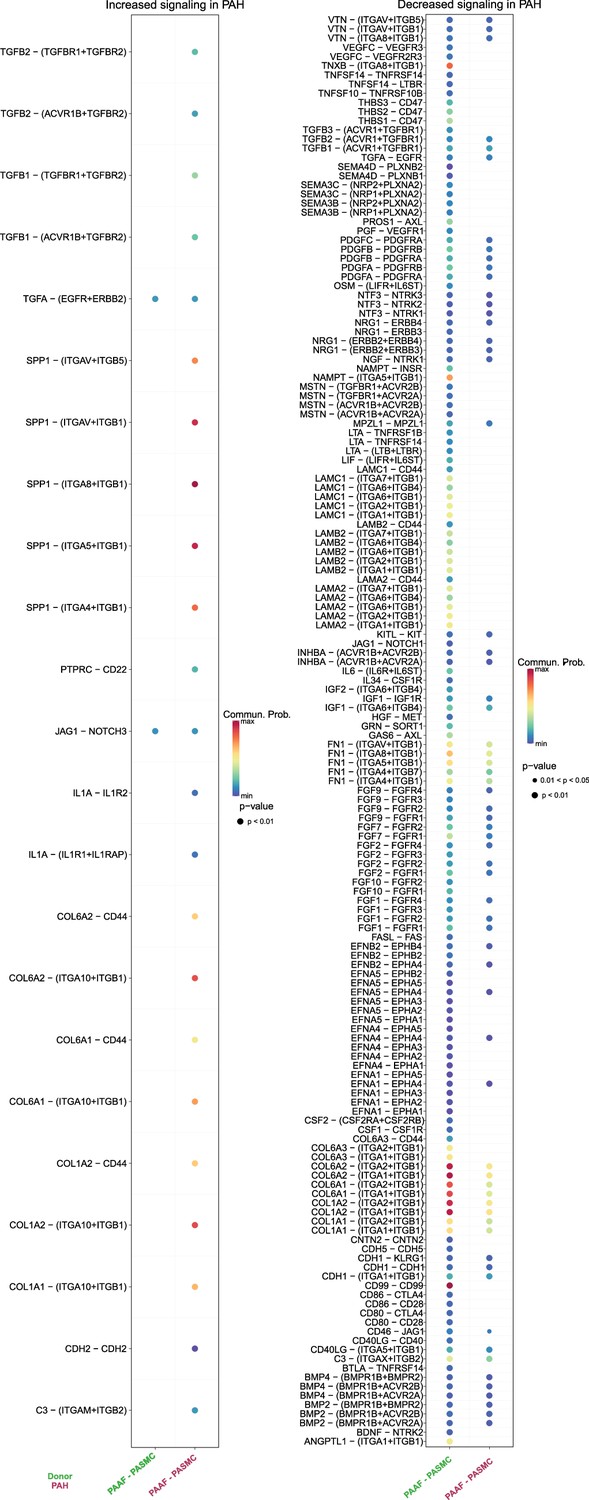
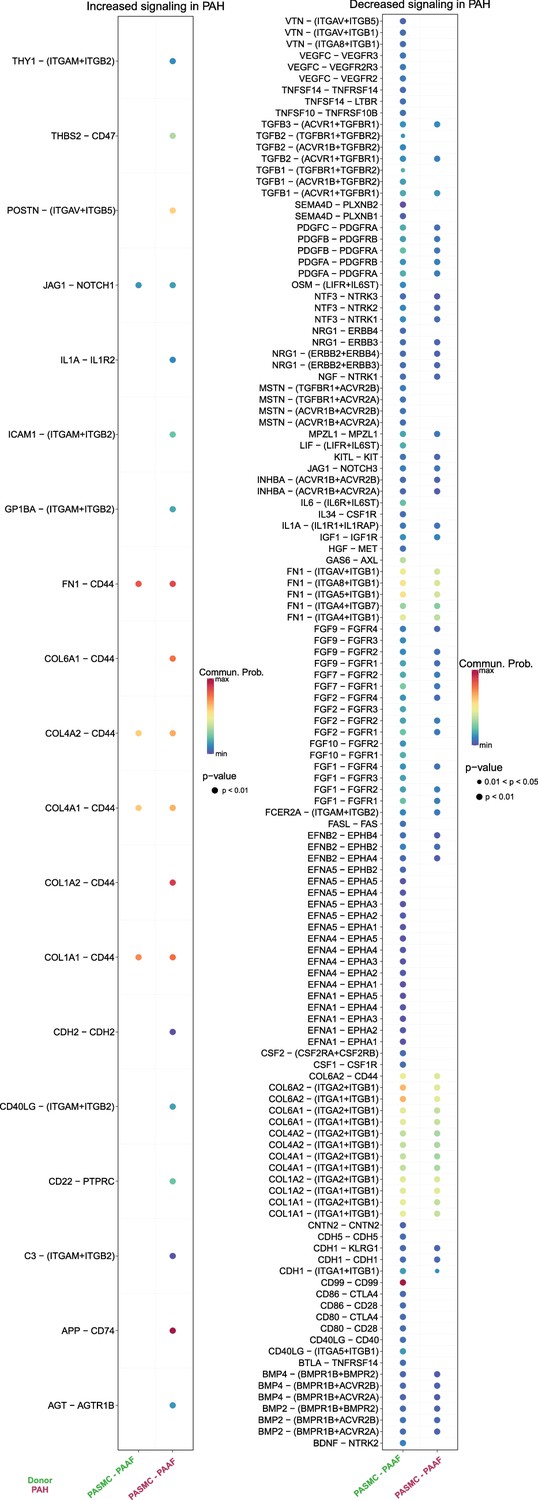
Differential cell–cell communication analysis with pulmonary artery adventitial fibroblast (PAAF) as sender cell type.
A comparison of cell–cell communication in donor and PAH between fibroblasts and smooth muscle cells was performed based on the results from the CellChat analysis. PAAF was set as sender cell type whereas pulmonary artery smooth muscle cell (PASMC) was set as receiver cell type. The two columns on the left side depict the increased signaling interactions and their corresponding ligand–receptor pairs (L–R pairs), the two columns on the right showing decreased signaling and the corresponding L–R pairs. Dot size depicting significance and color representing communication probability.
Figure 7—figure supplement 2
Differential cell–cell communication analysis with pulmonary artery smooth muscle cell (PASMC) as sender cell type.
A comparison of cell–cell communication in donor and PAH between fibroblasts and smooth muscle cells was performed based on the results from the CellChat analysis. Pulmonary artery adventitial fibroblast (PAAF) was set as sender cell type whereas PASMC was set as receiver cell type. The two columns on the left side depict the increased signaling interactions and their corresponding ligand–receptor pairs (L–R pairs), the two columns on the right showing decreased signaling and the corresponding L–R pairs. Dot size depicting significance and color representing communication probability.
Figure 7—figure supplement 3
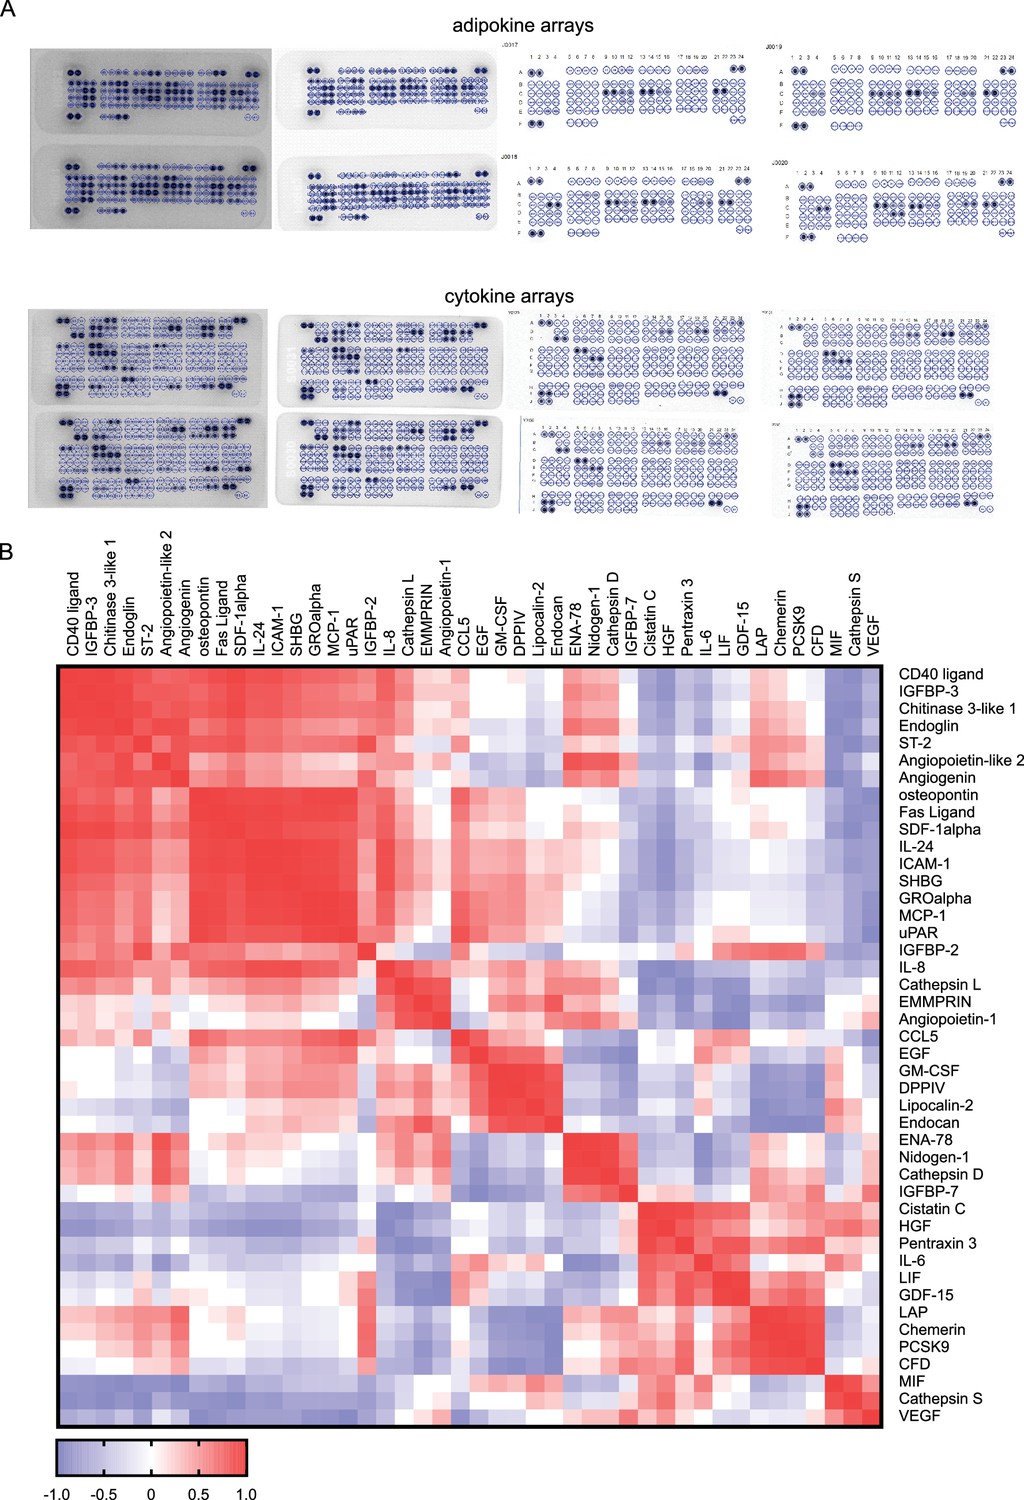
Soluble factor measurements from pulmonary artery adventitial fibroblasts (PAAF) cell culture supernatants.
(A) Proteome Profiler Human XL Cytokine Array Kit (R&D Systems) and Proteome Profiler Human Adipokine Array Kit (R&D Sytems) were used to measure factors secreted by donor and idiopathic pulmonary arterial hypertension (IPAH)-PAAF. (B) Heatmap depicts correlation matrix for soluble factors with pronounced normalized relative expression change between IPAH and donor state. Hierarchically clustering was performed in Clustergrammer.
Figure 7—figure supplement 4
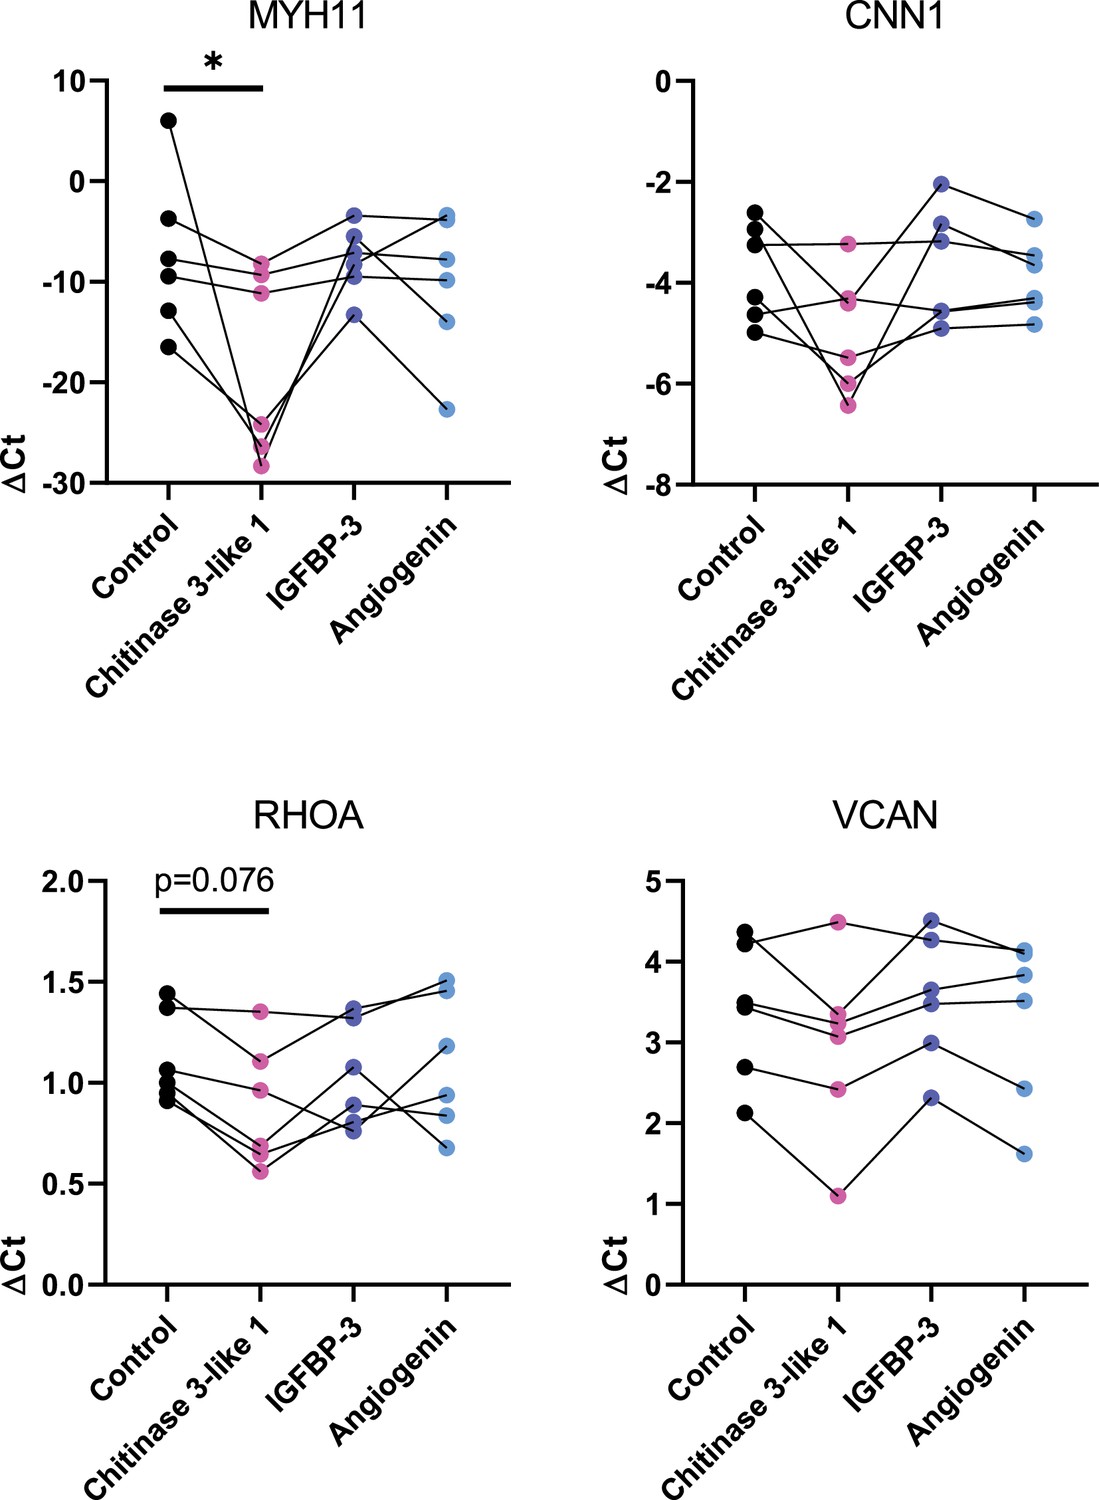
Gene expression profile of pulmonary artery smooth muscle cell (PASMC)-state markers upon stimulation with additional pulmonary artery adventitial fibroblast (PAAF) ligands.
Gene expression changes of cell-state markers in donor–PASMC (n = 6) treated 24 hr with Chitinase 3-like 1 (300 ng/ml), Insulin-like growth factor-binding protein-3 (IGFBP-3, 300 ng/ml), and Angiogenin (300 ng/ml). Calponin: CNN1, Ras Homolog Family Member A: RHOA, Versican: VCAN, Smooth muscle myosin heavy chain: MHY11. Friedman test followed by Dunn’s multiple comparisons test (*p < 0.05).
Additional files
-
Supplementary file 1
Patient characteristics.
Age and sex of healthy controls (donors) and patients with pulmonary vascular disease (IPAH) with corresponding clinical data (mean pulmonary arterial pressure, mPAP, cardiac output) and PAH therapy.
- https://cdn.elifesciences.org/articles/98558/elife-98558-supp1-v1.docx
-
Supplementary file 2
List of antibodies and detection reagents.
- https://cdn.elifesciences.org/articles/98558/elife-98558-supp2-v1.docx
-
Supplementary file 3
List of used primers.
- https://cdn.elifesciences.org/articles/98558/elife-98558-supp3-v1.docx
-
Source data 1
Differential gene expression analysis table in source-matched very early passage PASMC and PAAF from donors and IPAH patients.
- https://cdn.elifesciences.org/articles/98558/elife-98558-data1-v1.xlsx
-
Source data 2
Differential expression analysis of mass spectrometric measurement proteins in source-matched donor and IPAH PASMC and PAAF.
- https://cdn.elifesciences.org/articles/98558/elife-98558-data2-v1.xlsx
-
Source data 3
List of significantly enriched gene ontology biological process terms in donor and IPAH PASMC and PAAF cells in fresh, very early and later passage cells.
- https://cdn.elifesciences.org/articles/98558/elife-98558-data3-v1.xlsx
-
Source data 4
Differential gene expression analysis of donor-PASMC co-cultured with donor-PAAF compared with donor-PASMC co-cultured with IPAH-PAAF.
- https://cdn.elifesciences.org/articles/98558/elife-98558-data4-v1.xlsx
-
MDAR checklist
- https://cdn.elifesciences.org/articles/98558/elife-98558-mdarchecklist1-v1.docx
Download links
A two-part list of links to download the article, or parts of the article, in various formats.
Downloads (link to download the article as PDF)
Open citations (links to open the citations from this article in various online reference manager services)
Cite this article (links to download the citations from this article in formats compatible with various reference manager tools)
Adventitial fibroblasts direct smooth muscle cell-state transition in pulmonary vascular disease
eLife 13:RP98558.
https://doi.org/10.7554/eLife.98558.3


